a reality check for stock valuations · the tools for gauging stock market valuations, such as the...
TRANSCRIPT

Price-to-earnings ratios and other traditional tools can make the market
seem too expensive too soon. By using the real earnings yield to gauge
inflation-adjusted returns, investors can get a more accurate picture of the
market’s value and make better decisions.
November 2017
A R E A L I T Y C H E C K F O R S T O C K V A L U A T I O N S

Committed to meeting our clients’ financial goals, and to earning and sustaining their trust

evercorewealthmanagement.com 1
Table of Contents
Overview .............................................................................................................................................................................................2
Introduction .......................................................................................................................................................................................3
Is The Market Cheap or Expensive? .....................................................................................................................................4
Common Valuation Metrics ......................................................................................................................................................5
Building A Better Market Valuation Measure ................................................................................................................8
A Proper Appreciation of Inflation ....................................................................................................................................10
The “Right Kind” of Low Inflation ....................................................................................................................................... 14
Applying Real Earnings Yields To Real Life ..................................................................................................................15
Real Earnings Yield: An Important Piece of The Puzzle ........................................................................................17
Glossary of Terms ........................................................................................................................................................................18
Notes .................................................................................................................................................................................................. 19
Disclosures ......................................................................................................................................................................................20
Author:John Apruzzese, Chief Investment Officer, Evercore Wealth Management
Key Contributors: Brian Pollak, Wendy Cai
About Evercore Wealth ManagementEvercore Wealth Management is the wealth management division of Evercore (NYSE: EVR) and is an investment adviser registered with the U.S. Securities and Exchange Commission. Founded in 2008, the firm has been named a leading registered investment advisor (RIA)1
and now manages $7 billion (as of September 30, 2017) in assets for families, foundations, and endowments across the United States. Partners at the firm work directly with clients, providing a more personal and modern alternative to big banks and traditional trust companies. Please visit www.evercorewealthmanagement.com for further information or contact the Evercore Wealth Management office near you.

2 November 2017 | A Reality Check for Stock Valuations
Overview
The tools for gauging stock market valuations, such as the price-to-earnings ratio, can send false signals that encourage investors to buy or sell too soon. A market that seems expensive often stays that way for far longer than expected before it finally declines, and likewise an apparently cheap market can get even cheaper before a lasting rally ensues.
The first of these conditions has been playing out for several years. P/E ratios have been high, but they have continued to rise with share prices, reaching levels rarely seen throughout the market’s long history.
Conventional market valuation methods typically fall short because they fail to take inflation into account. We believe that using the real earnings yield to adjust potential returns for inflation can help investors to form a truer picture of the market’s value and make better asset allocation decisions. It offers the prospect of keeping more money in stocks, for longer, during rising markets, and limiting damage from downturns.

evercorewealthmanagement.com 3
yardsticks. Based on the plainest of plain-vanilla standards, the ratio of price to earnings, or P/E ratio, from continuing operations during the previous 12 months, the Standard & Poor’s 500 index was recently 28% overvalued; its trailing P/E ratio was 21.5, compared to an average of 16.8 going back 60 years.2
The index was already somewhat expensive at the end of 2015, trading at 18.8 times earnings, yet prices advanced 25% from there.3 An investor who sold before that leg of the bull market left a lot of money on the table. Stocks rose at a much faster pace than the P/E ratio because while the P in the ratio rose, so did the E. Corporate earnings, which had been fallingfor several quarters, caught a second wind,keeping the market aloft.4
Rising earnings are often responsible for propelling apparently overvalued markets even higher. That has led professionals of all sorts – investment advisers, market strategists, academics – to strive to improve upon the trailing P/E ratio to gauge valuations. Some results of their efforts work better than others, and each has its strengths and weaknesses.
IntroductionEditor’s note: This paper reviews the relative pricing of the overall equity market in the context of broad asset allocations. It is not a commentary on valuations for individual securities or companies.
Knowing what stocks cost is easy in today’s open, transparent markets. Knowing what they’re worth is trickier. Investment professionals always seem to have an opinion, yet those who follow their advice often have little to show for it. They buy or sell at what proves to be the wrong price and time.
There is logic and a consistency to these errors that point the way to better valuation tools. Weak spots of traditional methods include reliance on forecasts of dubious validity, not least because they extend far into an unknowable future, or a limited ability to consider basic yet significant aspects of the macroeconomic backdrop, particularly inflation.
Stocks have experienced one of their longest and strongest bull runs, rising relentlessly for nearly nine years, and more than tripling in price, leaving them expensive by conventional
S&P Total Returns Index Level: 5002.03High on 10/27/17: 5012.75Low on 03/09/09: 1095.04
1000
2000
3000
4000
5000
2007 20102008 2009 2011 2012 2013 2014 2015 2016 2017
SPXT Index (S&P 500 Total Return Index) Daily 10/17/2006 – 11/3/2017
Source: Bloomberg Finance L.P. Calculated intraday by S&P based on the price changes and reinvested dividends of the S&P 500 Index.

4 November 2017 | A Reality Check for Stock Valuations
Is The Market Cheap or Expensive?One school of thought is that the value of stocks can only be judged in relation to that of some other asset competing for the public’s money. This idea is often put into practice by comparing valuations of stocks and Treasury bonds. When the S&P 500 traded at 21.5 times trailing earnings, the 10-year Treasury yielded a miserly 2.33%,making stocks seem reasonably priced tosome Wall Street strategists, despite thehistorically high P/E multiple.
Valuations of the two asset classes can be compared more clearly by flipping the P/E ratio on its head. The resulting figure, E over P, known as the earnings yield, shows the annual earnings being generated, all else being equal, for each dollar invested in stocks. The earnings yield on stocks trading at a 21.5 P/E multiple was 4.7%, double the Treasury yield.
A drawback of this approach is that it ignores the near certainty that Treasury investors will get all their capital back in 10 years, while nothing is guaranteed in the stock market. Bondholders also get all of the coupons a Treasury instrument pays out, while a company only distributes a portion of its earnings as dividends, assuming it pays any at all, and puts the rest into the business in ways that are hoped to be productive – but again, there are no guarantees.
More important, in this day and age of central banks using extraordinary practices to depress bond yields, it might be fairer to say that bonds are more expensive than stocks than that stocks are cheaper than bonds. Jim Reid, a strategist at Deutsche Bank, noted in September that global stocks were more expensive than during nearly 90% of the time going back to 1800, while bonds across global markets had never yielded less.5
“At an aggregate level, an equally weighted bond/equity portfolio has never been more expensive,” Reid wrote.

evercorewealthmanagement.com 5
Common Valuation MetricsThe ratio of stock market capitalization to gross domestic product may seem like a blunt instrument for assessing valuations, but this straightforward technique has some high-profile advocates, notably Warren Buffett. The chairman of Berkshire Hathaway, a man renowned for having an eye for value, has called market capitalization to GDP “probably the best single measure of where valuations stand at any given moment.”6
At this moment, the ratio makes stocks look far from cheap. At 138% of GDP, the market is more expensive than at any time since at least 1971, apart from the weeks surrounding the tech bubble top in early 2000, when the ratio was about 150%.7 Now that over 40% of S&P 500 revenues come from outside the United States and do not count toward U.S. GDP, it is unclear why, with all due respect, Mr. Buffett still references this valuation statistic.
Other market watchers prefer to tweak the traditional P/E ratio by replacing earnings with free cash flow, a measure of the net cash coming into companies in a stock index that is available for distribution to investors. Free cash flow can be seen as a purer and more practical indicator of financial performance, as the number strips out elements like capital expenditure and changes in working capital, as well as accounting contrivances such as depreciation and amortization.
EDUCATED, IF NOT ALWAYS ACCURATE, GUESSES
Trailing P/E ratios are based on where businesses and the economy have been, not where they’re going. Analysts and market strategists try to remedy that shortcoming by factoring earnings growth forecasts into their calculations. This is done either from the top down, by weighing the macroeconomic backdrop and its likely impact on earnings, usually one year ahead, or from the bottom up, by taking averages of the earnings estimates from analysts who follow each of the companies in an index and then adding them together.
The result, known as the forward P/E ratio, eliminates the use of stale earnings data that can render the trailing P/E less effective, but can also add a new problem: The forward P/E is only as good as the earnings estimates that go into it and bottom estimates can be meaningfully higher than the top-down variety.
For example, at the end of September 2017, the aggregate bottom-up estimate for the S&P 500 companies’ operating earnings in the 12 months through next September was $142.08, and the top-down estimate was $138.79.8 These forecasts produce forward P/E ratios of 17.7 and 18.2, respectively.

6 November 2017 | A Reality Check for Stock Valuations
Other valuation techniques involve more intricate arithmetic than is used in calculating forward P/E ratio and look further into the future. Dividend discount models, for example, estimate the total of all dividends a company will pay as long as it’s in business. Once the lifetime dividend estimate is determined, the present value of those dividends is discounted by an expected rate of return, which includes a risk-free annual rate, typically the yield on 10-year Treasury bonds, plus an equity risk premium or a safe short-term instrument, such as three-month Treasury bills, to take account of the time value of money.
Discounted cash flow models are a variation on this theme. They discount the projected sum of all net cash flows instead of dividends. The basic idea is the same, though, because dividends are paid out of cash flows, so the two types of calculations are likely to produce similar conclusions. Under either procedure, a stock or index is deemed a bargain if its trading price is less than the present value of all future dividends or cash flows, as the case may be.
A particularly dynamic and valuation technique calculates the so-called PEG ratio, which encompasses elements of the P/E multiple and the measurement of long-term earnings growth. The PEG ratio divides the trailing P/E by a forecast of annual earnings growth over the next five years.
As with P/E multiples, a lower PEG ratio suggests better value, for it can be achieved either with a lower P/E ratio, higher earnings growth, or a combination of those factors. One difference from many valuation measures is that PEG ratios are more likely to be used for single companies or industries and seldom for the broad market.
A lot can happen to invalidate a one-year forecast, but five years, let alone forever, is a much longer time. It seems to be getting even longer these days, as rapidly evolving technologies, deregulation of industries, and minimally fettered global trade and competition accelerate the pace of change and make the distant future ever murkier. Unless Nostradamus has taken a job on Wall Street, any very long-term forecast must be viewed with circumspection.

evercorewealthmanagement.com 7
One of the most popular valuation metrics, Cyclically Adjusted Price Earnings, prefers to look far into the past. Also known as the Shiller P/E or CAPE/Shiller, for Robert Shiller, the Yale School of Management Nobel laureate economist who developed it, this technique divides price by an average of real, or inflation-adjusted, earnings from the last 10 years.
The point of using 10 years of earnings data is to include a full economic cycle and eliminate the distorting effects of calculating valuation using earnings from a period of extremely strong or weak, yet transitory, operating conditions. The inflation adjustment takes into account the possibility that the raw dollar amount of an earnings figure will lose its meaning after several years as the dollar’s purchasing power erodes.
The Shiller P/E ratio is widely used by investment advisers because it works especially well as a tool for anticipating long-term returns. Many strategists in recent months have advised caution as the Shiller P/E has climbed above 30, a level otherwise observed only for brief periods surrounding the 1929 and 2000 market peaks.9 The chief shortcoming of the measure is that it is often a poor timing tool, foretelling turns in the market far too soon to allow investors to benefit fully from or avoid extant trends. Business cycles have also been getting much longer, so 10 years may not be long enough to incorporate an entire cycle. In two years, the very poor earnings years of 2008 and 2009 will drop off of the 10-year average earnings number, causing the earnings number to considerably increase and the apparent P/E ratio to fall.

8 November 2017 | A Reality Check for Stock Valuations
Building A Better Valuation MeasureThese popular methods have their pluses and minuses. Most are useful for assessing whether stocks are a bargain, overpriced, or something in between in a broad, basic – though not necessarily timely – way. Theyare often out of step with market trends,and there is certainly room for improvementfor each of them. Perhaps that improvementcan come from cherry-picking their bestfeatures.
In particular, there is much to recommend flipping the numerator and divisor of the P/E ratio and using the earnings yield to emphasize expected returns, and adopting a mechanism to adjust for the erosion of the value of money over time, as the Shiller P/E ratio, discounted cash flow and dividend discount models do. Assembling those elements into an inflation-adjusted earnings yield may provide a valuation tool that permits sharper assessments of risk and reward potential, and therefore more accurate and timely investment decisions.
Intuition and common sense suggest a higher inflation rate will reduce the appeal of stocks and lead investors to require them to trade at cheaper valuations before buying them. There are two main reasons: The purchasing power, or constant-dollar value, of earnings and dividends generated during periods of high inflation will diminish over time at a faster pace, and the comparative value of alternative investments, from shorter-term bonds and bank deposits to hard assets such as real estate and commodities, will increase.
By contrast, a lower inflation rate should persuade investors to pay more for stocks, not just because earnings and dividends will hold their value better and other investments will be less attractive, but also because a low-inflation environment typically is the most fruitful one in which to conduct business.
All of this is just supposition, of course. The validity of any valuation method that adjusts for inflation will have to be verified by back testing and then by confirming that it produces better investment decisions in the future.
evercorewealthmanagement.com 9
KEEPING IT SIMPLE – MAYBE TOO SIMPLE
Some quick and easy rules of thumb for adjusting valuations for inflation have been proposed, but they have not caught on widely.
• Rule of 20. This handy rubric essentiallydefines fair value for the S&P 500 as aP/E ratio – either trailing or forward, takeyour choice – of 20 minus the increase inthe consumer price index, or CPI, over theprevious 12 months. Based on the 3.7%average annual increase in core CPI, whichexcludes the volatile components of foodand energy, since 1957 the average fairvalue would be about 16.3, broadly in linewith the historical average trailing P/Eratio.10 Factoring in a core CPI increase of1.7% in the 12 months through September,fair value under the Rule of 20 is 18.3 timesearnings, about the same as the S&P’sforward P/E ratio but somewhat below thetrailing P/E ratio.11
• Rule of 24. This wrinkle adds theunemployment rate into the mix. Fairvalue is defined as a P/E ratio of 24 minusthe so-called Misery Index, which combinesthe unemployment and inflation rates.Fair value based on a 2.2% inflationrate and 4.2% unemployment is 18.1,or 24 – (4.2 + 1.7).12
These rules have catchy titles, and adherents are on to something with their emphasis on integrating critical economic indicators into the valuation process. But they may not go far enough. At low inflation levels, each percentage point by which the CPI growth rate increases will reduce fair value for stocks by just five percent or so under the Rule of 20.
Say inflation has been running at two percent, much as it has been lately. An increase to four percent would take fair value on stocks from 18 times earnings to 16, but it’s difficult to imagine such a muted reaction to that great a jump in inflation. By contrast, fair value would drop by the same proportion, from nine to eight, if inflation rose from 11% to 12%, even though the markets probably would judge such a move as far less significant than a doubling of inflation in a low-inflation environment.
10 November 2017 | A Reality Check for Stock Valuations
A Proper Appreciation of InflationIn valuing the market, a more conceptually and mathematically rigorous adjustment that takes full account of inflation would start with the earnings yield instead of the P/E ratio and subtract the inflation rate. This calculation, creating the real earnings yield, or REY, is similar to adjustments made to gauge the underlying changes to certain economic indicators, such as GDP growth, as well as investment returns, for which figures are all but meaningless, especially over the long haul, if the erosion of the value of money is not factored in.
Unlike the inflation tweak used in the rules of thumb, REY provides a full adjustment for inflation, without the distortion that results from subtracting the same change in inflation from different starting rates and therefore different fair values. REY will rise or fall by one percentage point with each decline or increase, respectively, in the inflation rate, no matter what the starting levels of inflation or the nominal earnings yield may be, providing a more accurate assessment of potential returns.
The inflation measure used in figuring REY is simply the latest year-over-year change in the CPI. A benchmark interest rate could be used as a proxy for inflation, but the results might be less precise and reliable because interest rates are based on several factors, inflation being just one.
THE EXCEPTIONS THAT PROVE THE RULE
Using REY to determine valuations seems like a logical idea, but does it work? Does a valuation tool based on the real earnings yield offer value to investors in the real world?
One sign that it’s a valid indicator would be if it were to make stocks appear more reasonably priced than the conventional P/E ratio during periods of low inflation and rising markets, and more expensive during periods of high inflation and falling markets when they otherwise might seem cheap. Two periods that fit the bill and serve as a testing ground are, respectively, the nearly nine years since the end of the financial crisis and the decade that began roughly in the early 1970s.
For those who are fortunate enough not to remember the ’70s, it was an awful time, and not just because of disco and platform shoes. Investors had to cope with a series of developments that sent inflation soaring, including the breakdown of the postwar Bretton Woods currency management system, continual tension and conflict in the Middle East that sent oil prices soaring, as well as general economic mismanagement in response to those factors from the Ford and Carter administrations.13
Inflation was finally subdued in the early 1980s when the Federal Reserve, under Paul Volcker, engineered a recession through a rapid series of interest rate hikes. Inflation and interest rates then declined just as rapidly, paving the way for two decades of prosperity.14
evercorewealthmanagement.com 11
The period between 1973 and 1982 featured three recessions and two crippling bear markets, but stocks were cheap by conventional measures, spending much of that time with single-digit P/E multiples. It was the mirror image of the last nine years: Stocks have soared and investors have flourished, despite P/E ratios that, after the first few years, have been well above average.
Investors who rely on P/E ratios might have spent the 1970s fully invested in stocks, and the 2010s outside the market, looking in and cursing their luck. If they had assessed valuations based on real earnings yields, they might have made different choices and experienced greatly different results.
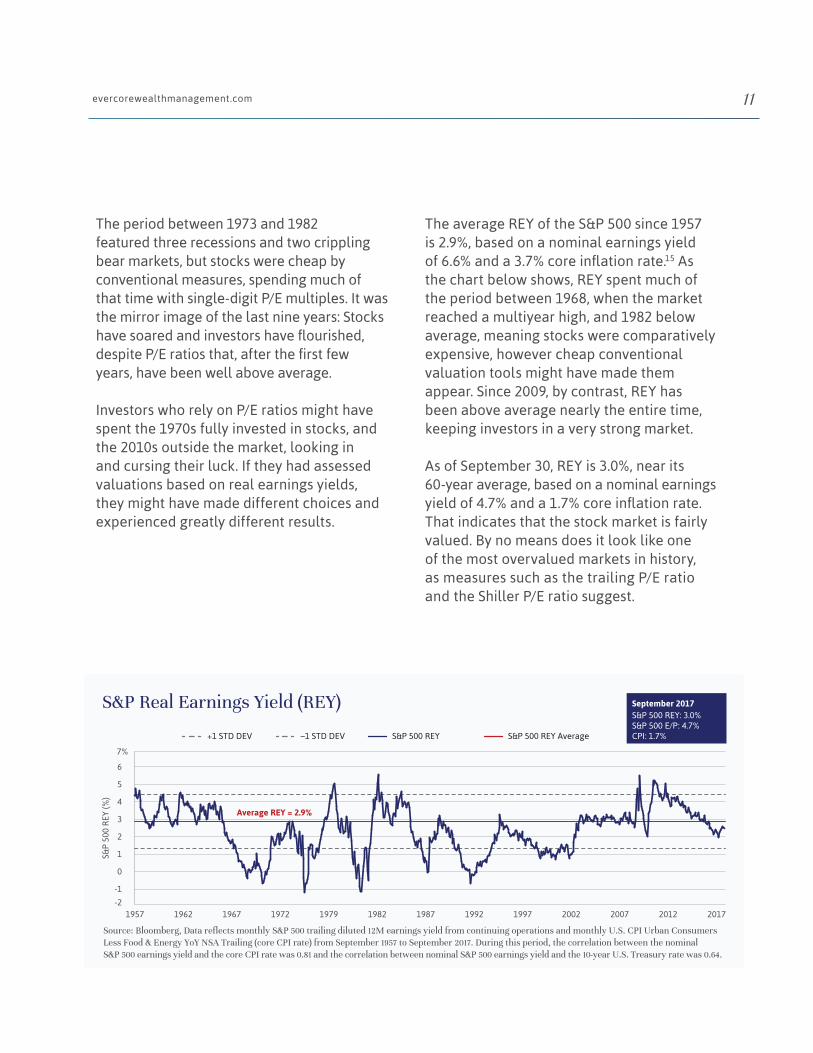
The average REY of the S&P 500 since 1957 is 2.9%, based on a nominal earnings yield of 6.6% and a 3.7% core inflation rate.15 As the chart below shows, REY spent much of the period between 1968, when the market reached a multiyear high, and 1982 below average, meaning stocks were comparatively expensive, however cheap conventional valuation tools might have made them appear. Since 2009, by contrast, REY has been above average nearly the entire time, keeping investors in a very strong market.
As of September 30, REY is 3.0%, near its 60-year average, based on a nominal earnings yield of 4.7% and a 1.7% core inflation rate. That indicates that the stock market is fairly valued. By no means does it look like one of the most overvalued markets in history, as measures such as the trailing P/E ratio and the Shiller P/E ratio suggest.
S&P
500
REY
(%)
S&P Real Earnings Yield (REY) September 2017S&P 500 REY: 3.0%S&P 500 E/P: 4.7%CPI: 1.7%S&P 500 REY+1 STD DEV –1 STD DEV S&P 500 REY Average
7%
6
5
4
3
2
1
0
-1
-2
Average REY = 2.9%
1957 1962 1967 1972 1979 1982 1987 1992 1997 2002 2007 2012 2017
Source: Bloomberg, Data reflects monthly S&P 500 trailing diluted 12M earnings yield from continuing operations and monthly U.S. CPI Urban Consumers Less Food & Energy YoY NSA Trailing (core CPI rate) from September 1957 to September 2017. During this period, the correlation between the nominal S&P 500 earnings yield and the core CPI rate was 0.81 and the correlation between nominal S&P 500 earnings yield and the 10-year U.S. Treasury rate was 0.64.

12 November 2017 | A Reality Check for Stock Valuations
STABLE PRICES – FOR NOW
Although the most recent annual change in the CPI is used to calculate the real earnings yield, with no forecasting required, forecasts still can be useful. Another lesson from the ’70s is that investors and the advisers who look after their money must be ever vigilant for signs that a period of stable, low inflation may come to a sudden end. The cause can be some exogenous shock, such as soaring oil prices, or an ordinary economic cycle that gets out of hand.
It’s important to be on the lookout for substantially lower inflation, too. A significant drawback of using real earnings yields to calculate valuations is that the relationship between share prices and consumer prices will almost certainly break down in a period of deflation that occurs in the context of a recession or other economic upheaval.
Such conditions haven’t occurred in the United States over an extended period since the 1930s, but they existed for several years in Europe recently when the global financial crisis gave way to a more localized credit crunch centered on Greece and other weaker peripheral economies. In Japan, meanwhile, deflation has remained a threat for the last 30 years and a reality for much of that time.
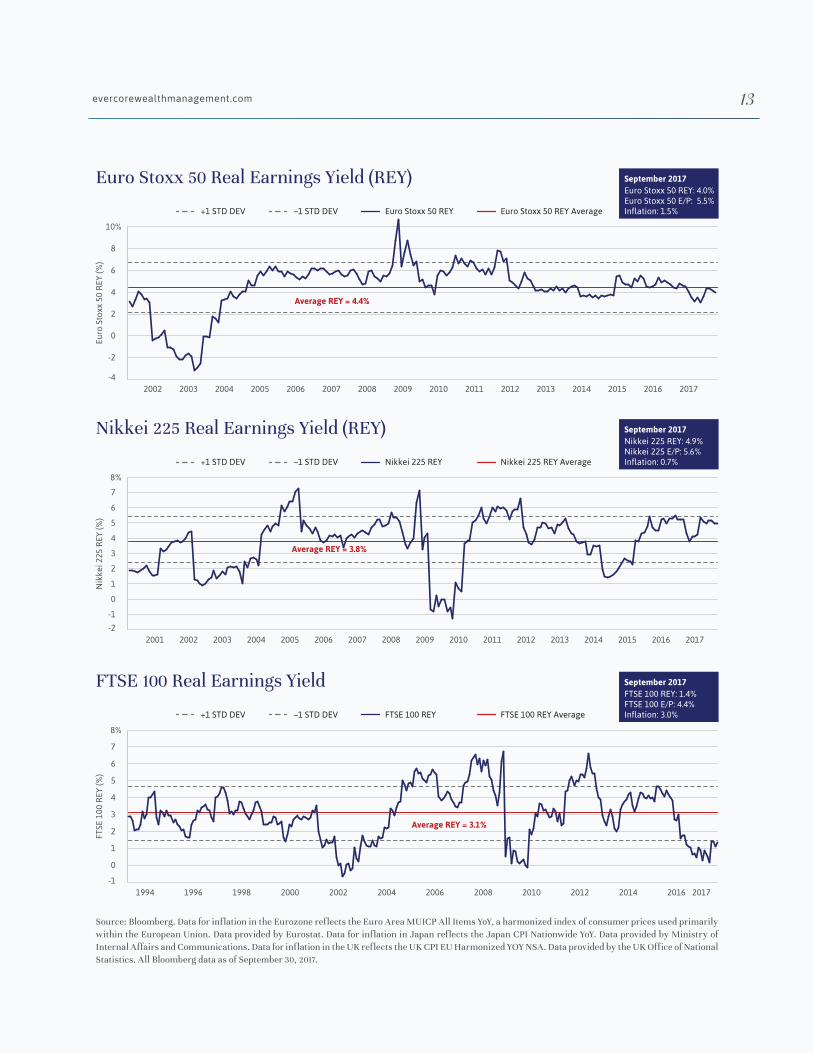
European and Japanese real earnings yields since the early 2000s, at 4.4% and 3.8%, respectively, have been higher than those for American stocks, mainly due to the very low and sometimes negative inflation rates and slower economic growth, which has led to little or no earnings growth (as the top two
charts on page 13 show).16, 17 As a result, those markets have generated markedly lower returns.18 The lower valuation levels have not been enough to overcome the inferior fundamentals.
Eurozone REY remained above average, meaning that stocks appeared fairly valued or cheap, through most of the savage bear market during the Great Recession, falling below average only a few months before stocks turned higher in early 2009. After dipping below average for several months, REY was then unambiguously above average until late 2011, when stocks were flat. Since then, REY has hovered around the longer-term average as stocks have soared due to an acceleration of earnings growth and strengthening economic growth.
REY has not been a reliable indication of value in Japan because of persistent deflation. Deflation, especially when accompanied with zero or negative economic growth as in the case of Japan, calls for lower valuations – not higher. It has been a better valuation tool for stocks in Britain, where the economy has sidestepped the negative anti-inflationary trends experienced elsewhere in Europe (refer to the FTSE 100 Real Earnings Yield chart on page 13.). REY fell below average sooner during the steep 2008 decline than it did for the Eurozone. And after several years mostly above average, it has been below the line since early 2015, a period that has featured a nearly 20% decline and only modest net gains.
evercorewealthmanagement.com 13FT
SE 1
00 R
EY (%
)
FTSE 100 Real Earnings Yield September 2017FTSE 100 REY: 1.4%FTSE 100 E/P: 4.4%Inflation: 3.0%FTSE 100 REY+1 STD DEV –1 STD DEV FTSE 100 REY Average
8%
6
5
4
3
2
1
0
7
-1
Average REY = 3.1%
19961994 2004200220001998 2006 2008 2010 2012 2014 2016 2017
Nik
kei 2
25 R
EY (%
)
Nikkei 225 Real Earnings Yield (REY) September 2017Nikkei 225 REY: 4.9%Nikkei 225 E/P: 5.6%Inflation: 0.7%Nikkei 225 REY+1 STD DEV –1 STD DEV Nikkei 225 REY Average
8%
6
5
4
3
2
1
0
7
-1
-2
Average REY = 3.8%
2001 2005200420032002 2006 2007 2008 2009 2010 2011 2012 2013 2014 2015 2016 2017
Euro
Sto
xx 5
0 R
EY (%
)
Euro Stoxx 50 Real Earnings Yield (REY) September 2017Euro Stoxx 50 REY: 4.0%Euro Stoxx 50 E/P: 5.5%Inflation: 1.5%Euro Stoxx 50 REY+1 STD DEV –1 STD DEV Euro Stoxx 50 REY Average
10%
6
4
2
0
8
-2
-4
Average REY = 4.4%
2002 200520042003 2006 2007 2008 2009 2010 2011 2012 2013 2014 2015 2016 2017
Source: Bloomberg. Data for inflation in the Eurozone reflects the Euro Area MUICP All Items YoY, a harmonized index of consumer prices used primarily within the European Union. Data provided by Eurostat. Data for inflation in Japan reflects the Japan CPI Nationwide YoY. Data provided by Ministry of Internal Affairs and Communications. Data for inflation in the UK reflects the UK CPI EU Harmonized YOY NSA. Data provided by the UK Office of National Statistics. All Bloomberg data as of September 30, 2017.

14 November 2017 | A Reality Check for Stock Valuations
Consumer prices can be suppressed for benign reasons, too, and this has happened worldwide over the last 20 years or so, as the latest technological marvels and industrial and commercial advances have worked their way into the economy. As long as those conditions persist – and the negative kind of disinflationary forces don’t gain a foothold – they will elevate real earnings yields. Nothing lasts forever, of course, particularly economic developments. Still, there are sound reasons to anticipate a continuation of some longstanding, positive disinflationary trends for the foreseeable future. These include:
• Technology-driven productivity. Thosemarvels just keep coming, creating whatmight be called the Amazon Effect today.A generation ago it might have been calledthe Intel Effect, and the next generation ofcompanies, and whole industries, that arelikely to boost economic efficiency, such asthree-dimensional printing, robotics anddriverless cars, can already be glimpsedover the horizon.
• Global trade and competition. Improvementsin transportation, communication and logisticsgive consumers greater choice and qualitythan ever. They can buy goods and servicesfrom companies down the street, across thecountry or on the other side of the world.Those companies, in turn, have the samechoices when it comes to their suppliers. Thaterodes pricing power and forces businesses tobring their A game or die trying.
• Demographics. Aging demographics in mostof the developed world exert downwardpressure on the size of the labor force.Shrinking labor force participation ratescreate both a short- and medium-term dragon inflation.
• Deregulation. There are several catalystsfor the globalization trend, includingbetter technology and logistics. Anotheris the widespread adoption of free-marketprinciples, most notably the privatizationand deregulation of industries, in countriesthat had been unable or unwilling to trythem. Many are emerging economies – that,indeed, is what is helping them to emerge.
An indication of the robustness of the forces holding inflation down is that conditions that should prop it up seem to be having little impact. The most obvious examples are the creation of trillions of dollars out of thin air by central banks around the world and the stagnation of work forces in the United States and Europe.19, 20 The tightening of labor markets would be expected to drive up wages, but that’s not happening to any great degree. Given these circumstances, it’s no wonder that CPI growth remains around two percent a year, keeping the real earnings yield on stocks higher than it would be if inflation were closer to its long-run average.
The “Right Kind” of Low Inflation

evercorewealthmanagement.com 15
As the fourth quarter rolls along, Wall Street is factoring stock market valuations into investment decisions with an approach that amounts to two wrongs making a right. At least that’s how it might seem to anyone who has developed an appreciation for the influence of inflation on share prices. By any of the more widely followed valuation measures, the market is demonstrably overvalued, yet the public is ignoring the warnings from those metrics and remaining fully invested. Global fund managers in one recent survey were a net 45% overweight in equities, on average, close to the highest reading in more than two years. Whether they realize it or not – probably not – their allocation is more in line with the message being sent by the real earnings yield, which shows valuations to be almost exactly at the historical average.
What should investors do when valuations are not average – when the real earnings yield indicates that stocks are undervalued or overvalued? The answer depends on the degree of deviation from fair value. The impulse to rebalance a portfolio, selling more expensive assets and putting the proceeds into cheaper ones, is a good one, but only if it’s done sparingly. An asset allocation system that is too sensitive creates the risk of portfolio churn and the higher trading costs and tax bills, not to mention greater opportunity to make poor trading decisions, that go with it. Stock prices can undergo wide swings around fair value, by whatever measure is used to gauge it, often spending long periods significantly above or below the line. Selling as soon as stocks become modestly overvalued often means missing out on substantial further gains, and if by luck or skill an investor gets the timing right, he or she may not achieve a similar result when timing the next move, after stocks dip below fair value.
Applying Real Earnings Yields To Real Life

16 November 2017 | A Reality Check for Stock Valuations
It’s best to examine the impact of market valuation changes in the context of time, not timing. Investors who own assets for the long haul, say 10 years, as opposed to traders or speculators with shorter attention spans, can be fairly sure that their stock portfolios will revert to fair value – and that REY will revert to its long-term average – at some point during that holding period. That point may occur in eight years or possibly the day after tomorrow; no one can know exactly when.
A significant rebalancing should be considered only when anticipated long-term returns, which are what REY measures, are well above or below average. Precise levels will be different for each investor and are best defined in advance with the help of an independent professional adviser, although some flexibility should be maintained, as expected returns from stocks must also be weighed against those available from other assets.
This process highlights yet another advantage of using REY instead of P/E ratios: The latter encourage viewing the stock market as being overvalued or undervalued by a certain percentage. That creates a tendency to assume that the market will snap back to fair value, quickly rising or falling by that percentage, a prospect that can foster shortsightedness and persuade investors to take drastic action to try to front-run the event. The REY calculation presents any deviation from fair value as the impact on the market’s rate of return, something that is more natural to contemplate as a longer-term proposition.

evercorewealthmanagement.com 17
Since March of 2009, the stock market has experienced one of its longest advances ever and racked up impressive gains. It is certainly not the bargain it was when the financial crisis and recession were beginning to abate. The market may be overvalued by many metrics, and corrections and bear markets can occur even when valuations appear more reasonable. That means caution is warranted, but an understanding of the interplay between stock market returns and inflation suggests that stocks are not as expensive as is widely believed and that alarm would be counterproductive. By factoring real earnings yields into their thinking, investors can make more accurate, reliable estimates of the value of their portfolios relative to corporate earnings and history, and to other assets that they own or might consider buying. That’s an important element of achieving financial success and meeting long-range goals, but it’s not the only one.
Taking a disciplined approach to saving – salting away as much and as often as possible, and in a tax-efficient manner – and maintaining a well-diversified portfolio that dovetails with personal and family circumstances and risk tolerances are also essential. And when the market signals that stocks are sufficiently cheap or expensive to warrant a change in allocation, it should be done prudently and dispassionately.
That means ignoring facile arguments in the media meant to persuade the public to take one course or another and, perhaps more important, ignoring the voices of greed and fear that lurk within each of us. Instead, investors should rely on the same sound reasoning that they put into their valuation assessments in the first place.
Real Earnings Yield: An Important Piece of The Puzzle

18 November 2017 | A Reality Check for Stock Valuations
Glossary of TermsCentral banks: The national institutions that control the production and distribution of money and credit. They are responsible for the formulation of monetary policy and the regulation of member banks.
Coupon: The annual interest rate payment on a bond, typically expressed as a percentage of the nominal value of the security.
Expected rate of return: The anticipated gain or loss on an investment over a specified time period, expressed as a percentage of the investment’s cost.
Dividend discount models: A valuation procedure that uses predicted dividends and discounts them back to the present value. If the resulting value is higher than current trading values, then the stock is undervalued.
Earnings yield: The percentage of each dollar invested in the stock that was earned by the company. This is the inverse of the P/E ratio, which refers to the earnings per share for the most recent 12-month period divided by the current market price per share.
Inflation: The rate at which the general level of prices for goods and services is rising, which causes the purchasing power of currency to fall.
Market capitalization: The market value of outstanding shares, calculated by multiplying the stock price/s by the total number of shares outstanding.
Negative real interest rates: A negative interest rate means the central bank and perhaps private banks will charge negative interest – instead of receiving money on deposits, depositors must pay regularly to keep their money with the bank.
Price-to-earnings ratio (P/E ratio): The ratio that measures the value of a company and is calculated as market value per share divided by earnings per share (EPS).
Trailing P/E: This ratio is calculated by taking the current stock price and dividing it by the trailing EPS for the past 12 months. Refer to P/E ratio defined above.
Yield: The expected or known income return on an investment, such as the interest or dividends received from holding a particular security. It is expressed as a percentage of the investment’s cost or current market value.21
Source: Investopedia

evercorewealthmanagement.com 19
Notes1 Barron’s The Top 30 RIA Firms 2017. http://si.wsj.net/public/resources/images/ON-CG830_top30t_16U_20170915203148.jpg. 2 Bloomberg. Data as of Sept. 30, 2017.3 Bloomberg.4 Multpl.com. Data as of March 31, 2017. http://www.multpl.com/s-p-500-earnings/table.5 Deutsche Bank Market Research, “Long-Term Asset Return Study: The Next Financial Crisis,” Sept. 18, 2017.6 Fortune, Dec. 10, 2001. http://archive.fortune.com/magazines/fortune/fortune_archive/2001/12/10/314691/index.htm.7 GuruFocus.com. Data as of Oct. 11, 2017. https://www.gurufocus.com/stock-market-valuations.php.8 FactSet Research.9 Yale School of Management. Data as of Oct. 11, 2017. http://www.econ.yale.edu/~shiller/data.htm.10 Bloomberg. Data as of Sept. 30, 2017.11 U.S. Bureau of Labor Statistics. Data as of September 30, 2017. https://www.bls.gov/news.release/cpi.nr0.htm.12 U.S. Bureau of Labor Statistics. Data as of September 30, 2017. https://www.bls.gov/news.release/empsit.nr0.htm.13 WTRG Economics. http://www.wtrg.com/oil_graphs/oilprice1947.gif.14 Federal Reserve Bank of St. Louis. https://fred.stlouisfed.org/graph/?id=FF.15 Bloomberg.16 Eurostat, via TradingEconomics.com. https://tradingeconomics.com/euro-area/inflation-cpi.17 Japanese Ministry of Internal Affairs & Communications, via TradingEconomics.com.
https://tradingeconomics.com/japan/inflation-cpi.18 MSCI. Data as of Oct. 11, 2017. https://www.msci.com/end-of-day-data-search.19 Haver Analytics, via Yardeni Research. https://www.yardeni.com/pub/peacockfedecbassets.pdf.20 Federal Reserve Bank of St. Louis, Eurostat.21 BofA Merrill Lynch Global Fund Manager Survey. Data as of Oct. 12, 2017.
About the AuthorJohn Apruzzese is the Chief Investment Officer of Evercore Wealth Management, responsible for the national firm’s market outlook and asset allocation policy.
Prior to joining Evercore Wealth Management in 2008, John worked at U.S. Trust, where he was responsible for managing $2 billion of client assets. He joined U.S. Trust in 1984 after serving on the staff of the U.S. Senate Labor and Human Resources Committee and working on federal budget matters.
John received his B.A. from Bucknell University in 1980, an M.B.A. from New York University in 1984, and holds the Chartered Financial Analyst designation. He is a former member of the Board of the New York Society of Security Analysts.

20 November 2017 | A Reality Check for Stock Valuations
DisclosuresEvercore Wealth Management, LLC (“EWM”) is an investment adviser registered with the U.S. Securities and Exchange Commission under the Investment Advisers Act of 1940. EWM prepared this material for informational purposes only and should not be viewed as advice or recommendations with respect to asset allocation or any particular investment. It is not our intention to state or imply in any manner that past results are an indication of future performance. Future results cannot be guaranteed and a loss of principal may occur. This material does not constitute financial, investment, accounting, tax or legal advice. It does not constitute an offer to buy or sell or a solicitation of any offer to buy or sell any security/instrument, or to participate in any trading strategy. The securities/instruments discussed in this material may not be suitable for all investors. The appropriateness of a particular investment or strategy will depend on an investor’s individual circumstances and objectives. Specific needs of a client must be reviewed and assessed before determining the proper investment objective and asset allocation, which may be adjusted to market circumstances. EWM may make investment decisions for its clients that are different from or inconsistent with the analysis in this report. EWM clients may invest in categories of securities or other instruments not covered in this report. Descriptions provided in this material are not substitutes for disclosure in offering documents for particular investment products. Any specific holdings discussed do not represent all of the securities purchased, sold or recommended by EWM, and the reader should not assume that investments in the companies identified and discussed were or will be profitable. Upon request, we will furnish a list of all securities recommended to clients during the past year. Performance results for individual accounts may vary due to the timing of investments, additions/withdrawals, length of relationship, and size of positions, among other reasons. Prospective investors should perform their own investigation and evaluation of investment options, should ask EWM for additional information if needed, and should consult their own attorney and other advisors. Indices are unmanaged and do not reflect fees or transaction expenses. You cannot invest directly in an index. References to benchmarks or indices are provided for information only. The securities discussed herein were holdings during the quarter. They will not always be the highest performing securities in the portfolio, but rather will have some characteristic of significance relevant to the article (e.g., reported news or event, a new contract, acquisition/divestiture, financing/refinancing, revenue or earnings, changes to management, change in relative valuation, plant strike, product recall, court ruling). EWM obtained this information from multiple sources believed to be reliable as of the date of publication; EWM, however, makes no representations as to the accuracy or completeness of such third party information. Unless otherwise noted, any recommendations, opinions and analysis herein reflect our judgment at the date of this report and are subject to change. EWM has no obligation to update, modify or amend this information or to otherwise notify a reader thereof in the event that any such information becomes outdated, inaccurate, or incomplete. EWM and its affiliates engage in a wide range of activities for their own account, and for their clients and the accounts of their clients, including corporate finance, mergers and acquisitions, equity sales, trading and research, private equity, and asset management and related activities. The observations and views expressed herein have been prepared by the individual author and, unless otherwise specifically stated, are solely those of the individual author and not EWM or any of its affiliates or any of their respective personnel. Other professionals of EWM and its affiliates may provide oral or written advice, services, market commentary, trading strategies and other material to clients that reflect observations and views that are contrary to those expressed herein. The author of this material may have discussed the information contained herein with others within or outside EWM and the author, EWM and/or such other persons may have already acted on the basis of this information (including by communicating the information contained herein to other customers of EWM and its affiliates). EWM’s Privacy Policy is available upon request. EWM is compensated for the investment advisory services it provides, generally based on a percentage of assets under management. In addition to the investment management fees charged, clients may be responsible for additional expenses, such as brokerage fees, custody fees, and fees and expenses charged by third-party mutual funds, pooled investment vehicles, and third-party managers that may be recommended to clients. A complete description of EWM’s advisory fees is available in Part 2A of EWM’s Form ADV. Trust services are provided by Evercore Trust Company, N.A., a national trust bank regulated by the Office of the Comptroller of the Currency and/or Evercore Trust Company of Delaware, a limited purpose trust company regulated by the Delaware State Bank Commissioner, both affiliates of EWM. Custody services are provided by Evercore Trust Company, N.A. The use of any word or phrase contained herein that could be considered superlative is not intended to imply that EWM is the only firm capable of providing adequate advisory services. This material does not purport to be a complete description of our investment services. This document is prepared for the use of EWM clients and prospective clients and may not be redistributed, retransmitted or disclosed, in whole or in part, or in any form or manner, without the express written consent of EWM. Any unauthorized use or disclosure is prohibited. The Chartered Financial Analyst and CFA trademarks are the property of CFA Institute. Certified Financial Planner Board of Standards Inc. owns the certification marks CFP®, Certified Financial Planner™ and CFP® in the U.S. Clients referenced here have been included based on objective non-performance based criteria. It is not known whether such clients approve or disapprove of EWM or the investment advisory products or services provided.
IRS Circular 230 Disclosure:
Pursuant to IRS Regulations, we inform you that any U.S. Federal tax advice contained in this communication (including any attachments) is not intended or written to be used, and cannot be used, for (i) the purpose of avoiding IRS imposed penalties or (ii) promoting, marketing, or recommending to another party any transaction or matter addressed herein. This information is provided for information purposes only and does not constitute financial, investment, tax or legal advice.
© 2017 Evercore Wealth Management LLC. All rights reserved. All other marks are the property of their respective owners.

NEW YORK55 East 52nd StreetNew York, NY 10055212.822.7620
MINNEAPOLIS150 S. Fifth Street, Suite 1330Minneapolis, MN 55402612.656.2820
Martha [email protected]
TAMPA4030 Boy Scout Boulevard, Suite 475Tampa, FL 33607813.313.1190
Julio [email protected]
SAN FRANCISCO425 California Street Suite 1500San Francisco, CA 94104415.288.3000
Keith [email protected]
INSTITUTIONS55 East 52nd StreetNew York, NY 10055212.822.7692
Brian [email protected]
EDITORIAL AND MEDIAAline Sullivan Lexicon [email protected]@evercore.com
WILMINGTONEvercore Trust Company of Delaware 300 Delaware Avenue, Suite 1225 Wilmington, DE 19801 302.304.7362
Darlene MarchesaniChief Trust Officer and Trust Counsel [email protected]