a real-time intrusion-detection expert system · sri international has designed and developed a...
TRANSCRIPT

Final Technical Report February 28, 1992
A REAL-TIME INTRUSION-DETECTION EXPERT SYSTEM (IDES)
Prepared by:
Teresa F. Lunt, Ann Tamaru, Fred Gilham,R. Jagannathan, Caveh Jalali, Peter G. NeumannComputer Science Laboratory
Harold S. Javitz, Information Management and Technology CenterAlfonso Valdes, Applied Electromagnetics and Optics LaboratoryThomas D. Garvey, Artificial Intelligence Center
SRI Project 6784
Prepared for:
Mr. Robert Kolacki, Code 3421SPAWARWashington, DC 20363-5100
Contract No. N0003S89-C-0050

Abstract
SRI International has designed and developed a real-time intrusion-detection expertsystem (IDES). IDES is a stand-alone system that observes user behavior on one or moremonitored computer systems and flags suspicious events. IDES monitors the activities ofindividual users, groups, remote hosts and entire systems, and detects suspected securityviolations, by both insiders and outsiders, as they occur. IDES adaptively learns users�behavior patterns over time and detects behavior that deviates from these patterns. IDESalso has a rule-based component that can be used to encode information about knownsystem vulnerabilities and intrusion scenarios. Integrating the two approaches makesIDES a comprehensive system for detecting intrusions as well as misuse by authorizedusers. IDES has been enhanced to run under GLU, a platform supporting distributed,parallel computation; GLU enhances configuration flexibility and system fault tolerance.
This final report is a deliverable item for work supported by the U.S. Navy, SPAWAR,which funded SRI through U.S. Government Contract No. N00039-89-C-0050.


Contents
1 Introduction1.1 Earlier Work. . . . . . . . . . . . . . . . . . . . . . . . . . . . . . . . . .1.2 IDES Overview . . . . . . . . . . . . . . . . . . . . . . . . . . . . . . . .1.3 Progress . . . . . . . . . . . . . . . . . . . . . . . . . . . . . . . . . . . . .
2 The IDES Design Model
1234
9
3 The Audit Data3.1 Types of Audit Data . . . . . . . . . . . . . . . . . . . . . . . . . . . . .3.2 Generation of Audit Data on Sun UNIX . . . . . . . . . . . . . . . . . .3.3 Sun Source Code Bug Fixes . . . . . . . . . . . . . . . . . . . . . . . . .
4 The Realm Interface4.1 IDES Audit Record Generator (agen) . . . . . . . . . . . . . . . . . . . .4.2 Audit Record Pool (arpool) . . . . . . . . . . . . . . . . . . . . . . . . . .4.3 IDES Audit Record Design . . . . . . . . . . . . . . . . . . . . . . . . . .4.4 Implementation . . . . . . . . . . . . . . . . . . . . . . . . . . . . . . . .
4.4.1 Communication between Agen and Arpool . . . . . . . . . . . . .4.4.2 IDES Audit Record Format . . . . . . . . . . . . . . . . . . . . .
4.5 Linking to IDES Processing Units . . . . . . . . . . . . . . . . . . . . . .4.5.1 Preferred Calls . . . . . . . . . . . . . . . . . . . . . . . . . . . .4.5.2 Older Versions of Arpool Stub Routines . . . . . . . . . . . . . .
5 The Statistical Anomaly Detector5.1 Statistical Algorithms . . . . . . . . . . . . . . . . . . . . . . . . . . . . .
5.1.1 The IDES Score Value . . . . . . . . . . . . . . . . . . . . . . . .5.1.2 How T2 Is Formed from Individual Measures . . . . . . . . . . . .5.1.3 Types of Individual Measures . . . . . . . . . . . . . . . . . . . .5.1.4 Heuristic Description of the Relationship of S to Q . . . . . . . .5.1.5 Algorithm for Computing S from Q . . . . . . . . . . . . . . . . .5.1.6 Computing the Frequency Distribution for Q . . . . . . . . . . . .5.1.7 Computing the Q Statistic for the Activity Intensity Measures . .
15151617
19192021222223282829
313232333436373839
5.1.8 Computing the Q Statistic for the Audit Record Distribution Measure 40
i

ii
5.1.9 Computing the Q Statistic for Categorical Measures . . . . . . . . 435.1.10 Computing the Q Statistic for Ordinal Measure . . . . . . . . . . 44
5.2 Design and Implementation . . . . . . . . . . . . . . . . . . . . . . . . . 455.2.1 Functional Architecture . . . . . . . . . . . . . . . . . . . . . . . 455.2.2 Implementation Details . . . . . . . . . . . . . . . . . . . . . . . . 485.2.3 Future Work . . . . . . . . . . . . . . . . . . . . . . . . . . . . . . 49
5.3 Intrusion-Detection Measures . . . . . . . . . . . . . . . . . . . . . . . . 505.3.1 User Measures . . . . . . . . . . . . . . . . . . . . . . . . . . . . . 515.3.2 Target System . . . . . . . . . . . . . . . . . . . . . . . . . . . . . 535.3.3 Remote Host . . . . . . . . . . . . . . . . . . . . . . . . . . . . . 54
6 The IDES Expert System 57
7 The IDES User Interface 637.1 Design Concepts . . . . . . . . . . . . . . . . . . . . . . . . . . . . . . . . 63
7.1.1 IDES User Environment . . . . . . . . . . . . . . . . . . . . . . . 647.1.2 Display Objects . . . . . . . . . . . . . . . . . . . . . . . . . . . . 65
7.2 User Interface Components . . . . . . . . . . . . . . . . . . . . . . . . . . 687.2.1 Security Officer�s User Interface . . . . . . . . . . . . . . . . . . . 687.2.2 Data Analyst Information . . . . . . . . . . . . . . . . . . . . . . 727.2.3 System Administration Data . . . . . . . . . . . . . . . . . . . . . 76
7.3 IDES User Interface Library (libiui) . . . . . . . . . . . . . . . . . . . . . 78
8 G L U 818.1 System Requirements . . . . . . . . . . . . . . . . . . . . . . . . . . . . . 818.2 The Multiprocessing Approach . . . . . . . . . . . . . . . . . . . . . . . . 828.3 GLU: A Software Platform for Multiprocessing . . . . . . . . . . . . . . . 82
8.3.1 GLU Programming Model . . . . . . . . . . . . . . . . . . . . . . 838.3.2 GLU Execution Model . . . . . . . . . . . . . . . . . . . . . . . . 858.3.3 Recovery from Partial Faults . . . . . . . . . . . . . . . . . . . . . 87
8.4 Implementation of IDES using GLU . . . . . . . . . . . . . . . . . . . . . 898.5 Evaluation . . . . . . . . . . . . . . . . . . . . . . . . . . . . . . . . . . . 91
9 Remaining and Proposed Work 939.1 Scalability and Resistance to Attack - The GLU Platform . . . . . . . . 979.2 The Resolver . . . . . . . . . . . . . . . . . . . . . . . . . . . . . . . . . 98
9.2.1 Resolver Models and Other Data Sources . . . . . . . . . . . . . . 999.2.2 Resolver Operation . . . . . . . . . . . . . . . . . . . . . . . . . . 1009.2.3 Evidential Reasoning . . . . . . . . . . . . . . . . . . . . . . . . . 1019.2.4 Benefits of Model-Based Reasoning . . . . . . . . . . . . . . . . . 102
9.3 Monitoring Network Traffic . . . . . . . . . . . . . . . . . . . . . . . . . 1039.4 A Neural Net Component for IDES . . . . . . . . . . . . . . . . . . . . . 104
9.4.1 Neural Networks . . . . . . . . . . . . . . . . . . . . . . . . . . . 104
iii
9.4.2 Uses of Neural Networks in IDES . . . . . . . . . . . . . . . . . . 1059.5 Large Network Architecture . . . . . . . . . . . . . . . . . . . . . . . . . 1069.6 Improved Detection Capability . . . . . . . . . . . . . . . . . . . . . . . . 1079.7 IDES Experimentation . . . . . . . . . . . . . . . . . . . . . . . . . . . . 1099.8 Summary . . . . . . . . . . . . . . . . . . . . . . . . . . . . . . . . . . . 109
A PBEST - A Production-Based Expert System Tool 111A. 1 Introduction . . . . . . . . . . . . . . . . . . . . . . . . . . . . . . . . . . 111A.2 Getting Started . . . . . . . . . . . . . . . . . . . . . . . . . . . . . . . . 112A.3 BasicSyntax . . . . . . . . . . . . . . . . . . . . . . . . . . . . . . . . . 115A.4 MoreSyntax. . . . . . . . . . . . . . . . . . . . . . . . . . . . . . . . . . 119A.5 Communicating with the Outside World . . . . . . . . . . . . . . . . . . 125A.6 Other Programming Considerations . . . . . . . . . . . . . . . . . . . . . 128A.7 The PBEST Interactive Window System . . . . . . . . . . . . . . . . . . 129A.8 Certainties and Justifications . . . . . . . . . . . . . . . . . . . . . . . . 143A.9 A Sample Makefile . . . . . . . . . . . . . . . . . . . . . . . . . . . . . . 143A.10 PBEST Syntax Diagrams . . . . . . . . . . . . . . . . . . . . . . . . . . 145A.11 Invoking pbcc . . . . . . . . . . . . . . . . . . . . . . . . . . . . . . . . . 153

iv

List of Figures
2.12.22.32.4
5.1
7.17.27.37.47.57.67.7
8.18.28.3
A.1A.2A.3A.4A.5A.6A.7A.8A.9
IDES Design Model . . . . . . . . . . . . . . . . . . . . . . . . . . . . . . 9IDES Domain and Realm Interface . . . . . . . . . . . . . . . . . . . . . 11IDES Realm Interface and Processing Environment . . . . . . . . . . . . 12IDES General Functional Diagram . . . . . . . . . . . . . . . . . . . . . 13
Statistical Anomaly Detection Process Unit . . . . . . . . . . . . . . . . 46
SOUI Main Window . . . . . . . . . . . . . . . . . . . . . . . . . . . . . 70SOUI Anomaly Graph Window . . . . . . . . . . . . . . . . . . . . . . . 71Peek Selection Window . . . . . . . . . . . . . . . . . . . . . . . . . . . . 73Scdist Display Window . . . . . . . . . . . . . . . . . . . . . . . . . . . . 74Statconfig Program (measure modifications) . . . . . . . . . . . . . . . . 75Statconfig program (parameter modifications) . . . . . . . . . . . . . . . 76Statconfig Program (command classes) . . . . . . . . . . . . . . . . . . . 77
IDES Expert System in GLU . . . . . . . . . . . . . . . . . . . . . . . . 86Data Parallelism in an Expert System. . . . . . . . . . . . . . . . . . . . 88IDES in GLU . . . . . . . . . . . . . . . . . . . . . . . . . . . . . . . . . 90
The PBEST Interactive Window . . . . . . . . . . . . . . . . . . . . . . 130The Result of Clicking on the Step Button . . . . . . . . . . . . . . . . . 131The Result of Selecting a Rule from the Rules List . . . . . . . . . . . . 132The Effect of Clicking on the Set Breakpoint Button . . . . . . . . . . . . 133The Effect of Selecting a Fact in the Facts List . . . . . . . . . . . . . . . 134The Result of Clicking on the Trace Button . . . . . . . . . . . . . . . . 135The Result of Clicking on the -> Ptypes Menu Button . . . . . . . . . . 136Selecting the count Ptype . . . . . . . . . . . . . . . . . . . . . , . . . . 137The Effect of Clicking on the Assert Fact Button . . . . . . . . . . . . . 138
A.10 Fact is Asserted . . . . . . . . . . . . . . . . . . . . . . . . . . . . . . . . 139A.11 Selecting a Fact to Negate . . . . . . . . . . . . . . . . . . . . . . . . . . 140A.12 The Effect of Clicking on the Negate Button . . . . . . . . . . . . . . . . 141
vi
Sun workstation, SunViews, and the combination of Sun with a numeric suffix are trade-marks of Sun Microsystems, INC.
DEC-2065 and TOPS-20 are trademarks of Digital Equipment Corporation.
ORACLE is a trademark of the Oracle Corporation.
UNIX is a trademark of AT&T Bell Laboratories.

Chapter I
Introduction
Existing security mechanisms protect computers and networks from unauthorized usethrough access controls, such as passwords. However, if these access controls �are com-promised or can be bypassed, an abuser may gain unauthorized access and thus can causegreat damage and disruption to system operation.
Although a computer system�s primary defense is its access controls, it is clear fromnumerous newspaper accounts of break-ins, viruses, and computerized thefts that wecannot rely on access control mechanisms in every case to safeguard against a penetration.or insider attack. Even the most secure systems are vulnerable to abuse by insiders whomisuse their privileges, and audit trails may be the only means of detecting authorizedbut abusive user activity.
Other modes of protection can be devised, however. An intruder is likely to exhibita behavior pattern that differs markedly from that of a legitimate user. An intrudermasquerading as a legitimate user can be detected through observation of this statisticallyunusual behavior. This idea is the basis for enhancing system security by monitoringsystem activity and detecting atypical behavior. Such a monitoring system will be capableof detecting intrusions that could not be detected by any other means, for example,intrusions that exploit unknown vulnerabilities. In addition, any computer system ornetwork has known vulnerabilities that can be exploited by an intruder. However, it ismore efficient to detect intrusions that exploit these known vulnerabilities through theuse of explicit expert-system rules than through statistical anomaly detection.
While many computer systems collect audit data, most do not have any capability forautomated analysis of that data. Moreover, those systems that do collect audit datagenerally collect large volumes of data that are not necessarily security relevant. Thus,for security analysis, a security officer (SO) must wade through stacks of printed outputof audit data. Besides the pure tedium of this task, the sheer volume of the data makesit impossible for the security officer to detect suspicious activity that does not conform
1

2 Introduction
to a handful of obvious intrusion scenarios. Thus, the capability for automated securityanalysis of audit trails is needed.
The Intrusion-Detection Expert System (IDES) is theresult of research that started inthe Computer Science Laboratory at SRI International in the early 1980s and that ledto a series of IDES prototypes. The current prototype, described in this final report, isdesigned to operate in real time to detect intrusions as they occur. IDES is a compre-hensive system that uses innovative statistical algorithms for anomaly detection, as wellas an expert system that encodes known intrusion scenarios [l, 2, 3, 4, 5, 6, 7, 8, 9]. Oneversion of the prototype is running at SRI and monitoring a network of Sun workstations.Another version is running at the FBI and is monitoring an IBM mainframe.
We have also conducted an SRI IR&D project to investigate the application of model-based reasoning to intrusion detection [10].
1 . 1 E a r l i e r W o r k
One of the earliest works on intrusion detection was a study by Jim Anderson [11], whosuggested ways of analyzing computer system audit data. His methods use data that arecollected for other reasons (e.g., performance analysis) and were designed for �batch�mode processing; that is, a day�s worth of audit data would be analyzed at the end ofthe day.
Subsequent to Anderson�s study, early work focused on developing procedures and al-gorithms for automating the offline security analysis of audit trails. The aim of suchalgorithms and procedures was to provide automated tools to help the security officer inhis or her daily assessment of the previous day�s computer system activity. One of theseprojects, conducted at SRI, used existing audit trails and studied possible approachesfor building automated tools for audit trail security analysis [12]. This work involvedperforming an extensive statistical analysis on audit data from IBM systems runningMVS and VM. The intent of the study was to develop analytical statistical techniquesfor screening computer system accounting data to detect user behavior indicative of in-trusions. One result of this work was the development of a high-speed algorithm thatcould accurately discriminate among users, based on their behavior profiles.
Another such project, led by Teresa Lunt at Sytek [13], considered building special se-curity audit trails and studied possible approaches for their automated analysis. Theseprojects provided the first experimental evidence that users could be distinguished fromone another through their patterns of use of the computer system [12], and that user be-havior characteristics could be found that could be used to discriminate between normaluser behavior and a variety of simulated intrusions [14, 15, 16, 17, 18, 19].
In addition, the Sytek work sought to provide a feasibility demonstration for a tool that

Introduction 3
would rank the detected unusual activity by its suspiciousness [13]. Sytek�s work wasguided by concepts from pattern recognition theory. Each user session was recognizedas normal or intrusive, based on patterns formed by the individual records on the audittrail for that session. The Sytek study defined several audit record features as functionsof the audit record fields. For each user, expected values for the features were determinedthrough a process called training (that is, for each feature, the set or range of values wasdetermined from the audit data). The study then tested the features for their ability todiscriminate between normal sessions and sessions containing staged intrusions. Featuresthat successfully detected the staged intrusions were combined to create for each user auser profile - the set of normal values for each feature.
The evidence of the early Sytek and SRI studies was the basis for SRI�s real-timeintrusion-detection system, that is, a system that can continuously monitor user be-havior and detect suspicious behavior as it occurs. This system, IDES, is based on twoapproaches: (1) intrusions, whether successful or attempted, can be detected by flag-ging departures from historically established norms of behavior for individual users, and(2) known intrusion scenarios, known system vulnerabilities, and other violations of asystem�s intended security policy (i.e., a priori definition of what is to be consideredsuspicious) are best detected through use of an expert-system rule base.
Largely as a result of the pioneering work at SRI, several other intrusion-detectionprojects are under way at other institutions. For a survey of these, see [20].
1.2 IDES Overview
IDES runs independently on its own hardware (Sun workstations) and processes auditdata received from one or more target systems via a network. IDES is intended toprovide a system-independent mechanism for real-time detection of security violations,whether they are initiated by outsiders who attempt to break into a system or by insiderswho attempt to misuse their privileges. IDES is based on the intrusion-detection modeldeveloped at SRI [21, 22]. This model is independent of any particular target system,application environment, level of audit data (e.g., user level or network level), systemvulnerability, or type of intrusion, thereby providing a framework for a general-purposeintrusion-detection system using real-time analysis of audit data.
The IDES prototype determines whether user behavior as reported in the audit data isnormal with respect to past or acceptable behavior as represented by a user�s histori-cal profile of activity. The IDES prototype continually updates the historical profilesover time, using the reported audit data to learn the expected behavior of users of thetarget systems. IDES raises an alarm when a user�s current observed activity deviatessignificantly from the user�s historical profile. The prototype provides mechanisms forsummarizing and reporting security violations as well as for detecting intrusions that

4 Introduction
cannot be detected by the access controls (e.g., because they circumvent the controls orexploit a deficiency in the system or its security mechanisms).
IDES employs several approaches toward detecting suspicious behavior. IDES attemptsto detect masqueraders by observing departures from established patterns of use forindividuals. It does this by keeping statistical profiles of past user behavior. IDES alsoincludes expert-system rules that characterize certain types of intrusions. IDES raises analarm if observed activity matches any of its encoded intrusion scenarios.
IDES also monitors certain system-wide parameters, such as CPU usage and failed loginattempts, and compares these with what has been historically established as �usual�or normal for that facility. The IDES security officer interface maintains a continuousdisplay of various indicators of user behavior on the monitored system. When IDESdetects an anomaly, it sends to the screen a message indicating the cause of the anomaly.
Each target system must install a facility to collect the relevant audit data and put theminto IDES�s generic audit record format. We have developed a flexible format for theaudit records that IDES expects to receive from the target system and a protocol for thetransmission of audit records from the target system. The IDES protocol and its auditrecord format are system independent; our intent is that IDES can be used to monitordifferent systems without fundamental alteration.
IDES monitors target system activity as it is recorded in audit records generated bythe target system. IDES maintains profiles for subjects. A profile is a description ofa subject�s normal (i.e., expected) behavior with respect to a set of intrusion-detectionmeasures. The subjects profiled by IDES are users, remote hosts, and target systems.Profiling remote hosts allows IDES to detect unusual activity originating from a partic-ular outside system, whether or not the user activity seems abnormal. Profiling a targetsystem enables IDES to detect system-wide deviations in behavior. Again, such devia-tions may not be attributable to a single user. For example, the number of system-widelogin attempts may be indicative of an intrusion attempt, although they might not all beattributable to a single user ID. We also plan to profile groups of subjects, which enablesIDES to detect when the behavior of an individual member of a group deviates from theoverall average behavior of the group. For example, IDES can detect when a secretaryis not behaving like a �typical� secretary.
The profiles are updated daily, based on the observed behavior of the users of the targetsystem. Thus, IDES adaptively learns subjects� behavior patterns; as users alter theirbehavior, the profiles change.
IDES also includes an expert-system component. The expert system contains rules thatdescribe suspicious behavior that is based on knowledge of past intrusions, known systemvulnerabilities, or the installation-specific security policy. The rules describe suspiciousbehavior that is independent of whether a user is deviating from past behavior patterns.Thus, IDES is also sensitive to known or posited intrusion scenarios that may not be

Introduction 5
easily detectable as deviations from past behavior. The rules can be used to encodeinformation about known system vulnerabilities and reported attack scenarios, as well asintuition about suspicious behavior. Audit data from the monitored system are matchedagainst these rules to determine whether the behavior is suspicious. Although it is notreasonable to expect that all possible intrusion scenarios can be foreseen and encodedin IDES�s rule base, the combination of the rule-based component and the statisticallybased component should have greater detective power than either component by itself.
1.3 Progress
The patterns of use for users of Sun workstations are different from patterns of use forusers of a centralized computing resource using computer terminals. Sun users typicallyhave several windows open simultaneously, many of which may be running UNIX shellsindependent of the other windows. Unlike the TOPS-20 environment that the IDESprototype monitored previously, there is no concept of user session, because users mayopen or close UNIX shells or other windows without logging in or out, and may leavethese windows activated for extended periods (days or weeks) without ever logging out ofthe workstation. A user typically has �superuser� privileges on his own workstation, butusually does not have such privileges on other workstations. Users in a networked Sunfacility have more remote logins, remote procedure calls, and file transfers than users of acentralized computer. In addition, patterns of abuse may differ significantly because userstypically have to remotely log in to another workstation or use remote procedure calls toaccess sensitive resources, which are more likely to be associated with a machine otherthan the user�s own. Thus, we have included suitable measures of behavior, for users ofa networked Sun facility, that capture any given user�s distinctive behavior pattern andthat are also useful in discriminating between normal and potentially abusive behavior.We have made modifications to IDES to enable it to integrate data from numerous sourcesfor any given user, allowing us to track the activity of a user who is remotely accessingother workstations or who moves from workstation to workstation.
Based on preliminary experiments and tests using IDES on the TOPS-20 target system,we found many areas in which IDES�s statistical algorithms could be improved. Wetested an earlier version (Release 1) of our statistical algorithms using data collectedfrom our now-retired TOPS-20 machine. (Release 1 was the �improved� version thatmonitored TOPS-20. It was our second TOPS-20 prototype; the first was a much simplerversion delivered on tape to SPAWAR in 1988.) The Release 1 algorithms made certainassumptions about the way usage patterns would be reflected in audit data. For example,in many cases we assumed that the data were multivariate normally distributed after asuitable transform, and thus we had simple procedures that merely looked for variancesgreater than N standard deviations from the mean. After testing these algorithms againstthe TOPS-20 data, we found that these assumptions resulted in an unacceptably high

6 Introduction
false alarm rate. As a result, we decided to redo the algorithms to remove some ofthese assumptions. In the process, we have completely redesigned and reimplementedthe statistical component of IDES to accommodate the new algorithms and to make thiscomponent easier to modify in the future.
We have completely redesigned IDES, making it highly modular. Previous versions ofIDES were much simpler and involved a programming staff of only one or two people.The current version of IDES is by comparison quite complex. It includes the capability ofmonitoring heterogeneous target machines (e.g., UNIX and IBM mainframe) simultane-ously, as well as the capability to simultaneously monitor multiple homogeneous targets.It is also capable of monitoring several sources of audit data from any single machine. Itis intended to be extensible, in that it will be easy to add additional analysis components.It uses more robust statistical algorithms, an expert- system component, and a more so-phisticated user interface. To support the development of this new version, the IDESteam has grown to a size of eight people. The original design had evolved by accretion.We felt that it was time to start over and develop a modular design that would
1. Facilitate communication among team members
2. Isolate a given programmer�s responsibility to a clearly defined system layer orcomponent
3. Remove low-level dependencies from high-level IDES functionality
4. Provide a framework for the gradual removal of dependence on a database man-agement system
5. Allow enforcement of proven software engineering practices
We have also put a substantial amount of effort into the IDES security officer interface.We have developed a library of graphical routines that can be used to facilitate quickassembly of a graphical user interface. We have moved from the Sun windowing system(SunViews) to the X Window System, which is emerging as a de facto standard windowingsystem.
We have reassessed our use of the ORACLE database management system in IDES. Afterreviewing the new design approach and running several benchmark experiments, we havecome to believe that there is a mismatch between the requirements of the online IDESprocessor and the capabilities of ORACLE. For this reason we have decided to stop usingORACLE for the online IDES processor. There is a possibility that ORACLE or anotherdatabase system can be used for the purposes of providing query capability, both for thesecurity officer, using �canned� queries, and for the data analyst, who will be able tomake ad-hoc queries over the audit data.

Introduction 7
Our primary consideration in the decision to abandon ORACLE for the online IDESprocessor was that ORACLE did not allow us to retrieve data fast enough. We felt thatthere was a lot of mechanism in ORACLE that we did not need, and this was the majorfactor in the poor performance. We found that using a UNIX file-based implementationprovided adequate performance.
One concern that we had was the issue of concurrent access to the database. ORACLEprovides a very general mechanism of row-level locking, allowing concurrent access byboth reading and writing processes. We originally planned to make use of this facility,and when we decided not to use ORACLE, the question arose as to how much effort wewould have to spend implementing our own concurrency mechanism. By analyzing thepatterns of access, we discovered that we would, in the worst case, have only read-writeconcurrency, and never write-write concurrency. This worst-case situation would occuronly once a day, at profile update time. We also found that reader-reader concurrencywould be infrequent (occurring only when a security officer or data analyst wanted toview a subject�s profile on the fly). On this basis we felt that a caching process coupledwith a simple protocol to update the cache as needed could mediate access to user profiledata.
We have also integrated an expert-system tool into IDES and have developed an expertrule base for IDES. The rule base encodes known intrusion scenarios and known systemvulnerabilities. The tool provides a rule-specification language, a translator that producesthe actual expert-system code, and run-time libraries to support all the capabilities ofthe expert system. It also provides the ability to create a debugging version of the expertsystem. This tool was developed in house. The rule debugging facility helps the personwho is developing the rule base to test and debug the candidate rules. We envision thatthe IDES security officer will be adding and modifying rules in the IDES rule base andwill make extensive use of the rule debugging facility. A rule is analogous to a softwareprocedure or subroutine, and must be tested and debugged to ensure that it behaves asexpected under a variety of input data conditions.
We have implemented the expert-system portion of IDES, and we are analyzing datafrom the FBI, using a rule base we are developing in conjunction with the FBI that isspecific to its application. In addition, we have developed expert-system rules specific toSun UNIX.
In the process of moving toward monitoring a network of Sun workstations, we evaluatedthe audit data collected by the C2 Sun UNIX system, and we made some changes tothe specific data collected so as to obtain the data we felt were most meaningful whilesignificantly reducing the amount of data to be analyzed.
We have developed a new core technology, which we call GLU (Granular Lucid), thatwill allow IDES to be easily scalable to many processors. From a design standpoint,GLU allows us to exploit the natural parallelism present in the IDES processing of auditdata, and encourages a highly modular design. GLU also gives IDES increased fault
8 Introduction
tolerance, because it automatically reschedules to another processor tasks that were activeon a processor that failed. We have tested GLU by implementing a portion of theIDES software on it, and have demonstrated its ability to transparently distribute IDESprocessing among several Sun workstations and to redistribute IDES processing whenone of the workstations goes down. We plan to use GLU to allow us to easily migrate tothe Next Generation IDES.
Chapter 2
The IDES Design Mode1
The original version of IDES was designed and developed to support a single targethost. We have redesigned its architecture so that it can be applied to any number ofheterogeneous target systems, as well as provide a platform for experimental intrusion-detection techniques and various implementation methods.
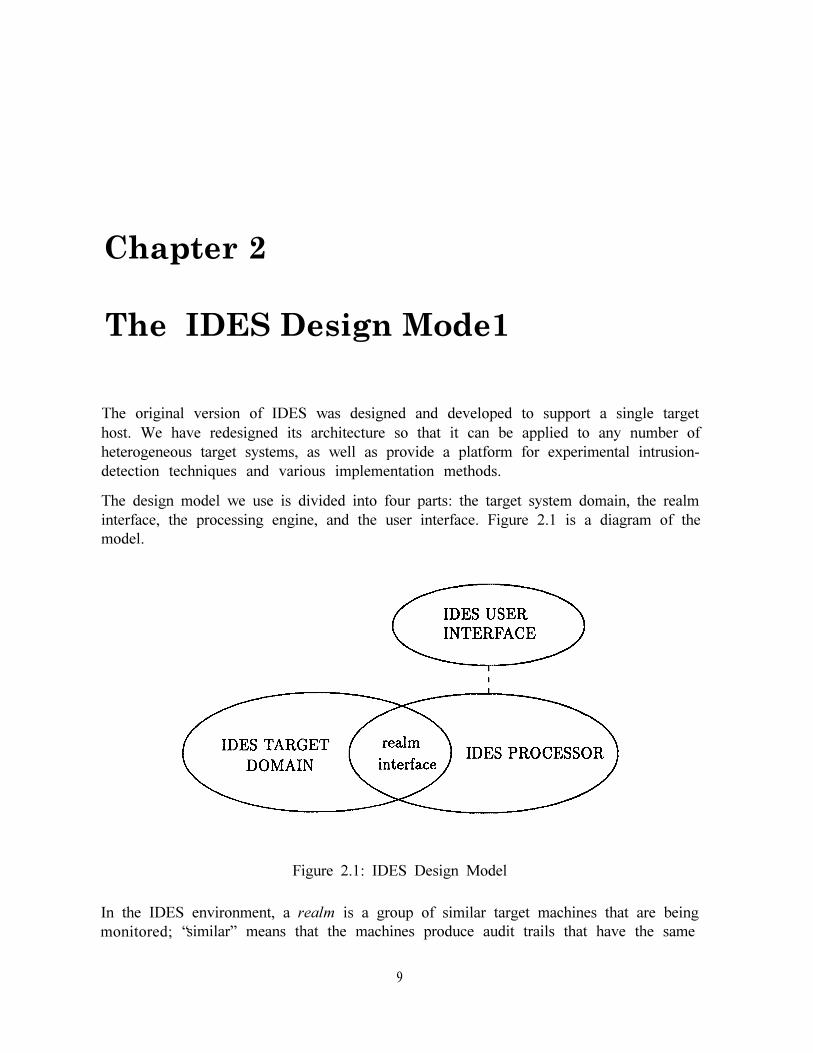
The design model we use is divided into four parts: the target system domain, the realminterface, the processing engine, and the user interface. Figure 2.1 is a diagram of themodel.
Figure 2.1: IDES Design Model
In the IDES environment, a realm is a group of similar target machines that are beingmonitored; �similar� means that the machines produce audit trails that have the same
9

10 The IDES Design Model
format. For example, in our prototype, the network of Sun workstations that we monitorconsists of one realm type. In addition to providing the target audit trails, each realminterface may also support some authentication of the audit data to verify the sourcefrom which it came.
The IDES target domain consists of a set of realms that are being monitored for anomalousactivity. Because there may be a number of monitored hosts, there can be more thanone centralized point of audit data collection and collation for a set of target systems aswell as for realms.
The IDES processor is the computing environment that is responsible for the analysis ofthe information acquired from the IDES domain. IDES audit records are passed to thevarious analytical engines, also known as event subsystems. All IDES event subsystemsprocess events on a per-audit record basis (or groups thereof). Currently, we have im-plemented two anomaly-detection event subsystems, one based upon statistical methodsand the other a rule-based system. However, the design model does not limit subsystemsto provide only detection of abnormal behavior (e.g., a subsystem could be designed togather statistics for general target-system usage).
The IDES realm interface is the bridge that connects the IDES domain and the IDESanalytical components. This interface has two pieces: the part that resides within thetarget system (the realm client) and the other one local to the IDES processor (the realmserver). Because various realm types have their own audit trail formats, a different realminterface must be developed for each realm type. Together, these two components areresponsible for collecting the target system activities for the IDES analytical engines,and for filtering out any realm-private data and setting them aside for specific uses asneeded.
For the sake of discussion, we will assume that the realm clients and server exist ondifferent systems on the same network, although the architecture is not restricted to thisconfiguration. Currently, each realm client converts audit records into a generic IDESaudit record format. Using a simple data transfer protocol, each realm client establishesa connection with the realm server whereby the target system�s audit information istransported across the network. The realm server stores the data, which it makes availableto the event subsystems as they indicate that they are ready for it. Note that there isno definite distribution of functional responsibility between the realm server and itscorresponding clients, as the implementation may vary according to the features of thetarget system. For example, a particular implementation is free to perform the conversionof audit records into IDES format on the IDES machine itself if this is desirable forperformance reasons.
Two diagrams show how these three parts of the model are related to each other. Figure2.2 shows a sample IDES domain containing four realms. Similar realm types may sharea single realm server, as indicated in the diagram with realm B using realm A�s server.Realms C and D are drawn as individual realms, having their own sets of realm server

The IDES Design Model 11
and client processes.
Next, Figure 2.3 shows the corresponding configuration for the IDES processing envi-ronment. The realm clients pass processed audit information to the event subsystemssimultaneously. The diagram also shows that IDES subsystems may be organized as�phases.� For example, all anomalies, regardless of severity, may be diagnosed duringone phase, and then filtered at subsequent phases until the degree of abnormality issignificant to the IDES end user (usually a security officer).
IDES target domain
Figure 2.2: IDES Domain and Realm Interface
Note that these diagrams represent a more complex organization of an IDES environment;our current prototype is a simpler instantiation of this model, using only one realm type.
The IDES user interface component allows the user to view any of the informationcreated and processed within the IDES system (i.e., the realm interface and the IDESevent subsystems), as well as to observe any component�s status and activity. Note thatthe IDES domain does not encompass the IDES user interface; we have elected to keeprealm-specific data independent from the core IDES user interface, as they are generallynot relevant to the basic IDES data processing. Details on the user interface design arediscussed in Chapter 7.
Figure 2.4 puts the pieces of the entire IDES environment together in one diagram. Itshows the data processed by each component. The diagram also depicts where the IDESuser interfaces are incorporated into the system.
The IDES design model naturally lends itself to be engineered as a modular system,where the implementation of each component can be changed without requiring major

12 The IDES Design Model
fromrealmservers
realm interfaceIDES processing
environment
Figure 2.3: IDES Realm Interface and Processing Environment
changes to the overall system. It essentially allows us to separate the infrastructure ofIDES (methods of implementation) from the core functionality of the system (anomalydetection).
The IDES system is currently composed of the following functional components:
Realm Interface
Statistical Anomaly Detector
Expert System Anomaly Detector
User Interface
Each of these components is implemented as an individual process, so as to exploitdistributed and parallel processing techniques to provide intrusion detection in as closeto real time as possible. Details on each component are described in subsequent sectionsof this report.

The IDES Design Model 13
Figure 2.4: IDES General Functional Diagram

14 The IDES Design Model

Chapter 3
The Audit Data
The audit data described in this chapter are to the �raw� audit information supplied bythe target system. In particular, we discuss the audit data collected for IDES from a SunUNIX target system environment.
3.1 Types of Audit Data
Our intent in audit data collection is to gather as much information about a runningsystem as is practical. Typically, this information falls into four general categories:
File Access. Includes operations on files and directories such as reads, writes,creations, deletions, and access list modifications.
System Access. Includes logins, logouts, invocation/termination of superuser priv-ileges, and so forth. In general, any activity that requires a password falls into thiscategory.
Resource Consumption. Includes CPU, I/O, and memory usage. We are currentlyable to collect this information on a per-process basis, although it is available onlyafter a process has terminated. It is possible to obtain this information at somearbitrary interval from an executing process; however, this would involve extraprogramming effort and can increase the load on the target system, because itrequires polling the processes and scanning various kernel data structures withevery poll. For these reasons, we have not tried to acquire resource consumptioninformation for executing processes.
Process Creation/Command Invocation. Indicates the creation of a process. Thisinformation is usually available after invoking a command.
15

16 The Audit Data
IDES analytical units are capable of handling other potential types of data, but currentlywe do not monitor for them because substantial Sun source code modification would berequired or because the collection of such data would encumber the target system itself,resulting in significant degradation of performance. These types of data include
Electronic Mail Traffic. This would require monitoring the source and destinationaddress of all incoming and outgoing mail on a user-by-user basis.
Dynamic Resource Usage. This would require monitoring the resource consumption(CPU usage) of every process on the system to determine its resource usage patternwhile it is executing. UNIX generally logs this information only when a processexits.
We are considering the possibility of monitoring the target system for these potentialdata for future versions of IDES, and we hope to find a way to collect such data withoutsignificantly affecting the performance of the target system.
3.2 Generation of Audit Data on Sun UNIX
To provide the IDES analytical components with enough information to perform adequateintrusion-detection analysis, we had to gather audit data from several different sourceson the Sun environment. These sources include
SunOS 4.0 standard auditing system
Sun C2 security auditing package1
UNIX accounting system
The standard SunOS 4.0 system collects all audit information in log files. Each hostwrites to exactly one audit file, uniquely defined for that host. These files grow in size asnew audit records are appended to them. Furthermore, at selected intervals (set by theSun system administrator), the system closes an audit file and begins writing to a newone. Previously used audit files remain until they are deleted manually by the systemadministrator (or by a privileged automated process).
The audit data for IDES are also obtained from the Sun C2 security package. Withsystems running version SunOS 4.0 and later, the target system can be configured with
1 �C2� refers to evaluation class C2 of the Department of Defense Trusted Computer System EvaluationCriteria [23]

The Audit Data 17
this package, enabling each target machine to record selected system calls into an auditlog file.
However, the information obtained solely from these two auditing systems is not suffi-cient for IDES intrusion-detection analysis. For example, in order to obtain CPU usagestatistics, we must also poll various UNIX accounting files. At present, only one such fileis being monitored (/var/adm/acct for Sun 3 workstations or /var/adm/pacct for SunSPARCstations). In the future, it may be profitable to monitor other files as well. Forexample, one such source will provide a detailed record of all mail exchanges for a systemand thus for each of its users.
3.3 Sun Source Code Bug Fixes
While it was our intent to avoid changing source code not under our control, such asSunOS functions, several instances were encountered where we felt changes had to bemade in order to provide sufficient data for IDES intrusion-detection analysis. In mostcases, these were bug fixes to SunOS that were necessary in order to obtain the informa-tion specified in Sun�s documentation. This had to be done by CSL because Sun couldnot accommodate our needs in time for us to get a working IDES system available forthe project. The following list shows the SunOS source files that were modified and thebugs that were fixed:
1. bin/login.c. This is the basic login mechanism that prompts the user for an accountname and a password. The bugs corrected were as follows:
The C2 audit record was filled in with the user name used to invoke /bin/logininstead of the command �login�. This made it impossible to identify the auditrecord. The audit record is now filled in with the proper information.
The name of the physical port reported was incorrect or missing, and wasfixed.
The user name for an attempted (failed) login was not reported if this namedid not appear in the password file. This name is useful for detecting loginattacks, and hence was added to the code.
2. bin/passwd.c. This is the UNIX password changer for local passwords. The C2audit record was filled with the user name in the type field instead of the string�passwd�. This made it impossible to identify the audit record. The audit recordis now filled in with the proper information.
3. bin/su.c. The su command allows users to change their user IDS if they know thepasswords of the user IDS they wish to assume. The C2 audit record was filled

18 The Audit Data
with the name used to invoke /bin/su instead of "su". This made it impossibleto identify the audit record. The audit record is now filled in with the properinformation.
4. usr.etc/rexd/unix_1ogin.c. Rexd is a daemon that allows the remote execution ofcommands using the �on� command. The audit flag of the remote process wasincorrectly changed to full auditing, and this was fixed.
5. usr.etc/rpc.mountd.c. Mountd is part of the NFS service and provides the initialcontact for clients to mount directories using NFS. C2 auditing is set to �off� bydefault when a process starts at system boot time. We changed this to enable C2logging by default instead. We also added C2 and syslog auditing of failed mountrequests, as originally such requests were not logged. Now, any failed attempts ofmounting a directory are logged using both the syslog(3) and C2 audit mechanisms.
6. usr.etc/in.ftpd/ftpd.c. Ftpd is the server part of the ftp service and is responsiblefor providing access to local files for a remote user. We added the capability oflogging C2 audit records for logins and attempted logins that failed because of abad password.
7. usr.etc/rpc.pwdauthd.c. Pwdauthd performs password checking on C2 systems be-cause the encrypted passwords are hidden on C2 systems. Authd now returns�success� only if the password check request originated on the local machine; oth-erwise, �failure� is returned, and a l-second time delay occurs before the nextrequest is processed. Failure is returned so that the cracker will never know if hehas guessed a password. The l-second delay is intended to prevent outsiders fromloading our CPU by generating a large number of requests. In addition, loggingand C2 auditing were added.
The following problems with C2 auditing that could not be resolved with only minimalchanges to the SunOS source code:
1. Yppasswdd seems to be started before auditing is enabled when a system boots;thus, it is not audited. This is actually a problem with the audit-uid and audit-state values. These seem to be set to a �disabled� value at boot time, so daemonprocesses are not audited unless they explicitly set these values.
2. During audit file switching, /usr/etc/security/audit_data seems to be updated be-fore the new audit file is created and after the trailer mark has been placed in theold audit file. This created an annoying problem for applications that must readthese files as a continuous stream of audit records over time.

Chapter 4
The Realm Interface
The IDES realm interface defines the interface between IDES and the target systems tobe monitored. It is assumed that each target system is somehow capable of providing�raw� audit data to IDES. The realm interface is responsible for accepting the raw data,converting them to a standard IDES audit record format, and temporarily storing them (ifnecessary) until the IDES analytical components can process them. The realm interfaceconsists of two main components: a target system component (called agen) and an IDEScomponent (called arpool). The general functionality of these components is describedin the first few sections, followed by implementation details.
4.1 IDES Audit Record Generator (agen)
Agen is a utility that resides on the target machine (the one being monitored). It collectsraw audit data from several sources on the target machine (see Section 3.2) and translatesthe system�s native audit record format into a canonical format that IDES can process.For example, IDES has a notion of a user logging into a machine, and needs to knowthat such an event has occurred. It is up to agen to decide what constitutes a login on aparticular target machine. In the UNIX environment, every time a (username, password)pair is entered, a login has occurred. This could be through either a login from a terminal,a remote login (rlogin) over the network, or perhaps by means of an FTP session.
Currently, each audit file is polled by agen at discrete intervals to see if the target systemhas added audit data to it since the last poll. Each time new records are discovered, agenreads batches of unprocessed audit records from the file, preprocesses them into IDESformat, and sends them to arpool. If no new records have been added, agen �sleeps� fora short time before polling the files again.
This scheme provides several benefits. First, the target system automatically provides
19
20 The Realm Interface
the buffering of unprocessed audit records. Second, natural grouping (batching) of auditrecords can take place. If IDES should fall behind in processing audit records, thenmany new audit records can accumulate by the time the log files are polled again. Thesoftware recognizes this situation and compensates by reading a group of audit recordsthe next time the log files are polled. In doing so, the average overhead of processingeach audit record is reduced, thus allowing IDES to work more efficiently in times of highdemand, while still providing good response times when very few audit records need tobe processed.
Some effort is also made to sort audit records by time. Due to the unpredictabilityof UNIX scheduling, it is conceivable that one source of audit records may grow morequickly and appear to be �ahead� of another source in that it contains audit recordsthat are newer than those in other files. By merge-sorting audit records from differentsources, we can greatly limit this phenomenon.
Agen can be considered the system-dependent part of the realm interface. It is sufficientto rewrite only the agen component to be able to monitor a new type of target system.There is considerable flexibility in its implementation. For example, under UNIX, it isdesirable and practical to monitor and report audit records in real time, and hence agenshould be implemented so that IDES audit records are passed to the IDES processingenvironment as events occur on the target system. However, it is also possible to passaudit records in batch mode, where previously collected audit data are processed by agenand passed on to the IDES side of the realm interface. The latter is suitable for replayingaudit data for backtracking analysis, or for IDES experimentation.
4.2 Audit Record Pool (arpool)
The interface component of IDES to which monitored machines send their audit recordsis the arpool process (also known as the envelope). It is the clearing house for IDESaudit records. Arpool resides on the server side of the realm interface, that is, its purposeis to accept IDES-formatted audit records from multiple target machines and serializethem into a single stream. It then does a little further processing of the data, such astimestamping each IDES audit record and assigning a unique sequence number to eachone. Only one arpool process is required for a single IDES system.
The purpose for creating a single stream of IDES audit records is to allow IDES torepartition the input stream in any way it chooses to achieve the best parallelism inprocessing the records. In particular, GLU is capable of parallelizing the processing ofthis input stream (see Chapter 8). Furthermore, in a networked target environment, auser may be active on several machines, and thus it is likely for IDES to receive auditrecords for the same user from different target machines. To relate all the activities tothat one user, it is necessary to merge audit records from multiple sources into a single

The Realm Interface 21
stream.
Arpool also functions as a temporary store (cache) of audit records waiting to be processedby IDES. Since the collection and preprocessing of audit data is much faster than thespeed with which the analytical components can process the data, arpool can regulatethe audit data traffic. This feature also provides some degree of data integrity, as it canstore a substantial amount of IDES audit information in case one or more of the IDESanalytical components is temporarily down and unable to process the incoming records.
4.3 IDES Audit Record Design
The IDES audit record format is subject to several design considerations. First, it mustbe general enough to be able to represent all possible kinds of events for the system(s)being monitored. Second, it should be in a machine�s most efficient data representationto allow processing with a minimal amount of representation overhead. For example, ifIDES needs to do numerical operations on integers, these values should be represented asintegers and not as ASCII strings. Likewise, the byte conversion issue should be resolvedbefore the audit record is sent to IDES. In other words, if the target machine uses anative representation different from that used by the IDES processor, then the targetmachine should do the data conversion. Third, the format should be standardized sothat IDES can accept input from a variety of machine types without performing anydata conversion. Ideally, audit records should be formatted only once. Since the IDESaudit record is always crafted from a system�s native audit record format, it makes senseto generate the IDES audit record at the source (target system), so that no further dataconversions are necessary once the audit record has been accepted by the IDES processingenvironment.
IDES audit records are classified by action types. There are about 30 different actiontypes, such as file reads, file writes, and logins. These actions enumerate the types ofevents that IDES has been designed to monitor. They are predetermined and cannot bechanged without modifying IDES itself. However, in order to accommodate the possiblylimited auditing capabilities of different target systems, there is considerable flexibilityin qualifying each IDES action.
Each IDES audit record consists of an action type with several fields parameterizingthat action. Some of these fields are always defined, such as the timestamp of the auditrecord, a subject ID, and target hostname. This mandatory collection of data formsthe fixed part of the IDES audit record. There is also a variable part of the IDES auditrecord that contains information such as file names, directory names, or other appropriateinformation, depending on the action type.
The functionality of IDES is only as good as the information it receives. Thus, it is desir-
22 The Realm Interface
able to supply as much information as possible with each audit record. IDES recognizesthe fact that not all target systems can provide all the information that IDES wouldideally like to receive, so it is reasonable for IDES to ignore some fields in the IDES auditrecord if the information is not generated by the target system.
As a rule of thumb, all fields in the IDES audit record that can be filled with somerelevant information should be filled. If no data are available for some fields to be filled,then these fields should be set to some distinct default value (either 0 or a null string,as the case may be). For example, UNIX is not capable of generating the CPU-timeused by a system call; thus, the CPU utilization field in the audit records is set to 0,whereas other target systems that do maintain such information would set this field tothe appropriate value.
On the other hand, not all detectable events need be reported to IDES. For example,under SunOS with C2 enabled, we have chosen to not report stat(2) system calls toIDES for two reasons. First, these system calls occur very frequently and are usuallyredundant, and are thus not especially useful for intrusion detection. Second, the volumeof stat(2) calls is so large that considerable performance benefits are realized by ignoringthem.
4.4 Implementation
The following subsections discuss the implementation details of the realm interface.
4.4.1 Communication between Agen and Arpool
Arpool accepts audit records using SUNRPC. Our use of SUNRPC expands on the simpleRPC paradigm by allowing the RPC server to accept multiple remote procedures beforereplying to any of them. This enables us to easily implement flow control in arpool.
Agen and arpool communicate with each other using SUN�s RPC mechanism. This allowsthe implementation of a client/server model for communication between arpool and agenwith arpool as the server. We have chosen this protocol for transferring audit records toIDES for its generality of implementation. Using RPC, many of the implementation de-tails of data transfer have been hidden, leaving us with a relatively high-level abstractionfor data transfer. SUN�s RPC mechanism supports XDR (external data representation),which attempts to solve problems that might otherwise have been introduced by com-munication between heterogeneous machines.
However, the full XDR capabilities of SUNRPC have not been exploited because of certainlimitations of the RPC language. In particular, some of the C language constructs usedby IDES cannot be parsed by rpcgen, the RPC/XDR compiler. It was necessary to

The Realm Interface 23
create a separate header file defining the IDES audit record in a way that rpcgen couldunderstand. Since this would mean that the same data structures must be defined in twoplaces without any way to verify their consistency, we are not currently doing this. Atpresent, we support the Sun 3 (mc680x0) and Sun 4 (SPARC) architectures.
We have enhanced the standard RPC mechanism by allowing the RPC server process(arpool in this case) to block a client (agen) while continuing to service other requests,then unblock a previously blocked client. This all happens transparently to the client;the client may merely notice that the RPC took a long time. Arpool uses this scheme forflow control. When an agen process produces audit records much faster than IDES canprocess them, that agen process is blocked until IDES�s analytical components can catchup. The blocking takes place by delaying the reply phase of the RPC, and thus fromthe client�s point of view, the RPC merely took a little longer than its usual transactiontime. The advantage of this scheme is that �producers� can be blocked, while the IDES�consumers� (analytical units) can continue to be served.
Arpool is capable of noticing the termination of its clients. All communication is per-formed using RPC over a TCP/IP channel. Failure of notification is obtained from thestate of this TCP channel. If the channel closes unexpectedly, then arpool assumes thatthe remote process has terminated because of the death of that process or a machinecrash. The actual reason for the channel failure is not particularly important as long asarpool can detect that the client has gone down.
Arpool does very little special processing upon the death of a client; however, a pseudoaudit record is created to indicate the abnormal termination of an agen process. Typically,arpool removes any internal references that it might have had to that client so that allfurther processing can continue as if that client had never existed. When a previouslyfailed client reconnects to arpool, it is treated as a new client since no relation is assumedwith any of its previous incarnations.
It is conceivable and possibly even tempting to have arpool restart any of its clients thathave terminated unexpectedly. However, it is probably the case that if a client fails once,it will fail repeatedly until the actual problem has been resolved. When the problem hasbeen resolved, one can manually restart the failed client. If a machine crashes, clientssuch as an agen process should be started automatically as part of the boot process, thusensuring that audit records are always reported to IDES.
4.4.2 IDES Audit Record Format
Action Types
We have defined the following action types for IDES intrusion-detection analysis:

24 The Realm Interface
IA_VOID. This is a no-op.
IA_ACCESS. The specified file was referenced (without reading/writing it).
IA_WRITE. The file was opened for writing or was written.
IA_READ. The file was opened for reading or was read.
IA_DELETE. The specified file was deleted.
IA_CREATE. The specified file was created.
IA_RMDIR. The specified directory was deleted.
IA_XHMOD. The access modes of the specified file have been changed.
IA_EXEC. The specified command has been invoked.
IA_XHOWN. The ownership of the specified object (file) has been changed.
IA_LINK. A link has been created to the specified file.
IA_CHDIR. The working directory has been changed.
IA_RENAME. A file has been renamed.
IA_MKDIR. A directory was created.
IA_LOGIN. The specified user logged in.
IA_BAD_LOGIN. The specified user tried unsuccessfully to log in.
IA_SU. Superuser privileges were invoked.
IA_BAD_SU. An attempt was made to invoke superuser privileges.
IA_RESOURCE. Resources (memory, IO, CPU time) have been consumed.
IA_LOGOUT. The specified user has logged out.
IA_UNCAT. All other unspecified actions.
IA_RSH. Remote shell invocation.
IA_BAD_RSH. Denied remote shell.
IA_PASSWD. Password change.
IA_RMOUNT. Remote file system mount request (Network File Server).
IA_BAD_RMOUNT. Denied mount request.

The Realm Interface 25
IA_PASSWD_AUTH. Password confirmed.
IA_BAD_PASSWD_AUTH. Password confirmation denied.
IA_DISCON. Agen disconnected from arpool (pseudo-record).
IDES Audit Record Structure
Below is the C structure that represents an IDES audit record. As mentioned in Sec-tion 4.3, the record has a fixed section and a variable section. ides_audit_block containsthe fields that are mandatory for each audit record, and ides_audit_header contains thevariable data.
struct ides_audit_header (unsigned longcharcharcharcharcharcharenum ides_audit_actiontime_t
/* this section is unix specific */long syscall;
event;errno;rval;pid;
unsigned longlonglonglong
/* unix: these fields are 0 in most (but not all) cases */struct resource_info resource;
tseq;hostname[32];remotehost[32];ttyname[16];cmd[l8];_pad1[21;jobname[l6];action;time;
enum ides_audit_type act_type;long subjtype;char uname[IDES,UNAME,LEN];char auname[IDES,UNAME,LEN];char ouname[IDES,UIVAME,LEIV];long arglen;
};

26 The Realm Interface
A description of each of the above variables in the ides_audit_header structure are definedas follows:
tseq. Target sequence number, which uniquely identifies this audit record withinthe set of audit records received from the same target. It is set by agen.
hostname. Hostname of target machine.
remotehost. If a remote host was involved, this field represents its name.
ttynume. The terminal port/line used.
cmd. The command invoked to cause this audit record.
jobname. Batch job name (used for TOPS-20, FOIMS).
action. The action that caused this audit record.
time. The target timestamp. Obtained from raw audit data source or set by agenif raw audit data has no timestamp.
syscall. The syscall number causing audit record.
event. The C2 audit event mask (SunOS specific)
errno. System error code.
rval. System return code.
pid. Process ID responsible for this audit record.
resource.mem. Amount of memory used by this action.
resource.io. I/O (disk) utilization of this action.
resource.cpu. CPU time used by this action.
act_type. Indicates whether audit record was generated by a batch job or interactiveprocess. UNIX is always interactive.
subjtype. Currently not used.
uname. Name of user (subject) performing action.
auname. User (subject) name being audited (e.g., this does not change when unamechanges due to a superuser command).
ouname. Other user name (e.g., new user ID set when changing from one user toanother).

The Realm Interface 27
arglen. Length of variable part of record (placed in ides_audit_block.arg_un)
The structure definition of ides_audit_block is
typedef struct {longaud_type
unsigned longtime_t
ides-audit-header
ab_size;
ab_type;
rseq;rectime;
ah;
union ab_args {char maxbuf[AUP_USER];ides_path_desc _ipd[2];
#define ab_pathO _ipd[O].path#define ab_path1 _ipd[l].path
} arg_un;} ides_audit_block;
The above variables in the ides_audit_block structure are defined as follows:
ab_size. Actual byte length of ides-audit-block, suitable for malloc()ing or bcopy() ingsuch a structure.
ab_type. Audit record type. Obsolete, and no longer used.
rseq. Audit record realm sequence number. This number is assigned by arpool, anduniquely identifies an audit record across all target systems.
rectime. Timestamp generated by arpool indicating the time when the audit recordwas accepted by IDES.
ah. See description of ides_audit_header.
ab_path0. File name (if applicable).
ab_pathl. Second file name (if applicable).

28 The Realm Interface
4.5 Linking to IDES Processing Units
The IDES processing units are considered clients of arpool. Communication betweenthese clients is RPC-based. Each IDES client can request audit records from arpoolusing RPC. Typically, a client would ask for audit records, process them, and then deletethe processed records from arpool.
Audit records can be requested from arpool one at a time or in batches. For efficiency, itis best to request audit records in batches. Each request for audit records can be qualifiedwith a bit-mask to select only certain categories of audit records. At present, there arethree categories of audit records: user, system, and remote host.
Once an audit record has been requested by a client, arpool maintains a copy of thataudit record until it is explicitly deleted by that same client.
The procedural interface to arpool is declared in ides/arpool_stubs.h with correspond-ing data structures being defined in ides/arpoolrpc.h. The procedures documentedin the following subsections are simple stub routines that utilize the RPC stub routinesautomatically generated by rpcgen(1) from ides/arpool_rpc.x.
4.5.1 Preferred Calls
Using the latest version of the arpool stub routines, listed below, is the preferred methodof obtaining IDES audit records because of its flexibility and performance, although oldermet hods are still compatible with the current version of IDES.
extern void call-arpool_sethostname (char *hostname)
This function sets up the host from which the IDES client will obtain audit records.hostname is the remote host to connect to.
extern int call_arpool_nr (int nrec, ides_audit_block *buf, int size)
This routine sends a collection of one or more audit records to arpool. Nrec is thenumber of records being sent, and buf is a pointer to the block of audit records thatis the concatenation of one or more audit records. Size represents the total bytelength of block(s) being passed. The return value for this function is 0 if successful,-1 otherwise.
extern arpool_gb_res *call_arpool_get_block (long count, long mask)
This function requests up to count audit records. The selection of audit records isqualified by the selection mask mask. Note that each audit record and the buflistarray in the returned structure must be deallocated using free(3). The return valuefor this function is a set of audit records.

The Realm Interface 29
extern int call_arpool_get_block_cb (long count,, long mask,void (*cb)(const ides_audit_block *), long *loseq, long *hiseq)
Requests up to count audit records. The selection of audit records is qualified by theselection mask mask. For each obtained audit record, function *cb is invoked, withthe audit record as its parameter. Loseq and hiseq are updated with the lowest andhighest sequence number, respectively. This is the simplest interface for obtainingaudit records. However, it is clearly not as flexible as call_arpool_get_block(). Thisfunction returns 0 if successful, -1 otherwise.
extern int call_arpool_rm_range (long loseq, long hiseq)
The specified audit records are deleted. Loseq is the starting sequence number, andhiseq is the ending sequence number. The range given is inclusive. The functionreturns 0 if successful, -1 otherwise.
extern arpool_status_res *call_arpool_status()
This call returns a structure describing the status of arpool.
4.5.2 Older Versions of Arpool Stub Routines
This subsection lists older versions of the functions defined in subsection 4.5.1. IDESstill supports the older versions, and these functions are still used in some of the IDESprocessing components.
extern arpool_de_count_res *call_arpool_de_count (long user, long pos, long count)
The specified audit records are requested, as well as count of its successors. User isthe user ID of the audit records being requested, and Pos is the timestamp of theaudit records requested. The function returns a set of audit records.
extern int call_arpool_rm_count (long user, long pos, long count)
The specified audit records are deleted, as well as count of its successors. User isthe user ID of the audit records being requested, and Pos is the timestamp of theaudit records requested. The function returns a set of audit records.
extern int call_arpool_gd_count (long icount, long *user, long *pos, long *count)
Returns the (user, pos) dimension of the next available audit record, as well asthe count of how many more audit records are available. Icount is the maximumnumber of audit records to return, and count contains the number of audit recordsthat are actually being returned. The function returns 0 if successful, -1 otherwise.

30 The Realm Interface
extern arpool_de_res *call_arpool_de (long user, long pos)
This routine requests the specified audit record. The audit record is specified bythe (user, pos) dimension. The specified audit record identified by the (user, pos)dimension space is deleted. The function returns 0 if successful, -1 otherwise.
extern int call_arpool_gd (long *user, long *pos)
The (user, pos) dimension of the next audit record is returned, as well as the countof how many additional audit records have been received. This call blocks if noaudit records are available.
extern int call_arpool_pd (long *user, long *pos)
The (user, pos) dimension of the next audit record is returned, as well as the countof how many additional audit records have been received. This call does not block,but returns a count of 0 if no audit records are available.
Chapter 5
The Statistical Anomaly Detector
The SRI IDES statistical anomaly detector observes behavior on a monitored computersystem and adaptively learns what is normal for subjects. The defined subject typesare individual users, groups, remote hosts and the overall system. Observed behavior isflagged as a potential intrusion if it deviates significantly from expected behavior for thatsubject.
The IDES statistical anomaly detector maintains a statistical subject knowledge baseconsisting of profiles. A profile is a description of a subject�s normal (i.e., expected)behavior with respect to a set of intrusion-detection measures. Profiles are designed torequire a minimum amount of storage for historical data and yet record sufficient infor-mation that can readily be decoded and interpreted during anomaly detection. Ratherthan storing all historical audit data, the profiles keep only statistics such as frequencytables, means, and covariances.
The deductive process used by IDES in determining whether behavior is anomalous isbased on statistics, controlled by dynamically adjustable parameters, many of which arespecific to each subject. Audited activity is described by a vector of intrusion-detectionvariables, corresponding to the measures recorded in the profiles. Measures can be turned�on� or �off� (i.e., included in the statistical tests), depending on whether they aredeemed to be useful for that target system. As each audit record arrives, the relevantprofiles are retrieved from the knowledge base and compared with the vector of intrusion-detection variables. If the point in N-space defined by the vector of intrusion-detectionvariables is sufficiently far from the point defined by the expected values stored in theprofiles, then the record is considered anomalous. Thus, IDES evaluates the total usagepattern, not just how the subject behaves with respect to each measure considered singly.
The statistical knowledge base is updated daily using the most recent day�s observedbehavior of the subjects. Before incorporating the new audit data. into the profiles,the frequency tables, means, and covariances stored in each profile are first aged by
31
32 The Statistical Anomaly Detector
multiplying them by an exponential decay factor. Although this factor can be set bythe security officer, we believe that a value that reduces the contribution of knowledgeby a factor of 2 for every 30 days is appropriate (this is the daily profile half-life). Thismethod of aging has the effect of creating a moving time window for the profile data,so that the expected behavior is influenced most strongly by the most recently observedbehavior. Thus, IDES adaptively learns subjects� behavior patterns; as subjects altertheir behavior, their corresponding profiles change.
In this chapter, we discuss in detail the specific algorithms used to perform the anomalydetection analysis. We also describe the functional design of the statistical analysiscomponent from an implementation standpoint, and we list the measures used as part ofthe running system.
5.1 Statistical Algorithms
Details of the IDES statistical algorithms are discussed in this section.
5.1.1 The IDES Score Value
For each audit record generated by a user, the IDES system generates a single test statisticvalue (the IDES score value, denoted T2) that summarizes the degree of abnormality inthe user�s behavior in the near past. Consequently, if the user generates 1000 audit recordsin a day, there will be 1000 assessments of the abnormality of the user�s behavior. Becauseeach assessment is based on the user�s behavior in the near past, these assessments arenot independent.
Large values for T2 are indicative of abnormal behavior, and values close to zero areindicative of normal behavior (e.g., behavior consistent with previously observed behav-ior). For the T2 statistic, we select one or more �critical� values that are associated withappropriate levels of concern and inform the security officer when these levels are reachedor exceeded. For example, T2 values between 0 and 22.0 might be associated with noconcern, values between 22.0 and 28.0 might be associated with a �yellow� alert, andvalues in excess of 28.0 might be associated with �red� alerts. The critical values areselected so that they have a probabilistic interpretation; for example, we might expectfalse red alerts only once every 100 days (excluding events such as a change in job statusthat might trigger a red alert). However, the security officer has the freedom to raiseor lower the critical values for each system user, in case there is a need to monitor aparticular user�s behavior more closely or in case the standard critical values result intoo many false alerts for a particular user.
Because the T2 statistic summarizes behavior over the near past, and sequential values
The Statistical Anomaly Detector 33
of T2 are dependent, the T2 values will slowly trend upward or downward. Once the T2
statistic is in the red alert zone, it will take a number of audit records before it can returnto the yellow or green zone. To avoid inundating the security officer with notificationof continued red alerts, we notify the security officer only when a change occurs in thealert status, or when the user has remained in a yellow or red zone for a specific time.In addition, the security officer is able to generate a time plot of the T2 values for a userand thus assess whether or not the user�s T2 statistic indicates a return to more normalbehavior.
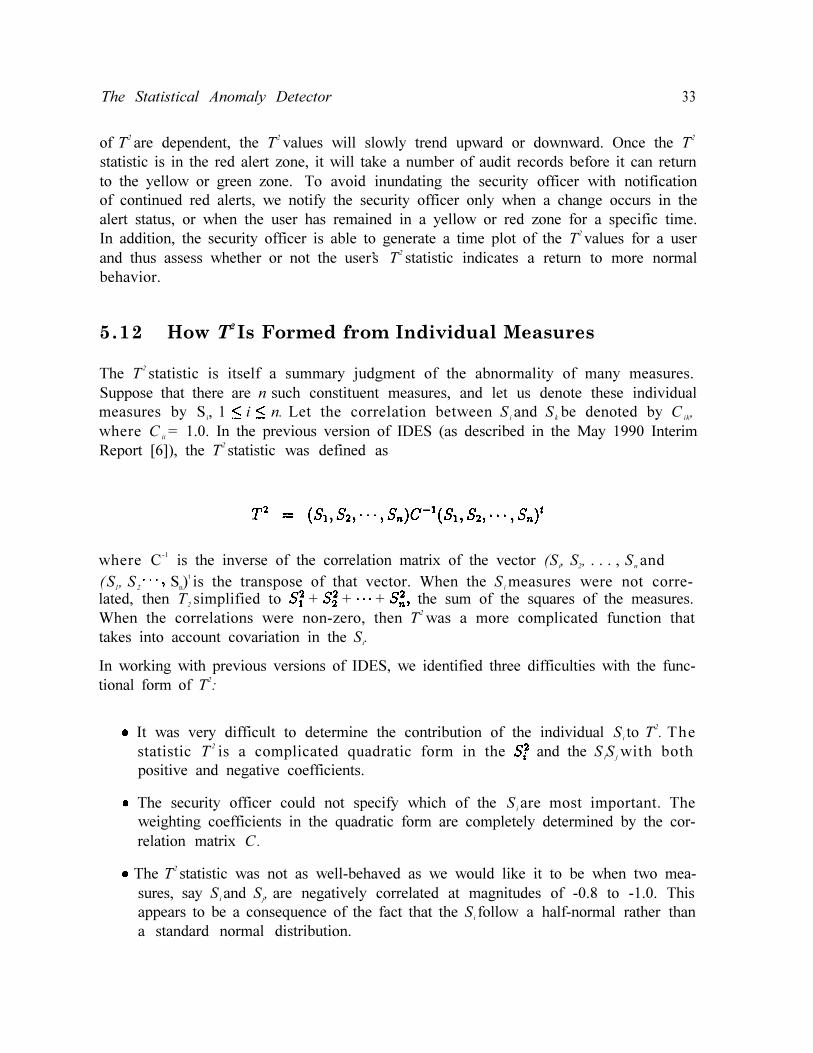
5.12 How T2 Is Formed from Individual Measures
The T2 statistic is itself a summary judgment of the abnormality of many measures.Suppose that there are n such constituent measures, and let us denote these individualmeasures by Si, 1 i n. Let the correlation between Si and Sk be denoted by C ik,where C ii = 1.0. In the previous version of IDES (as described in the May 1990 InterimReport [6]), the T2 statistic was defined as
where C-1 is the inverse of the correlation matrix of the vector (Si, S2, . . . , Sn and( S1, S2 Sn)
t is the transpose of that vector. When the Si measures were not corre-lated, then T2 simplified to + + + the sum of the squares of the measures.When the correlations were non-zero, then T2 was a more complicated function thattakes into account covariation in the Si.
In working with previous versions of IDES, we identified three difficulties with the func-tional form of T2:
It was very difficult to determine the contribution of the individual Si to T2. Thestatistic T 2 is a complicated quadratic form in the and the S iS j with bothpositive and negative coefficients.
The security officer could not specify which of the Si are most important. Theweighting coefficients in the quadratic form are completely determined by the cor-relation matrix C.
The T2 statistic was not as well-behaved as we would like it to be when two mea-sures, say Si and Sj, are negatively correlated at magnitudes of -0.8 to -1.0. Thisappears to be a consequence of the fact that the Si follow a half-normal rather thana standard normal distribution.

34 The Statistical Anomaly Detector
As an interim measure to handle these difficulties, in the current version of IDES we haveset the off-diagonal elements in the correlation matrix C to zero. This reduces the T2
statistic to the sum of the squares of the Si. This may be considered to be a simplifiedform of the following statistic, which addresses all of the problems mentioned above:
where the ai are positive coefficients that are specified by the security officer. With thisdefinition for T2 (which is currently being implemented, and is considered to be part ofthe current version of IDES) it is quite obvious how much each Si contributes to T2, thesecurity officer can increase the importance of a measure Si by increasing the value of thecorresponding ai, and the statistic T2 is well-behaved even when there are large negativecorrelations between the Si.
Unfortunately, when the T2 statistic is a weighted sum of the squares of the Si, T2 is no
longer sensitive to correlations among the Si. In the Next Generation IDES we intend toreintroduce this covariation by defining T2 as follows:
where the aij are positive coefficients specified by the security officer and h(Si, Sj, Cij)is a well behaved function of Si, Sj, and their correlation Cij, which takes large valueswhen Si and Sj are not behaving in accordance with their historical correlations. Thus,the new T2 statistic will accommodate pairwise covariation in the Si while addressingthe problems noted previously.
5.1.3 Types of Individual Measures
The individual S measures each represent, some aspect of behavior. For example, anS measure might represent file accesses, CPU time used, or terminals used to log on.Two S measures might also represent only slightly different ways of examining the sameaspect of behavior. For example, both Si and Sj might represent slightly different, waysof examining file access.
We have found it useful to classify the different types of individual measures in the IDESstatistical system into the following four categories:
Activity Intensity Measures. These measures (currently three) track the number ofaudit records that occur in different time intervals, on the order of 1 minute to 1

The Statistical Anomaly Detector 35
hour. These measures can detect bursts of activity or prolonged activity that areabnormal.
Audit Record Distribution Measure. This single measure tracks all activity types thathave been generated in the recent past, with the last few hundred audit recordshaving the most influence on the distribution of activity types. For example, wemight find that the last 100 audit records contained 25 audit records that indicatedthat files were accessed, 50 audit records that indicated that CPU time was incre-mented, 30 audit records that indicated that I/O activity occurred, 10 audit recordsthat indicated activity from a remote host, and so forth. These data are comparedto a profile of previous activity (generated over the last few months) to determinewhether the distribution of activity types generated in the recent past (e.g., thelast few hundred audit records) is unusual or not. (Note that even though we callthis measure �audit record distribution� we are not computing a distribution ofthe types of audit records themselves, but rather we are computing the probabilitythat an audit record will indicate that a particular type of activity is occurring.)
Categorical Measures. These are activity-specific measures for which the outcomes arecategories. For example, categorical measures might include the names of filesaccessed, the ID of the terminals used for logon, and the names of the remotehosts used. The categories that were used in the last 100 to 200 audit recordsthat affected that activity are compared to a historical profile of category usage todetermine if recent usage is abnormal.
Ordinal Measures. These are activity-specific measures for which the outcomes arecounts. For example, ordinal measures might include CPU time (which counts thenumber of milliseconds of CPU used) or the amount of I/O. Behavior over thelast 100 to 200 audit records that affected that activity is compared to a historicalprofile of behavior to determine if recent usage is abnormal.
These different categories of measures serve different purposes. The activity intensitymeasures assure that the volume of activity generated is normal. The audit recorddistribution measure assures that over the last few hundred audit records generated, thetypes of actions being generated are normal. The categorical and ordinal measures assurethat within a type of activity (for example, an action that involves accessing a file, oran action that involves incrementing CPU time), the behavior over the past few hundredaudit records that affect that action is normal.
The activity intensity measures and the audit record distribution measures are relativelyrecent additions to IDES. They were not available in the previous version of IDES (asdescribed in the interim report [6]). The categorical and ordinal measures were availableand continue to be available in all three generations of IDES. However, as described laterin this section, there have been changes made in the details of the implementation ofthe categorical and ordinal measures between the previous and current versions of IDES,

36 The Statistical Anomaly Detector
and it was these changes that prompted the addition of the activity intensity and auditrecord distribution measures.
5.1.4 Heuristic Description of the Relationship of S to Q
Each S measure is derived from a corresponding statistic that we will call Q. In fact,each S measure is a transformation of the Q statistic that indicates whether the Q valueassociated with the current audit record and its near past is unlikely or not.
The transformation of Q to S requires knowledge of the historical distribution of Q. Forexample, consider an S measure that represents CPU time used. The corresponding Qstatistic would also measure CPU time used in the near past. By observing the valuesof Q over many audit records, and by selecting appropriate intervals for categorizing Qvalues, we could build a frequency distribution for Q. For example, we might find thefollowing:
1% of the Q values are in the interval 0 to 1 (milliseconds)
7% are in the interval 1 to 2
35% are in the interval 2 to 4
18% are in the interval 4 to 8
28% are in the interval 8 to 16
11% are in the interval 16 to 32
In the previous and current versions of IDES, the S statistic would be a large positivevalue whenever the Q statistic was in the interval 0 to 1 (because this is a relativelyunusual value for Q) or whenever Q was larger than 32 (because this value has nothistorically occurred). The S statistic would be close to zero whenever Q was in theinterval 2 to 4, because these are relatively frequently seen values for Q. The selectionof appropriate intervals for categorizing Q is important, and it is better to err on theside of too many intervals than too few. We are currently using 32 intervals for each Qmeasure, with interval spacing being either linear or geometric. The last interval doesnot have an upper bound, so that all values of Q belong to some interval.
As explained later in this report, in the Next Generation IDES, the definition of Q willchange (for all measures except the activity intensity measures) in such a way that smallvalues of Q are indicative of a recent past that is similar to historical behavior and largevalues of Q are indicative of a recent past that is not similar to historical behavior. Thisinduces a modification in the transformation of Q to S, so that S is small whenever Q is

The Statistical Anomaly Detector 37
small, and S is large whenever Q is large. Hence, S can be viewed as a type of rescalingof the magnitude of Q. In the Next Generation IDES, a Q value of 0 to 1 in our examplewould correspond to a small value for S.
5.1.5 Algorithm for Computing S from Q
Assume for the moment that we have defined a method for updating the Q value eachtime a new audit record is received, and that we have defined intervals that we haveused to develop a historical frequency distribution for Q. The algorithm for convertingindividual Q values to S values in the previous and the current version of IDES is asfollows:
1. Let Pm denote the relative frequency with which Q belongs to the m th interval.In our example the first interval is 0 to 1 and the corresponding P value (say P0)equals 1%. There are 32 values for Pm, with 0 m 31.
2. For the m th interval, let TPROBm denote the sum of Pm and all other P valuesthat are smaller than or equal to Pm in magnitude. In our previous example,TPROB for the interval of 4 Q 8 is equal to 18% + 11% + 7% + 1% = 37%.
3. For the m th interval, let sm be the value such that the probability that a normallydistributed variable with mean 0 and variance 1 is larger than sm, in absolute valueequals TPROBm. The value of sm satisfies the equation P (|N(0,l)| sm ) =T P R O Bm, or sm = where is the cumulative distributionfunction of an N(0, 1) variable. For example, if TPROBm is 5%, then we set sm
equal to 1.96, and if TPROB m is equal to 100% then we set sm equal to 0. We donot allow sm to be larger than 4.0.
4. Suppose that after processing an audit record we find that the Q value is in themth interval. Then S is set equal to sm, the s value corresponding to TPROBm.
In the Next Generation IDES, the transformation of Q to S is slightly simplified byletting T P R O Bm = P m + P m + 1 + + P3l. In our previous example, the TPROB valueof the interval 4 Q 8 is equal to 18% + 28% + 11% = 57%. Thus, in the nextgeneration of IDES, S is a simple mapping of the percentiles of the distribution of Qonto the percentiles of a half-normal distribution.
In practice these algorithms are easy to implement, and the calculations of the si valuesare done only once at update time (usually close to midnight). Each interval for Q isassociated with a single s value, and when Q is in that interval, S takes the correspondings value.

38 The Statistical Anomaly Detector
5.1.6 Computing the Frequency Distribution for Q
This subsection describes how we compute the frequency distribution for Q, which is nec-essary for transforming Q to S. All procedures for computing the frequency distributionfor Q are identical in the previous, current, and Next Generation IDES.
The first step in calculating the historical probability distribution for Q is to define binsinto which Q can be classified. We always use 32 bins (numbered 0 to 31) for a measureQ. Let Qmax be the maximum value that we ever expect to see for Q. This maximumvalue depends on the particular types of measures being considered. Default values areprovided in the IDES system for these maximum values and they should be reset by thesecurity officer if Q is in the highest bin more than 1% of the time. The cut points for the32 bins are defined on either a linear or geometric scale. For example, when a geometric
scale is used, bin zero extends from 0 to 1, bin one extends from 1 to bin two
extends from to and bin 31 extends from to infinity.
As before, let Pm denote the relative frequency with which Q is in the m th interval (i.e.,bin). Each Q statistic is evaluated after each audit record is generated (whether or notthe value of Q has changed), and therefore Pm is the percentage of all audit records forwhich Q is in the m th interval.
The formula for calculating Pm on the k th day after initiating IDES monitoring of asubject is:
where
k is the number of days that have occurred since the user was first monitored
b is the decay rate for Pm, which determines the half-life of the data used to estimatePm. We currently recommend a 30-day half-life, corresponding to a b value of
= 0.0333.
Wm,j is the number of audit records on the j th day for which Q was in the m thinterval
Nk is the exponentially weighted total number of audit records that have occurredsince the user was first monitored.

The Statistical Anomaly Detector
The formula for Nk is:
39
where Wj is the number of audit records occurring on the jth day.
The formula for Pm appears to involve keeping an infinite sum, but the computations aresimplified by using the following recursion formulas:
In the IDES system we update Pm,k and N k once per day and keep running totals forW m,k and W k during the day.
5.1.7 Computing the Q Statistic for the Activity IntensityMeasures
When a subject is first audited, that subject has no history. Consequently, we choosesome convenient value to begin the Q statistic history. For example, we might let eachQ statistic be zero, or some value close to the mean value for other subjects that areprobably similar.
Each Q statistic for activity intensities is updated each time a new audit record is gen-erated. Let us now consider how to update Q. Let Qn be the value for Q after the n thaudit record, and Qn+1 be the value for Q after the (n + 1)st audit record. In both thecurrent and Next Generation IDES, the formula for updating Q is:
Q n + l= 1 + 2- r tQ n
where
l The variable t represents the time (say in minutes or fractions thereof) that haselapsed between the nth and (n + 1)st audit records.

40 The Statistical Anomaly Detector
The decay rate r determines the half-life of the measure Q. Large values of r implythat the value of Q will be primarily influenced by the most recent audit records.Small values of the decay rate r imply that Q will be more heavily influencedby audit records in the more distant past. For example, a half-life of 10 minutescorresponds to an r value of 0.10 = log2 The security officer may set the half-lifeof the activity intensity measures at any values that he or she feels are appropriate.We are currently running three activity intensity measures with half-lives of 10, 30,and 60 minutes, respectively.
Q is the sum of audit record activity over the entire past usage, exponentially weightedso that the more current usage has a greater impact on the sum. Q is more a measureof near past behavior than of distant past behavior, even though behavior in the distantpast also has some influence on Q. The Q statistic has the important property that it isnot necessary to keep extensive information about the past to update Q.
5.1.8 Computing the Q Statistic for the Audit Record Distri-bution Measure
Each audit record that is generated indicates one or more types of activity that haveoccurred for a subject. For example, a single audit record may indicate that a file hasbeen accessed, that I/O has occurred, and that these activities occurred from a remotehost. The Q statistic for the audit record distribution measure is used to evaluate thedegree to which the type of actions in the recent past agree with the distribution of actiontypes in a longer-term profile.
In both the current and Next Generation IDES, the calculation of the audit recordmeasure begins by specifying the types of actions that will be examined. We currentlyrecommend that each categorical and ordinal measure (with some exceptions as notedbelow) constitute an activity type. For example, if name of file accessed is a categoricalmeasure, then the corresponding activity type would be that any file was accessed. Sim-ilarly, if the amount of I/O used is an ordinal measure, then the corresponding activitytype would be that any I/O was used. That is, if an audit record would cause a categor-ical or ordinal measure to be recalculated, then a corresponding activity type should bedefined. The exception would be a categorical or ordinal measure that would be affectedby any audit record. For example, if an hour of audit record generation is a categoricalmeasure, then every audit record causes this categorical measure to be updated and nopurpose is served in defining a corresponding activity type.
In addition to defining activity types based on the categorical and ordinal measuresused, it may be useful to define additional activity types. For example, the securityofficer may want to evaluate the percentage of audit records generated that indicate thatthe user is logged onto a remote host. If the security officer is not interested in which

The Statistical Anomaly Detector 41
remote host is being used, then he or she may accomplish this goal in one of two ways.The first way is to establish a categorical measure with two categories: �remote hostindicated� and �remote host not indicated.� If this approach is used, then there shouldbe no corresponding activity type defined because every audit record is relevant to thecalculation of the categorical measure. The second way is to define an activity type of�remote host indicated� to be used by the audit record distribution measure and notto define a categorical measure. These two approaches yield similar (though not totallyequivalent) results, but the second approach is computationally less intensive.
Suppose that we have established M activity types. For each action we must calculatea long-term historical relative frequency of occurrence, denoted fm, for that activitytype. For example, suppose that over the last three months, 7% of all audit records haveinvolved file accesses. Then, fm for the file access activity type would be 0.07. Notethat each fm is between 0 and 1.0 inclusive. The sum of the fm may be greater than 1.0because a single audit record may indicate that multiple activity types have occurred.
The algorithm used to compute fm is essentially the same as that used to calculate Pm
and uses the same decay rate. That is, we may write that the value of fm on the k th dayis equal to
1
where N k, and b are defined as before and W m,j is the number of audit records on thejth day, which indicate that the m th activity type has occurred.
The Q Statistic for Audit Record Distribution in the Current IDES
The current and Next Generation IDES systems use different algorithms for defining theQ statistic for the audit record distribution measure. In the current IDES, Q is definedas
where
Qn+1 is the value of the Q statistic after the (n+l)st audit record has been received.
M is the number of defined activity types.

42 The Statistical Anomaly Detector
I(n + 1,m) = 1.0 if the (n + 1)st audit record indicated that the m th activity typeoccurred and 0.0 otherwise.
r is the decay rate for Q, which determines the half-life of the Q measure. Forexample, a half-life of 100 audit records corresponds to an r value of - log2 =0.01.
We note that when recent audit records indicate that historically less likely types ofactivity are now occurring, the Q statistic will increase in magnitude.
The Q Statistic for Audit Record Distribution in the Next Generation IDES
In the Next Generation IDES, we have changed the definition of Q so that we payattention not only to whether more or less likely types of actions are now occurring, butalso to which types of actions are now occurring. The revised definition of Q is
gm,n is the relative frequency with which the m th activity type has occurred in therecent past (which ends at the n th audit record).
Vm is the approximate variance of the gm,n.
That is, Qn is larger whenever the distribution of activity types in the recent past differssubstantially from the historical distribution of activity types, where �substantially� ismeasured in terms of the statistical variability introduced because the near past containsrelatively small (effective) sample size. The value of gm,n is given by the formula
or by the recursion formula
where

The Statistical Anomaly Detector 43
j is an index denoting audit record sequence.
I(j,m) is 1.0 if the j th audit record indicates activity type m has occurred and 0.0otherwise.
r is the decay rate for Q that determines the half-life for the Q measure. We haveset the half-life to approximately 100 to 200 audit records.
Nr is the effective sample size for the Q statistic, which is set at its asymptoticvalue of
The value of Vm is given by the formula
except that Vm is not allowed to be smaller than
5.1.9 Computing the Q Statistic for Categorical Measures
Categorical measures are those that involve the names of particular resources being used(such as the names of files being accessed, or the location from which logons are at-tempted) or involve other categorical characteristics of audit records, such as the hour ofthe day on which the audit record was generated.
In both the current and Next Generation IDES, the method used for computing Q forcategorical measures is essentially the same as that previously described for computing Qfor the audit record distribution measure. In fact, we may view the activity type measureas a categorical measure. The only difference in the definition for Q is that every auditrecord results in the recalculation of the audit record distribution measure, whereas for allother categorical measures, Q is updated only when the audit record contains informationrelevant to the particular measure. For example, the file name accessed measure wouldbe updated only when the audit record concerns a file access. A half-life for the file nameaccessed measure of 100 audit records would refer to 100 audit records relevant to filenames accessed, rather than to the last 100 audit records.
In the previous version of IDES, the form for the Q statistic was very similar to that usedin the current version of IDES except that the exponential decay factor for Q dependedon the time between appropriate audit records. That is, the formula for Q was

44 The Statistical Anomaly Detector
where Qn+1, M, and I(n + 1, m) are defined as in the current version of IDES, but
r is the decay rate for Q, which determines the half-life of the Q measure in seconds.
tn+1 is the number of seconds that have expired between the (n + 1)st and n th auditrecords.
The addition of the factor t in the exponent caused the Q statistic to be sensitive tothe volume of activity. When activity volumes per unit time were higher, the Q statistictended to grow. When activity volume was lower (such as overnight, or directly afterlunch), the Q statistic tended to be smaller. We decided that this dependence on activityvolume confounded the amount of activity with the normality of the type of activity andthat it would be better to separate these aspects of behavior into separate measures.Consequently, we removed the factor t from the exponent and converted the decay rater to refer to the exponential decay per audit record. In the current version of IDES, thismodification allows the Q statistic for categorical measures to examine the normalityof a specific type of behavior (such as file accesses) over the last few hundred auditrecords that contain information about that behavior, regardless of when that activityoccurred. The information on activity volume and type was transferred to two new typesof measures: the activity intensity measures, which track the number of audit records perunit of time, and the audit record distribution measure, which tracks the type of actionsbeing generated.
5.1.10 Computing the Q Statistic for Ordinal Measure
Ordinal measures are those that involve counts of particular resources used (such asCPU time in milliseconds or I/O counts) or some other counting measure (such as theinterarrival time in milliseconds of consecutive audit records).
In the current and Next Generation IDES systems, ordinal measures are transformed tocategorical measures. For example, consider the ordinal measure of CPU time: Indi-vidual audit records arrive that indicate that a non-zero amount of CPU time has beenincrementally expended since the last reporting of CPU usage. We might expect that thisdelta-CPU value would be between 0 and a maximum of 100,000 milliseconds. We define32 geometrically scaled intervals between 0 and 100,000 milliseconds employing the sameprocedure as we used for defining intervals for the historical profile for Q (including theconvention that the last interval actually extends to infinity). When a delta-CPU valuearrives and is classified into interval m, we state that a categorical event m has occurred.We treat the Q measure for CPU time as a categorical measure, where a category is ac-tivated whenever an audit record arrives with a delta-CPU value in that category. Thus,the Q measure for CPU time does not directly measure total CPU usage in the nearpast; rather, it measures whether the distribution of delta-CPU values in the near past

The Statistical Anomaly Detector 45
is similar to the historical distribution of delta-CPU values. Once the ordinal measure isredefined as a categorical measure as discussed above, the Q statistic is calculated in thesame fashion as any other categorical measure.
In the previous version of IDES, ordinal measures were not converted to categoricalmeasures. Bather, the definition for Q was
where Dn+1 is the difference in the ordinal count between the n th and (n + 1)st auditrecord. For example, if the measure were CPU time, then Dn+1 would be the amount ofCPU time that was expended between the nth and (n + l)st audit record. As with thecategorical measures in the previous version of IDES, the ordinal measures were heavilyinfluenced by volume of activity. More importantly, Q tended to be a measure of meanbehavior per unit of time (e.g., mean CPU usage per unit time). We decided that wewould be more likely to detect abnormal usage if we looked for unusual increments ofbehavior (for example, individual audit records that demonstrate an unusual amountof CPU). As a result, we both removed tn+1 from the decay factor and categorized theincrements Dn+l, yielding the ordinal measures as represented in the current version ofIDES.
5.2 Design and Implementation
This section describes the design and implementation of the IDES statistical component.
5.2.1 Functional Architecture
Conceptually, the statistical anomaly detection module of IDES is designed to be similarto that of the first IDES prototype. That is, by using profiles, anomalous behavior iscomputed by comparing a subject�s ongoing activity (which we will refer to as a subject�s�current� profile) with his or her past activity. At the end of each day, the subject�saccumulated observed behavior for that day is folded into the corresponding historicalprofile. This enables IDES to adaptively learn subjects� behavior patterns; as subjectsalter their behavior, the profiles will change accordingly.
The IDES statistical component is driven by the arrival of audit records. By examiningthe audit records as they arrive from the target system, IDES is able to determine througha variety of statistical algorithms whether the observed activity is abnormal with respectto the profiles. Anomalous behavior is flagged when such behavior deviates from the

46 The Statistical Anomaly Detector
subject�s normal behavior by a predetermined amount. When an anomaly is detected,an anomaly record is generated and is presented to a security officer and also recordedfor further analysis.
Figure 5.1 shows a diagram of the major parts of the statistical component and theirrelationship to one another. In the following subsections, we describe in detail the func-tionality of each of these modules.
Figure 5.1: Statistical Anomaly Detection Process Unit
Interprocess Manager
This module is the driver of the entire statistical component. All processes (both internaland external) communicate with this module, and it directs the process flow accordingly.When the IDES statistical component starts, the interprocess manager first loads in theappropriate statistical parameters, such as which measures to activate, what values to usefor aging factors, classification of commands, and grouping of subjects. Such informationis stored in a configuration file that can be modified by authorized users either before orduring the execution of the statistical component.
Prior to reading each audit record, the interprocess manager �listens� for messages com-ing from other IDES processes, such as the expert-system component, the profile updater,

The Statistical Anomaly Detector 47
or one of the user interface programs. Upon receiving one of these messages, the interpro-cess manager calls the appropriate process to deal with the message, and then continueson to process the next IDES audit record. Some examples of such messages include arequest to dump a subject�s current profile cache (usually in order to update its profile,or to display the latest accumulation of statistical data), or a notification from anotherprocess (most likely the profile updater) to reload the anomaly detector�s profile cacheto incorporate more recent data.
In addition, the interprocess manager sends messages to other processes as needed. Cur-rently, the statistical component sends a statistical score for every audit record to thesecurity officer�s user interface, as well as an alert message if this score is approaching orexceeds a given threshold value for that subject.
A c t i v i t y R e c o r d P r o c e s s o r
This module receives IDES audit records from the realm interface and transforms thedata into a data structure called an activity vector. This activity vector is N elementslong, where N is the number of measures (active and inactive), and contains observedvalues for each measure affected by an audit record. It should be noted that not allmeasures are always touched by each audit record, but this is generally determined bythe construction of the target system�s auditing mechanism. If a measure is inactive, azero or null value is inserted into that measure�s location in the activity vector. Thisactivity vector is passed on to the anomaly detector for statistical computation.
A n o m a l y D e t e c t o r
The anomaly detector is the heart of the statistical engine. This module takes the activitydata produced by the activity record processor and calls the routines that support thestatistical algorithms used for anomaly detection.
The anomaly detector continually updates the subject�s daily accumulation of activity(represented as probability vectors and matrices) with each incoming audit record, andcompares those values with the historical profile to determine deviation from expected(normal) behavior. After applying these series of statistical tests (see Section 5.1 fora detailed discussion of the algorithms used), an anomaly record may be produced ifan observed activity vector indicates unusual behavior according to the given subject�shistorical profile. When this happens, a message is passed to the interprocess managerto send to the appropriate external processes, such as the security officer�s user interface.

48 The Statistical Anomaly Detector
Profile Updater
The profile updater is generally invoked once a day. It takes the day�s accumulated ac-tivity information (represented as various probability structures) for a particular subject,and folds it into its historical profile after applying some arbitrary aging factor (the de-fault is set to a 30-day half-life). This newly updated profile is subsequently used againstthe next day�s activity for that subject.
The profile updater can be run in two modes:
Parallel. The profile updater can be run as an independent process that �wakes up�at a predetermined time of day (usually midnight) and simultaneously processesthe profiles for that day while the anomaly detector module continues to receiveaudit records from the realm interface. Any incoming audit records for a subjectwhose profile is currently being updated are temporarily set aside until the updateprocess has completed for that subject.
Sequential. The updater can also be invoked from the interprocess manager, whichlooks at each audit record timestamp to determine whether or not a new day hasoccurred. When a new day occurs, the anomaly detector is temporarily suspendedwhile the profile updater process is called for each active subject.
When running in either of the above modes, the profile updater process maintains asimple communication protocol with the interprocess manager to keep from corruptingthe subject�s profiles while the anomaly detector is running. Even if the updater isrunning in sequential mode, it is important for the anomaly detector to know when asubject�s profile has been modified because certain profile structures (mainly counters)must be reset to zero after the day�s activity is incorporated into the subject�s historicalprofile. The anomaly detector caches profiles in memory, and hence this cache needs tobe refreshed after a profile update.
The profile updater can also be invoked manually, although this method is rarely usedexcept in cases in which one of the above modes did not correctly start the updater, orfor testing and experimentation.
5.2.2 Implementation Details
The statistical component is designed so that its pieces can be implemented as softwaremodules. It is important to provide flexibility within this component so that differenttechniques for numerical analysis, data storage, and data presentation can be appliedwithout any major redesign or reimplementation of the component.

The Statistical Anomaly Detector 49
Earlier in the project, extensive experimentation was done within the data storage layer.Originally a standard DBMS product (ORACLE) was used as the underlying data man-agement software, but rigorous tests indicated a performance bottleneck at this leveldue to the increased amount of profile data necessary to process and store for the morecomplex statistical algorithms. While a sophisticated relational DBMS is beneficial forcomplex data manipulation and query management, it appeared to be more than wasneeded for the basic data processing used in the statistical analysis. Hence, we optedfor a simpler data storage mechanism for the statistical processing, using UNIX flat fileswith indexing. However, the use of a powerful DBMS product may be desirable forother aspects of IDES, especially where complicated and ad-hoc queries may be requiredto retrieve processed information for postanalysis (e.g., playback of events or buildingevidence to support a case).
We also discovered that caching of subject profiles greatly enhanced the performance ofdata retrieval. By keeping a number� of subjects� profiles in memory during execution,I/O access to the storage area (relatively expensive with respect to other computationswithin the statistical component) was reduced significantly with caching. A simple LRU(least recently used) caching algorithm is used to determine which profiles should existin the cache, along with aging the contents of each cache entry with the reception of eachnew audit record.
The usage of named pipes (a UNIX feature) is common throughout the statistical com-ponent, as it is the means of the interprocess communication between each of the internalmodules and external processes.
5.2.3 Future Work
Available experimental data were limited to a small sample size during this projectperiod. While the data that we had were sufficient to determine that the algorithmswere behaving as expected, we plan to experiment with a wider quantity and variety ofdata in the future. We recently acquired a large amount of audit data from the FBI,and we have also collected several months worth of UNIX data from our own lab; it isour desire to thoroughly exercise the statistical component, using these data. The nextphase of the IDES development will put an emphasis on more rigorous testing of theanalytical components, both for anomaly detection accuracy and for system performanceand usability.
The statistical algorithms went through several enhancements during the term of thisproject, and it was discovered that in some cases certain methods were suited moretowards a particular type of system or subject activity, or a new type of subject behaviorwas discovered that the current version of algorithms did not efficiently deal with. In lightof this, it would be practical to have the system constructed so that different versions ofthe statistical component can run simultaneously, using the same set of audit data, to

50 The Statistical Anomaly Detector
evaluate the performance and accuracy of the various detection algorithms.
We also plan to perform second-order intrusion-detection tests (such as detecting how fasta user�s mean and variance change). These trend tests will help evaluate the effectivenessof detecting planned attacks in which a subject may intentionally change his or herbehavior gradually to a different normal behavior to do subsequent malicious acts, or topurposely broaden the spectrum of �normal� behavior to include misuse or abuse of thesystem.
Although we have currently implemented a means to allow a user to dynamically recon-figure various statistical parameters, this feature needs to be considered more carefullywith respect to the consequential effects on the running system. For example, when newmeasures have been turned on or off, a certain amount of time is needed to allow theprofiles to adapt to the new configuration or else the anomaly detection component willvery likely produce false alarms because of the new influence by the new measure(s), or alack thereof. The whole issue of dynamic reconfiguration of the system cannot be treatedtrivially, and thus certain procedures or techniques must be defined and implemented toavoid the corruption of an ongoing IDES system.
During this project, we primarily focused on the user subject type. While the design ofIDES is by no means limited to one particular type of subject, we plan to experiment withIDES using other subject types, such as remote hosts, target systems, and local hosts.This effort will require the definition of appropriate measures for these new subjects,and some code enhancements to the activity record processor module of the statisticalcomponent.
5.3 Intrusion-Detection Measures
As we discussed previously, IDES determines whether observed behavior as reported inthe audit data is normal with respect to past or acceptable behavior characterized byspecific intrusion-detection measures. A measure is an aspect of a subject�s behavior onthe target system, and is applied to individual subject activity.
This section lists all the measures we are currently using in the IDES statistical compo-nent. Not all measures will apply to all target system types (for example, the measurefor window commands would be an irrelevant measure for a target system without anywindow-management facilities). The statistical anomaly component has a mechanism toinactivate such measures as needed.

51The Statistical Anomaly Detector
5.3.1 User Measures
As described in Section 5.1, the statistical measures have been classified into four groups:ordinal, categorical, audit record distribution, and activity intensity. Below we list thesemeasures, which can be monitored for a user subject type on the target system accordingto their classification:
1. Ordinal
CPU Usage. Indicates the amount of CPU usage by a particular user. Thevalue recorded is the delta of CPU seconds between the last audit record andthe current one observed for this user.
I/O Usage. Indicates the amount of I/O usage while the user is on the system.I/O activity can be either disk accesses or characters typed at the terminal,depending on the target system and its capabilities to track either one.
2. Categorical
Physical Location of Use. Records the relative number of times a user connectsto the target system from different locations - host name, modem number, ornetwork address.
Mailer Usage. Records the relative number of times various mailers are usedby the user.
Editor Usage. Records the relative number of times various editors are usedby the user.
Compiler Usage. Records the relative number of times various compilers areused by the user.
Shell Usage. Indicates the relative number of times various shells and pro-gramming environments are invoked by the user.
Window Command Usage. Indicates the relative number of times differentwindow commands (such as opening a window, closing a window) are invokedby the user. This measure applies only to target systems that support win-dowing environments.
General Program Usage. Indicates the relative number of times each programis used by the user. These programs include those that are in the specialcommand measures (e.g., mailers, compilers). The measure is categorized byprogram names, and it is important that the actual program name, ratherthan any aliases, is specified by the security officer.
General System Call Usage. Indicates the relative number of times a systemcall is invoked by the user, categorized by system call names. System calls arelower-level functions that are generally invoked by higher-level programs (i.e.,not directly by the user).

52 The Statistical Anomaly Detector
Directory Activity. Records the relative number of times a user does somethingto a directory, categorized by the type of activity (e.g., create, delete, read,modify).
Directory Usage. Records the relative number of times a user accesses a di-rectory on the system, categorized by directory names.
File Activity. Records the relative number of times a user does something toa file, categorized by the type of activity (e.g., create, delete, read, modify).
File Usage. Records the relative number of times a user accesses a file withinthe system, except for temporary files, categorized by file names.
User IDS Accessed. Indicates the relative number of times a user changes userID.
System Errors by Type. Records the relative number of times each type oferror occurs.
Hourly Audit Record Activity. Records the relative number of audit recordsreceived for each hour, categorized by the hours of the day.
Day of Use. Records the relative number of audit records produced by theuser on a daily basis, categorized by the days of the week.
Remote Network Activity by Type. Records the relative number of individ-ual network-related activities performed by the user, categorized by network-activity type (e.g., remote logins, ftp, remote shells).
Remote Network Activity by Hosts. Records the relative number of network-activity records a user produces for each remote host, categorized by hosts.
Local Network Activity by Type. Records the relative number of differenttypes of local network activity performed by the user, categorized by network-activity types.
Local Network Activity by Hosts. Records the relative number of local-network-activity records produced by a user for individual hosts, categorized by hosts.
3. Audit Record Distribution.
For each of the above measures (categorical and ordinal) there is a correspondingcategory (or activity type) in the audit record distribution measure. For example,the category corresponding to the CPU measure is �audit record indicated that theincremented CPU usage was greater than zero.� The category corresponding tothe �file usage� measure is �audit record indicated that a permanent file has beenread.�
In addition, we have added the following category, which is not directly associatedwith a measure.

The Statistical Anomaly Detector 53
Temporary File Accessed. Records if a temporary file was accessed by the user.Temporary files are those created and used during an execution of a program,and removed after program completion.
4. Activity Intensity Measures. We currently are using the following three auditrecord intensity measures (rate of audit records in a given time frame):
Volume per Minute. Number of audit records processed by a subject in a timeperiod with a l-minute half-life.
Volume per 10 Minutes. Number of audit records processed by a subject in atime period with a lo-minute half-life.
Volume per Hour. Number of audit records processed by a subject in a timeperiod with a l-hour half-life.
While our development and testing so far have been primarily on user subject types, IDESis by no means limited to this particular type of subject. Measures for other types, suchas target systems and remote hosts, can also be monitored. The next two subsectionslist a variety of measures that will be used in subsequent versions of IDES for differentsubject types.
5.32 Target System
These measures describe the behavior of the target system - that is, the system beingmonitored:
CPU Usage (ordinal). Records the amount of CPU time used on the target system.The �delta� values used are the increments in overall CPU time used by all subjectson the system.
I/O Usage (ordinal). Records the amount of I/O used on the target system. Thedelta values used are the increments in overall I/O calls used by all subjects on thesystem.
Hourly Bad Login Attempts (categorical). Records the relative number of bad loginattempts made on the target system during each hour, categorized by the hours ofthe day. This measure is intended to track the times during the day that bad loginattempts are usually common/uncommon.
Target System Errors by Type (categorical). Records the relative number of errorsof different types made on the target system, categorized by error types.
54 The Statistical Anomaly Detector
Hourly System Errors (categorical). Records the relative number of errors thatoccurred on the target system during each hour, categorized by the hours of theday. It is intended to track the times during the day that system errors are likelyto occur.
Network Activity by Type (categorical). Records the number of individual networkactivity-related audit records produced on the target system, categorized by net-work activity types.
Network Activity by Hosts (categorical). Records the number of network activityaudit records the target system produced for a particular host, categorized byremote hosts.
As in the user subject measures, the audit record distribution measure encapsulates allof the categorical and ordinal measures defined above (does not include activity intensitymeasures).
5.3.3 Remote Host
Remote host subjects are nonlocal machines that can connect to the target system vianetwork communications. Remote hosts are not necessarily being monitored themselves,but their behavior with respect to the target system can be observed using the followingmeasures:
User Accounts from the Remote Host (categorical). Records the relative number oftimes a user account is accessed on the target system from the remote host subject,categorized by account names. This measure is intended to track how often anaccount on the target system is used from some outside host.
Activity Type Count from the Remote Host (categorical). Records the relative num-ber of different types of network activity (as designated by the port number) thatoriginated from the remote host subject, categorized by the network-activity type.
Hourly Use from the Remote Host (categorical). Records the relative number ofnetwork-activity audit records received each hour from the remote host subject,categorized by the hours of the day.
Hourly Use by Type from the Remote Host (categorical). Records the relative num-ber of network-activity audit records of each type received each hour from theremote host subject, categorized by the hours of the day and the type of networkactivity.

The Statistical Anomaly Detector 55
Bad Login Attempts from the Remote Host (categorical). Records the relative num-ber of bad login attempts made from the remote host subject. It keeps track ofbad login attempts coming in from each particular remote host.

56 The Statistical Anomaly Detector

Chapter 6
The IDES Expert System
The rule-based component of IDES evaluates user behavior by evaluating events (auditrecords) using a set of rules. These rules describe suspicious behavior that is based onknowledge of past intrusions, known system vulnerabilities, and the installation-specificsecurity policy. The user�s behavior is analyzed without reference to whether it matchespast behavior patterns. In effect, the rules in the rule-based component constitute a min-imum standard of behavior for users of the host system. While the statistical anomalydetector attempts to define normal behavior for a user, the rule-based component at-tempts to define proper behavior, and to detect any breaches of etiquette.
The IDES rule-based component operates in parallel with the statistical component.It is loosely coupled in the sense that the inferences made by the two subsystems areindependent. The rule-based detector and statistical anomaly detector share the samesource of audit records and produce similar anomaly reports, but the internal processingof the two systems is done in isolation. (In the Next Generation IDES we plan to introducea resolver to combine and further post-process the outputs of the two components.)
The knowledge base of the rule-based component contains information about knownsystem vulnerabilities and reported attack scenarios, as well as our intuitions aboutsuspicious behavior. We have obtained information about known system vulnerabilitiesthrough discussions with members of CERT (Computer Emergency Response Team) atCarnegie Mellon University�s Software Engineering Institute and other members of thecomputer security community. Not all of the information we obtained in this fashion hasbeen incorporated into the rule base; see below for a discussion of our experiences in thisarea.
The rule-based component can be vulnerable to system deficiencies and intrusion scenar-ios that are not in its rule base. For this reason, it is important to update the system asthese vulnerabilities come to light. Apart from this, our expectation is that the statisticalcomponent is likely to find new intrusion scenarios unusual enough to trigger an anomaly.
57

58 The IDES Expert System
IDES is thus a system containing complementary approaches, each of which helps coverthe vulnerabilities of the other.
The IDES rule-based detection component is a rule-based, forward-chaining system usingthe Rete algorithm. By �forward-chaining� we mean that the system is driven by the factsthat are put into the knowledge base, as opposed to being driven by goals that the userstates. When a new fact appears, the system makes all the deductions it can about thatfact. This way of driving deduction fits in well with an event-driven system like IDES.Each IDES audit event becomes a fact that gets asserted into the knowledge base. Thisassertion causes the rules to be applied to the new fact and whatever other facts are inthe knowledge base.
We produce the executable system by writing a rule base that is translated into C lan-guage code using the PBEST (Production-Based Expert System Tool) translator. Thesyntax for the rule-specification language is relatively easy to master; the use of a trans-lator instead of an interpreter improves the performance of the resulting system.
We have included a draft manual for PBEST as an appendix to this report. This manualdescribes the tool in more detail, including information on how it works, how to write rulebases for it, and how to incorporate the resulting rule-based engines into larger programs.
Early development effort on the rule-based component focused on the following areas:
Interactive Interface. PBEST can optionally produce an expert system with awindow-based interactive interface. This interface uses the IDES User InterfaceLibrary, which is based on the X Window System. The interactive interface cur-rently supports free running, single stepping, breakpoints, tracing, and assertionand negation of facts. It maintains a display of the current state of the knowledgebase during execution. It also gives information about the conflict-resolution mech-anism, showing which rules can fire and which facts make the rule eligible to fire.The interface lists the firable rules in the order of firing priority.
Memory Management. We have incorporated a garbage-collecting memory allocatorinto PBEST. Besides simplifying the memory management problem, this memoryallocator helps the overall performance of IDES by bounding the working set of therule-based component process and limiting fragmentation. That is, we are able tospecify that the memory allocator should create a memory area of a certain size anduse only that memory until it can no longer reclaim enough memory by garbagecollection to continue. The allocator will then expand its memory area. We havefound that in practice the rule-based components we have made to process FBIdata will run forever (e.g., process millions of audit records) without expandinga l-megabyte heap. By tuning the initial heap size, we can find a good tradeoffbetween time delays due to garbage collection and time delays due to paging. Inaddition, since the garbage collector uses a specific area of memory for its heap, it

The IDES Expert System 59
will not scatter small areas of free memory throughout the process address spacein the course of asserting and negating facts.
GLU Implementation. We have brought up a version of the rule-based componentthat will run under GLU. Chapter 8, describing the IDES version of GLU, discussesour work in this area.
Rule Base. Most of our early effort in developing a rule base had gone into creatingone for the FBI�s IDES system.
Recent effort on the rule-based component has involved creating a UNIX-specific rulebase, exercising it, and modifying it in light of our experiences. We currently have 42rules, of which six are used for interface purposes. The primary areas we have been ableto monitor with this component are logins, user privilege, and file access.
The rule-based component attempts to detect programmed login attacks by keeping trackof bad login attempts and creating alerts when several bad login attempts occur withoutan intervening successful login attempt. The rule base also distinguishes between remoteand local logins, creating low-level alerts when it sees remote logins. Several rules alsocreate alerts when remote users do certain things. For example, the rule base attemptsto detect leapfroggers. A leapfrogger is a remote user who uses a given system to accessother systems with the intent of concealing his or her identity from system administratorswho want to find out who it was that was really accessing their systems. The system alsoattempts to detect users outside of the local network who attempt to mount filesystemsresiding on the local system.
The rule base also incorporates rules that attempt to detect when a user gains unautho-rized privileges. It does this by comparing the audit user ID, which is guaranteed by theauditing system to remain constant for the life of the session, with the current user ID,which can change through the use of �setuid� system calls. Usually, a user who suddenlystarts executing programs with a current user ID different from the audit user ID hasobtained unauthorized privileges; the rule base notices this and creates an alert.
Currently, the rule base monitors some types of file access, such as modifying the automat-ically executed shell scripts belonging to another user. These shell scripts get executedwhenever the user logs in and can thereby be used to plant Trojan horse programs. Inits present state, the rule base creates an alert whenever a user creates or modifies anysuch shell scripts in directories other than his or her own.
As mentioned above, we have been unable to make use of all the information we haveobtained about UNIX system vulnerabilities. This is primarily due to shortcomings in theauditing system. We have discovered shortcomings that are pertinent to the rule-basedcomponent:
Command-line Arguments. The auditing system does not report, the arguments that

60 The IDES Expert System
are given to a program when it is invoked. This prevents us from detecting severaltypes of vulnerabilities. For example, there is a vulnerability in some versions ofthe sendmail program that can be exploited when it is given -C as a command-lineargument. In addition, the find command can be used in many ways to attemptto compromise security; none of these methods can be detected without looking atthe command-line arguments given to the find command when it is executed.
Program Termination. The auditing system does not report process termination.This means that we cannot determine when a program stops running. If we at-tempt to do deduction on a per-program basis, we need to know when the programhas terminated and the information about the program can be discarded.
It turns out that we can obtain program termination information from accountingfiles on the system. However, there are two problems with using this source ofinformation. First, due to race conditions we often receive the report of the pro-gram�s termination before getting the report of the program�s execution, especiallyfor small programs that execute rapidly. Handling this properly will require ex-tra cumbersome mechanism in the rule base. Second, the accounting files do notidentify the termination of shell scripts. When a shell script executes, the auditingsystem reports the invocation of the shell script, but the accounting system reportsthe termination of the shell under which the shell script was run. For example, theauditing system will report the execution of the command /bin/arch. When itterminates, the accounting system will report the termination of the program sh.Since many shell scripts run under sh, there is no easy way to figure out whichshell script is terminating. In general we have found it very difficult to correlatethe audit information with the accounting information. This has the effect bothof making it hard to detect intrusions (since certain kinds of shell scripts can be amajor vulnerability) and of causing the knowledge base to grow, since it is hard towrite rules to remove unneeded facts that work for every case.
We have run the rule-based component extensively. We have used it as part ofIDES to monitor three workstations running full Sun C2 auditing along with thenews/mail/ftp/dialin server auditing just accounting (program execution) and lo-gins/logouts. We have seen no problems with throughput running on a Sun 3-260 work-station. The realm interface causes the two components to run at the speed of the slowestcomponent; the rule-based component, which currently does no floating-point arithmetic,is about ten times faster than the statistical component and thus is not the limiting factoron throughput. Its speed is proportional to the number of rules. There is therefore a lotof room for expansion, both of rules and monitored workstations, even running on Sun 3hardware. Our major limiting factor in running IDES has not been throughput on theIDES machine; it has been finding people willing to be monitored.
The rule-based component does detect what it is programmed to detect. It producesalerts that are indications that, for example, a user has obtained root privilege or modified

The IDES Expert System 61
login scripts. We have also detected unusual events, such as remote logins to our ftp serverfor very short periods of time (less than 10 seconds). Major shortcomings have been inthe area of scope. We are unable to detect some intrusions because the auditing systemdoes not produce the necessary information. We are unable to detect others because wedo not yet know how they are done.
In the future, we expect to overcome the auditing system problems either by cooperatingwith the vendor to enhance the system or by modifying it on our own. We expectto continue our knowledge-engineering efforts to extend the ability of the rule-basedcomponent to detect new intrusions. We also plan to make the following enhancementsto PBEST:
Adding and removing rules while the system is running
Backward chaining
Better performance profiling
Improved programming environment
Improved run-time user interface for noninteractive systems.

62 The IDES Expert System
Chapter 7
The IDES User Interface
This chapter describes the design and implementation of the user interface componentof IDES. In particular, two types of user interfaces have been implemented: the securityofficer�s interface, which assimilates the output of the anomaly detector units, and a setof analyst tools used for experimentation and testing of the IDES statistical component.
7.1 Design Concepts
The goal of the IDES user interface is to satisfy several types of users whose responsibili-ties vary from high-level analysis of abnormal behavior to the maintenance of the system.We have identified these types as follows.
Users who need to be informed of any abnormal behavior on a targeted system inas close to real time as possible
Users who must rapidly assess the severity of an anomalous condition and actaccordingly
Users who can define and/or modify the characteristics of normal behavior for aparticular subject or group of subjects; these would include definition of statisticalmeasures and expert-system rules
Users who may want to make random queries to the data, perhaps to validatedifferent intrusion-detection methods, or for troubleshooting the system
Users who may wish to do a historical analysis of events, for example, to build acase against a misuser of the target system
Users who must install and maintain the IDES system.
63

64 The IDES User Interface
The design provides a user environment that incorporates some of the innovative conceptsof information display, and represents an integrated and consistent view of the IDESinformation. This section presents some of our ideas that were implemented.
7.1.1 IDES User Environment
IDES users are categorized into the following three classes:
Security Officers (SOS) are users who are normally watching out for target system in-trusions, that is, they are considered the IDES �end users.� They are interested inunusual events that occur on the target systems, and examine the IDES processeddata to determine whether or not a given set of observations is truly abnormal.They can also be responsible for maintaining any user profiles, such as vacation orworkhour schedules, or any other information that might contribute to the analysisof abnormal system behavior.
Data Analysts (DAs) understand the methods by which intrusion detection is performed.DAs are interested in either the statistical analysis of IDES or the expert-systemrules used to detect abnormal behavior on the target system (or both). Like theSOS, these users want to be notified if an intrusion has occurred, but their focus ison how the intrusion was discovered as opposed to what the intrusion was.
System Administrators (SAs) are users who are responsible for the system�s maintenanceand performance, constantly making sure that the IDES components are runningas required. They must also understand how the system operates so that they cantune it as needed for efficient processing.
It should be noted that the roles of each user class are not rigid; SOS can exercise systemadministrative duties, and vice versa, and often DAs may be considered specialized SOS.The classification is mainly defined for the purposes of design discussion. Nevertheless,the system can be configured with default access privileges to reflect the principle ofseparation of duties.
While the information available for each class may be different, the data presentationsshould be similar in format to maintain consistency throughout the environment. Thisis done by providing a library of display functions used by each user interface component(see Section 7.3).
There are two ways to invoke the IDES user environment. The IDES machine may beconfigured such that upon logging in, the user is immediately brought into the IDESenvironment. Alternatively, the IDES user environment may be invoked as a commandexecuted from another environment, such as from a window management system or from

The IDES User Interface 65
the operating system itself. In either case, the user may be requested to supply a loginname and password before gaining access to the IDES environment.
The user interface is window based and equipped with menus and mouse control forcommand selection. It is also available from remote sites, as the window system facilityused allows access and invocation of graphical displays from across the network.
To accommodate the classification of user types, the IDES user environment is organizedinto three areas:
IDES processed data consists of all the information that supports the SO and SA duties.These data include audit records, anomalies, user status, and privileges. Thisinformation can be shown in a variety of ways (e.g., graphs, text, lists).
System administration tools support tasks ranging from the installation and configura-tion of IDES to the regular maintenance of the system. The SA is typically con-cerned with the running status of IDES, and needs to be aware of any problemsthat may affect the performance of the system. The IDES environment providesvarious tools to facilitate this role.
General OS functions are initially installed with all IDES environments. These includeprocesses such as a terminal window environment to invoke regular operating sys-tem commands and receive system messages, an electronic mail facility, screenlocking, system logout, and so forth. As the IDES user becomes familiar with theoperating system environment, this list of commands may be expanded to includeother functions and applications. However, if the IDES environment is to be iso-lated from other types of computer work (i.e., the computer is an IDES-dedicatedmachine), then additional functionality should be added with discretion.
Section 7.2 describes the types of data each user class may be interested in, and howsuch information is currently displayed in IDES. Again, it is important to note that theclassification is not rigid, and that any particular user may fall into more than one group.
7.1.2 Display Objects
To maintain consistency within the IDES user environment, it is useful to define a set ofstandard data presentation formats so that the user can view and manipulate data in asimilar fashion regardless of what information is being displayed.
For example, the mouse buttons should invoke the same functions throughout the entireuser environment. A sample arrangement would be to have the right mouse button bringup a menu with options to be invoked, while the left button selects items that are alreadydisplayed on the screen, or confirms a selection that has been made. The middle button

66 The IDES User Interface
might be used to activate window commands, such as moving, resizing, and closing thecurrent window.
Likewise, data displays must be uniform throughout the user interface. Commands anddata results for either system-related information or IDES-specific data should be pre-sented in the same manner.
Data views are static presentations of IDES information, and can be invoked at anygiven time. Information is presented as a �snapshot� of the processed data at a specifiedmoment or period of time. To provide a consistent user interface environment, a standardwindow format is used to display information. Each window contains the following fourcomponents:
The
The
The
The
Selection Criteria subwindow is the section of the data view window that is reservedfor any search parameters the user may want to specify. Some selection criteria maybe mandatory, such as an ID number or a category type; these are labeled so thatthe user can clearly see that such information must be provided before executingthe request (such as boldfacing or highlighting).
Commands subwindow contains various options pertaining to the information being�requested. These functions include commands like HELP, EXECUTE, PRINT,and QUIT. These commands are displayed as items that can be selected with themouse. If a request takes a few minutes (or even seconds) to execute, then thecommand selection is shaded or blacked out to indicate that the request is stillin progress so as not to mislead the user into thinking that his request was notacknowledged by the system.
Display subwindow presents the information as specified by the selection criteria ina list format. This window is scrollable up or down, left or right. In addition,the items in the displayed list in this subwindow are also selectable for detailedinformation. This is done by picking an item in the displayed list with the mousebutton, and then selecting one of the command options to display appropriateparameter information. The detailed information is either displayed in the samedata view window, or a new window is brought up.
Messages subwindow provides a place for status messages to appear, whether pro-duced by the execution of the data view request or from the system itself. Invocationerror messages (such as not specifying enough selection criteria) are also displayedin this window.
Users may often want to see IDES information presented dynamically (i.e., in real time),especially if they wish to track a potential intrusion closely. These interfaces are referredto as monitors. Data monitors are typically graphical in nature, as it is quicker to noteunusual events with visual aids as opposed to reading and interpreting text. The following

The IDES User Interface 67
are some samples of graphical presentations that might be used throughout the IDESuser interface:
Plotted graphs are graphs of events from a given time to the current time, and are updatedfrequently (every minute or less). They indicate trends of activity, and are usefulin tracking down potential anomalous behavior.
Meters indicate the level of activity in the system. They are usually measured in per-centage units; that is, if an activity reaches a maximum allowable state, the meterwill be marked at the l00-percent level. These data monitors help keep track ofthings such as processing rates and data storage usage.
Flashing icons are very effective visual aids to indicate a critical situation or event. Theymay be supplemented with audio mechanisms (e.g., beeps, buzzes) to emphasize theimportance of an anomalous condition. Such monitors are used primarily for eventsthat occur relatively infrequently, but when they do, the user must be notified asquickly as possible.
Data monitors are not limited to graphical displays. Textual presentations are alsoutilized, especially for occasions in which messages are produced to explain a situationin more detail:
Dynamic lists are similar to those lists presented in data views, except that the list scrolls(or redisplays) automatically as the process receives new information.
Message displays are the textual complements to flashing icons. Coupled with a flashingicon, message displays can provide more meaningful information to the user whensomething unusual occurs.
It should be mentioned that data monitors may potentially slow down the performanceof the IDES processing, although usually not significantly. This is because each monitorruns as its own process, and must request data at frequent intervals to maintain a real-time status. (Alternatively, a triggering function could be used to signal these monitorprocesses to notify them of newly arrived information.) Data monitors do not allowadditional querying (i.e., the user cannot pick an item from a dynamic list for detailedinformation). If a user wishes to elaborate on a particular piece of information, then thedata views are to be used.
Ad-hoc queries must also be addressed. These are requests for random data that donot have a predetermined method of execution. This type of query is best supportedby a fourth-generation language (such as SQL) that is generally provided by a standarddatabase management system. However, integrating such a system into the user inter-face would require the users to learn how to write SQL queries, or to use whatever forms

68 The IDES User Interface
interface is supported by the DBMS, hence increasing the difficulty of maintaining a con-sistent user interface overall. Ideas on a more sophisticated interface for ad-hoc queryingare still being sought.
7.2 User Interface Components
This section describes in detail the different user interface components that are builtwithin IDES. We have built a security officer�s user interface, which integrates the outputfrom the statistical and expert system components. We have also implemented a series ofData Analyst tools for the statistical anomaly detector, primarily used by the statisticiansfor algorithm analysis and experimentation.
7.2.1 Security Officer�s User Interface
The security officer must have information ready at hand to quickly track down abnormalsystem behavior once it has been detected. The SO�s primary concern is the occurrence oftarget system intrusions. Once an anomaly is detected and confirmed by the appropriateanalytical engines in the IDES processing environment, the SO is notified by a flashinggraphical object and/or a textual message displayed in a designated section of the screen.
After recognizing the intrusion, the SO will generally want to track down the source ofthe abnormality. Important information for this purpose might include the host on whichthe intrusion occurred (in a multitarget environment), who/what the subject is, and whatother entities were affected. A window can be brought up to show a list of anomaliesthat have been discovered by the system and an indication of the level of severity of eachanomalous record. By picking a particular anomaly in the list the SO may be able totrace the path back to the original audit record(s) from whence the event propagated.In addition, the SO may be able to examine other information that contributed to theanomalous event.
The SO should be able to define various criteria for a set of audit records to be displayed,such as the subject type (user, target system, remote host) and identification number,time period in which they were recorded, and records received from a particular host.
The SO may also wish to actively monitor a particular subject (due to observationor notification of previous suspicious behavior). An activity monitor can be used todynamically display a list of activities (perhaps a permuted representation of each relevantaudit record) for that subject as each audit record gets processed and incorporated intothe IDES processing environment.
The IDES security officer user interface (SOUI) is a real-time display that allows the SOto monitor active users on the target system, and at the same time provides alerts to

The IDES User Interface 69
signify anomalous events. Such events are either known security violations that have beentraced by the expert system, or a significant threshold of abnormal behavior as detectedby the statistical analysis component. The SOUI also provides a means for the SO toclosely examine and analyze suspect behavior by retrieving a range of audit records (fora particular user) that potentially contributed to the abnormal/illegal use of the targetsystem.
Main SOUI Window
The main window of the SOUI displays a list of active subjects. When a new subjectenters into the target system, its name appears in the window, as does a host nameif the subject is remotely logged in to the target system. The sequence number andtimestamp of the most recent target audit record for each subject is constantly updatedand displayed in this window, giving the SO an indication as to how much and howrecently a subject has been active on the target system.
Also displayed in the main window is a statistical score value sent from the statisticalanomaly detector (see Chapter 5 for details on what this score value means), and it isalso updated regularly.
The SO may delete any subject from the main SOUI window, especially as the list ofsubjects grows to a large number and certain subjects may no longer be active. This maybe done by selecting the subject in the list with the mouse to highlight that entry, andthen selecting the DELETE option in the command box of the window. However, if agraph window is currently being displayed for this subject, the name will not be deletedfrom the list. Figure 7.1 shows a sample display of the main SOUI window.
Finally, the bottom-most view of the SOUI main window is reserved for informationalmessages to the SO. Typical messages are operational errors, such as the SO�s tryingto delete a subject from the list while its anomaly graph is still being displayed, ormiscellaneous status data, such as a subject�s logging in to the target system from aremote host (message sent by the expert system).
Online help is available at each window level, and can be selected by clicking on theHELP button in the command box.
Anomaly Graph Window
The SOUI has a subwindow that can be displayed to view the trend of statistical scoresthat have been produced by each subject. As each audit record is processed for a subject,a score value is produced, and this score value is plotted in real time onto a graphsubdivided into four quadrants. These quadrants currently represent the log base 10value of the scores; that is, the first quadrant (bottom level) represents values between

70 The IDES User Interface
Figure 7.1: SOUI Main Window
0 and 10.0, the second quadrant represents values between 10.0 and 100.0, and so forth.The intent of this subdivision of values is to distinguish �yellow zone� scores from �redzone� ones, allowing the SO to easily view when a subject is approaching a critical levelof abnormal behavior (as indicated by the score values). A sample display of the anomalygraph window is shown in Figure 7.2. The score ranges within these zones still need to bedetermined as more experiments are done with the statistics. As a future enhancement,the zone definitions will be made to be flexible and configurable.
The SO can also select any portion of the displayed graph by using the mouse. If theaudit record archiver process is turned on, then another display window containing a listof audit records pertaining to that selected portion of the graph will be shown. Thisenables the SO to trace a portion of a subject�s activity that contributed to the scoregraph indicated.
Other features at this window level include printing a hardcopy of the graph, and arefresh option to start the graph.

The IDES User Interface
Figure 7.2: SOUI Anomaly Graph Window
Alert Windows
Alert windows are currently divided into two criticality levels. Level 0 is the most criticallevel, and takes up the top half of the alert window. Level-l alerts are usually justwarnings, letting the security officer know that something unusual may happen.
These alert windows appear automatically, with a flashing background to attract the SO�sattention. The SO must acknowledge the alert window for the flashing to discontinue.This is done by clicking on the ACKNOWLEDGE button in the command box. Thiswindow remains in existence, and each time a new alert comes in, the flashing occurs.
Alert windows are triggered when one of the following events occurs:
The score value for a subject reaches a specified threshold value. When the scorevalue approaches the red zone, then the warning level of the alert window flashes.When the score value reaches or exceeds the threshold value, the critical section ofthe alert window is triggered.
A subject is traced to a leap frog event - that is, when a user has logged in to onehost to log in to another host. This is a warning-level message only.
A subject has touched his .login file, which triggers a critical-level alert.
Future plans for the SOUI will include the following features.

72 The IDES User Interface
More detail on the cause of an alert
Display of archived records for the statistics
Journal of anomalous events, which would involve standardizing the format thatrepresents anomalies.
7.22 Data Analyst Information
A Data Analyst (DA) is generally interested in the anomaly-detection components ofIDES (i.e., the statistical module and the expert system).
Statistical profiles retain accumulated information about a subject�s behavior on the tar-get system. The DA who is interested in the statistical analysis of anomaly detection canview such information. These data include measures that are actively being monitoredfor each subject, various statistical data for both discrete and continuous measures, anda set of current (for that day) and historical (accumulated over a period of time) profilesof a subject�s behavior.
Some examples of expert-system information that might be interesting to the DA are therules that were applied to detect anomaly and backtracking of rule path followed by thesystem. Some of this capability is described in detail in Chapter 6.
Data analysts may also want to replay some data to test the accuracy of the anomaly-detection units. Hence, the tools used by the SO users may also be used by the DAs toconfigure and tweak at various parameters for experimentation.
We have implemented three such user interfaces for the data analyst, in particular forthe statistical component. Details are described in the following subsections.
Peek
The peek program is a tool used for the analysis of subject profiles. Most of the in-formation presented is meaningful only to data analysts (particularly statisticians) withcomprehensive knowledge of the algorithms used in the IDES statistical component, andis generally not much use to the general security officer. See Figure 7.3 for a sample peekdisplay. Peek has been used primarily for algorithm debugging and testing.
The main window of peek shows a list of subjects whose profiles are available for browsing.Each subject has two sets of profiles, one for normal work usage (weekdays) and anotherfor weekend/holiday use; either one of these profiles may be selected for viewing. Thesubject profiles are represented as a variety of probability vectors and matrices, and aredisplayed in this manner. Again, unless one is familiar with the algorithms used for

The IDES User Interface 73
statistical anomaly detection, most of this information may seem rather cryptic to theaverage user.
Peek: can run interactively with the active IDES statistical component by sending signals(propagated by the user) to the statistical unit to request dumps of the latest profileinformation that has been accumulated in the process cache.
Figure 7.3: Peek Selection Window
Scdist
The scdist program collects the cumulative score values for each subject and sorts theminto range bins. It is like a spreadsheet of score information, enabling the DA to view asummary of the score trends produced by a particular subject. This tool is used often forexperimentation of the statistical component, to see if the tweaking of various statistical

74 The IDES User Interface
parameters will affect the value of the T2 scores. Figure 7.4 shows an example of anscdist display.
The ranges of the score values can be modified to be larger or smaller, depending on howfine the user wishes to view the distribution. Scdist can be run in automated mode, wherethe score distribution display is updated every 10 seconds. A snapshot of the currentdistribution can be taken any time, and either be saved into an ASCII formatted file orsent directly out to a printer.
2407 554
0
Figure 7.4: Scdist Display Window
Statconfig
The statistical anomaly detector runs based upon a particular configuration of statisti-cal parameters. This information can be modified by the SO or DA via the statisticsconfiguration program (statconfig), which is a graphical interface to the configuration file.
Three types of parameters are currently used by the statistical program: user measures,command classes and system parameters. Once modified, these parameters are used in

The IDES User Interface 75
15161718
2425
0.0
1000.0 1000.0
0.0 1000.01000.0
0.0 0.0
Figure 7.5: Statconfig Program (measure modifications)
the next invocation of the statistical component.
The configuration file contains a list of all possible measures that can be used by thestatistical component (see Chapter 5 for a detailed description of these measures). Theuser can modify a variety of characteristics for any measure, such as activating or deac-tivating it, reclassifying its type and/or description, or changing its contributory weightor scalar values for the statistical algorithms (these latter items are particular to thestatistical algorithms and probably would not be changed directly by the SO). Changescan be made easily by selecting on the appropriate measure and filling in the properinformation (see Figure 7.5).
A variety of statistical parameters can be modified by the SO or DA, allowing the sta-tistical component to be tuned for a particular scenario or set of users. Currently, thefollowing items can be modified:
Audit Record Half-life. This parameter determines the half life of audit records processedfor each subject.
Profile Half-life. This parameter is the subject profile half-life, represented as a numberof days.
Correlation Cutoff. This value is used by the profile updater to determine how close thecorrelation of measures should be (used only if a correlation matrix is used).
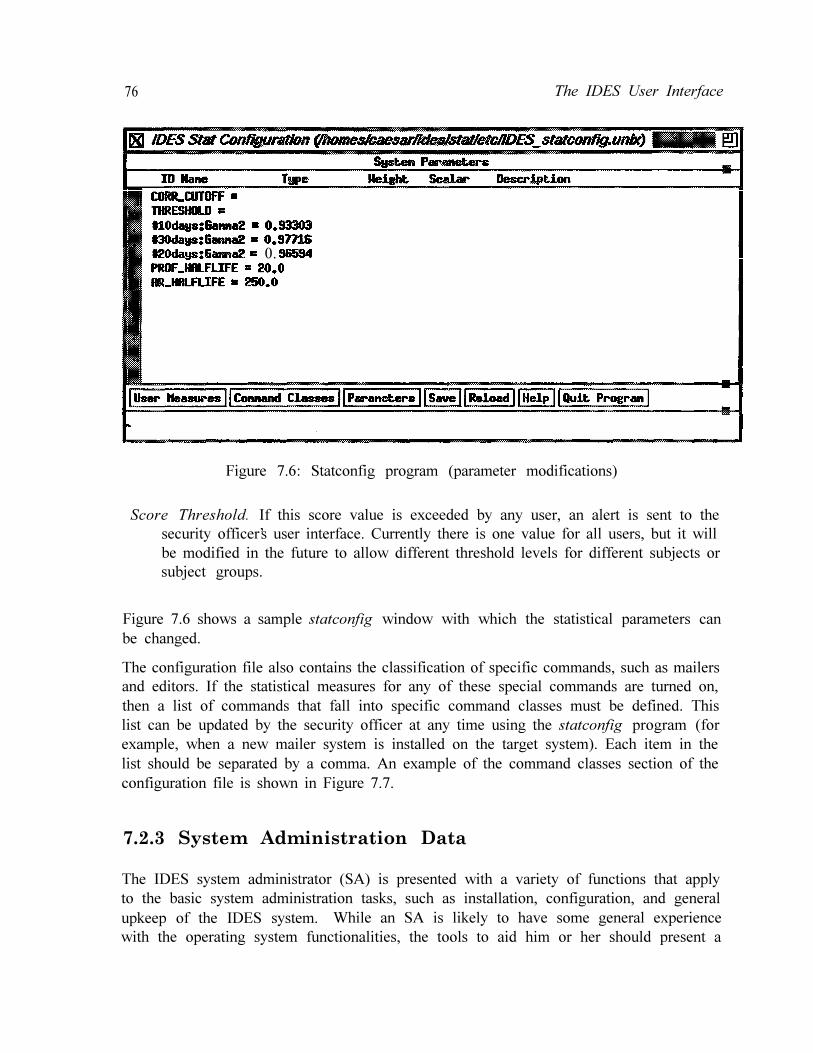
76 The IDES User Interface
0.
Figure 7.6: Statconfig program (parameter modifications)
Score Threshold. If this score value is exceeded by any user, an alert is sent to thesecurity officer�s user interface. Currently there is one value for all users, but it willbe modified in the future to allow different threshold levels for different subjects orsubject groups.
Figure 7.6 shows a sample statconfig window with which the statistical parameters canbe changed.
The configuration file also contains the classification of specific commands, such as mailersand editors. If the statistical measures for any of these special commands are turned on,then a list of commands that fall into specific command classes must be defined. Thislist can be updated by the security officer at any time using the statconfig program (forexample, when a new mailer system is installed on the target system). Each item in thelist should be separated by a comma. An example of the command classes section of theconfiguration file is shown in Figure 7.7.
7.2.3 System Administration Data
The IDES system administrator (SA) is presented with a variety of functions that applyto the basic system administration tasks, such as installation, configuration, and generalupkeep of the IDES system. While an SA is likely to have some general experiencewith the operating system functionalities, the tools to aid him or her should present a
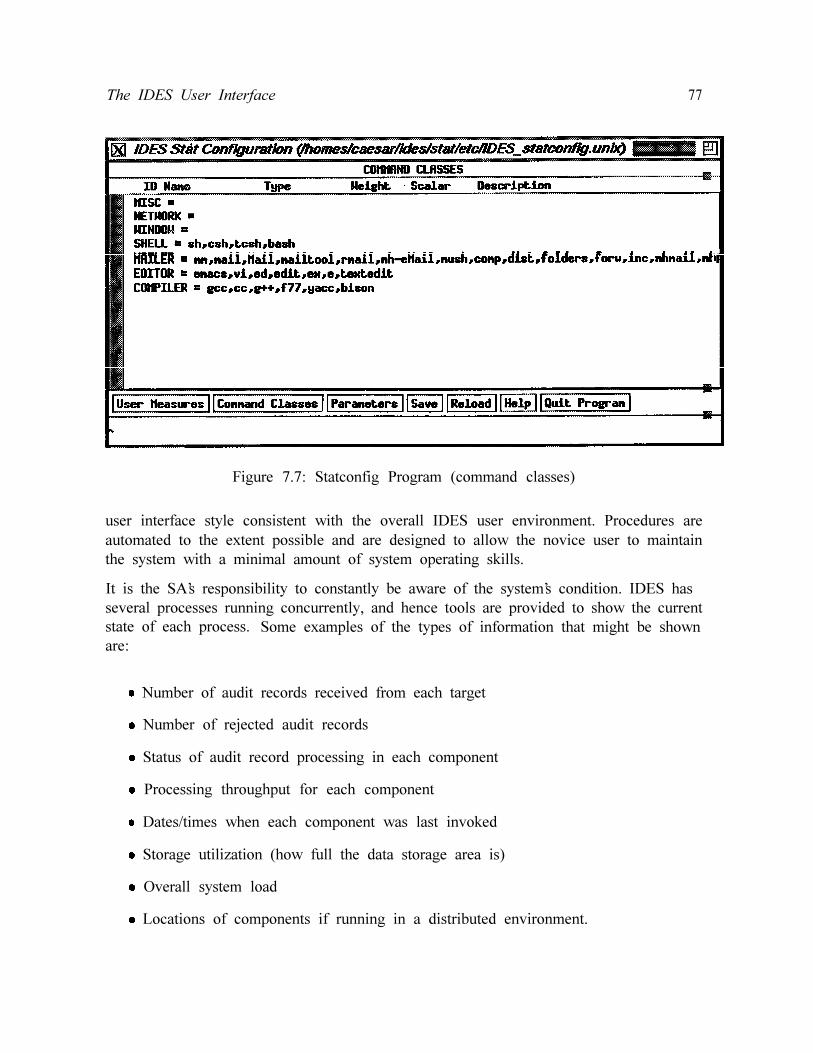
The IDES User Interface 77
Figure 7.7: Statconfig Program (command classes)
user interface style consistent with the overall IDES user environment. Procedures areautomated to the extent possible and are designed to allow the novice user to maintainthe system with a minimal amount of system operating skills.
It is the SA�s responsibility to constantly be aware of the system�s condition. IDES hasseveral processes running concurrently, and hence tools are provided to show the currentstate of each process. Some examples of the types of information that might be shownare:
Number of audit records received from each target
Number of rejected audit records
Status of audit record processing in each component
Processing throughput for each component
Dates/times when each component was last invoked
Storage utilization (how full the data storage area is)
Overall system load
Locations of components if running in a distributed environment.

78 The IDES User Interface
SAs must also control the system�s functions, such as initializing or terminating IDESprocesses. Although most of the IDES processes are automatically started either duringthe installation process or by another process, there are occasions (such as for systemmaintenance purposes) when any of these must be temporarily halted and later restarted(manual override). There are also situations (although rare) when a process may termi-nate abnormally and require a manual startup.
The SA may use the archiver process to handle most of the storage hygiene procedures,such as purging old data from the system. Explicit instructions will be provided andautomated wherever possible to minimize the number of steps the system administratorneeds to take to execute these procedures.
The SA is also responsible for the installation of IDES, and the process should be simpleand straightforward. The user interface should carefully guide the installer to ensure theproper sequence of events, and also allow backtracking of steps in case something hasbeen overlooked or cannot be started properly. There should also be an internal checklistof parameters to make sure everything has been installed correctly.
While configuration is part of the installation process, it may also be applied duringsystem execution. Configuration commands should allow the creation and modificationof user-definable parameters in IDES (for example, which measures to observe), definitionof expert-system rules to be triggered for anomaly detection, setup of location maps forprocesses residing in a distributed environment, and indication of realm-specific referencesto processing components.
At this writing, we have implemented a few programs that are currently being usedprimarily as diagnostic and debugging tools for the realm interface components. As afuture task, our plan is to convert these tools into a graphical user interface, thus makingit more usable by an SA or SO who will be responsible for installing and configuring theIDES system for a particular environment.
7.3 IDES User Interface Library (libiui)
We elected to use the X Window System to implement the IDES user interface. It isportable, has remote viewing capabilities, and provides a wide variety of programmingtools to build one�s own catalog of viewing objects. A set of IDES data objects wasimplemented and incorporated into a software library that any IDES component requiringa user interface can use. This is the IDES user interface library, or libiui.
Libiui assumes a hierarchical, object-oriented interface to the underlying windowing sys-tem. It is based upon the concept of windows and views, with a view being a section of awindow that can be manipulated as a unit. A view with more than one child is called acomposite view, and the location and size of each child is controlled by the parent view.

The IDES User Interface 79
Some composite views treat all children equally, while others allow the application tospecify certain constraints for each child view. Examples of constraints are read/write-only capability, mandatory input, position in a larger view, and boldface or highlightingcharacteristics.
The following views have been defined as the set of IDES data objects.
Stack views are composite views that stack their children vertically. The children havethe same width as the parent view, and their vertical area is divided according tothe constraints that have been set for them.
Box views arrange their children in order, from left to right, top to bottom. The boxplaces as many children left to right on a line as will fit, then moves down to thenext line.
Scroll views have exactly one child. The child view may be larger than the parent view,which would then allow the user to scroll either vertically or horizontally to see theentire child window. Scroll views are equipped with scroll bars along the sides andbottom of the window.
Label views display a line of text. They are generally used to tag fields or provide headersfor columns.
Button views respond to mouse clicks by calling a function passed in by the application.
Toggle views look like button views, but remain highlighted until clicked again.
Question views allow a user to respond to amouse-driven text-editing interface to
given question. Theenter in a response.
user is given a standard
Multiple Choice views come in two flavors: one presents a list of all the choices simulta-neously, while the other shows the choices one at a time (scrolls through the field).In both cases, only one choice can be selected.
List views display lists of information to the user. The user can scroll vertically orhorizontally through the list, if the data cover more than the available screen space.Items in the list can be selected and functions invoked as specified by constraintsdefined by the parent view.
Message views display messages, such as statusscrollbar is included for long-winded text.
and error messages, to the user. A
Graph views are also called strip charts, and visually represent a history of some event(s).Graph views can be displayed in two modes: display mode shows a graph thatis continuously moving, while selection mode is a snapshot representation of aparticular moment in time. The user is allowed to pick out a region of the graphin selection mode and invoke a user-defined function.

80 The IDES User Interface
Meter views may be represented as bars or in �speedometer� style (type of scale with apointer indication measure amount).
These views have been implemented and are used by the IDES user interface componentsdescribed in the previous section.

Chapter 8
GLU
One of the main goals of the IDES prototype is to detect and report anomalous activitiesas they occur despite partial failures and while accommodating changes in the volumeof audit data being processed. This chapter describes how this important system goal isrealized. First, the specific system requirements for the IDES prototype are identified.Next, we justify the use of a multiprocessing methodology to meet the requirements.We then describe a platform for multiprocessing (called GLU for Granular Lucid) anddiscuss its capabilities. Finally, we present the structure of the IDES prototype on theGLU platform and consider how well it meets the requirements.
8.1 System Requirements
The IDES prototype has to satisfy the following system-level requirements.
1. Detect anomalous activity as, or soon after, it occurs. This is the soft real-timeprocessing requirement.
2. Continue to detect anomalous activity despite partial failures of the prototype,albeit with degraded performance. This is the fault-tolerance requirement.
3. Accommodate increased amounts of activity by proportional hardware additionwithout compromising soft real-time processing or fault tolerance. This is thescalability requirement.
81

82 GLU
8.2 The Multiprocessing Approach
An approach to meeting the above requirements is to rely on specialized technology. Bychoosing a customized system that is sufficiently fast, fault tolerant, and easily expand-able, the three requirements can be met. This approach has the following drawbacks.
1. A substantial and nontrivial programming effort would be needed to implementIDES on the chosen system so as to satisfy all three requirements.
2. The peculiarities and limitations of a given system often become evident only afterconsiderable time and cost.
An alternative approach is that of multiprocessing, in which current off-the-shelf tech-nology is used to meet all three requirements. Multiprocessing refers to the use of severalcommunicating autonomous computers to execute a single application such as IDES.With the multiprocessing approach, speed is achieved by exploiting natural implicit par-allelism in the activity instead of using fast hardware technology. The multiplicity ofprocessors, storage, and communication components facilitates detection and recoveryfrom failures of some components. Scalability is achievable because a multiprocessingsystem can be easily expanded and its performance, should scale proportionally.
We have adopted the multiprocessing approach to meet the requirements of the IDESprototype. While the underlying multiprocessing system is simple in its architecture - forexample, a network of conventional workstations - the methodology to map an applica-tion onto this system is novel. A key aspect of a successful multiprocessing methodologyis the extent to which the mechanism and architecture of the methodology are hiddenfrom the applications (in this case the components of the IDES prototype) they support.In our opinion, this not only reduces programming effort and enhances portability, butit enables the IDES prototype to fully meet the requirements.
8.3 GLU: A Software Platform for Multiprocessing
The multiprocessing software platform called GLU [24,25,26] allows for development andimplementation of IDES on a multiprocessing system such as a network of workstations.The methodology allows the following concerns to be hidden from the application (IDES).
Multiprocessing system architecture
Explicit creation and management of parallelism
Explicit detection and recovery from partial failures.
The platform consists of the programming model and the execution model.

GLU 83
8.3.1 GLU Programming Model
A GLU program is a dataflow graph whose vertices denote functions and whose edgesdenote data dependencies between functions. A function is either predefined or it isdefined by the programmer in a procedural language such as C. Note that issues of howto exploit parallelism and how to react to partial failures are hidden from the GLUprogram.
Operationally, a GLU program should be viewed as a mapping from a set of inputsequences of values to an output sequence of values. Each edge denotes a sequenceof values and each vertex denotes a function that consumes its incoming sequences togenerate its output sequence of values. Each edge value is referred to by the name of theedge and its context, which is the conceptual position of the value in the edge sequence.
The context can be viewed as an n -tuple of integers that uniquely identifies a valueof an edge. When the context is n -dimensional, the sequence associated with an edgecorresponds to a set of values in an n -dimensional space.
The dataflow graph can be expressed in a simple, equational language as a set of equa-tions. The expressiveness of the language is illustrated by describing the expert systemin it (see below and Figure 8.1).
// constants#define BLOCK_SIZE 2000#define MN_BUNDLE_SIZE 128
// data structure definitionsstruct ar_record
{char rec[ar_len];struct ar_record *arp_next;
};typedef struct ar_record *AUDIT_RECORD;
struct bt_entry{ AUDIT_RECORD arp_first;
AUDIT_RECORD arp_last;int bsize,csize;string uname;
};typedef struct bt_entry *AR_BUNDLE;
struct ar_block{AR_BUNDLE bundle[ mu ];

84
};typedef struct ar_block *AR_BLOCK;
GLU
struct filename{
char fn[flen];};
typedef struct filename *FILENAME;
// function prototype definitionslocal AR_BLOCK get_ar_block( int, int );local int num_users( AR-BLOCK );local AR_BUNDLE select_bundle( AR_BLOCK, int );local int user_name( AR_BUNDLE );
int es_process( AR_BUNDLE, int );
// GLU programe where
e = do_expsys( scatter( blk ) )where
blk = get_ar_block( BLOCK_SIZE, time );scatter( block ) = pwhere
bs = 0 fby bs + num_users( block );s = bs upon advance;advance = (next time == z);z = s + num_users( b );b = block upon advance;
P = select_bundle( b, time-s );end;do_expsys( bundle ) = score
whereuser = user_name( bundle );score = ( sc @ i ) @.u user
whereindex u;i = time upon u == user;
user_bundle = bundle wvr u == user;SC = ( first invoke( user_bundle, 0 )
fbynext invoke( user_bundle, prev SC ))where
invoke( ub, sc ) = es_process( ub, time );end;
GLU 85
end;end;
end;end
The GLU program shown above accepts, as input, blocks of audit records from an externalsource. This way the communication cost is amortized over several records. Proceduralfunction get_ar_block, when given block size and block id, returns a block of auditrecords as a C structure (AR_BLOCK.) The block, which may consist of audit recordsfrom different users, is divided or scattered into smaller blocks (or bundles) where eachbundle consists of audit records from a specific user. This is accomplished using the GLUfunction scatter and C functions num_users and select_bundle. Each record in eachbundle is processed by the expert system (implemented by es_process) by invoking theGLU function do_expsys on each bundle.
8.32 GLU Execution Model
The GLU platform provides the programmer with important benefits of implicit coarse-grain parallelism, transparent fault tolerance, and architecture independence. Thesebenefits are realized by using a novel model of parallel execution called eduction. Eductioncorresponds to lazy dynamic dataflow [27]. An important consequence of laziness is thatwhile it shares the greater asynchrony of its eager counterpart, it avoids superfluouscomputation altogether. This is particularly important since procedural functions withside effects in GLU programs should not be invoked when unnecessary, even if the sideeffects are benign as far as the computation is concerned.
The most natural way to realize education is by tagged demand-driven execution. Simplyspeaking, a term in a GLU program is evaluated (at a particular context) only when it isdemanded at that context (as identified by the demand�s tag). The evaluation consistsof two phases: first, simultaneous demands for the constituent subterms at appropriatecontexts are propagated and, second, the function associated with the term is appliedwhen the demanded values of each satisfied subterm are available, thereby producing theoriginally demanded tagged result.
An important aspect of eduction is that it does not recompute the value of a term at agiven context (or tag) if that value has been previously demanded. Instead, the taggedvalue is stored when the initial demand for it is satisfied, and is used to satisfy subsequentdemands for the value.
The eduction model exploits two kinds of parallelism. The first kind is functional paral-lelism, which is exploited in the simultaneous computation of tagged values of subtermsdemanded to produce a tagged value of a term. The granularity of parallelism is coarseif the subterms correspond to procedural functions.

86 GLU
Figure 8.1: IDES Expert System in GLU

GLU 87
Given the program fragment, f( g( y ), h( z ) ), if the tagged value f(...):c isdemanded (c is the tag of the value that is sought), demands for g(...):c and h(...):cwould be simultaneously made, which in turn would demand tagged values y:c and z:c.When the latter become available, functions g and h can be applied simultaneously,resulting in functional parallelism.
The second kind of parallelism is context parallelism (which loosely corresponds to dataparallelism [25]). This is exploited in the simultaneous evaluation of the same term atmultiple contexts. As a simple example, with the above program fragment, the termcorresponding to f(...) can be demanded simultaneously at contexts c and d and thedemanded tagged values of subterms at the two contexts can be computed independentlysince there is no contextual dependency within the term. Further note that the exploita-tion of context parallelism can occur independent of the exploitation of the functionalparallelism.
The program given in Figure 8.1 exhibits data parallelism in the simultaneous processingof audit record bundles of different users. In other words, while audit records of a givenuser are required to be processed in order, audit records of independent users can beprocessed simultaneously. This parallelism is illustrated in Figure 8.2. The parallelismexploited is coarse grain because a bundle (instead of an individual audit record) is usedas a unit of audit information If each bundle consists of only one audit record (i.e., finegrain), the cost of communication of the bundle (overhead) will far outstrip any gainsmade in exploitation of parallelism in simultaneous processing of the individual auditrecord. Thus, we are currently experimenting with the effect of increasing bundle size onperformance.
8.3.3 Recovery from Partial Faults
Another benefit of the execution model is the ability to detect and recover from partialfailures. We assume a simple fault model in which a processor either operates correctly orfails and stops. This will appear in our execution model either as an unsatisfied demandor as loss of a previously computed value. In the first case, the unsatisfied demand canbe detected by a timeout mechanism and a simple protocol. Recovery would requirethe demand to be reissued and processed elsewhere (i.e., at another processor). In thesecond case, while the loss of a previously computed value cannot be detected, it doesnot matter since the execution model will automatically recompute the demanded valueelsewhere.
Detection and recovery from failure is handled entirely by the execution model and doesnot require programmer participation. However, for correct processing, the executionmodel assumes that each function is programmed to be idempotent and atomic. Idem-potence guarantees that repeated execution of the function with the same values has thesame effect and produces the same result. Atomicity guarantees that either none of the

GLU
Figure 8.2: Data Parallelism in an Expert System

GLU 89
effects take place and no result is produced, or all of them take place and the result isproduced. Functions of the IDES application (as described below) will be idempotentand preserve atomicity.
8 . 4 I m p l e m e n t a t i o n o f I D E S u s i n g G L U
IDES can be viewed as a program that consumes a sequence of audit records and producesa sequence of boolean values, each indicating whether any of the events associated withthe corresponding audit record are anomalous. IDES processes each audit record usingthe rule-based expert subsystem and the historical profile-based statistical subsystem.The analysis of the two subsystems is resolved by the resolver subsystem, which reportswhether an audit record signifies one or more anomalies. (Currently, the resolver functionis simply a place-holder that returns an anomaly when either the expert system or thestatistical component reports anomalies.) The rule-based expert system uses the auditrecord and the knowledge base associated with the subject specified by the audit recordto perform anomaly analysis. For each subject, the statistical subsystem computes theactive profile using the audit record and the previous active profile for the subject, andstatistically analyzes the active profile with respect to the historical profile. To enhanceefficiency of failure recovery, the active and historical profiles are periodically written tostable storage.
The GLU program that implements IDES is given below and an explanation of theprogram follows.
resolve( esp, stp )where
esp = do_expsys( bundle );stp = do_stats ( bundle );bundle = scatter( block );block = get_ar_block();
The program (shown in Figure 8.3) uses get_ar_block to generate audit record blocksthat are scattered into bundles by the GLU function scatter and processed by both theexpert system (do_expsys) and the statistical system (do_stats). The results from eachare resolved using function resolve.
The execution of the above program results in two kinds of parallelism being exploited.One kind is in the simultaneous processing of each block by both the expert system(do_expsys) and the statistical system (do_stats). The other kind is the simultaneousprocessing of independent bundles by both the expert system and the statistical system.

90 GLU
I
Figure 8.3: IDES in GLU

GLU
8.5 Evaluation
91
We have been successful in expressing both the statistical and expert-system componentsof IDES using the GLU platform. We qualitatively consider how well the GLU imple-mentation of IDES meets the requirements of soft real-time processing, fault tolerance,and scalability. We also point to other benefits of using the GLU platform.
The soft real-time processing capability is achieved by the ability of GLU to automat-ically exploit and effectively harness all useful parallelism that is implicit in the IDESapplication. For example, the implementation would allow audit records from differentsubjects to be processed in parallel, and within that, the expert and statistical processingcan proceed simultaneously. While the execution of a GLU program does entail over-head in the form of demand propagation, this will be easily offset by significant speedupobtained from useful parallelism.
The fault-tolerance requirement is achieved to a good measure because the GLU programfor IDES is evaluated using demand-driven execution. Demand-driven execution is anatural and efficient mechanism for detecting failure in computing demanded values andrecovery by redemanding and recomputing such values using the available resources.
The scalability requirement is achieved since the details of the architecture are hiddenfrom the GLU program, and the execution model can easily accommodate increases (ordecreases) in computing capacity. Essentially, changes in computing capacity need onlybe accounted for in the load distribution policy in the implementation of the executionmodel.
GLU has other pertinent benefits. This platform provides a sound basis for softwaredesign and development. A GLU program such as IDES is portable since it is independentof the underlying architecture and operating system. The GLU platform also providesefficient mechanisms for data transfer and synchronization, in contrast to the previousversion of IDES, which made heavy use of a database system for these purposes.

92 GLU
Chapter 9
Remaining and Proposed Work
The completion of this three-year project is an important milestone in the maturationof the IDES intrusion-detection technology. We have demonstrated the system indepen-dence of IDES by its ability to monitor a database-system-based application on an IBMmainframe and a distributed network of Sun workstations running UNIX. A single IDESis in fact capable of monitoring both environments simultaneously, and IDES can beextended to monitor other environments. We are beginning to see the first commercialinterest in IDES as a potential product, and we are seeking opportunities for developingcustomized versions of IDES for particular installations. Our first installation of IDESoutside SRI is at FBI Headquarters in Washington D.C., where IDES will monitor theFBI�s Field Office Information Management System (FOIMS). We have also given copiesof the IDES software to several other U.S. Government agencies. We would like to seeIDES and systems based on the IDES technology available for use in sensitive applica-tions in the Federal Government and in private companies working in partnership withFederal agencies.
Such widespread use of IDES-like systems will require that these systems become stan-dard, commercially available products. However, before IDES can easily find wide appli-cation or become anything close to a turnkey commercial product, several aspects mustbe explicitly addressed. These include improvements in the ease of use of IDES, reduc-tions in its false-alarm rate, ensuring its resistance to attack, increasing its scalability,and extending it with respect to network vulnerabilities and attacks. Our intent is toproduce a next-generation IDES that significantly extends IDES in each of these areasand to design an architecture for the insertion of the next-generation IDES into a large,complex network of computers. We briefly describe below our plans for each area.
Ease of Use and False Alarm Rate As the statistical component of IDES detectsanomalies, IDES reports the anomalies to the IDES security administrator, alongwith a computation of how far from the expected norm the measured values are
93

94 Remaining and Proposed Work
and an indicator of the leading five intrusion-detection measures contributing to theanomaly. As the IDES expert-system component detects events that trigger thefiring of its rules, IDES reports the events to the IDES security administrator alongwith an explanation of what rules were fired and why. The number of anomaliesreported can be tuned to some extent by raising and lowering IDES�s statisticalthreshold. However, raising the threshold can be done only at the expense of losingsome sensitivity to potential intrusions. It is difficult to tune the number of eventsreported by the expert-system component, because this number does not depend onany threshold or sensitivity factor. Thus, the number of suspicious events reportedby IDES will depend primarily on the number of users and systems monitored andon how active those users are.
When IDES is used in a large user community with, for example, thousands ofusers, it is entirely reasonable for it to be reporting hundreds of anomalies a day.While this is a great improvement over the possibly millions of audit records perday that the auditing system may be generating, it is still a large number of eventsto be investigated by a security administrator, and may require a staff of severalpeople on every shift. We may safely assume that most of the events reported willbe false alarms, explainable after investigation using some information unknown toIDES. For example, the security administrator may rule out some reported suspi-cious events because he or she knows that the user has just begun a new job, waspromoted, moved to a new office, assigned new computer equipment, and so on.
To make IDES more usable, a new intelligent component is necessary that can auto-matically apply such auxiliary knowledge to rule out "explainable" reported eventsbefore they are ever shown to the IDES security administrator. This presents theIDES security administrator with even fewer events to investigate, and avoids thewaste of time entailed in investigating events that can be explained away. We callthis new component of IDES the resolver. The resolver could also rank the remain-ing reported events as to their seriousness, so that the IDES security administratorcan make the most effective use of his or her time in tracking down intruders.
Another approach to the problem of false positives is to use a detection componentwith finer discrimination capabilities. It is likely that a neural net component willbe able to make the finer distinctions sought if it is sufficiently trained. Whileneural nets do not provide explanation facilities, the combination of a neural net,the resolver and the explanation facilities of the other two components could giveIDES the best of both worlds: fine discrimination to avoid false positives and theability to provide useful information about why a true positive is of concern.
The IDES platform supports the concept of interchangeable detection componentsby specifying a uniform format for audit and anomaly data, and by having a highlymodular architecture. These characteristics of IDES allow us to concentrate onengineering the detection components themselves, without needing to modify thesuperstructure of IDES.

Remaining and Proposed Work 95
Resistance to Attack For a would-be penetrator attacking a system known to be mon-itored by IDES, the logical first system component to be disabled would be IDESitself. Thus, IDES itself must be able to resist attacks.
One approach to attack resistance is to implement IDES on a distributed system ofautonomous, cooperating processors. To resist attack, the distributed IDES shouldtransparently detect and react to failure or removal of one or more processorswhile continuing to provide complete functionality even if only one processor isoperational.
This fault-tolerant capability can be provided by using the GLU (Granular Lucid)platform to implement IDES. The GLU platform consists of a very high-level pro-gramming language that supports coarse-grained parallelism on networked worksta-tions. It assigns responsibility for each part of a computation to a specific processor,thereby making the computation fault tolerant. If part of a computation fails, theGLU system will notice and retry that part of the computation.
The current IDES incorporates GLU technology. However, our focus in this imple-mentation has been on scalability and on gaining experience with the GLU platformitself. Thus, the current implementation is vulnerable if the processor running theinterfaces to the GLU environment goes down. An enhanced implementation ofIDES in GLU would remove the dependence on a particular processor.
Scalability The amount of processing IDES must do depends on the number and typeof events audited, the number of users and systems monitored and their activity,and the type of system being monitored. Even if an IDES installation is initiallyadequate for a particular target system environment, if that environment grows insize, acquires many new users, or begins to audit many more events, the originalprocessing power selected for the IDES installation may prove inadequate. Whatis needed is a way to scale IDES as the demands on its processing power increase,without having to scrap its hardware base and purchase an entire new system tosupport the increased workload.
The GLU platform naturally provides for scalable performance. When IDES isimplemented on the GLU platform, increased processing power can be realized bysimply adding additional processors to the hardware base. Importantly, this canbe done without modifying the IDES application itself and even without stoppingthe IDES processing.
Detecting Network Intrusions Current computing environments are, more andmore, massively networked sets of workstations, servers, mainframes, supercom-puters, and special-purpose machines and devices. Focusing on the vulnerabilitiesof any single host or even any single homogeneous local network of machines mayprove inadequate in such a distributed environment. Detecting intruders will re-quire a comprehensive view of a network, possibly extending to other networks

96 Remaining and Proposed Work
connected to the local network. Applying IDES technology to this (possibly het-erogeneous) computing environment will require expanding the scope of IDES toinclude the ability to detect network intrusions as well as intrusions into the indi-vidual host machines. To achieve this, the following steps are necessary.
Build a rule base into IDES that contains specialized knowledge about networkvulnerabilities and intrusion scenarios.
Enable IDES to work with partial information, since in a very large networkit is unlikely that IDES will possess complete information about the wholenetwork at all times. This capability will make IDES especially attractivefor use in tactical communication networks, which must operate in hostileenvironments.
Develop an overall architecture for inserting IDES or a distributed set of com-ponent IDES machines into a large, complex network.
Below, we summarize our plans for addressing these requirements. The new capabilitiesdescribed below will be incorporated into a Next Generation IDES prototype.
GLU Platform - We plan to develop and implement a GLU platform on a dis-tributed system
- To guarantee highly resistant IDES processing
- To provide for scalable performance of IDES processing to meet changingneeds.
Resolver - We plan to build a resolver component for IDES. The resolver will ac-cept anomaly records from the IDES detection components and perform additionalanalysis using these records and other sources of data as appropriate. It will thenact on the results of these analyses. We will build on the results of a current SRIIR&D project that is investigating the use of model-based reasoning for intrusiondetection. We plan to use SRI�s Gister 1 evidential reasoning system for the fusionand interpretation of evidence produced by IDES�s statistical and expert-systemcomponents.
Neural Nets - We plan to build a neural network detection component for IDES.
Network Intrusion Detection - We plan to develop and implement a capabilityfor detecting network intrusions by combining a specialized rule base on networkvulnerabilities with intrusion scenarios, develop a capability for the detection ofintrusions with partial information, and develop an architecture for the integrationof IDES into a large, complex network.
1Gister is a trademark of SRI International [28].

Remaining and Proposed Work 97
Large Network Architecture - We plan to develop an architecture for insertingIDES into a large network, and will we work with a U.S. Government installation(e.g., NOSC) to install IDES in such an environment.
Improved Detection Capability - We will improve the detection capability ofthe current IDES intrusion-detection components by continued statistical analysisto reduce the false alarm rate, inclusion of trend tests into the statistical component,and an improved rule base for the expert-system component.
IDES Experimentation - We plan to perform experiments using the installedIDES at FBI Headquarters in Washington D.C. to determine the effectiveness ofthe intrusion-detection capability.
We describe these plans in more detail in the following sections.
9.1 Scalability and Resistance to Attack - TheGLU Platform
Our new core technology, GLU, can be used to allow IDES to be easily scaled to manyprocessors and, more important, to allow IDES to resist attack from an intruder. Thisis extremely important for any intrusion-detection system, because we envision that anintelligent intruder is likely to use an attack strategy in which the intruder attempts todisable IDES before mounting an attack on the system IDES was intended to protect.
GLU will allow IDES to be resistant to attack by distributing processing over a distributedset of workstations. GLU does this in such a way that if one of the machines it is using failsfor some reason, it will automatically move processing to another machine without losingany information. If the intruder is informed enough to know that IDES is distributed, heor she may continue to attack the other IDES component machines. As this occurs, GLUwill continue to move the IDES processing from machine to machine, without losing anyinformation or any audit records. As the disabled machines reboot and become availableagain, GLU will automatically distribute IDES processing to these machines. In thisway, disabling IDES becomes more than just a matter of disabling one machine. IDESwill continue to run as long as any of its machines are available.
In addition, from a design standpoint, GLU allows us to exploit the natural parallelismpresent in the IDES processing of audit data. By requiring that a program be expressedas a graph with functional, stateless nodes, GLU encourages a highly modular designwith very loosely coupled modules.
We have tested GLU by implementing a portion of the IDES software on it. We havedemonstrated its ability to transparently distribute IDES processing among several Sun

98 Remaining and Proposed Work
workstations and to redistribute IDES processing when one of the workstations goesdown. GLU is the foundation for the Next Generation IDES.
The current prototype embodies our first attempt at incorporating GLU into IDES. Theresult is something of a compromise in terms of both performance and robustness. Forexample, the current design still has a weak link - the processor that the target systemssend the audit records to. If this processor fails, the whole of IDES will go down. Wewould like to eliminate this weak link. We would also like to address the performanceconcerns in the interprocess communication mechanism.
The current platform, which needs to be enhanced to meet the requirements of highresistance to attack and scalable performance, offers a limited degree of resistance bydetecting and recovering from the failure of processors other than the main (weak link)processor. However, IDES can be rendered ineffective in two ways:
By causing the weak-link processor to fail
By arbitrarily slowing down any processor.
Failure of the weak-link processor will cause audit records from the target systems to belost and no IDES processing to be performed. This can be compensated for by limitedreplication, whereby each audit record is redundantly received and processed. Thus,failure of any one processor will not cause IDES to cease operation.
Arbitrarily slowing down any processor can slow the IDES processing at that processorenough to make it ineffective. However, the current GLU platform will not react to theslowdown, because the processor is still operational. The platform needs to be enhancedso that processing of each audit record is conducted redundantly and simultaneously inseveral other processors. The result of the processing can then be determined as soon asthe fastest processor has completed processing, so that arbitrary slowdown of a processorwill not cause IDES as a whole to be ineffective.
With the current GLU platform, scalable processing is possible since it automaticallyexploits and effectively harnesses all useful parallelism that is implicit in the IDES appli-cation. However, to be fully scalable, the GLU platform needs to transparently accommo-date increases (or decreases) in processing power without user intervention or temporarystoppage of IDES processing.
9.2 The Resolver
Neither the statistical nor the expert-system components of IDES are capable of under-standing the causes of anomalies they may detect. This is left to the system security

Remaining and Proposed Work
administrator. Because of this, in order to guard against excessive false alarms, detectionthresholds must be set rather conservatively.
To improve the performance of IDES in this regard, we plan to develop a model-basedresolver, which would review the conclusions of the two independent IDES components(the statistical and expert-system components), in the context of more global informationin order to determine whether to raise an alarm. The resolver would consider morecomplex explanations for apparent anomalies, thereby reducing the false-positive rate ofanomaly reports as well as eliminating the possibility of multiple alarms due to the samesuspicious behavior�s being reported by both the rule-based system and the statisticaldetector.
Furthermore, the resolver would be able to reason about the potential severity of theanomaly based on an understanding of the alarm in the context of the overall session.This could often lead to the conclusion that unusual behavior is not a concern becauseit does not have any security ramifications.
In ambiguous situations, the resolver could request that additional information be col-lected or accessed in order to determine the likelihood of an intrusion. This would allowthe amount of audit data collected to be determined by the particular situation.
The resolver will be an intelligent, model-based reasoning component that will make itsdecisions based on information from the other detection components in the context of alarger, unified knowledge base. We plan to implement the resolver using the evidentialreasoning technology pioneered by SRI�s Artificial Intelligence Center.
The resolver would consist of the following components.
A deduction engine that analyzes the inputs to the resolver
A database component, giving the resolver access to volatile data
A user-interface component, allowing users to interact with it on different levels(a security watch officer could input calendar-type information while a securityadministrator could modify its inference rules)
A communication component, allowing the resolver to act on the conclusions itreaches.
9.2.1 Resolver Models and Other Data Sources
The concept of the resolver extends the IDES paradigm to include specific models ofproscribed activities along with their associated observables. The role of the resolver willbe to determine the likelihood of an intrusion based on the combination of evidence for

100 Remaining and Proposed Work
and against it as determined by the available intrusion scenario models. The intrusionscenarios are expected to vary for different types of intruders and for different systems.
The resolver would be activated in response to an anomaly signaled by either the statis-tical detector or the expert-system component. The information leading to the anomalywould be combined with other available information (such as the current schedules ofvalid users) and other indications of anomalies in order to determine the likelihood thatthe anomalous behavior is truly due to an intruder. At this point, the resolver mayrequest additional information in order to reach a conclusion.
The resolver will require a knowledge base consisting of a set of �scenario models� oftypical intrusion activities. These models will be specified in terms of the sequences ofuser behavior that constitute the scenario. For example, one scenario might represent aprogrammed password attack. This scenario would describe the typical steps necessaryto carry out the attack, expressed in terms of the specific user behavior involved.
The typical �observables� associated with specific behaviors (for example, �accessed thepassword file�) would be linked to the behaviors in such a way that evidence about theobservables can be related to particular activities. Finally, the available audit data wouldbe related to the observables (e.g., �file accesses to etc/passwd� is linked to the observable�accessed the password file�). In this way, audit data may be linked to the particularpatterns of behavior represented by the models.
Information concerning users, such as changes in user status, new users, terminated users,users on vacation, changed job assignments, user locations, and so forth will be useful forthe resolver. Additional information about files, directories, devices, and authorizationswill also be of value.
9.22 Resolver Operation
In effect, new anomaly data will cause the resolver to create instances of its modelsthat are implied by those data. In some cases, the degree to which the data (possiblyin conjunction with earlier data) imply certain intrusion scenarios may be sufficient toraise an immediate alarm; in other cases this evidence may be inconclusive. If theevidence is inconclusive, the resolver may choose to suspend the decision until furtherevidence is available, or it may request additional information. The resolver will have theability to carry out sensitivity analyses over its potential sources of information in orderto determine which sources might have the greatest impact on its conclusions. Thesesources may represent audit data that are not collected normally or that are collectedbut not evaluated in the normal operation of the system.
This mapping of aspects of user behavior to how the behavior will show up in the auditdata must exhibit properties that differentiate the particular behavior of concern fromother innocuous activities. These distinguishing properties should have the following

Remaining and Proposed Work 101
characteristics.
They should be easily recognized, so that they can be readily detected.
They should be clearly associated with the behavior in question.
They should allow intrusive behavior to be distinguished from normal behavior.
9.2.3 Evidential Reasoning
We have examined the feasibility of using SRI�s Gister evidential reasoning system forthe fusion and interpretation of evidence for hypothesized intrusions. Gister grew outof earlier work, sponsored jointly by SPAWAR and DARPA, aimed at developing newtechniques for Naval intelligence analysis. We will implement a model-based intrusion-detection capability, based on Gister, for inclusion within IDES.
The goal of evidential reasoning is to assess the effect of all available pieces of evidenceupon a hypothesis, by making use of domain-specific knowledge. The first step in applyingevidential reasoning to a given problem is to delimit a propositional space of possiblesituations. Within the theory of belief functions, this propositional space is called theframe of discernment. A frame of discernment delimits a set of possible situations,exactly one of which is true at any one time. Once a frame of discernment has beenestablished, propositional statements can be represented by subsets of elements fromthe frame corresponding to those situations for which the statements are true. Bodiesof evidence are expressed as probabilistic opinions about the partial truth or falsityof propositional statements relative to a frame. Belief assigned to a nonatomic subsetexplicitly represents a lack of information sufficient to enable more precise distribution.This allows belief to be attributed to statements whose granularity is appropriate to theavailable evidence.
In evidential reasoning, domain-specific knowledge is defined in terms of compatibilityrelations that relate one frame of discernment to another. A compatibility relation simplydescribes which elements from the two frames can simultaneously be true.
Evidential reasoning provides a number of formal operations for assessing evidence, in-cluding:
1. Fusion - to determine a consensus from several bodies of evidence obtained fromindependent sources. Fusion is accomplished through Dempster�s rule of combina-tion.
2. Translation - to determine the impact of a body of evidence upon elements of arelated frame of discernment.

102 Remaining and Proposed Work
3. Projec t ion - to determine the impact of a body of evidence at some future (orpast) point in time.
4. Discount ing - to adjust a body of evidence to account for the credibility of itssource.
Several other evidential operations have been defined and are described elsewhere [28].
Independent opinions are expressed by multiple bodies of evidence. The evidential rea-soning approach focuses on a body of evidence, which describes a meaningful collectionof interrelated beliefs, as the primitive representation. This allows a system to reasonabout evidence pertaining to a model consisting of multiple, interrelated activities. Incontrast, all other such technologies focus on individual propositions. Previous appli-cations of Gister include intelligence processing, military situation assessment, medicaldiagnosis, and acoustic and electronic signal processing.
9.2.4 Benefits of Model-Based Reasoning
The potential benefits of using a model-based resolver within IDES are manyfold, includ-ing the following:
More data can be processed, because the technology will allow the selective nar-rowing of the focus of the relevant data. Thus, at any given time, only a small partof the data collected may need to be examined in detail.
More intuitive explanations of what is being detected can be generated, becausethe events flagged can be related to the defined intrusion scenarios.
The system can predict what the intruder�s next action will be, based on the definedintrusion models. Such predictions can be used to verify an intrusion hypothesis,to take preventive action, or to determine which data to look for next.
With the model-based reasoning approach, the descriptions of intrusion scenarios allowthe intrusion-detection system to focus its attention on the data likely to be of most�utility at the moment. The models can be used to examine only the data most relevantto detecting intrusions. In effect, we can narrow the field of view to optimize the datathat have to be analyzed. This is analogous to pointing and tuning a sensor to optimizeperformance.
If the stream of audit data contains a significant number of intrusions in comparisonwith the total volume of audit data (i.e., there is a large signal-to-noise ratio), then anapproach in which all the incoming data are examined and analyzed can be successful.However, if the number of intrusions is very small in comparison with the total volume

Remaining and Proposed Work 103
of audit data (a small signal-to-noise ratio), then the amount of data to be examinedcan quickly overwhelm the intrusion-detection system. The system will be drawing verymany conclusions, most of which will be dead ends. In this case, a more efficient approachwould be to examine only the specific data in the audit data stream that are relevant atthe moment. Thus, we can, in effect, increase the signal-to-noise ratio in particular areasby looking only in those areas. This top-down approach to data analysis will be moreefficient in the intrusion-detection domain, where the signal-to-noise ratio is extremelysmall.
With the model-based reasoning approach, the models of intrusion can be used to decidewhat specific data should be examined next. These models allow the system to predictthe action of an intruder who is following a particular scenario. This in turn allows thesystem to determine specifically which audit data to be concerned with. If the relevantdata do not occur in the audit trail, then the scenario under consideration is probably notoccurring. If the system does detect what it was looking for, then it predicts the next stepand will then examine only data specifically relevant to confirming the hypothesis of theposited intrusion, and so on until a conclusion is reached. Thus, a model-based systemreacts to the situation, using only those data most appropriate to the given situation andcontext.
By providing the means to consider more complex, global explanations of anomalies, theresolver should increase the likelihood of catching actual intrusions, reduce the number offalse alarms, and improve the overall effectiveness of both the statistical component andthe expert-system component of IDES. Furthermore, by reducing the amount of data tobe considered routinely, the overall performance of IDES should be improved.
9.3 Monitoring Network Traffic
We also plan to extend the theoretical basis for IDES to enable the development of anIDES that could monitor traffic in tactical communication networks to detect suspiciousactivity. The required extensions are twofold:
IDES�s statistical algorithms are based on the probabilities of occurrence of theevents it observes. In a network, however, IDES would not be able to operate withglobal knowledge. Thus, IDES�s algorithms must be extended to give meaningfulresults when some information is missing and probabilities can only be estimated.
IDES�s rule base has been designed for detecting suspicious user activity. To useIDES to monitor network traffic, where user data are not available, we must createa rule base with a set of rules specific to the domain of detecting suspicious networktraffic patterns.
104 Remaining and Proposed Work
In addition to establishing the theoretical foundations for these extensions to IDES, weplan to develop candidate architectures for incorporating one or more IDES into thenetwork topology. So far, IDES has assumed centralized control and is thus appropriatefor systems with high channel capacity and low transfer delay. Tactical networks oper-ating under stress are expected to have neither. Moreover, tactical networks can becomepartitioned, so that an IDES with centralized control would not have global knowledge.Thus, a distributed approach to detecting anomalous behavior is more appropriate fortactical communication networks. We envision that IDES in this context would consistof a set of loosely coupled IDES machines (see Section 9.5).
9.4 A Neural Net Component for IDES
Matching a subject�s observed behavior to a model of the subject�s past behavior isdifficult, since subject behavior can be very complex. False alarms can result from invalidassumptions about the distribution of the audit data made by the statistical algorithms.Missed detections can result from the inability to discriminate intrusive behavior fromnormal behavior on a purely statistical basis. Our use of a second, rule-based approachis an attempt to help fill some of the gaps in the statistical approach. In this approach,an event can trigger a rule apart from any consideration of whether the event is normalfor the subject. Thus, intrusion scenarios that may not be anomalous for the subject(because the intruder has trained the system to see the behavior as normal) can bedetected by appropriate rules.
However, the rule-based approach also has limitations. Writing such a rule-based systemis a knowledge-engineering problem, and the resulting expert system will be no betterthan the knowledge and the reasoning principles it incorporates. An intrusion scenariothat does not trigger a rule will not be detected by the rule-based approach. Besides,maintaining a complex rule-based system can be as difficult as maintaining any otherpiece of software of comparable magnitude, especially if the system depends heavily onprocedural extensions such as rule ranking and deleting facts.
To address these concerns, we have considered the use of neural nets as another detectioncomponent in IDES.
9.4.1 Neural Networks
A neural network, considered abstractly, is a machine for transforming inputs to outputsby the action of a large set of simple, highly connected elements. The particular functioncomputed in the transformation is determined by the characteristics of the elements andthe connectivity and strengths of the interconnections. Several canonical structures havebeen studied and used for practical applications. Neural networks perform either classi-

Remaining and Proposed Work 105
fication functions (e.g., pattern recognition), or optimization functions (e.g., minimizingsome function over a set of state variables). In the following discussion, only classificationis considered.
The particular transformation function computed by the network may be determined byadjusting the weights of the connections between the elements. Adjustment of weightsis analogous to the writing of a program for general-purpose computation. It may beaccomplished either under supervision, that is, the correctness of a network response todata is decided externally, or without supervision, that is, functions evolve according toa built-in decision rule.
For the classification application, the network output should correctly identify the classto which the input data belong. For this goal, the network would be trained using setsof sample data that exemplify the various classes. In general, the effect of new samplevalues may be to modify or amalgamate existing classes or to create a new class. In theintrusion-detection application, a network would be trained to recognize the particularpattern of behavior for individual users, so that when a user claims to be a particularperson, the neural network for that user would determine if the behavior conforms to thenamed user�s pattern of usage.
9.4.2 Uses of Neural Networks in IDES
We envision that neural networks could address the following problems in IDES.
The need for accurate statistical distributions. Statistical methods sometimes de-pend on some assumptions about the underlying distributions of subject behavior,such as Gaussian distribution of deviations from a norm. These assumptions maynot be valid and can lead to a high false-alarm rate. Neural networks do not requiresuch assumptions; a neural network approach will have the effect of relaxing theseassumptions on the data distribution.
Difficulty in evaluating detection measures. We selected the current set of intrusion-detection measures for IDES on the basis of our intuition and experience. We do notknow how effective these measures are for characterizing subject behavior, whetherfor subjects in general, or for any particular subject. A measure may seem to beineffective when considered for all subjects, but may be useful for some particularsubject. A neural network can serve as a tool to help us evaluate the effectivenessof various sets of measures.
High cost of algorithm development. The development time for devising new statis-tical algorithms and building new software is significant. It is costly to reconstructthe statistical algorithms and to rebuild the software implementing them. We mayremove assumptions that are invalid for the audit data we are using, but we may

106 Remaining and Proposed Work
find that we have to modify the algorithms yet again when we apply them to a newuser community with different behavior characteristics. Neural network simulatorsare easier to modify; we envision using a �plug-compatible� approach where onesimulator can be replaced by another using a different methodology with minimaleffort.
Difficulty in scaling. New problems are anticipated in applying IDES to very largecommunities, for example, thousands of users. Methods are needed for assigningindividuals to groups on the basis of similarity of behavior, so that group profilesmay be maintained instead of a profile for each user. Our current thinking is thatusers will be grouped manually (by a security administrator) according to job title,shift, responsibilities, and so forth. These methods may be inadequate. We envisionusing a neural network to classify users according to their actual observed behavior,thus making group monitoring more effective.
We do not feel that a neural network can simply replace the IDES statistical compo-nent. The most important reason for this is that IDES�s statistical component providesinformation as to which measures contributed to considering an event to be anomalous.Finding ways to get explanatory information out of neural networks is currently a researchissue.
Our approach would be to build a prototype intrusion-detection component using a neuralnetwork simulator. This component would run in parallel with the statistical and expert-system components of IDES. Its output would also be reported to the resolver.
9.5 Large Network Architecture
There are many issues to be addressed when considering the use of IDES to monitor alarge complex network. Such networks many be composed of hundreds or even thousandsof computers, from personal computers to workstations to large timesharing systems,and may have gateways to several larger external networks. The monitored network mayitself be subdivided into smaller internal networks interconnected by internal gatewaysor bridges. The issues to be considered include the following.
How best to integrate IDES into the desired environment
How to distribute IDES processing over the network
Which audit data to select for forwarding to IDES from the target environment
The effect of forwarding audit data to IDES on network performance and capacity

Remaining and Proposed Work 107
Which are the most appropriate audit data collection and storage points in thetarget environment
The most effective manner for getting the selected audit data to IDES.
We will examine these issues in the context of a particular U.S. Government installationto be selected jointly by SPAWAR and SRI. NOSC is a likely candidate for this.
9.6 Improved Detection Capability
In addition to adding new detection components to IDES, as described above, we will alsocontinue to improve the detection capability of the current IDES detection components -the statistical component and the expert-system component. Our approach is as follows.
Perform statistical analysis to reduce the false alarm rate while remaining sensitiveto suspicious behavior. We will revise the statistical algorithms so as to increasedetection strength.
Perform statistical analysis to find which measures (or combinations of measures)are the best discriminators of intrusive behavior. This analysis will be performedthrough experimentation, by activating or deactivating certain profiles, monitoringdifferent mixes of users, and adjusting system parameters.
Stage intrusions in an effort to determine which measures are the most effectivein detecting intrusions - that is, which have the highest true-positive rate whilemaintaining an acceptable false-positive rate. Based on this analysis, we may alsoimplement additional intrusion-detection measures.
Make IDES statistical tests parameterizable, so that
1. Some measures can be deactivated for some subjects.Different intrusion-detection measures may be appropriate to different classesof subject. For example, for users whose computer usage is almost always dur-ing normal business hours, an appropriate measure might simply track whetheractivity is during normal hours or off hours. However, other users might fre-quently log in during the evenings as well, yet still have a distinctive patternof use (e.g., logging in between 7:00 and 9:00 p.m. but rarely after 9:00 p.m.or between 5:00 p.m. and 9:00 p.m.); for such users, an intrusion-detectionmeasure that tracks for each hour whether the user is likely to be logged induring that hour would be more appropriate. For still others for whom �nor-mal� could be any time of day, a time-of-use intrusion-detection measure maynot be meaningful at all. Our vision is for IDES to allow the security officerto activate or deactivate specific measures for particular subjects.

108 Remaining and Proposed Work
2. Different subjects can have different thresholds.Our vision is to allow the IDES security officer to adjust the false-positive ratesindividually for each subject. For example, the security officer might raise auser�s false-positive rate (which simultaneously raises the true-positive rate)if he has reason to doubt a user�s integrity or if the user�s current assignmentor security level requires closer scrutiny. The security administrator mightlower a user�s false-positive rate if he knows that a user�s current assignmentis changing or that the user has other legitimate reasons for changing hisbehavior.
3. Different subjects can have different profile update periods.
4. Different subjects can have different initial default profiles.
Perform trend tests. We will develop and implement second-order intrusion-detection measures; that is, methods for conducting trend tests (to detect howfast a user�s statistical profile changes). We will evaluate the effectiveness of usingthese trend tests to detect planned attacks in which a user gradually moves his orher behavior to a new profile, from which to safely mount an attack, or graduallyincreases the spread of the behavior considered normal.
Enhance intrusion-detection rules (measures) to enable IDES to handle a widervariety of intrusions. To obtain the information necessary for this task, we willmeet regularly with law enforcement agencies, UNIX experts, intrusion experts,and others to develop a realistic and useful rule base.
Allow the capability of modifying intrusion-detection rules during execution timeto enable IDES to adapt dynamically to a frequently changing target environment.
Enhance IDES to be tolerant of missing or incomplete audit data or other failures.
Upgrade existing Sun 3 equipment to Sun 4 equipment. This will allow us toupgrade obsolete equipment and to maintain at SRI the same version of IDES thatis running at the FBI and elsewhere.
In addition, we plan to enhance the security officer interface to provide additional capa-bilities to the security officer.
The current user interface takes advantage of the windowing facility available on the Sun 3workstation. This interface enables the security officer to receive reports, graphically viewthe amount of abnormal activity, and perform some predefined queries. A more powerfuluser interface would enable a security officer to tune the thresholds that control the alarmrate, activate and deactivate profiles, perform more complex queries, and view system-wide or user-specific information graphically, assisted by pop-up menus. Anomalies andsummary reports will be presented graphically in ways that would enable the securityofficer to view a large amount of information easily.

Remaining and Proposed Work 109
9.7 IDES Experimentation
So as to gain an assessment of IDES�s effectiveness at detecting intrusions in an op-erational setting, we will perform experiments using the installed IDES facility at FBIHeadquarters in Washington D.C. Thus, we will continue to provide support to the FBIin the use of IDES and will continue to provide its personnel with regular updated ver-sions of IDES. We will work closely with the FBI to design and enact a wide variety ofexperiments, such as staging intrusions, investigating the anomalies reported by IDES,and observing the effect of tuning various parameters in IDES.
9.8 Summary
SRI will develop the necessary technology to overcome several existing obstacles towidespread use of IDES. This includes improvements in the ease of use of IDES, reduc-tions in its false-alarm rate, ensuring its resistance to attack, increasing its scalability,and extending it with respect to network vulnerabilities and attacks. We will design anarchitecture for the insertion of the Next Generation IDES into a large, complex networkof computers.

110 Remaining and Proposed Work

Appendix A
PBEST - A Production-BasedExpert System Tool
In this appendix1, we present information on how to use PBEST, an expert-system toolcreated by Alan Whitehurst, formerly of SRI. We describe how to produce expert systemsfrom rule specifications using the pbcc translator and how to create interfaces for theexpert-system engines produced by PBEST. Besides this, we show how to produce anduse interactive, window-based versions of expert-system engines. We describe the syntaxof the PBEST expert-system specification language. Finally, we cover some efficiencyconsiderations. We discuss implementation details primarily insofar as they bear on theabove issues.
A.1 Introduction
The PBEST system consists of a rule translator, pbcc, a library of run-time routines, anda set of garbage-collection routines (these routines are copyright 1988 Hans-J. Boehm,Alan J. Demers; see the GC_README file included with the garbage-collector source).The rule translator accepts a set of rule and fact definitions and produces routines in theC language to assert facts and process rules. The run-time library contains the code thatis constant for all expert systems, and includes routines to support interactive versionsof expert-system engines. By setting the appropriate flags, the user can produce expertsystems that run under Sunview or the IDES user interface library (the latter based on X-windows). (The Sunview version is not described in this document.) These environmentsallow the user to view the execution of the system, to single-step the execution, to set
1This appendix is a draft of a user�s manual for the PBEST system. We would appreciate gettingcomments on both the manual and PBEST itself regarding bugs in PBEST, usefulness of PBEST andthe manual, and improvements that would enhance either.
111

112 PBEST
and remove breakpoints, to delete and assert facts, and to watch a trace of the effects ofthe rules as they fire.
To produce an expert system, the user creates a file or files containing rule and factdefinitions, using any desired text editor. The user then runs this file through the pbcctranslator, producing a file of C code. This code can be compiled normally, and linkedwith 1ibpb.a (the run-time routines), gc.o (the memory-allocating and garbage-collectionroutines), and the necessary window libraries, if the user wants a window version. Theresulting program can be run as a stand-alone executable program. This process willusually be done under the control of make or a similar program.
A.2 Getting Started
In this section, we will give a working example of a trivial expert system and show howit is compiled and executed. Start by entering the following text into a text editor (don�tworry about meaning right now; just concentrate on getting the text right):
Everything on the line after a backquote is a comment. You neednot type comments in for this exercise if you don’t want
to! You also do not need to worry about how things line
up* Just get the brackets and punctuation right.
Declare count ptypes with value fieldptype[count value:int] Declare signal ptypes with flag fieldptype[sig flag:int]
This rule fires if there are no count or signal facts.It asserts a count fact and signal fact with their fieldsset to 0. This example is set up to produce only onecount fact and only one signal fact.
== >
rule[rO (#-10):[-count]
[-sig]

PBEST 113
[!|printf("Asserting count and sig facts.\n")][+count|value=O][+sig|flag=O]]
This rule fires whenever the flag field of the signal fact is set to 1 and the count fact’s value field is less than 100.
rule[rl:[+c:count|value<lOO][+s:sig|flag==1]
==>
[!|printf ("Incrementing count, resetting sig flag.\n")][/c|value+=l] Increment count value[/s|flag=O]] Reset signal flag
This rule fires whenever the flag field of the signal fact is set to 0 and the count fact’s value field is less than 100.
rule[r2:[+c:count|value<lOO][+s:sig|flag==O]
==>[!|printf("Removing old count fact, asserting new count fact,\
setting sig flag.\n")][+count|value=c.value+l] Make a new count fact and
set its value field to the old fact’s value plus 1
[-|c] Delete count fact[/s|flag=l]] Set signal flag
This rule fires when the count fact’s value gets to 100. It removes the count fact and prints a message. After this, no rules will be able to fire, so the engine
stops in the window version and exits the program in thenon-window version.

114 PBEST
rule [r3 (#10):[+c:count|value>=l00]
==>
[-|c][!|printf ( Count >= 100.\n )]]
Save the file as �tst.pbest�.
At this point, the user must translate, compile and link this file to produce an executableexpert system. The user can use the make command to do this. We provide a sampleMakefile at the end of this document; it allows one to automatically produce and maintaina particular expert system. Assuming things are set up as described in that section, theuser can issue the command
make tst
at the shell prompt. The system should execute the commands necessary to produce thetst program. The user can then type
tst
at the shell prompt, and the expert system should execute.
To make the X-windows version, the user can type
make tstx
To run this program, the workstation must be running X-windows. Type
tstx
at the shell prompt.
Note that one could type
make
to produce the tst and tstx versions with one command.

PBEST 115
A.3 Basic Syntax
To create an expert system, the user must define rules and ptypes. Ptypes are also knownas pattern types. A complete specification of the syntax of PBEST can be found at theend of this document. For now, we will discuss example rule and ptype declarations.
The following is an example of a ptype declaration:
ptype [count value : int]
This declaration consists of the keyword ptype, an opening bracket, a name count, and atyped field, value, which is declared to be an integer. The declaration is terminated witha closing bracket.
The purpose of this declaration is to establish a pattern or template for facts. Each factthat exists in the expert system�s knowledge base will be an instance of some ptype.Facts of ptype count will have one field, an integer called value. This declaration allowsrules to refer to count facts, and to inspect and modify the value field of these facts.There will usually be many facts of a given ptype.
A ptype may have more than one field:
ptype [session userid : string,terminal : string,timeoutflag:int]
This ptype declaration establishes a pattern for facts with three fields: userid and ter-minal, both strings, and timeoutflag, an integer.
Rules can refer to facts that have fields matching particular things. For example, a rulecould check for a session fact whose timeoutflag is 1 by including the following clause inits antecedent (we will look at the complete structure of rules a little later):
[+session timeoutflag == 1]
The + sign after the opening bracket is used as a sort of �existential quantifier.� Thatis, it allows a rule to check to see if any fact having certain characteristics exists. Thisclause, then, will match any session fact having a timeoutflag field with the value 1.
A rule may also check to see that there is no fact of a given type using the - syntax. Thefollowing example checks to see that there is no session fact with the user id of THISUSER:
[-session userid == "THISUSER"]

PBEST 117
==>[/c|value+=l]etc.
Increment count fact’s value field
Note that modifications are implemented as if the original fact had been negated and anew fact with the modified fields had been added. Anyone using the interactive window-ing system will notice that when a fact gets modified, it gets a new number. This allowsthe system to give priority in binding to modified facts over facts that were created morerecently but are �inactive.�
Here is an example of a complete rule declaration that demonstrates some of these tech-niques:
rule[SimuLogon(#l;*):[+tr:transaction][+se:session|userid == tr.userid][?|se.terminal != tr.terminal]
==>[!|printf( SimuLogon: user %s at terminals %s, %s\n ,
tr.userid, tr.terminal, se.terminal)][-|tr][-|se]]
This rule detects a user logging in on a terminal while already logged in somewhereelse. It works by checking for some transaction fact (these facts must be instances of atransaction ptype that the user declared), and checking to see if there is any session factwith the same userid field. If such a session fact exists, it compares the terminal fieldsof the transaction and session facts to see if they are different. If they are different, therule fires. This rule assumes that some other rule will look for login actions and createsession facts for each login.
The syntax of a rule is completely determined by the delimiters (brackets and ==>). Theabove rule is formatted in a readable fashion, but such formatting is optional.
A rule declaration, then, begins with the keyword rule. It then has a name sectionfollowed by a colon (:). The name section of the above rule consists of the name (SimuL-ogon) followed by a set of options in parentheses. We will give a description of all possibleoptions later. The #l option gives the rule a ranking of 1. This means that if severalrules can fire, this rule will fire before rules with a lower ranking. Thus, if this rule anda rule with a ranking of 0 can both fire, this one will be selected to fire. The asterisk (*)option means the rule is repeatable. This means that the rule can be fired repeatedlywithout some other rules firing in the meantime. By default, rules are not repeatable,since once a rule�s antecedents are satisfied, they will continue to be satisfied forever, and

P B E S T 117
==>[/c value+=1]etc.
’ Increment count fact’s value field
Note that modifications are implemented as if the original fact had been negated and anew fact with the modified fields had been added. Anyone using the interactive window-ing system will notice that when a fact gets modified, it gets a new number. This allowsthe system to give priority in binding to modified facts over facts that were created morerecently but are �inactive.�
Here is an example of a complete rule declaration that demonstrates some of these tech-niques:
rule[SimuLogon(#l;*):[+tr : transaction][+se:session|userid == tr.userid][?|se.terminal != tr.terminal]
==>[!|printf ( SimuLogon : user %s at terminals %s, %s\n",
tr.userid, tr.terminal, se.terminal)]
C-|se]]
This rule detects a user logging in on a terminal while already logged in somewhereelse. It works by checking for some transaction fact (these facts must be instances of atransaction ptype that the user declared), and checking to see if there is any session factwith the same userid field. If such a session fact exists, it compares the terminal fieldsof the transaction and session facts to see if they are different. If they are different, therule fires. This rule assumes that some other rule will look for login actions and createsession facts for each login.
The syntax of a rule is completely determined by the delimiters (brackets and ==>). Theabove rule is formatted in a readable fashion, but such formatting is optional.
A rule declaration, then, begins with the keyword rule. It then has a name sectionfollowed by a colon (:). The name section of the above rule consists of the name (SimuL-ogon) followed by a set of options in parentheses. We will give a description of all possibleoptions later. The #l option gives the rule a ranking of 1. This means that if severalrules can fire, this rule will fire before rules with a lower ranking. Thus, if this rule anda rule with a ranking of 0 can both fire, this one will be selected to fire. The asterisk (*)option means the rule is repeatable. This means that the rule can be fired repeatedlywithout some other rules firing in the meantime. By default, rules are not repeatable,since once a rule�s antecedents are satisfied, they will continue to be satisfied forever, and

118 P B E S T
the rule would fire again and again. As we will see below, this rule deletes the facts thatsatisfy it and so prevents such a loop.
The body of a rule consists of a sequence of antecedent clauses, the delimiter ==>, and asequence of consequent clauses. Each antecedent clause consists of some test. The firstantecedent clause
[+tr : transaction]
checks for a transaction fact. It gives it the alias of tr. The clause
[+se : session|userid == tr.userid]
checks for a session fact with the same value in the userid field as the tr fact alreadyfound. If it finds such a fact, it gives it the alias of se. The third clause
[?|se.terminal != tr.terminal]
checks to see if the terminal field in the session fact is different from the one in thetransaction fact.
If all the antecedent clauses of a rule are satisfied, the rule �fires�; that is, its consequentclauses get executed. This rule has three consequent clauses. The first clause
[! |printf ("SimuLogon: user %s at terminals %s, %s\n",tr.userid, tr.terminal, se.terminal)]
is a call to a C function. The ! | syntax indicates such a call. This call can be anarbitrary C function. pbcc recognizes most of the built-in C functions; the user mustdeclare user-written ones (we will describe how to do this later). Such calls can referencethe fields in the facts as C structures. This is done using the fact alias followed by a clot(.) and the field name.
The clauses
and
I

P B E S T 119
remove the tr and se facts from the knowledge base. This is indicated by the - | syntaxfollowed by the fact alias. There are three reasons to remove facts. First, doing soprevents the rule from firing over and over with the same facts satisfying it. Second,removing facts from the knowledge base when they are no longer needed makes thesystem run more quickly. This is because when a new fact is asserted into the knowledgebase, any rule with an antecedent clause that the new fact matches must compare thenew fact to all other facts matching the other antecedent clauses of the rule to see if someset of facts matches the whole antecedent. In the above example, a new transaction factwill cause the rule to check all session facts to see if any of them have the same useridfield. Thus, removing unneeded session facts can shorten this check.
Note that if a fact can match an antecedent clause in more than one rule, no rule shouldremove it unless all the rules that may need it have used it. Checking this can be donewith marks, which we will describe later.
A third reason to remove facts once they are not needed is to conserve memory. Obvi-ously, if the system is to run for long periods of time, things must be removed from theknowledge base at the same rate as they are added to it, or else the knowledge base willultimately overflow the memory of the system.
A.4 More Syntax
This section describes the syntax of PBEST in more detail. It includes descriptions ofthe mechanism for declaring external functions and for marking facts.
The PBEST system allows the user to call arbitrary C language functions within rules.However, it only knows about certain built-in C language functions. If you want to useyour own function or a function that pbcc does not recognize, or if you want to use anauxiliary variable, you must declare your intention to pbcc. You do this using the xtypesyntax. For example, say you have written a function to get data from the outside world.This function, as a side effect, asserts facts into the knowledge base, and returns aninteger code indicating whether it was able to get some new data. You would include thefollowing statement in your code:
xtype [get_data:int]
pbcc would then recognize get_data as a valid function call.
Similarly, if you wanted an integer variable named returncode and a constant namedEND_OF_FILE, you could include the statements
xtype[returncode:int]xtype [END_oF_FILE :int]

120 P B E S T
in your code. You could then write the following rule:
rule [get-data (#-99; *) :[?|’returncode != ’END_OF_FILE]
== >[! | ‘returncode = get_data()]]
This rule will check to see that the returncode variable is not set to END_OF_FILE, andif not, it will set its value to the result of calling the get_data() function. Note that thereturncode variable should be initialized to a value not equal to END_OF_FILE (the usercan write a statement to do this in the auxiliary C code section).
Notice that in the antecedent clause, both returncode and END_OF_FILE are precededby quote marks. This syntax indicates to pbcc that these identifiers have been declaredby xtype. The quote marks are optional in the consequent.
It is possible to have a function call in an antecedent clause. For example, one couldwrite
xtype[GOOD_DATA:int]
rule[test_data (#-99;*):[?|get_data() == 'GOOD_DATA]
== >etc.
The code for user-writ ten C language functions or variable declarations can be includedin the body of the rule file if the programmer desires. The syntax for this is simply
. . . C language statements.. .
Such code can be included at any point in the file outside of the body of a ptype, xtype,or rule declaration.
Another important feature of PBEST is the ability to mark and unmark facts, and totest for these marks. Since marks can have names, an expert system can mark a factwith different marks, and check for these marks by name. One use of this feature is tomake sure that all the rules that can possibly use a fact have had the chance to do so.To do this, it helps to organize rules in groups, making sure that at least one rule in a

PBEST 121
group will always fire, and that each rule in the group will mark the fact with the samemark if it does fire. Here is an example of how this would work:
'*********************************************************
' Rule to check for unsuccessful logins for a single user'*********************************************************
Predicate for counting login errors for a single user (lieucount stands for login_item_error_user_count)
ptype[lieucountuser_id:integer,day:integer,second:integer,maximum:integer,current:integer]
Rule for first unsuccessful login for this user
rule[UNSLOG1:[+lie:login_item_error^UNSLOG][-lieucount|user_id==lie.user_id]
== >[!|printf("UNSLOG1: Found bad login for user %d\n",
lie.user_id)][+lieucount|user_id=lie.user_id,
day=lie.days,second=lie.seconds,maximum=4,current=1]
[$|lie:UNSLOG]]
Rule for counting unsuccessful logins after the first, up to lieuc.maximum
rule[UNSLOG2:

122 P B E S T
[+lie:login_item_error^UNSLOG][+lieuc:lieucount|user_id==lie.user_id][?|lieuc.current <= lieuc.maximum - 1]
== >[/lieuc|current+=l][!|printf("UNSLOG2: Found bad login for user %d, number %d\n",
lie.user_id, lieuc.current)][$|lie:UNSLOG]]
Now we have seen the maximum number of bad logins for this user
rule[UNSLOG:[+lie:login_item_error^UNSLOG][+lieuc:lieucount|user_id==lie.user_id][?|lieuc.current == lieuc.maximum]
== >[!|printf("UNSLOG: Found %d bad logins for user %d\n",
lieuc.maximum, lie.user_id)][$|lie:UNSLOG][-|lieuc]]
‘***********************************************************‘ Rule to check for unsuccessful logins for the host system'***********************************************************
Predicate for counting bad logins for a host (liehcount stands for login_item_error_host_count)
ptype[liehcountday:integer,second:integer,maximum:integer,current:integer]
Test rule for bad logins

P B E S T 123
Rule for first unsuccessful login for this host
rule[UNSLGX1:[+lie:login_item_error^UNSLGX][-liehcount]
==>[!|printf("UNSLGX1: Bad login for host\n"][+liehcount|day=lie.days,
second=lie.seconds,maximum=10,current=11
[$|lie:UNSLGX]]
Rule for counting unsuccessful logins after the first, up to liehc.maximum
rule[UNSLGX2:[+lie:login_item_error^UNSLGX][+liehc:liehcount|urrent <= liehc.maximum - 1]
==>[/liehc|current+=l][!|printf("UNSLGX2: Found %d bad logins for host\n",
liehc.current)][$|lie:UNSLGX]]
Now we have seen the maximum number of bad logins for this host
rule[UNSLGX:[+lie:login_item_error^UNSLGX][+liehc:liehcount|current == liehc.maximum]
== >[!|printf("UNSLGX: Found %d bad logins for host\n",
liehc.maximum)][$|lie:UNSLGX][-|liehc]]

124 PBEST
Remove login item errors seen by rule groups UNSLOG and UNSLGX
rule[UNSLGGC:[+lie:login_item_error$UNSLOG][+lie:login_item_error$UNSLGX]
==>[!|printf("Removing bad login fact with timestamp %s %s\n",
lie.days, lie.seconds)][-|lie]]
This example incorporates two groups of rules, one for single users and one for hostsystems. The rules relating to single users are named UNSLOG1, UNSLOG2, and UN-SLOG, while the ones relating to hosts are UNSLGX1, UNSLGX2, and UNSLGX. Eachrule in both groups looks for login item error facts. The single user rules all mark factswith UNSLOG, while the host rules all use UNSLGX. Each rule also checks to see thatthe fact it is looking at has not already been marked by its rule group. The exampleincludes a rule that will remove facts that have been �seen� by both rule groups.
The syntax for all this is as follows. If a rule wants to mark a fact, it includes a clauselike :
[$|lie:UNSLGX]
in its consequent. This clause is taken from the consequent of the fact named UNSLGX.The $| followed by the fact alias and the mark name indicates the marking of the fact.If a rule wants to check for a fact marked with UNSLGX, it would include the clause
[+lie:login_item_error$UNSLGX]
in its antecedent. This clause is taken from the antecedent of the UNSLGGC rule.
If a rule wants to check for a fact that has not been marked with a certain mark, it shouldinclude a clause of the form
[+lie:login_item_error^UNSLGX]
in its antecedent. Similarly, if it wants to remove the mark from a fact, it should includea clause of the form

P B E S T 125
[^|lie:UNSLGX]
in its consequent.
The UNSLGCC rule gives an example of the technique for removing facts that multiplerules may want to use. This rule tries to find a fact that has been marked by both rulegroups. If it does find such a fact, it removes it.
One problem with the marking scheme is that we have not yet provided a robust wayto check for a single fact�s being marked by multiple marks. Looking at the UNSLGCCrule, we notice that there are two antecedent clauses, each checking for a fact with aparticular mark. There is no guarantee that they will both select the same fact, thoughin actuality they will because they will each scan the list of login item error facts inthe same way. However, this depends on several things, including the fact that the ruleUNSLGCC follows all the rules that may use the facts it removes, so they will fire first(it would probably be better to give the UNSLGCC rule a lower priority than these otherrules). So this way of checking a fact for more than one mark does work, but it is notreally clean or robust. We will probably fix the syntax for checking marks at a later time.
A.5 Communicating with the Outside World
The trivial expert system defined above has no need to obtain information from theoutside; it creates its own facts and processes them. Even this system, however, reportsa result to the user, and thus communicates with the outside world. In general, an expertsystem can both get information from the outside world and produce information. It doesthis by using its ability to invoke arbitrary C language function calls.
For facts to be added to the knowledge base, they must be asserted. From a C languagepoint of view, this happens when the function assert_< ptypename > gets called withthe proper arguments. That is, for each ptype the pbcc translator creates a function thatallows facts of that type to be asserted. To use these functions the user can write ruleslike the following:
This rule reads data into the knowledge base using theget_fact_record() routine. It has a very lowpriority so it doesn’t add new facts until the old oneshave been processed.
rule[get_fact_record_data (#-99;*):[?|‘retval != 'END_OF_FILE]

126 P B E S T
[+c : count]==>
[/c|value += 1][!| retval = get_fact_record()]]
The heart of this rule is the call to the C function get_fact_record(). Besides this,the rule checks for end of file and keeps a count of the number of records read. Theget_fact_record() function will read a record from somewhere (a file), move it into a seriesof variables, then call the assert_transaction() function with these variables for arguments.
Here is example code showing how the get_fact_record() function might look:
int get_fact_record()
int i, reader() ;
Read a record from the file into the buffer strings.*/i = reader(infp,(struct iovec *)iov1, 26);
if (i < 1)if (i == -1) {
fprintf (stderr, Problem with data file, error %d\n , errno) ;return(NO_DATA) ;else {fprintf(stderr, Reached end of file. \n ) ;return (END_OF_FILE) ;
assert-transaction (dbid,cpuid,repdate,reptime,recdate,rectime,
day,week,recordtype,jobname,userarea,usertype,

P B E S T 127
userid,altuserid,terminal,logon,
program,idesfile,command,response,duration,enqueue,
);return(GOOD_DATA);
}
For clarity, lots of detail is left out of this example. The get_fact_record() routine, how-ever, simply calls reader() to read a record into the proper buffer strings, then callsassert_transaction() to assert a transaction fact with this data into the knowledge base.Note that the reader() function must be written by the user, but the assert_transaction()function will be produced by the pbcc translator when it sees the following ptype decla-ration in the rule file:
ptype [transactiondbid:string,cpuid:string,repdate:string,reptime:string,recdate:string,rectime:string,day:string,week:string,recordtype:string,jobname:string,userarea:string,usertype:string,userid:string,altuserid:string,terminal:string,logon:string,program:string,idesfile:string,command:string,response:string,

128 P B E S T
duration:string,enqueue:string
]
The steps in making an input interface can be summarized as follows.
� Declare ptypes for the kinds of facts you want to assert into the knowledge base.
� Write a C language function that calls the proper assert_< ptypenane >() function.
� Write a rule that includes in one of its consequents or antecedents a call to this Clanguage function.
A . 6 O t h e r Programming Considerations
By default, pbcc creates a stand-alone C program. If the user invokes pbcc with the -eflag, the program that results will not contain a main0 function. This allows the userto �embed� the expert system in a larger program or to deal with special initializationrequirements. Any time the expert system is used in an embedded fashion, the user-written main() function must call the initialization routines gc_init() and pb_init() (inthat order). The gc_init() routine initializes the garbage-collecting memory allocator,while pb_init() initializes the expert system itself. The program must call these functionsbefore calling any other expert-system related functions.
If the program needs to transfer control to the expert system at some point, it shouldthen call the engine() function. This function will return when there are no more rulesthat can fire. There is no provision for finer-grained control of the expert system at thislevel.
If the program intends to use the X-Windows version of the expert system, it shouldnot call engine(); instead, it should call the function pb_xmonitor(). This function usesargc and argv, the complete call should be
pb_xmonitor(argc, argv);
This allows the X server to get access to X specific command line arguments.
Note that the expert system uses its own memory-allocation system that is not com-patible with malloc() and its related functions. A program that wants to allocatememory that may be passed to expert system functions should not use malloc()or calloc(); instead, it should request memory with the functions gc_malloc() and

P B E S T 129
gc_malloc_atomic(). The gc_malloc() function allocates memory that may contain point-ers, while gc_malloc_atomic() can be used to allocate memory for things like strings thatdo not contain pointers. These functions zero the memory they allocate.
One of the things the gc_init() function does is allocate a default heap from which toallocate memory. If the programmer knows that the program will use lots of memoryand create lots of garbage, it may speed things up somewhat to force expansion of theheap. (Note that an expert system that removes facts will create lots of garbage.) Thefunction expand_hp() does this. By expanding the heap, the program can run longerbefore it needs to collect garbage. Note that if the memory allocator is unable to reclaimenough memory by garbage collection to satisfy a memory request, it will automaticallyexpand the heap.
Since these functions use garbage collection to reclaim memory when necessary, theprogram does not need to explicitly free the memory it obtains from them. However,functions to explicitly free memory are provided.
For a complete description of the garbage collector, see the GC_README file includedwith the source code.
A.7 The PBEST Interactive Window System
This section describes the interactive window system that pbcc produces when it is in-voked with the -x flag. Figure 1 shows the display produced by running the tstx programdescribed in Section A.2. Note that this actually consists of two windows, the mainwindow and the menu window, arranged to overlap.

130 PBEST
Figure A.l: The PBEST Interactive Window
The main window has four areas. From top to bottom they are: the main buttons panel;the facts list, which is empty in Figure A.l; the firable rules list, which contains r0; andthe message window, which is empty. Notice that the Negate and List Fact buttons areghosted. Since the user has not selected a fact (as there are not yet any to select), it isimpossible to negate or list a fact.
The menu window, on the right, has three areas: the menu list, a user-input area marked�Assert�, and the menu buttons panel. The menu window is currently listing rules. Thereare four rules listed, r0 through r4. All of the menu buttons relating to rules are ghostedsince the user has not selected any rule. The Assert Fact button is also ghosted, sinceptypes are not being displayed.

PBEST 131
Figure A.2: The Result of Clicking on the Step Button
Figure A.2 shows the result of clicking on the Step button. Since r0 was the only rulethat could fire, the engine executed the conclusion of r0. The clauses in the conclusionof r0 asserted two facts into the fact base. These are shown in the facts list as <F1> and<F2>. They are identified with their types and the values of their fields. Note that factsget displayed in inverse chronological order, so the most recent facts will be visible bydefault. Since the facts list is a scrollable window, the user can view any fact, but usuallythe most recent ones are of interest.
Besides the facts, the firable rules list has changed. It now contains the line
r2: <f1>, <f2>
This line says that r2 can fire, and the facts that make it firable are facts <F1> and <F2>.(Note that it is possible for many combinations of facts to make a rule firable. In suchcases, the more recent facts will be selected to activate the rule.)

132 PBEST
Figure A.3: The Result of Selecting a Rule from the Rules List
Figure A.3 shows the result of selecting a rule from the rules list in the menu window. Inthis instance, the user has clicked on r0. Two of the buttons in the menu buttons panelhave become active.

PBEST 133
Figure A.4: The Effect of Clicking on the Set Breakpoint Button
Figure A.4 shows the effect of clicking on the Set Breakpoint button in the menu buttonspanel. The message window says that a breakpoint has been set at r1, and the UnsetBreakpoint and List Breakpoints buttons in the menu buttons panel have become active.

134 PBEST
Figure A.5: The Effect of Selecting a Fact in the Facts List
Figure A.5 shows the effect of selecting a fact in the facts list. The Negate and List Factbuttons in the main buttons panel have become active.

PBEST 135
Figure A.6: The Result of Clicking on the Trace Button
Figure A.6 results from the user�s clicking on the Truce button in the main buttons paneland then clicking on the Step button. Notice that the Trace button has changed intoa Notrace button. Besides this, each time a rule fires, the engine displays messages inthe message window, indicating some of its effects. In this case, r2 has deleted <Fl>,asserted a new count fact, <F3>, and modified <F2>. Note that when a fact getsmodified, the engine does this by deleting the old fact and asserting a new fact with thefields of this fact set to their new values. Thus, <F2> has become <F4>. This meansthat the engine will look at newly modified facts before looking at older facts when ittries to find groups of facts to fire a rule.

136 PBEST
Figure A.7: The Result of Clicking on the -> Pypes Menu Button
Figure A.7 shows the result of clicking on the -> Ptypes Menu button. This buttonlets you switch the menu display between ptypes and rules. Once you are displayingptypes, you can select a ptype and assert a new fact of this ptype into the knowledgebase. This can be useful for making sure a rule will fire in the presence of a fact withcertain characteristics.
To assert a fact, perform the following steps.
� Make the menu display ptypes.
� Select the desired ptype.
� Click on the Assert Fact button.
� Type the fact fields into the Assert box in response to the prompts that will showup above the typing area.
The following sequence of figures illustrates this process.
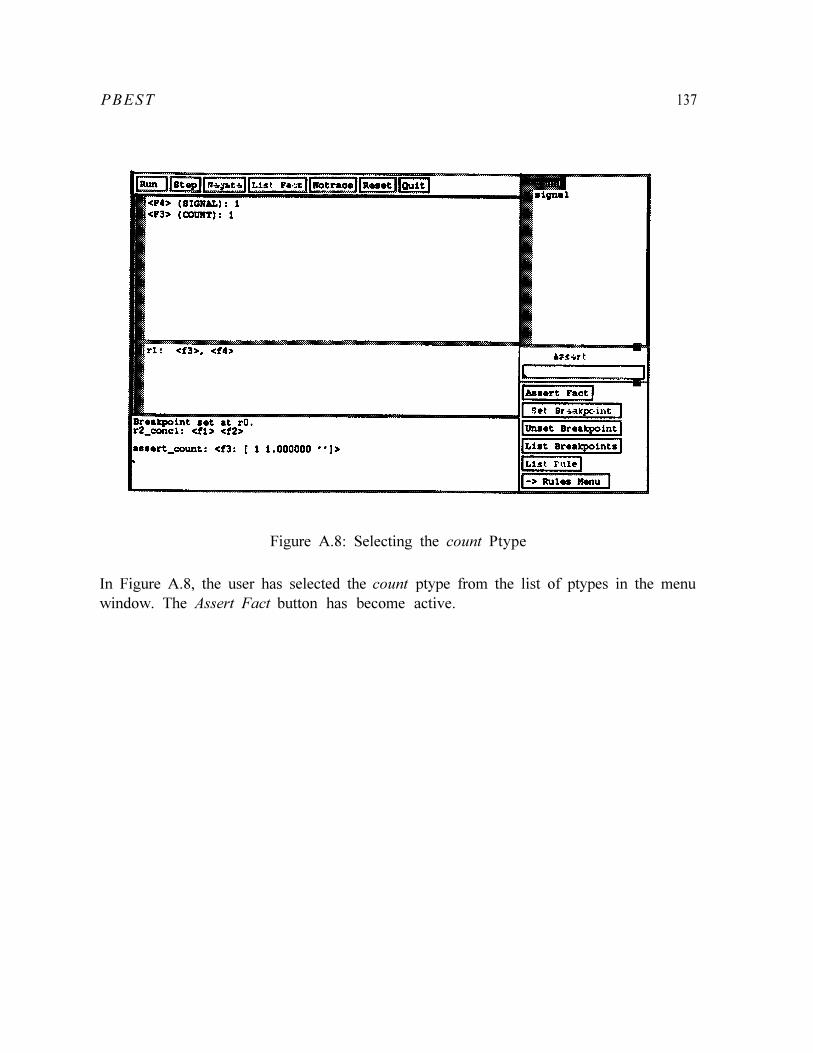
PBEST 137
Figure A.8: Selecting the count Ptype
In Figure A.8, the user has selected the count ptype from the list of ptypes in the menuwindow. The Assert Fact button has become active.

138
Figure A.9: The Effect of Clicking on the Assert Fact Button
The user has clicked on the Assert Fact button in Figure A.9. It becomes inactive (youhave to finish asserting a fact before you can assert a new one). A message appears inthe message window, indicating that the user is asserting a count fact, and explaininghow to abort the assertion process. A prompt, value:int, has appeared in the entry areaof the menu window.

139
Figure A.10: Fact is Asserted
In Figure A.10, the user typed in the number 10 and pressed <return>.
Since this is the only field for that fact, the fact gets asserted. A message to this effectshows up in the message window, and the fact itself shows up in the facts list window.
Note that if the user had typed in some invalid input, for example, lo instead of 10, thisinput would not be accepted. Instead, the system would beep when the <return> keywas pressed.
Facts can also be removed from the knowledge base with the Negate button in the mainbuttons panel.

140 PBEST
Figure A.11: Selecting a Fact to Negate
The user has selected a fact to negate in Figure A.11. The Negate and List Fact buttonshave become active.

PBEST 141
Figure A.12: The Effect of Clicking on the Negate Button
In Figure A.12, the user has clicked on the Negate button. The fact gets removed fromthe knowledge base. The facts list is updated to reflect this, and the Negate and ListFact buttons return to their inactive state.

142 PBEST
We can summarize the functions of the buttons as follows:
Run The Run/Stop toggle. Clicking on it puts the expert-system engine in free-runningmode if it is stopped, or stops it if it is running. The button label changes appro-priately.
Step Drives the engine through one rule-firing cycle. It can also be used to stop thesystem if it is running.
Negate Removes the selected fact from the knowledge base.
List Fact Lists the selected fact. It is useful mostly when the fact has many fields thatcannot all fit in the fact list window.
Trace Toggles tracing of the execution of the engine. When tracing is enabled, theengine prints messages indicating what it is doing in the message window. Thelabel in the button will change to reflect what clicking on the button will do.
Reset Deletes all facts and breakpoints.
Quit Terminates the execution of the program and returns control to the shell.
The buttons in the menu buttons panel work as follows.
Set Breakpoint Associates a breakpoint with the selected rule; when the running en-gine tries to fire a rule with a breakpoint, it will stop instead. Clicking on Runor Step after the engine stops at a breakpoint causes the engine to execute theconclusion of the rule with the breakpoint and then continue as appropriate. Notethat breakpoints are not removed when they are hit. If the engine tries to fire therule again later, the breakpoint will again cause it to stop.
Unset Breakpoint Removes the breakpoint from the selected rule, if the rule has one.If the rule doesn�t have a breakpoint, the program displays a message in the messagewindow indicating that the selected rule had no breakpoint.
List Breakpoints Causes the program to print a list of rules with breakpoints in themessage window.
List Rule Causes the program to print some information about the selected rule in themessage window.
-> Ptypes Menu / -> Rules Menu Toggles the menu window between displayingptypes and rules.
Assert Fact Allows the user to assert an instance of a selected ptype as a fact into theknowledge base.
P B E S T 143
A.8 Certainties and Justifications
The PBEST system currently supports three kinds of certainty factors: standard(MYCIN-like), Bayesian, and fuzzy. These can be specified by a command line argu-ment to pbcc. See Section A.11 on invoking pbcc for how to do this. We do not presentlyanticipate using certainty factors in the IDES project. Should this change, we will incor-porate a more complete description of certainty factors into this document.
PBEST also has a justification mechanism; however, this is not well supported. Wecurrently consider it to be superfluous in light of PBEST�s ability to execute arbitraryC language functions. Should our opinion on this matter change, we will modify boththe implementation and the documentation to reflect whatever role we anticipate forjustifications.
A.9 A Sample Makefi le
The following is a Makefile that automates the production of expert systems from specifi-cation files. To produce both a window (based on the X Window System) and nonwindowversion from the same set of rules, just give the command
make
at the shell prompt. To create only the X-Windows version, give the command
make tstx
at the shell prompt. To create the nonwindow version, give the command
make tst
at the shell prompt.
This file uses certain macro abbreviations that specify the locations of the libraries andother files needed to make the executable programs. The user should make sure thatthese are set correctly.

144 PBEST
# Directory structure macros -- should only need to change# the value of the ROOT macroROOT=/home/caesar
IDES=$(ROOT)/idesIDESLIB=$(IDES)/lib
# Where the PBEST translator isPBCC= $(IDES)/bin/pbcc
# Show version number.PBCCFLAGS= -v
# The garbage collector and runtime librariesPBCCLIBS=$(IDESLIB>/gc.o $(IDESLIB)/libpb.a
# The window librariesXLIBS= $(IDESLIB)/libiui.a -lXaw -lXmu -1Xt -1X11
# C compiler stuff -- need the system v compatibility# versionCC= /usr/5bin/cc
# Include symbols, search the ides and# global include directoriesCFLAGS= -g -I$(IDES)/include -I/usr/global/include
#.SUFFIXES: .pbest#
############################################################Everything above here can be used as a skeleton Makefile.The only thing that should need to change is ROOT, whichshould be set when the system is installed.
Things below should be used more as an example. The mainthing is to make sure each language processor knows how tofind the libraries it is looking for.
SRC= tst.pbest

PBEST
OBJ= tst.oXOBJ= tstx.o
## NOTE: You must use TABS (^I) between the target and the# dependencies, and to start off the command lines# below each target-dependency specification.# Failure to do this will cause the make program to# refuse to do what you want and to produce a series# of uninformative error messages# this space made by tabs# ||||||# VVVVVVall:
tst:
tstx:
tst.o:
tst.c:
tstx.o:
tstx.c:
end:
A.10
tst tstx
$(OBJ)$(cc) -o $@ $(OBJ) $(PBCCLIBS)
$ (XOBJ)$(CC) -o $@ $(XOBJ) $(PBCCLIBS) $(XLIBS)
tst.c$(CC) $(CFLAGS) -c tst.c
tst.pbest$(PBCC) $(PBCCFLAGS) -o $@ tst.pbest
tstx.c$(CC) $(CFLAGS) -c tstx.c
tst.pbest$(PBCC) $(PBCCFLAGS) -x -o $@ tst.pbest
PBEST Syntax Diagrams
145
This section includes syntax diagrams for the PBEST expert-system specification lan-guage. The diagrams use fairly standard conventions. For example, <object a> ::=

146 PBEST
<object b> means that the object on the left has the syntax shown on the right. �Lit-erals� or keywords are in bold face. This includes brackets, bars, plus signs, and so onthat are written in boldface. The same symbols in lightface have a different meaning, asfollows.
� | (nonbold vertical bar) indicates alternatives; that is, we would say
<statement > ::= <ptypedef>I <ruledef>I <ccode>I <xrefdef>I <comment >
to indicate that a statement can be a ptypedef, a ruledef, an instance of ccode, anxrefdef, or a comment.
� * (nonbold superscript asterisk) indicates that an item can occur as many times asdesired, but need not appear. For example,
<ante> . . -. . - [<clause>]*
says that an antecedent consists of zero or more clauses.
� + (nonbold superscript plus) indicates that an item can occur as many times asdesired, but must appear at least once. For example,
<cons> ::= [<action>]+
says that a consequent must consist of at least one action clause (though it mayhave as many more as desired).
� [ ] (nonbold brackets) surrounding an item indicate grouping. In the examplesabove, the brackets indicate that the asterisk and plus apply to whatever is insidethe brackets. If the brackets surround an item, but are not followed by an asteriskor plus, they indicate that the item may occur zero times or once. For example
< m a r k t e s t > : : = $ [ < n a m e > ]
I �[<name>]
indicates that a mark test has an optional name after the dollar sign or up caret.
Several abbreviations are used. Some may be confusing:
� relop - relational (comparison) operator
� assop - assignment operator
� funcall - C language function call
� rcf - rule certainty factor

PBEST
� exstat - externally defined statement
< p b p r o g > : : = [ < s t a t e m e n t > ]+
<statement > ::= <ptypedef><ruledef><ccode>
<xrefdef><comment>
<ptypedef> ::= ptype [ <name> <fields> ]
<fields> ::= <field>[,<field>]*
<field> . . -. . - <name>I <name>:<typename>
<typename> : := in teger float list
stringsymbol
<ruledef> ::= rule [ <name> [(<opts> )] : <ante> => <cons> ]
147
<opts> ::= <opt>[;<opt>]*

PBEST148
<opt >
<rank>
<repeat >
<certainty>
<explanation>
<ante>
<clause>
<pname>
<marktest>
. . -. . -
. . -. . -
. . -. . -
. . -. . -
. . -. . -
. . -. . -I
. . -. . -I
<rank><repeat><certainty><explanation>
# <integer>
*
~ <real>
<string>
[<clause>]*
[+<pname>[<marktest>][<restrictions>]][-<name>[<marktest>][<restrictions>]][?<restrictions>]
<name> : <name><name>
$[<name>]^[<name>]
<restrictions> ::= | <restricts>
<restricts> ::= <restrict>[,<restrict>]*
<restrict > ::= <expr> <relop> <expr>I <expr>

PBEST 149
<expr>
<relop>
( <expr> )<expr> + <expr><expr> - <expr><expr> * <expr><expr> / <expr><expr> % <expr><expr> >> <expr><expr> << <expr><expr> & <expr><expr> � <expr><expr> <expr><expr> && <expr><expr> <expr><pvalue>
>=<=
<pvalue> ::= <name> <name>
<integer><real><string><pfield><list ><funcall>

150
<assop>
<pfield>
< l i s t >
<funcall>
<arglist>
<cons>
<action>
<negate>
<mark>
<unmark>
PBEST
::= <name> . <name>
::= [ [<pvalue>)*]
::= <name> ( [<arglist>] )
::= [<pvalue>],+
::= [<action>]+
::= [ < n e g a t e > ][ <mark>][<unmark>][ <assert>][<modify>][ <execute> ]

PBEST 151
<assert > ::= + <name> [<arestricts>][<rcf>]
<modify> ::= / <name> [<arestricts>][<rcf>]
<arestricts> ::= | <arestrict>[,<arestrict>]*
<arestrict> ::= <expr> <assop> <expr>
I <expr>
::= !|[<exstat>]T<execute>
<exstat>
<xassign>
<rcf>
<ccode>
<xrefdef>
<name>
<string>
<integer>
::= <xassign>I <funcall>
. . -. . - [']<name> <assop> <expr>
. . -. . - <real>
::= { <string> }
::= xtype [ <name> : <typename> ]
::= [A-Za-z]+[A-Za-z0-9_]I�
. . - [<any character>]*
. . -
<real> ::= [o-g]*

152 PBEST
<comment> . . -. . - � [<any character>]* <newline>

153
A.11 Invoking p b c c
N A M E
p b c c - translate a PBEST source program into C code.
SYNOPSIS
pbcc [-c[s|f|b]] [-d|-x] [-e] [-j] [-VI [-o <file>] [<file>]
D E S C R I P T I O N
pbcc is a program for translating expert-system rule bases written in the language ofPBEST into C language source code for compilation. The following is a description ofthe command line arguments that the user can give when invoking pbcc.
-c[s|f|b] Turns on certainty factors. -cs specifies standard certainty factors that im-plement the Mycin strategy, -cf specifies fuzzy certainty factors, and -cb specifiesBayesian certainty factors.
-d Turns on the Sunview-based debugging options. This will create a source modulethat, when compiled and linked with the pb library, will produce a window-basedmonitor for the expert system. See also the -x option below. Note that either -dor -x can be specified, but not both.
-e Suppresses the generation of a main() function. In this case, the user must pro-vide a main() function that includes calls to the initialization routines gc_init()and pb_init(), and a call to one of engine(), pb_monitor() or pb_xmonitor(),depending on which version of the expert system is being generated.
-j Turns on the generation of fact justifications.
-0 <file> Places output into the file named <file> in the current working directory. Ifthis option is not specified, output is sent to standard output.
-V Causes the version number and release date of the current version of pbcc to beprinted.
-X Turns on the X-windows-based debugging options. This will create a source modulewhich, when compiled and linked with the pb library, will produce a window-basedmonitor into the expert system. Note that either -d or -x can be specified, but notboth.

154
PBEST

Bibliography
[l] T. F. Lunt, R. Jagannathan, R. Lee, S. Listgarten, D. L. Edwards, P. G. Neumann,H. S. Javitz, and A. Valdes. Development and Application of IDES: A Real-TimeIntrusion-Detection Expert System. Technical report, Computer Science Laboratory,SRI International, Menlo Park, California, 1988.
[2] T. F. Lunt, R. Jagannathan, R. Lee, A. Whitehurst, and S. Listgarten. Knowledge-based intrusion detection. In Proceedings of the 1989 AI Systems in GovernmentConference, March 1989.
[3] T. F. Lunt and R. Jagannathan. A prototype real-time intrusion-detection system.In Proceedings of the 1988 IEEE Symposium on Security and Privacy, April 1988.
[4] T. F. Lunt. Real-time intrusion detection. In Proceedings of COMPCON Spring �89,March 1989.
[5] T.F. Lunt, A. Tamaru, F. Gilham, R. Jagannathan, P.G. Neumann, and C. Jalali. Aprogress report. In Proceedings of the Sixth Annual Computer Security ApplicationsConference, December 1990.
[6] T.F. Lunt, A. Tamaru, F. Gilham, R. Jagannathan, C. Jalali, H.S. Javitz, A. Valdes,and P.G. Neumann. A Real- Time Intrusion-Detection Expert System. Technicalreport, Computer Science Laboratory, SRI International, Menlo Park, California,1990.
[7] T. F. Lunt. Using statistics to track intruders. In Proceedings of the Joint StatisticalMeetings of the American Statistical Association, August 1990.
[8] T. F. Lunt. IDES: An intelligent system for detecting intruders. In Proceedingsof the Symposium: Computer Security, Threat and Countermeasures, Rome, Italy,November 1990.
[9] H.S. Javitz and A. Valdes. The SRI statistical anomaly detector. In Proceedings ofthe 14th National Computer Security Conference, October 1991.
[10] T.D. Garvey and T.F. Lunt. Model-based intrusion detection. In Proceedings of the14th National Computer Security Conference, October 1991.
155
156 Bibliography
[11] J. P. Anderson. Computer Security Threat Monitoring and Surveillance. Technicalreport, James P. Anderson Company, Fort Washington, Pennsylvania, April 1980.
[12] H. S. Javitz, A. Valdes, D. E. Denning, and P. G. Neumann. Analytical TechniquesDevelopment for a Statistical Intrusion Detection System (SIDS) Based on Account-ing Records. Technical report, SRI International, Menlo Park, California, July 1986.Not available for distribution.
[13] T. F. Lunt, J. van Horne, and L. Halme. Automated Analysis of Computer SystemAudit Trails. In Proceedings of the Ninth DOE Computer Security Group Conference,May 1986.
[14] T. F. Lunt, J. van Horne, and L. Halme. Analysis of Computer System AuditTrails--Initial Data Analysis. Technical Report TR-85009, Sytek, Mountain View,California, September 1985.
[15] T. F. Lunt, J. van Horne, and L. Halme. Analysis of Computer System AuditTrails-Intrusion Characterization. Technical Report TR-85012, Sytek, MountainView, California, October 1985.
[16] T. F. Lunt, J. van Horne, and L. Halme. Analysis of Computer System Audit Trails-Feature Identification and Selection. Technical Report TR-85018, Sytek, MountainView, California, December 1985.
[17] T. F. Lunt, J. van Horne, and L. Halme. Analysis of Computer System Audit Trails-Design and Program Classifier. Technical Report TR-86005, Sytek, Mountain View,California, March 1986.
[18] J. van Horne and L. Halme. Analysis of Computer System Audit Trails-Trainingand Experimentation with Classifier. Technical Report TR-85006, Sytek, MountainView, California, March 1986.
[19] J. van Horne and L. Halme. Analysis of Computer System Audit Trails-FinalReport. Technical Report TR-85007, Sytek, Mountain View, California, May 1986.
[20] T. F. Lunt. Automated audit trail analysis and intrusion detection: A survey. InProceedings of the 1lth National Computer Security Conference, October 1988. �
[21] D. E. Dennning and P. G. Neumann. Requirements and Model for IDES-A Real-Time Intrusion Detection System. Technical report, Computer Science Laboratory,SRI International, Menlo Park, California, 1985.
[22] D. E. Denning. An intrusion-detection model. IEEE Transactions on SoftwareEngineering, 13(2), February 1987.
[23] National Computer Security Center. Department of Defense Trusted Computer Sys-tem Evaluation Criteria. DOD 5200.28-STD, Department of Defense, December1985.

Bibliograpy 157
[24] R. Jagannathan and A.A. Faustini. GLU: A system for scalable and resilient large-grain parallel processing. In Proceedings of 24th Hawaii International Conferenceon System Sciences, Kauai, Hawaii, January 1991.
[25] R. Jagannathan and A.A. Faustini. The GLU Programming Language. TechnicalReport SRI-CSL-90-11, Computer Science Laboratory, SRI International, MenloPark, California, November 1990.
[26] R. Jagannathan. Transparent multiprocessing in the presence of fail-stop faults. InProceedings of the Third Workshop on Large-Grain Parallelism, Pittsburgh, Penn-sylvania, October 1989.
[27] R. Jagannathan. A Descriptive and Prescriptive Model for Dataflow Semantics.Technical Report CSL-88-5, Computer Science Laboratory, SRI International, MenloPark, California, May 1988.
[28] John D. Lowrance, Thomas D. Garvey, and Thomas M. Strat. A framework forevidential-reasoning systems. In Proceedings of the National Conference on ArtificialIntelligence, pages 896-903,445 Burgess Drive, Menlo Park, California, August 1986.American Association for Artificial Intelligence.