a raman spectro-microscopic investigation of etfe-based
TRANSCRIPT

RSC Advances
PAPER
Ope
n A
cces
s A
rtic
le. P
ublis
hed
on 1
1 O
ctob
er 2
017.
Dow
nloa
ded
on 1
1/28
/202
1 7:
12:1
3 PM
. T
his
artic
le is
lice
nsed
und
er a
Cre
ativ
e C
omm
ons
Attr
ibut
ion
3.0
Unp
orte
d L
icen
ce.
View Article OnlineView Journal | View Issue
A Raman spectro
Department of Chemistry, The University of S
† Electronic supplementary informationRaman spectra/maps in support of the ma
Cite this: RSC Adv., 2017, 7, 47726
Received 30th August 2017Accepted 3rd October 2017
DOI: 10.1039/c7ra09650j
rsc.li/rsc-advances
47726 | RSC Adv., 2017, 7, 47726–4773
-microscopic investigation ofETFE-based radiation-grafted anion-exchangemembranes†
Wai Hin Lee, Carol Crean, John R. Varcoe and Rachida Bance-Soualhi *
This study used Raman spectro-microscopy to investigate the synthesis and degradation of radiation-
grafted anion-exchange membranes (RG-AEM) made using 50 mm thick poly(ethylene-co-
tetrafluoroethylene) (ETFE) films, vinylbenzyl chloride (VBC) monomer, and 1-methylpyrrolidine (MPY)
amination agent. The data obtained confirmed the operation of the grafting-front mechanism. VBC
grafting times of 1 and 4 h led to low degrees of grafting homogeneity, while 72 h led to extreme levels
of grafting that resulted in mechanically weak RG-AEMs due to the excessive H2O contents. A grafting
time of 16 h was optimal yielding a RG-AEM with an ion-exchange capacity (IEC) of 2.06 �0.02 mmol g�1 (n ¼ 3). An excess of grafting was detected at the surface of this RG-AEM (at least within
the first few mm of the surface). This RG-AEM was then degraded in O2-purged aqueous KOH
(1.0 mol dm�3) for 14 d at 80 �C. Degradation was detected throughout the RG-AEM cross-section,
where the Raman data was quantitatively consistent with the loss of IEC. A slight excess of degradation
was detected at the surface of the RG-AEM. Degradation involved the loss of whole benzyl-1-
methypyrrolidinium grafted units as well as the direct attack on the pendent (cationic) pyrrolidinium
groups by the hydroxide anions.
Introduction
Radiation-graing is a useful technique for the production offunctional membranes (and other polymeric materials).1 Thistechnique has been commonly used to produce solid electrolytes,e.g. ion-exchange membranes (IEM), including proton-exchangemembranes (PEM) for use in technologies such as proton-exchange membrane fuel cells (PEMFCs) and PEM-based waterelectrolysers.2 A more recent line of research is the developmentof anion-exchange membranes (AEM) for use in alkaline Anion-Exchange Membrane Fuel Cells (AEMFCs) and AEM-based Alka-line Water Electrolysers (AEM-AWE):3 this includes the use ofradiation-graed (RG) types.4 The use of high pH, hydroxide-conducting solid electrolytes allows for a broader range of elec-trocatalysts that do not involve scarce, expensive Pt.5 Scheme 1outlines the steps involved in the synthesis of such a RG-AEM:pre-irradiation in air (peroxidation) of poly(ethylene-co-tetra-uoroethylene) (ETFE) precursor lm, followed by graing withvinylbenzyl chloride (VBC) monomer and amination with1-methylpyrrolidine (MPY).6
Incomplete graing can lead to RG-IEMs with lower thanideal functionalisation, which are then too ionically resistive for
urrey, Guildford, GU2 7XH, UK. E-mail: r.
(ESI) available: Additional data andin article. See DOI: 10.1039/c7ra09650j
7
application. Radiation-graing oen involves the graing-frontmechanism, especially with thicker precursor lms:6–8 this iswhere graing initiates on the surfaces of the precursor lms
Scheme 1 An outline of the synthesis of ETFE-based pyrrolidinium-type radiation-grafted anion-exchange membranes (RG-AEM) in thechloride-anion form. The precursor ETFE film used in this study was50 mm thick. The main variable in this study was the grafting time (x).
This journal is © The Royal Society of Chemistry 2017

Fig. 1 A diagram showing the grafting front mechanism that iscommonly encountered in the synthesis of radiation-graftedmembranes. The white dashed rectangle indicates a typical Ramanspectro-microscopy cross-sectional mapping region (i.e. the 30 �65 mm areas used in this study).
Paper RSC Advances
Ope
n A
cces
s A
rtic
le. P
ublis
hed
on 1
1 O
ctob
er 2
017.
Dow
nloa
ded
on 1
1/28
/202
1 7:
12:1
3 PM
. T
his
artic
le is
lice
nsed
und
er a
Cre
ativ
e C
omm
ons
Attr
ibut
ion
3.0
Unp
orte
d L
icen
ce.
View Article Online
with the gradual penetration of the gras into the bulk of thelms (Fig. 1). As radiation-graing involves the modication ofsolid polymer lms (up to 150 mm thickness in the literature),1 itis essential to assess the uniformity of the monomer graing(and any subsequent functionalisation) throughout the core ofthe resulting RG-IEMs.9 Techniques that have been used tostudy the uniformity of graing include Scanning ElectronMicroscopy coupled with Energy-Dispersive X-ray Spectroscopy(SEM-EDX)8,10 and Raman spectro-microscopy.6,9,11
Raman spectroscopy can achieve spectral resolutions downto ca. 0.3 cm�1 and is a powerful spectroscopy that bothcomplements and supports other spectroscopies (vibrational,rotational, and electronic).12 As Raman spectrometers involvethe use of lasers, the spectrometers are commonly coupled to(confocal) microscopic equipment that allows individualspectra to be recorded on different parts of a sample with spatialresolutions as low as ca. 1 mm diameter.13‡ As the cost of Ramaninstrumentation has generally decreased in the last 10 years§and the familiarity with the technique has increased, the use ofRaman spectro-microscopy is becoming more widespread androutine in the eld of materials science. The use of Ramanspectro-microscopy oen has the advantage of requiringminimal levels of sample preparation. The primary disadvan-tage is that the quality of spectra is oen degraded due to thepresence of photoluminescence interferences such as uores-cence. If Raman equipment is available that possesses multiplelaser wavelengths (l), it is oen possible to select a laser
‡ Sub-micron resolution can be less routinely obtained with the use of high costequipment and low wavelength lasers, especially with the use of tip-enhancedRaman spectroscopy (TERS), which couples atomic force microscopes withRaman instrumentation.
§ Raman microscopes are still generally more expensive than for IRinstrumentation (>£100k vs. <£50k).
This journal is © The Royal Society of Chemistry 2017
wavelength that minimises such interferences (but, obviously,this adds to the cost of the equipment).
Given the spatial resolution of Raman spectro-microscopycan be as low as 1 mm during routine measurements (and thatprevious RG-IEMs reported in the literature are typically up toca. 150 mm in thickness),1 this technique can be a useful qualityassurance tool for the study of the radiation-graing homoge-neity (especially through the membrane cross-section). Ramanspectro-microscopic mapping has already been used to studyRG-AEMs, but these experiments have typically taken 8–16 h permap (as Raman scattered light is of low intensity):6,9 this is non-ideal considering the life-times of expensive (£10k+) lasers istypically only a few thousand hours (of in use time).
Herein, the aim of this study is to investigate the optimumlaser wavelength and spectral collection parameters that willallow for the more rapid and routine use of Raman spectro-microscopy in the study of each stage (graing, amination) ofthe synthesis of RG-AEMs. This study will then use thisknowledge to conduct an initial investigation into the homo-geneity of the degradation of a RG-AEM when it is exposed toaqueous KOH (1.0 mol dm�3) at 80 �C for 14 d.
ExperimentalMaterials and chemicals
Commercial Nowoon ET-6235Z ETFE lm of 50 mm thicknesswas supplied by Nowofol Kunstoffprodukte GmbH (Germany)and was used as the precursor material. Vinylbenzyl chloride(VBC, 97%, mixture of 3- and 4-isomers, used without removalof 4-tert-butylcatechol and nitromethane inhibitors), 1-octy-2-pyrrolidone dispersant, and 1-methylpyrrolidine (MPY, 97%)were purchased from Sigma-Aldrich. Standardised analyticalaqueous solutions of AgNO3 (20.00 � 0.06 mmol dm�3) andaqueous HNO3 (2.0 mol dm�3), used for the IEC determina-tions, were supplied from Fluka. All other chemicals, includinganalytical grade aqueous solutions of NaCl (1.0 mol dm�3) andKOH (1.0 mol dm�3), toluene, and NaNO3(s) were used asreceived. Ultrapure water (UPW, resistivity ¼ 18.2 MU cm) wasused throughout this study.
Preparation of the radiation-graed anion-exchangemembranes
Graing stage. The pre-aminated ETFE-g-poly(VBC)membranes were prepared by graing VBC onto peroxidatedETFE lms as described previously.9 The ETFE lms (13 �13 cm) were irradiated in air to 70 kGy total absorbed dose usinga 4.5 MeV Dynamatron Continuous DC Electron Beam Unit(Synergy Health, South Marston, UK, see Fig. S1 in the in theESI†). The peroxidated lms were immersed into glass tubescontaining a mixture (250 cm3) of 5% vol. VBC, 1% vol. 1-octy-2-pyrrolidone, and 94% vol. UPW, which was then purged with N2
for 2 h. The sealed tubes were subsequently placed in a pre-heated water bath at 70 �C for the desired duration of graingreaction (1–72 h). Finally, the graed membranes were thor-oughly washed with toluene and then dried in a vacuum oven at
RSC Adv., 2017, 7, 47726–47737 | 47727

Table 1 Details of the Raman lasers used in this study{
Wavelength/nm 785 633 532 457Max. power/mW 300 20 50 20Colour Near-IR Red Green BlueType Line Spot Spot SpotGrating/lines mm�1 1200 1800 2400 2400Laser spot sizea/mm 1.28 1.03 0.87 0.74Filter cut-off/cm�1 50 100 100 100
a Theoretical smallest laser spot diameter calculated (1.22 � l/NA)assuming the use of a 50� (NA ¼ 0.75) objective: the 785 nm linelaser was used with the pinhole applied to expose the sample toa well-dened laser spot (rather than a laser line) but this reduces thepower at the sample.
RSC Advances Paper
Ope
n A
cces
s A
rtic
le. P
ublis
hed
on 1
1 O
ctob
er 2
017.
Dow
nloa
ded
on 1
1/28
/202
1 7:
12:1
3 PM
. T
his
artic
le is
lice
nsed
und
er a
Cre
ativ
e C
omm
ons
Attr
ibut
ion
3.0
Unp
orte
d L
icen
ce.
View Article Online
70 �C. The degree of graing (DoG) of each pre-aminatedmembrane was calculated as follows:
DoG ð%Þ ¼ mg �mi
mi
� 100 (1)
where mg is the mass of the graed membrane and mi is theinitial mass of the peroxidated ETFE lm used.
Amination stage. A previous study revealed that aminationwith MPY yielded RG-AEMs that were more stable towardsattack by OH� anions (more alkali stable) than RG-AEMs syn-thesised using the more commonly encountered trimethyl-amine (TMA) reagent.6 Therefore, MPY was used to convert thepre-aminated membranes into the desired RG-AEM(Cl�)s. Thepre-aminated ETFE-g-poly(VBC) membranes were submerged inaqueous MPY solution (50% vol.) and heated at 70 �C for 24 h.The crude RG-AEMs were then washed with UPW before beingheated in water for 6 h at 70 �C. Subsequently, the membraneswere soaked in aqueous NaCl (1.0 mol dm�3) solution for 12 h(with several changes of solution during this period to ensurethe Cl�-anion forms of the RG-AEMs). The nal RG-AEM(Cl�)swere obtained aer thorough washing with UPW (over 16 h withat least 5 changes in UPW to removal all excess counter- and co-ions), and stored in UPW until required for use in experiments.
Membrane designations
The following nomenclature is used to unambiguously identifythe different samples (see Scheme 1):
Ex a nal RG-AEM(Cl�) synthesised with x h graing time;Intx the pre-aminated ETFE-g-poly(VBC) membranes used to
fabricate Ex;AE16 the E16 RG-AEM(Cl�) that has been aged for 14 d at
80 �C in aqueous KOH (1.0 mol dm�3) solution that has beenpurged with O2 (see below).
Water uptakes (WU)
RG-AEM(Cl�) samples were removed from the storage water andexcess surface water was removed by dabbing with lter paper.The hydrated masses (mhyd) were speedily recorded (to avoiddehydration on prolonged exposure to the atmosphere). TheAEM samples were subsequently dried in a vacuum oven at50 �C for 24 h before the dry masses (mdry) were speedilyrecorded (dry AEMs are generally hygroscopic). All measure-ments were repeated on n ¼ 3 samples of each RG-AEM(Cl�).The WU value for each sample was then calculated:
WU ð%Þ ¼ mhyd �mdry
mdry
� 100 (2)
{ The Renishaw Raman instrument used contains a 5th laser (244 nm deep UV)but this is not appropriate for this study: the laser damages the polymersamples, even at the lowest power setting.
Ion-exchange capacities (IEC)
The dehydrated RG-AEM(Cl�)s samples (mdry/g) collectedstraight from the WU measurements above were individuallyimmersed into excess aqueous NaNO3 (2.4 mol dm�3, 20 cm3)solutions for 24 h. The solutions, still containing the AEMsamples, were then acidied with aqueous HNO3 (2.0 moldm�3, 2.0 cm3) and titrated using the aqueous AgNO3 (20.00 �
47728 | RSC Adv., 2017, 7, 47726–47737
0.06 mmol dm�3) solution. A Metrohm 848 TitrinoPlus autoti-trator equipped with a Ag-Titrode was used for the titrations.The IEC for each sample was calculated from the end-point (Ep):
IEC�mmol g�1
� ¼ Ep ðcm3Þ � 0:02 ðmol dm�3Þmdry ðgÞ (3)
Alkali stability testing
A select RG-AEM(Cl�), synthesised with 16 h of graing reactionduration (E16), was subjected to alkali aging tests. A sample ofE16 (7 � 7 cm) was immersed in an excess of aqueous KOH(1.0 mol dm�3) solution that was then purged with O2 for 1 h.Previous studies have indicated that alkali degradation is moreextreme in O2-containing aqueous alkali compared to inert-gaspurged aqueous alkali.14 The polypropylene bottle was thenimmediately sealed (aer purging) and placed in oven at 80 �Cfor 14 d. Aer this alkali ageing process, the sealed bottle wascooled to room temperature and the aged sample (designatedAE16) was then re-exchanged back to the Cl�-anion form usingion-exchange with aqueous solution NaCl (1.0 mol dm�3) fol-lowed by thorough washing with UPW for 16 h (with at least 5changes of fresh UPW during this period). As well as the Ramanexperiments, the IEC of AE16 was also determined.
Raman spectro-microscopic procedures
Raman spectra and cross-sectional maps were recorded usingan InVia Reex RamanMicroscope (Renishaw, UK) using 4 laserexcitation wavelengths (Table 1).{ The Raman microscope wastted with a cooled charged coupled detector (CCD) along withholographic notch lters and gratings tailored for each laserwavelength. The attached Leica DMLM optical microscope wasequipped with different objective lenses and a trinocular viewerthat accommodates a video camera, allowing direct viewing ofthe sample. Daily calibration of the instrument was conductedby recording the Raman spectrum of silicon in static mode. Ifnecessary, an offset correction was performed to ensure that theposition of the silicon peak to be 520 � 1 cm�1.
This journal is © The Royal Society of Chemistry 2017
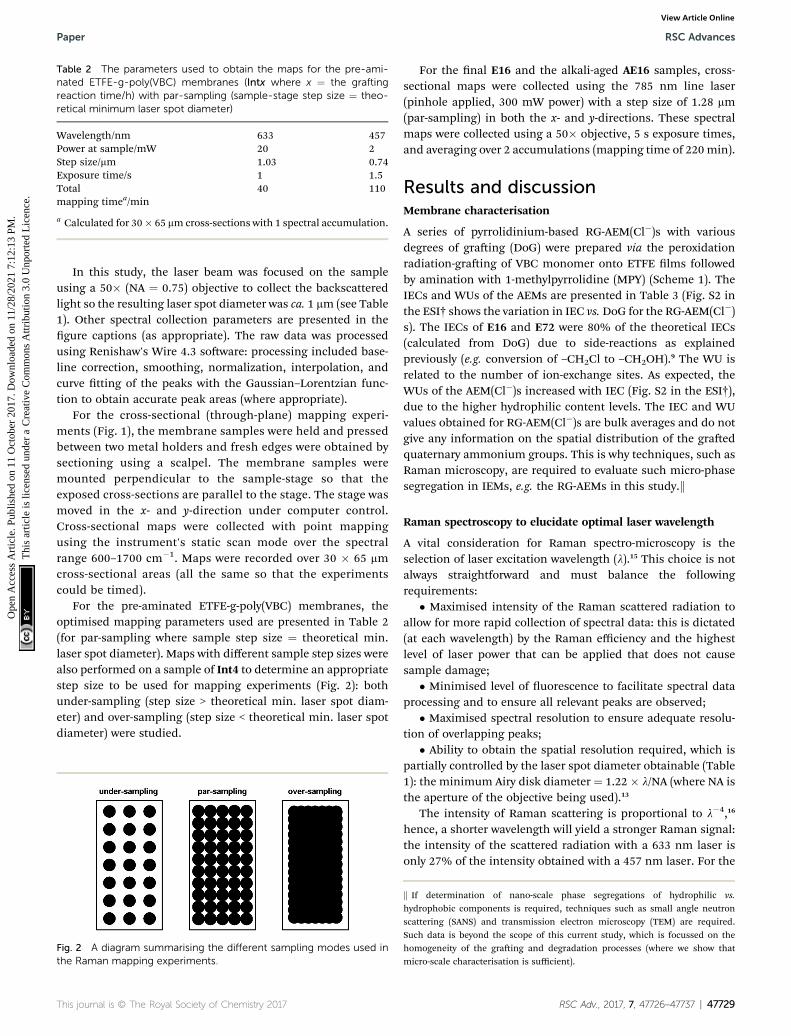
Table 2 The parameters used to obtain the maps for the pre-ami-nated ETFE-g-poly(VBC) membranes (Intx where x ¼ the graftingreaction time/h) with par-sampling (sample-stage step size ¼ theo-retical minimum laser spot diameter)
Wavelength/nm 633 457Power at sample/mW 20 2Step size/mm 1.03 0.74Exposure time/s 1 1.5Totalmapping timea/min
40 110
a Calculated for 30� 65 mmcross-sections with 1 spectral accumulation.
Paper RSC Advances
Ope
n A
cces
s A
rtic
le. P
ublis
hed
on 1
1 O
ctob
er 2
017.
Dow
nloa
ded
on 1
1/28
/202
1 7:
12:1
3 PM
. T
his
artic
le is
lice
nsed
und
er a
Cre
ativ
e C
omm
ons
Attr
ibut
ion
3.0
Unp
orte
d L
icen
ce.
View Article Online
In this study, the laser beam was focused on the sampleusing a 50� (NA ¼ 0.75) objective to collect the backscatteredlight so the resulting laser spot diameter was ca. 1 mm (see Table1). Other spectral collection parameters are presented in thegure captions (as appropriate). The raw data was processedusing Renishaw's Wire 4.3 soware: processing included base-line correction, smoothing, normalization, interpolation, andcurve tting of the peaks with the Gaussian–Lorentzian func-tion to obtain accurate peak areas (where appropriate).
For the cross-sectional (through-plane) mapping experi-ments (Fig. 1), the membrane samples were held and pressedbetween two metal holders and fresh edges were obtained bysectioning using a scalpel. The membrane samples weremounted perpendicular to the sample-stage so that theexposed cross-sections are parallel to the stage. The stage wasmoved in the x- and y-direction under computer control.Cross-sectional maps were collected with point mappingusing the instrument's static scan mode over the spectralrange 600–1700 cm�1. Maps were recorded over 30 � 65 mmcross-sectional areas (all the same so that the experimentscould be timed).
For the pre-aminated ETFE-g-poly(VBC) membranes, theoptimised mapping parameters used are presented in Table 2(for par-sampling where sample step size ¼ theoretical min.laser spot diameter). Maps with different sample step sizes werealso performed on a sample of Int4 to determine an appropriatestep size to be used for mapping experiments (Fig. 2): bothunder-sampling (step size > theoretical min. laser spot diam-eter) and over-sampling (step size < theoretical min. laser spotdiameter) were studied.
Fig. 2 A diagram summarising the different sampling modes used inthe Raman mapping experiments.
This journal is © The Royal Society of Chemistry 2017
For the nal E16 and the alkali-aged AE16 samples, cross-sectional maps were collected using the 785 nm line laser(pinhole applied, 300 mW power) with a step size of 1.28 mm(par-sampling) in both the x- and y-directions. These spectralmaps were collected using a 50� objective, 5 s exposure times,and averaging over 2 accumulations (mapping time of 220 min).
Results and discussionMembrane characterisation
A series of pyrrolidinium-based RG-AEM(Cl�)s with variousdegrees of graing (DoG) were prepared via the peroxidationradiation-graing of VBC monomer onto ETFE lms followedby amination with 1-methylpyrrolidine (MPY) (Scheme 1). TheIECs and WUs of the AEMs are presented in Table 3 (Fig. S2 inthe ESI† shows the variation in IEC vs.DoG for the RG-AEM(Cl�)s). The IECs of E16 and E72 were 80% of the theoretical IECs(calculated from DoG) due to side-reactions as explainedpreviously (e.g. conversion of –CH2Cl to –CH2OH).9 The WU isrelated to the number of ion-exchange sites. As expected, theWUs of the AEM(Cl�)s increased with IEC (Fig. S2 in the ESI†),due to the higher hydrophilic content levels. The IEC and WUvalues obtained for RG-AEM(Cl�)s are bulk averages and do notgive any information on the spatial distribution of the graedquaternary ammonium groups. This is why techniques, such asRaman microscopy, are required to evaluate such micro-phasesegregation in IEMs, e.g. the RG-AEMs in this study.k
Raman spectroscopy to elucidate optimal laser wavelength
A vital consideration for Raman spectro-microscopy is theselection of laser excitation wavelength (l).15 This choice is notalways straightforward and must balance the followingrequirements:
� Maximised intensity of the Raman scattered radiation toallow for more rapid collection of spectral data: this is dictated(at each wavelength) by the Raman efficiency and the highestlevel of laser power that can be applied that does not causesample damage;
� Minimised level of uorescence to facilitate spectral dataprocessing and to ensure all relevant peaks are observed;
� Maximised spectral resolution to ensure adequate resolu-tion of overlapping peaks;
� Ability to obtain the spatial resolution required, which ispartially controlled by the laser spot diameter obtainable (Table1): the minimum Airy disk diameter ¼ 1.22 � l/NA (where NA isthe aperture of the objective being used).13
The intensity of Raman scattering is proportional to l�4,16
hence, a shorter wavelength will yield a stronger Raman signal:the intensity of the scattered radiation with a 633 nm laser isonly 27% of the intensity obtained with a 457 nm laser. For the
k If determination of nano-scale phase segregations of hydrophilic vs.
hydrophobic components is required, techniques such as small angle neutronscattering (SANS) and transmission electron microscopy (TEM) are required.Such data is beyond the scope of this current study, which is focussed on thehomogeneity of the graing and degradation processes (where we show thatmicro-scale characterisation is sufficient).
RSC Adv., 2017, 7, 47726–47737 | 47729

Table 3 A summary of the pyrrolidinium-based RG-AEM(Cl�)s synthesised
RG-AEM(Cl�)s E1 E4 E16 E72Graing time/h 1 4 16 72DoG (%) 18 44 99 155IEC (Cl� anion)/mmol g�1 0.91 � 0.05 1.70 � 0.06 2.06 � 0.02 2.36 � 0.07WU (%) 8 � 3 79 � 5 104 � 7 145 � 6lwater
a 5 26 28 34
a Number of H2O molecules per Cl� anion [not to be confused with laser wavelength l], calculated as: lwater ¼ WU (%)/(100 � 18.02 � IEC), whereIEC is in mol g�1.
Fig. 3 The Raman spectra of Int16 both with (bottom graph) andwithout (top graph) baseline correction and normalisation. The base-line-corrected spectra were normalised to the intensity of the CF2stretch peak at 835 cm�1 peak to aid visual comparison (the peakindicated by arrow). The enhancement in the 1612 cm�1 peak whenusing the 457 nm laser is shown by the dashed box.
Fig. 4 The Raman spectra of (from bottom to top): the pristine ETFE,Int16, E1, E4, E16 and E72. Spectra were recorded with a 785 nm laserat 300 mW power (the only laser that could be used for all samples).The spectra were normalised to the intensity of ETFE peak at 835 cm�1
to aid visual comparison. The arrows indicate the key peaks used forthe Raman cross-section mapping experiments.
RSC Advances Paper
Ope
n A
cces
s A
rtic
le. P
ublis
hed
on 1
1 O
ctob
er 2
017.
Dow
nloa
ded
on 1
1/28
/202
1 7:
12:1
3 PM
. T
his
artic
le is
lice
nsed
und
er a
Cre
ativ
e C
omm
ons
Attr
ibut
ion
3.0
Unp
orte
d L
icen
ce.
View Article Online
higher wavelength laser, this intrinsic lower intensity can oenbe offset by increasing the laser power as long as sampledamage does not occur (higher wavelength radiation yields lessJ of energy per photon). Fluorescence is commonly a decisivefactor and arises from the coincidence of the excitation energywith electronic transitions. A way of avoiding this problem is tochoose a longer wavelength (e.g. near-IR) with the compromiseof lower spatial resolutions, or to move to UV wavelengths with
47730 | RSC Adv., 2017, 7, 47726–47737
the compromise of lower spectral resolutions and with theincreased risk of sample damage occurring. Finally, the spatialresolution is especially important for point mapping, wherea small laser spot diameter is oen required.
Fig. 3 displays the Raman spectra of the Int16 membrane atthe four-different wavelengths both with and without baselinecorrection and normalisation. We selected Int16 for this initiallaser l study as this pre-aminated membrane visually showedevidence (increase in opacity) of a high level of graing. The useof 457 and 532 nm lasers led to moderate uorescence, whereasthe 633 and 785 nm lasers yielded spectra with minimal uo-rescence. Aer baseline correction and normalisation,a number of Raman peaks were obtained with enhancedintensities with the 457 nm laser (especially the aromatic peakat 1612 cm�1) indicating an intriguing but small Ramanenhancement effect. Therefore, the 457 and 633 nm spot laserswere down-selected for the characterisation of pre-aminatedETFE-g-poly(VBC) membranes using Raman cross-sectionalmapping. The 457 nm laser could be used up to 10%maximum power before sample damage occurs, while the633 nm laser could be used at maximum power.
Regarding the (orange-brown coloured) RG-AEM(Cl�)s, theRaman spectra recorded using 457 and 532 nm lasers showed
This journal is © The Royal Society of Chemistry 2017

Fig. 5 Raman cross-sectional interpolated maps of Int4 recorded using the 457 nm laser (2 mW power at sample) and sample-stage step-sizesof: (left) under-sampled 1.5 mm; (middle) par-sampled 0.74 mm; and (right) over-sampled 0.5 mm. The colour scale represents the peak area ratio¼ A1612/A835 (content of benzene rings vs. ETFE) where Ay is the area under the peak located at wavenumber¼ y cm�1. Eachmap is 30� 65 mm insize (y-axis is the through-plane direction).
Paper RSC Advances
Ope
n A
cces
s A
rtic
le. P
ublis
hed
on 1
1 O
ctob
er 2
017.
Dow
nloa
ded
on 1
1/28
/202
1 7:
12:1
3 PM
. T
his
artic
le is
lice
nsed
und
er a
Cre
ativ
e C
omm
ons
Attr
ibut
ion
3.0
Unp
orte
d L
icen
ce.
View Article Online
excessively strong uorescence backgrounds that could not bereliably subtracted (see Fig. S3 in the ESI†). In contrast, the785 nm laser yielded spectra with lower levels of baseline noise.Furthermore, it was impossible to record adequate spectra withthe dark brown AE16 sample with all but the 785 nm laser dueto the very high levels of uorescence observed. The 785 nmlaser proved to be the only available option that was suitable forrecording spectral maps of both the pre- and post-alkali-treatedRG-AEMs. On the downside, the use of this longer wavelengthlaser (with pinhole applied to make it a spot laser) gave weaksignals and so longer acquisition times were required (evenwhen using maximum power).
Chemical characterisation using Raman spectroscopy
The chemical structures of the pristine ETFE along with Int16,E1, E4, E16, and E72 were evaluated using Raman spectroscopyon the surfaces of the membranes (Fig. 4). The ETFE spectrumis dominated by the presence of two sharp peaks: CF2 stretchesat 835 cm�1 (ref. 17) and CH2 bends at 1444 cm�1. The graingof the VBC onto the peroxidated ETFE lm introduced newpeaks at 1612, 1266, and 1000 cm�1,** which correspond to thearomatic ring breathing, CH2Cl deformations,6,9 and meta-disubstituted benzene rings,18 respectively. The spectra of RG-AEM(Cl�)s reveals that the CH2Cl peak at 1266 cm�1 (* in Fig. 4)disappears indicating successful amination with the MPY. Inaddition, a new band at 900 cm�1 was observed, which derives
** This peak is only present with 1,3-disubstituted benzene rings (in the 3-VBCmonomer and 3-VBC graed chains) and is not observed for the graed 4-VBCchains (recall that mixed 3- and 4-VBC monomers are being graed).
This journal is © The Royal Society of Chemistry 2017
from the presence of cationic pyrrolidinium groups. All thisdata corroborates the Raman data previously reported for ETFE-MPY-based RG-AEMs.6
Raman mapping of the pre-aminated ETFE-g-poly(VBC)membranes
Ramanmapping was rst performed on cross-sectional samplesof the pre-aminated ETFE-g-poly(VBC) membranes to measurethe through-plane distributions of the poly(VBC) gras (Fig. 1).This was assessed using the peak area ratio A1612/A835: this is thearea of the 1612 cm�1 aromatic peak (deriving from the graedpoly(VBC) chains) vs. the area of the 835 cm�1 peak (derivingfrom the backbone of the ETFE lms). Peak areas were calcu-lated by curve tting using the Gaussian–Lorentzian function(aer the spectra had been baseline corrected).
Fig. 5 shows the interpolated Raman maps obtained usingthe 457 nm laser for cross-sections of Int4 with the followingstage (x–y) step sizes: 0.5 mm (over-sampling), 0.74 mm (par-sampling) and 1.5 mm (under-sampling). Recall, Fig. 2 sche-matically highlights the difference between these samplingmodes. Note, these maps were produced from different cross-sections of Int4, and so the graing distributions showa natural level of variation. For Int4, the distribution of pol-y(VBC) gras shows more intensity at the surface and themiddle of the membranes with bands of slightly lower intensityseparating these regions. It is hypothesised that this is an effectof the diffusion of monomer. The monomer fronts diffuse fromboth surfaces of the ETFE lm to nally meet in the middle,which increases the concentration of monomer at this location:
RSC Adv., 2017, 7, 47726–47737 | 47731

Fig. 6 Raman cross-sectional interpolated maps recorded using the 457 nm laser (2 mW power at sample) with par-sampling of (from left toright): Int1, Int4, Int16, and Int72. The colour scale represents the peak area ratio ¼ A1612/A835 (content of benzene rings vs. ETFE) where Ay is thearea under the peak located at wavenumber ¼ y cm�1. Each map is 30 � 65 mm in size (y-axis is the through-plane direction).
RSC Advances Paper
Ope
n A
cces
s A
rtic
le. P
ublis
hed
on 1
1 O
ctob
er 2
017.
Dow
nloa
ded
on 1
1/28
/202
1 7:
12:1
3 PM
. T
his
artic
le is
lice
nsed
und
er a
Cre
ativ
e C
omm
ons
Attr
ibut
ion
3.0
Unp
orte
d L
icen
ce.
View Article Online
this leads to more rapid graing for a period of time in thecentre of the membrane. This effect was previously seen ina study that used propan-2-ol in the graing medium,6 ratherthan the water used in this current study.
The data recorded using over-sampling demonstrateda higher delity Raman image, at the expense of experimentduration: map time was 220 min (compared to 30 min for theunder-sampled image). A step size of 0.74 mm (par-sampling)was chosen for this study as it balances image delity withmeasurement time (map time of 110 min). Despite this, under-sampling may still be useful if a future necessity arose that
Fig. 7 Line-map data for Int1, Int4, Int16, and Int72 taken from thecentres of the cross-sectional maps presented in Fig. 6 (in thethrough-plane y-axis direction).
47732 | RSC Adv., 2017, 7, 47726–47737
required regularly conducted quality assurance measurementson a large number of samples (e.g. routine checks for homo-geneous graing of multiple batches of RG-AEM) or ifmeasurements on larger cross-sectional areas of individualsamples were desired: the delity of the under-sampled maps isstill adequate for such tasks.
The Raman maps collected with the 633 nm laser are pre-sented in Fig. S5 in the ESI:† with this laser, faster mappingtimes of 20 min, 40 min, and 76 min were obtained with under-(1.50 mm step-size), par- (1.03 mm), and over-sampling (0.74 mm),respectively. These mapping times were quicker as the 633 nmlaser could be applied at higher powers (at the sample): 20 mWcompared to the maximum 2 mW that could be used with the457 nm laser (due to sample damage at higher powers). Par-sampling (stage step size of 1.03 mm) was again down-selectedto map the distribution of the graed poly(VBC) chains withthe 633 nm laser.
Table 4 Statistical data extracted from the Raman maps presented inFig. 6 (calculated for the 95% confidence level) for the two mosthomogeneously grafted pre-aminated ETFE-g-poly(VBC) membranes
ETFE-g-poly(VBC) Int16 Int72Number of measurements 3738 3738Mean 2.83 3.13Standard deviation 0.13 0.16Relative standard deviation RSD (%) 4.6 5.1Condence intervals �0.005 �0.005D'Agostino–Pearson omnibus test:a p¼ <0.0001 <0.0001Passed normality test (a ¼ 0.05)? No NoMann–Whitney U test:b p¼ <0.0001Means signicantly different? Yes
a Test for normality. b Non-parametric two-tailed Mann–Whitney U test.
This journal is © The Royal Society of Chemistry 2017

Fig. 8 Raman cross-sectional interpolated maps of E16 (top row) and AE16 (bottom row) recorded using the 785 nm laser (300 mW power,pinhole applied) with par-sampling. The colour scale represents (from left to right columns): A900/A835 (pyrrolidinium vs. ETFE); A1612/A835
(benzene vs. ETFE); A900/A1612 (pyrrolidinium vs. benzene). Each map is 30 � 65 mm in size (y-axis is the through-plane direction).
Paper RSC Advances
Ope
n A
cces
s A
rtic
le. P
ublis
hed
on 1
1 O
ctob
er 2
017.
Dow
nloa
ded
on 1
1/28
/202
1 7:
12:1
3 PM
. T
his
artic
le is
lice
nsed
und
er a
Cre
ativ
e C
omm
ons
Attr
ibut
ion
3.0
Unp
orte
d L
icen
ce.
View Article Online
Fig. 6 shows cross-sectional maps (457 nm, par-sampled)obtained with the pre-aminated ETFE-g-poly(VBC) membranessynthesised using increasing graing reaction times (Int1, Int4,Int16, and Int72). Fig. S4 in the ESI† gives the box and whiskerplots that summarises this data for all the pre-aminated ETFE-g-poly(VBC) membranes studied. For additional clarity, Fig. 7presents line-map data (457 nm) taken from the centres of thecross-sectional maps.
From this Raman data, it was observed that Int1 (with thelowest DoG ¼ 18%) contained poly(VBC) graed chains at thesurface and a relatively ungraed core. Increasing the graingtime to 4 h resulted in a wider through-plane distribution ofgraing in the resulting membrane (Int4), but the graing
This journal is © The Royal Society of Chemistry 2017
distribution was still not fully homogeneous (discussed previ-ously). As the DoG approaches a value of 99% (Int16), a morehomogeneous graing of the poly(VBC) chains was achieved.The 4-probe (in-plane) chloride-anion conductivities of fullyhydrated E1, E4, and E16 (measured using the methoddescribed in ref. 9) were 14� 3, 39� 2, and 49� 2mS cm�1 (n¼3), respectively, which is consistent with this Raman data.
Prolonging the graing time to 72 h (Int72, DoG¼ 155%) ledto higher graing levels but this has detrimental consequences:e.g. E72 was observed to possess an excessive water content withlwater > 30 (Table 3), where lwater is the average number of H2Omolecules per anion-exchange site. Prior studies have shownthat not all of the H2Omolecules are directly associated with the
RSC Adv., 2017, 7, 47726–47737 | 47733

Fig. 9 Box and whisker plot summarising the cross-sectional Ramanspectral data (785 nm laser) for E16 (extracted from Fig. 8). The +symbols give the means, the middle horizontal lines give the medians,the boxes give the interquartile ranges, and the whiskers give the minand max values recorded. The numeric data presented gives the meanand sample standard deviations (n ¼ 1248).
Table 5 Statistical data for the peak area ratio A900/A835 data extractedfrom the Raman cross-sectional maps (785 nm laser) recorded on pre-and post-alkali-aged E16 (calculated for the 95% confidence level)
E16 AE16Number of measurements 1248 1248Mean 0.522 0.415Standard deviation 0.081 0.076RSD (%) 16 18Condence intervals �0.005 �0.004D'Agostino–Pearson omnibustest:a p¼
<0.0001 <0.0001
Passed normality test (a ¼ 0.05)? No NoMann–Whitney U test:b p¼ <0.0001Means signicantly different? Yes
a Test for normality. b Non-parametric two-tailed Mann–Whitney U test.
†† Note: with the use of the IR (785 nm) laser, the scale-bar for the A1612/A835 peakarea ratio (middle column in Fig. 8) is compressed to the range 0–2, compared tothe range 0–4 in Fig. 6, that was required to accommodate the higher ratiosobserved for Int72 with the use of the blue (457 nm) laser.
RSC Advances Paper
Ope
n A
cces
s A
rtic
le. P
ublis
hed
on 1
1 O
ctob
er 2
017.
Dow
nloa
ded
on 1
1/28
/202
1 7:
12:1
3 PM
. T
his
artic
le is
lice
nsed
und
er a
Cre
ativ
e C
omm
ons
Attr
ibut
ion
3.0
Unp
orte
d L
icen
ce.
View Article Online
ionic groups: many H2O molecules are “non-useful” in thatthey form domains of water aggregates that lead to excessiveRG-AEM swelling, which results in a weakening of themechanical properties.19 Table 4 gives the results of a statis-tical analysis comparing the poly(VBC) graing levels betweenInt16 and Int72 using all of the A1612/A835 peak area ratiosrecorded in the production of their Raman maps in Fig. 6.Int72 has a (statistically signicant) higher amount of graingthan Int16.
All of the above indicates that the graing front mechanismis operating when VBC is graed onto 50 mm thick ETFE lms.Additional maps, acquired using the 633 nm laser on differentcross-sections of the pre-aminated ETFE-g-poly(VBC)membranes (Fig. S6 in the ESI†), conrm these observations.This Raman data is consistent with the bulk IEC values recor-ded for the nal RG-AEM(Cl�)s that were made by the amina-tion of Int1, Int4, Int16, and Int72: IECs increase in the order E1< E4 < E16 < E72. However, this Raman microscopy dataprovides additional evidence that the homogeneity of graing ispoor at low graing reaction times.
Raman studies on a RG-AEM(Cl�): pre- and post-alkali-agedE16
Cross-sectional mapping. The most important requirementfor a high-performance RG-AEM is the homogeneous cross-sectional distribution of functional groups (Fig. 1).9 Thefollowing peak area ratios were used to characterise E16 (toprow of Fig. 8), where Ay is the area of the peak at y/cm�1
calculated by curve tting using the Gaussian–Lorentzianfunction (aer the spectra had been baseline corrected):
(1) Ratio ¼ A900/A835: pyrrolidinium groups vs. ETFE;(2) Ratio ¼ A1612/A835: benzene rings vs. ETFE;(3) Ratio ¼ A900/A1612: pyrrolidinium groups vs. benzene
rings;
47734 | RSC Adv., 2017, 7, 47726–47737
(1) and (2) represent the homogeneity of graing and (3)represents the homogeneity of amination of the benzene rings.
For the pre-alkali-aged E16, it was evident that functionali-sation was less homogeneous compared to the graing studieson Int16. This may be due to segregation of the hydrophilic andhydrophobic phases in the RG-AEM sample that occurs aer theamination process.†† The obvious “health warning” must alsobe kept in mind in that the apparent lower homogeneity may bedown to sampling: the specic cross-sectional sample of E16that was mapped could have been a low homogeneity section ofthe RG-AEM. Fig. 9 gives the box and whisker plots for dataextracted from the top row of Fig. 8.
The data on the alkali degraded AE16 (bottom row of Fig. 8)clearly shows that degradation is evident when the E16was agedin O2-purged aqueous KOH (1.0 mol dm�3) at 80 �C for 14 d.This data also shows that the degradation occurs throughoutthe cross-section of the RG-AEM. Fig. S7 in the ESI† presents thebox and whisker plots comparing the peak area ratios for E16and AE16 (extracted from the Raman cross-sectional map datapresented in Fig. 8). The larger variances seen in the AE16 datais due to the difficulty in reliably tting all of the spectral datadue to the signicant uorescence backgrounds encountered.Statistical analysis of the peak area ratio A900/A835 data (the ratioexpected to change the most on RG-AEM degradation) is sum-marised in Table 5. This analysis shows that this peak area ratiodata is signicantly different for AE16 compared to E16 due toalkali degradation. The degradation observed was due to both:(1) loss of the positively-charged pyrrolidinium functionality(Scheme 2: nucleophilic hydroxide attack positions A, B, and Cand Hofmann elimination attack position E); (2) loss of graedbenzene rings from the RG-AEM, complete with pyrrolidiniumgroups (Scheme 2: hydroxide attack position D). This isconsistent with the observations reported in recent studies onboth ETFE- and LDPE-based RG-AEMs.6,14
This journal is © The Royal Society of Chemistry 2017

Scheme 2 The possible sites that nucleophilic OH� anions can attackthe grafted chains in RG-AEMs.6
Fig. 11 Box and whisker plot summarising the surface Raman spectraldata (785 nm laser) for E16. The numeric data presented gives themean and sample standard deviations (n ¼ 25).
Table 6 Statistical data for the peak area ratio A900/A833 data extractedfrom the Raman spectra (785 nm laser) recorded on the surfaces of thepre- and post-alkali-aged E16 (calculated for the 95% confidencelevel)
E16 AE16Number of measurements 25 25Mean 0.843 0.63Standard deviation 0.066 0.15RSD (%) 7.9 24Condence intervals �0.027 �0.063D'Agostino–Pearson omnibus test:a
p¼0.512 0.407
Passed normality test (a ¼ 0.05)? Yes YesF-test: p¼ 0.0001Variances statistically different? Yest-test:b p¼ <0.0001Means statistically different? Yes
a Test for normality. b Un-paired two-tailed t test with Welch's-correction (due to non-equal variances).
Paper RSC Advances
Ope
n A
cces
s A
rtic
le. P
ublis
hed
on 1
1 O
ctob
er 2
017.
Dow
nloa
ded
on 1
1/28
/202
1 7:
12:1
3 PM
. T
his
artic
le is
lice
nsed
und
er a
Cre
ativ
e C
omm
ons
Attr
ibut
ion
3.0
Unp
orte
d L
icen
ce.
View Article Online
Surface Raman data. So far, this study has considered thecross-sectional (through-plane) distributions of functionality.However, the homogeneity of functionalisation across thesurfaces of the RG-AEMs should also be evaluated (Fig. 10).Detailed mapping over large areas of RG-AEM surfaces is notviable for routine measurements. A more practical method is torecord a number of spectra on different parts of the surface ofa RG-AEM sample. In this study, Raman spectra (785 nm,300 mW, pinhole applied) were recorded at 25 sampling pointson the surfaces of E16 and AE16 (recorded as a 5 � 5 grid overca. 1 cm2 sized samples). Each spectrum was analysed for thethree peak area ratios described above.
Fig. 11 shows the results recorded on the surface of a sampleof E16. This data shows good homogeneity with RSDs < 10% forall three peak area ratios. However, this Raman data shows thatthe surface analysis of E16 yields larger area ratios A900/A835 andA1612/A835, that are related to the level of graing, compared tothe cross-sectional analysis (Fig. 9). This suggests there is anexcess of graing directly at the surface of E16 (where the laseronly penetrates a couple of mm into the membrane whenfocused on the surface). Therefore, for RG-AEMs, we stronglyrecommend that surface data should always be collectedalongside cross-sectional mapping data (to obtain the fullestpossible picture of the distribution of the graed chains).
Fig. S8 in the ESI† presents the box and whisker plotscomparing the peak area ratios from the surface analyses of E16and AE16. Statistical data for the peak area ratio A900/A835 issummarised in Table 6. This analysis again shows that thisdiagnostic peak area ratio is signicantly different for AE16compared to E16 due to alkali degradation. There was a 25%loss of this peak area ratio on surface degradation, while onlya 21% loss was observed in the analysis of the cross-sectionaldata. It is not unexpected that degradation would be more
Fig. 10 A diagram showing the sampling of the Raman spectrarecorded on the surfaces of E16 and AE16 (ca. 1 cm2 samples in thisstudy).
This journal is © The Royal Society of Chemistry 2017
severe at the surface of RG-AEMs. AE16 possessed an IEC of 1.65� 0.17 mmol g�1 (n ¼ 3), which was 20% lower than the 2.06 �0.02 mmol g�1 recorded for the pre-alkali treated E16. This(bulk) IEC data directly correlates with the loss of the peak arearatio A900/A835 in the Raman cross-sectional data.
Conclusions
This study highlights the usefulness of using Raman spectro-microscopy in the study of radiation-graed membranes(anion-exchange membranes in this case). This technique isespecially helpful for the study of the homogeneity of the cross-sectional graing (on the micro-scale). This technique has thepotential to be used as a quality assurance tool regarding thegraing process (with cross-sectional mapping times of <1 hbeing possible with under-sampling). This technique can alsobe useful for the study of the homogeneity of any post-graing
RSC Adv., 2017, 7, 47726–47737 | 47735

RSC Advances Paper
Ope
n A
cces
s A
rtic
le. P
ublis
hed
on 1
1 O
ctob
er 2
017.
Dow
nloa
ded
on 1
1/28
/202
1 7:
12:1
3 PM
. T
his
artic
le is
lice
nsed
und
er a
Cre
ativ
e C
omm
ons
Attr
ibut
ion
3.0
Unp
orte
d L
icen
ce.
View Article Online
functionalisation process (e.g. amination) as well as for the(post-mortem) investigation of membrane degradationprocesses. For radiation-graed membranes, the analysis of thesurfaces must always be conducted in addition to any cross-sectional analysis, in order to obtain the whole pictureregarding the distribution of membrane functionality (andmembrane degradation).
For the radiation-graed anion-exchange membranes (RG-AEM), made from 50 mm thick ETFE lms in this investiga-tion, a vinylbenzyl graing time of 16 h appears to be optimal(with the specic synthesis conditions used). The Raman data isconsistent with the operation of the graing front mechanism.Amination with 1-methylpyrrolidine was homogeneous andyielded RG-AEMs with ion-exchange capacities (IEC) of>2.0 mmol g�1. There was an excess of graing at the surfaces ofthe RG-AEMs (at least in the rst few mm). The level of degra-dation, measured using Raman spectro-microscopy of the RG-AEM cross-sections aer ageing in hot aqueous alkali,matched the loss of IEC; however, the high levels of photo-luminescence that occurs with the (dark-brown-coloured) alkalidegraded RG-AEMs led to more problematic spectral analysis.Degradation occurred throughout the RG-AEM cross-sectionsbut appeared to be more severe at the surfaces. The 457 and633 nm laser wavelengths were the most useful for the study ofthe pre-aminated graed membranes, while the 785 nm laserwavelength was the only option that could be used for the studyof the pre- and post-alkali degraded RG-AEMs.
Author contributions
Dr Bance-Soualhi supervised the student and conducteda number of the experiments (surface maps and degradationdata), as well as making a major contribution to authoring ofthis article. Dr Crean and Prof Varcoe are the principal inves-tigators of the EPSRC grants who contributed to the formulationof this article and scientic interpretation of the data.
Conflicts of interest
There are no conicts to declare.
Acknowledgements
This research was funded by the UK's Engineering and PhysicalSciences Research Council (EPSRC) with resources provided bygrants EP/M005933/1, EP/M014371/1, and EP/M022749/1 (thelatter providing the capital funding that allowed for thepurchase of the Renishaw Raman microscope system).Renishaw are thanked for their technical assistance related toour familiarisation with the instrument. Wai Hin Lee thanks theUniversity of Surrey for providing additional funding: the bulkof the results in this paper was from his undergraduate nalyear project. All data is freely available with no restrictions:details on how to access this data can be found at DOI:10.15126/surreydata.00842458.
47736 | RSC Adv., 2017, 7, 47726–47737
References
1 T. R. Dargaville, G. A. George, D. J. T. Hill andA. K. Whittaker, Prog. Polym. Sci., 2003, 28, 1355;M. M. Nasef, S. A. Gursel, D. Karabelli and O. Guven, Prog.Polym. Sci., 2016, 63, 1.
2 M. M. Nasef, Chem. Rev., 2014, 114, 12278; L. Gubler, Adv.Energy Mater., 2014, 4, 201300827; A. Albert, T. Lochner,T. J. Schmidt and L. Gubler, ACS Appl. Mater. Interfaces,2016, 8, 15297.
3 J. Pan, C. Chen, L. Zhuang and J. Lu, Acc. Chem. Res., 2012,45, 473; J. R. Varcoe, P. Atanassov, D. R. Dekel,A. M. Herring, M. A. Hickner, P. A. Kohl, A. R. Kucernak,W. E. Mustain, K. Nijmeijer, K. Scott, T. Xu and L. Zhuang,Energy Environ. Sci., 2014, 7, 3135; K. D. Kreuer, Chem.Mater., 2014, 26, 361; M. A. Hickner, Interface, 2017, 26, 69;T. J. Omasta, L. Wang, X. Peng, C. A. Lewis, J. R. Varcoeand W. E. Mustain, J. Power Sources, 2017, DOI: 10.1016/j.jpowsour.2017.05.006.
4 N. Walsby, M. Paronen, J. Juhanoja and F. Sundholm, J.Polym. Sci., Part A: Polym. Chem., 2000, 38, 1512;J. R. Varcoe, R. C. T. Slade, E. L. H. Yee, S. D. Poynton,D. J. Driscoll and D. C. Apperley, Chem. Mater., 2007, 19,2686; O. I. Deavin, S. Murphy, A. L. Ong, S. D. Poynton,R. Zeng, H. Herman and J. R. Varcoe, Energy Environ. Sci.,2012, 5, 8584; B.-M. Ko, J.-Y. Sohn and J. Shin, Polymer,2012, 53, 4652; M. Mamlouk, J. A. Horsfall, C. Williamsand K. Scott, Int. J. Hydrogen Energy, 2012, 37, 11912;T. Zhou, R. Shao, S. Chen, X. He, J. Qiao and J. Zhang, J.Power Sources, 2015, 293, 946; R. Espiritu, M. Mamloukand K. Scott, Int. J. Hydrogen Energy, 2016, 41, 1120;Y. Zhao, K. Yoshimura, H. Shishitani, S. Yamaguchi,H. Tanaka, S. Koizumi, N. Szekely, A. Radulescu,D. Richtere and Y. Maekawa, So Matter, 2016, 12, 1567.
5 J. R. Varcoe, R. C. T. Slade, G. L. Wright and Y. Chen, J. Phys.Chem. B, 2006, 110, 21041; S. F. Lu, J. Pan, A. B. Huang,L. Zhuang and J. T. Lu, Proc. Natl. Acad. Sci. U. S. A., 2008,105, 20611; C. A. Hancock, A. Ong, P. R. Slater andJ. R. Varcoe, J. Mater. Chem. A, 2014, 2, 3047; H. A. Miller,A. Lavacchi, F. Vizza, M. Marelli, F. Di Benedetto,F. D. I. Acapito, Y. Paska, M. Page and D. R. Dekel, Angew.Chem., Int. Ed., 2016, 55, 6004; H. A. Miller, F. Vizza,M. Marelli, A. Zadick, L. Dubau, M. Chatenet, S. Geiger,S. Cherevko, H. Doan, R. K. Pavlicek, S. Mukerjee andD. R. Dekel, Nano Energy, 2017, 33, 293–305; H. Wang andH. Abruna, J. Am. Chem. Soc., 2017, 139, 6807; L. Wang,J. J. Brink, Y. Liu, A. M. Herring, J. Ponce-Gonzalez,D. K. Whelligan and J. R. Varcoe, Energy Environ. Sci., 2017,DOI: 10.1039/C7EE02053H.
6 J. Ponce-Gonzalez, D. K. Whelligan, L. Q. Wang, R. Bance-Soualhi, Y. Wang, Y. Q. Peng, H. Q. Peng, D. C. Apperley,H. N. Sarode, T. P. Pandey, A. G. Divekar, S. Seifert,A. M. Herring, L. Zhuang and J. R. Varcoe, Energy Environ.Sci., 2016, 9, 3724.
7 H.-P. Brack, H. G. Buhrer, L. Bonorand and G. G. Scherer, J.Mater. Chem., 2000, 10, 1795; M. M. Nasef and E.-S.
This journal is © The Royal Society of Chemistry 2017

Paper RSC Advances
Ope
n A
cces
s A
rtic
le. P
ublis
hed
on 1
1 O
ctob
er 2
017.
Dow
nloa
ded
on 1
1/28
/202
1 7:
12:1
3 PM
. T
his
artic
le is
lice
nsed
und
er a
Cre
ativ
e C
omm
ons
Attr
ibut
ion
3.0
Unp
orte
d L
icen
ce.
View Article Online
A. Hegazy, Prog. Polym. Sci., 2004, 29, 499; Y. Buchmuller,A. Wokaun and L. Gubler, Fuel cells, 2013, 13, 1177.
8 V. Sproll, T. J. Schmidt and L. Gubler, Polym. Int., 2016, 65,174.
9 L. Q. Wang, E. Magliocca, E. L. Cunningham, W. E. Mustain,S. D. Poynton, R. Escudero-Cid, M. M. Nasef, J. Ponce-Gonzalez, R. Bance-Soualhi, R. C. T. Slade, D. K. Whelliganand J. R. Varcoe, Green Chem., 2017, 19, 831.
10 S. Holmberg, J. H. Nasman and F. Sundholm, Polym. Adv.Technol., 1998, 9, 121; L. I. Sanli and S. A. Gursel, J. Appl.Polym. Sci., 2011, 120, 2313.
11 F. Cardona, G. A. George, D. J. T. Hill, F. Rousoul andJ. Maeji, Macromolecules, 2002, 35, 355; F. Cardona,G. A. George, D. J. T. Hill and S. Perera, J. Polym. Sci., PartA: Polym. Chem., 2002, 40, 3191; H. Herman, R. C. T. Sladeand J. R. Varcoe, J. Membr. Sci., 2003, 218, 147.
12 J. E. Katon, Vib. Spectrosc., 1994, 7, 201; A. Chaplin,I. Hamerton, H. Herman, A. K. Mudhar and S. J. Shaw,Polymer, 2000, 41, 3945; E. Widjaja and M. Garland, J.Raman Spectrosc., 2012, 43, 828; R. Zeng, J. Handsel,S. D. Poynton, A. J. Roberts, R. C. T. Slade, H. Herman,D. C. Apperley and J. R. Varcoe, Energy Environ. Sci., 2011,4, 4925; D. M. Hillman, S. H. Stephens, S. D. Poynton,S. Murphy, A. Ong and J. R. Varcoe, J. Mater. Chem. A,2013, 1, 1018; R. Zeis, Beilstein J. Nanotechnol., 2015, 6, 68;S. Mukherjee and A. Gowen, Anal. Chim. Acta, 2015, 895,12; C. Cardell and I. Guerra, Trends Anal. Chem., 2016, 77,
This journal is © The Royal Society of Chemistry 2017
156; T. R. Pozegic, J. V. Anguita, I. Hamerton,K. D. G. I. Jayawardena, J.-S. Chen, V. Stolojan,P. Ballocchi, R. Walsh and S. R. P. Silva, Sci. Rep., 2016, 6,37334.
13 A. Zoubir, Raman Imaging: Techniques and Applications,Springer, Heidelberg NY (USA), 2012.
14 R. Espiritu, B. T. Golding, K. Scott andM. Mamlouk, J. Mater.Chem. A, 2017, 5, 1248; R. Espiritu, B. T. Golding, K. Scottand M. Mamlouk, J. Power Sources, 2017, DOI: 10.1016/j.jpowsour.2017.07.074.
15 E. Smith and G. Dent, Modern Raman Spectroscopy: Apractical Approach, Wiley, Hoboken NJ (USA), 2005.
16 R. L. McCreery, Raman Spectroscopy for Chemical Analysis,John Wiley & Sons, New York (USA), 2005.
17 G. Galleja, A. Houdayer, S. Etienne-calas, D. Bourgogne,V. Flaud, G. Silly, S. Shibahara, A. Takahara, A. Jourdan,A. Hamwi and B. Ameduri, J. Polym. Sci., Part A: Polym.Chem., 2011, 49, 1517.
18 P. J. Larkin, Infrared and Raman spectroscopy: Principles andspectral interpretation, Elsevier, Amsterdam, 2011.
19 M. A. Vandiver, B. R. Caire, J. R. Carver, K. Waldrop,M. R. Hibbs, J. R. Varcoe, A. M. Herring andM. W. Liberatore, J. Electrochem. Soc., 2014, 161, H677;T. P. Pandey, A. M. Maes, H. N. Sarode, B. D Peters,S. Lavinia, K. Vezzu, Y. Yang, S. Poynton, J. R. Varcoe,S. Seifert, M. Liberatore, V. Di Noto and A. Herring, Phys.Chem. Chem. Phys., 2015, 17, 4367.
RSC Adv., 2017, 7, 47726–47737 | 47737