a quest for profits - modification and replacement parts...
TRANSCRIPT

Presented by:
Brad Morgenroth Executive Consultant, TeamSAI, Inc.
Economic Outlook For MRO
A Quest for Profits
MARPA 2013 Annual Conference

Airline Themes: Profit margin remains unacceptably low
While revenue has definitely improved, profits remain low relative to other
industries
― Worst return on capital among 30 industries
― History of extreme variation in financial performance
― Remain susceptible to external shocks that cannot be controlled
July 2013 TEAMSAI©2013
1
Typical Airline Cost Distribution
2% Profit
6% Tax/Fee
17% Maintenance
10% Ownership
38% Fuel
23% Labor
4% Other

Airline Themes: Capital, Finance, and Taxes
July 2013 TEAMSAI©2013
2
New aircraft …
― Increase revenue potential
― Lower fuel, maintenance, and potential
carbon emissions costs
― But increase aircraft ownership costs
Factor MD-80 737-800
P&L Considerations
Revenue 150 seats 160 seats
Fuel 950 gal/FH 680 gal/FH
Mx $2.4M/yr $2.1M/yr
Carbon 27k MT CO2 20 MT CO2
Taxes marginal
Balance Sheet Considerations
Own $1.9M/yr $3.6M/yr
Lease $0.2-0.7M/yr $2.3-4.2M/yr
737-800 net gain: $5M

Airline Themes: Maintenance & Engineering Costs
Maintenance is 15-20% of total operating
expenses
40-45% of M&E spend related to engines
― Most engine MRO in long term PBH deals
Contracting component MRO to a
comprehensive, single-source solution
growing in popularity ― Lower direct costs and improved ROIC
― Predictable cash flow
― Balance sheet improvement if asset sale included
New aircraft creating several opportunities ― Better designs with lower maintenance expense
― New leverage for striking comprehensive deals
July 2013 TEAMSAI©2013
3
MRO Current Fleet Planned Fleet
Airframe
Increased man hours due to aging fleet;
Shorter C check interval
Lower HMW man hours; Longer C check interval
Engine Locked into PBTH Locked in PBTH at higher
rate
Components Less expensive due to
availability of used parts
More expensive; Complex technology ; High cost of
spares; High material costs
Line Similar costs Similar costs
Segment %Share of 2013 Segment Spend
Engine >30%
Component 15-20%

Fleet & MRO

Global fleet outlook - commercial airline sector
22,529 in service aircraft in 2013 ― 19,890 jets
― 2,639 turboprops
In 2023, the fleet will grow to nearly
33,000 ― 3.7% CAGR growth rate expected
― 6,200 of the current fleet will retire
― Over 16,000 new deliveries in the period
• 38% of new aircraft will be replacements
July 2013 TEAMSAI©2013
5

Regionally, fleet growth rates vary significantly
July 2013 TEAMSAI©2013
6
2013-2023
Growth Rate
2023 Market
Share
0.6% 24%
2.4% 18%
5.3% 18%
7.7% 12%
5.0% 8%
6.6% 7%
6.2% 6%
4.8% 5%
10.8% 3%

Globally, the MRO growth outlook is healthy
Growth is expected to average
3.1% CAGR through 2023
$56.2B industry will grow to
$76.0B over the 10-year forecast
period
― 2023 forecast captures delivery of
significant new Airbus neo and Boeing
MAX fleets
Engine remains the largest
segment
― Engine and component MRO growth
rate expected to slow in second half of
forecast period due to honeymoon
period
July 2013 TEAMSAI©2013
7

MRO regional market shares change dramatically by 2023
Asia is driving the growth of the
global MRO market
Asia will be the largest MRO
market by 2023
― Few retirements
― Oldest aircraft contributing to MRO
MRO in North America expected
to suffer from large-scale fleet
replacement
July 2013 TEAMSAI©2013
8
Americas
Europe
Asia
ME/Africa

North American growth will be limited
Virtually no fleet growth over the
next 10 years
― 0.7% CAGR from 2013-2023
― 3,447 new deliveries and 2,646
retirements of current in-service aircraft
are forecasted
― 86% replacement rate
NA’s MRO expected to suffer from
large-scale fleet replacement
July 2013 TEAMSAI©2013
9
40% 43% 11% 12% 23% -5%
NA Share of the Global Change in MRO (2013-23)

Summing up the North American outlook
NA’s MRO growth will be impacted by:
― low net fleet growth
― aircraft with less-maintenance intensive HMV
― work and honeymoon periods
Asia Pacific, China, and the Middle East will experience the greatest
absolute growth
― Combined, these three regions will make up more than 60% of the increase ($12.1B)
July 2013 TEAMSAI©2013
10
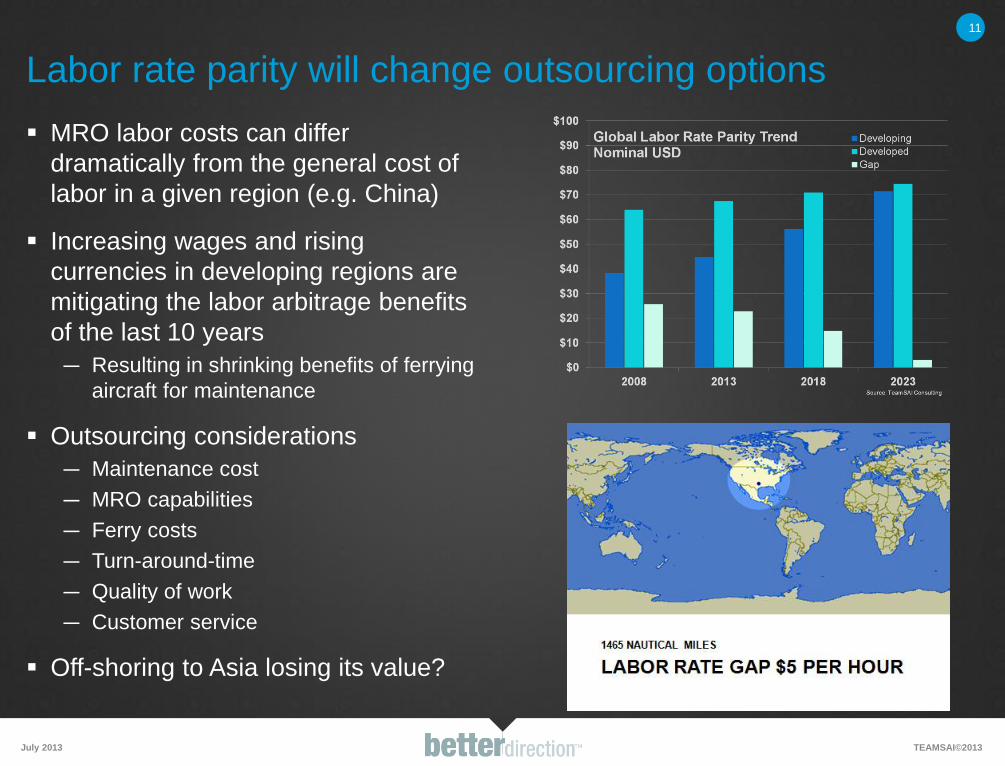
Labor rate parity will change outsourcing options
MRO labor costs can differ
dramatically from the general cost of
labor in a given region (e.g. China)
Increasing wages and rising
currencies in developing regions are
mitigating the labor arbitrage benefits
of the last 10 years
― Resulting in shrinking benefits of ferrying
aircraft for maintenance
Outsourcing considerations
― Maintenance cost
― MRO capabilities
― Ferry costs
― Turn-around-time
― Quality of work
― Customer service
Off-shoring to Asia losing its value?
July 2013 TEAMSAI©2013
11

MRO activity dominates the demand in any given year; more than 90% of total demand ― The remainder of the market is generated from rotables scrap replacements and new fleet support
requirements
The aftermarket parts market will grow at 3.0% CAGR over the 10-year period
July 2013 TEAMSAI©2013
Aftermarket parts market will reach nearly $30B in 2013
12

Almost 50% of the aftermarket parts demand ($13.7B) is generated from the NB fleet
WB aircraft, while only 20% of the total fleet, represent 41% of the spend ($11.6B)
July 2013 TEAMSAI©2013
RJ
NB
WB
MRO Activity Based Demand Only
TP
Aftermarket demand by aircraft class
13
Total Spares for MRO (Activity-Based Demand) 2013-2018 2018-2023 2013-2023
$Billions 2013 2018 2023 CAGR CAGR CAGR
HMV&Mod $0.10 $0.11 $0.13 2.3% 2.7% 2.5%
Engines $1.62 $1.79 $1.71 1.9% -0.9% 0.5%
Component $0.26 $0.29 $0.30 2.4% 1.1% 1.8%
Line $0.06 $0.07 $0.07 2.5% 1.3% 1.9%
Total Spares for MRO (Activity-Based Demand) $2.04 $2.25 $2.21 2.0% -0.4% 0.8%
2013 Forecast 2013 Forecast
Total Spares for MRO (Activity-Based Demand) 2013-2018 2018-2023 2013-2023
$Billions 2013 2018 2023 CAGR CAGR CAGR
HMV&Mod $1.30 $1.51 $1.90 3.1% 4.8% 3.9%
Engines $8.36 $10.50 $11.09 4.7% 1.1% 2.9%
Component $3.28 $3.96 $4.25 3.9% 1.4% 2.7%
Line $0.77 $0.95 $1.02 4.2% 1.5% 2.8%
Total Spares for MRO (Activity-Based Demand) $13.71 $16.92 $18.26 4.3% 1.5% 2.9%
2013 Forecast 2013 Forecast
Total Spares for MRO (Activity-Based Demand) 2013-2018 2018-2023 2013-2023
$Billions 2013 2018 2023 CAGR CAGR CAGR
HMV&Mod $0.12 $0.15 $0.19 4.9% 3.9% 4.4%
Engines $0.57 $0.70 $0.81 4.1% 3.0% 3.6%
Component $0.30 $0.37 $0.43 4.4% 3.4% 3.9%
Line $0.07 $0.08 $0.10 4.4% 3.4% 3.9%
Total Spares for MRO (Activity-Based Demand) $1.06 $1.31 $1.53 4.3% 3.3% 3.8%
2013 Forecast 2013 Forecast
Total Spares for MRO (Activity-Based Demand) 2013-2018 2018-2023 2013-2023
$Billions 2013 2018 2023 CAGR CAGR CAGR
HMV&Mod $0.92 $1.00 $1.24 1.7% 4.4% 3.1%
Engines $7.58 $9.85 $11.43 5.4% 3.0% 4.2%
Component $2.45 $2.76 $3.02 2.4% 1.8% 2.1%
Line $0.61 $0.71 $0.79 3.1% 2.2% 2.6%
Total Spares for MRO (Activity-Based Demand) $11.57 $14.32 $16.49 4.4% 2.9% 3.6%
2013 Forecast 2013 Forecast
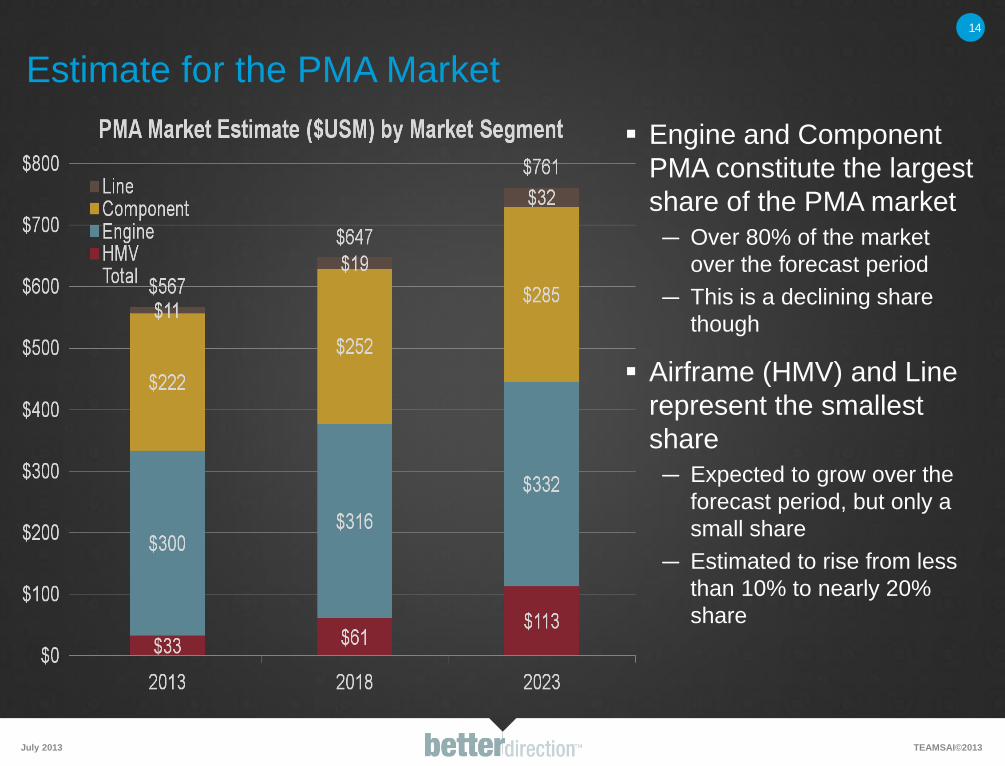
Estimate for the PMA Market
Engine and Component
PMA constitute the largest
share of the PMA market
― Over 80% of the market
over the forecast period
― This is a declining share
though
Airframe (HMV) and Line
represent the smallest
share
― Expected to grow over the
forecast period, but only a
small share
― Estimated to rise from less
than 10% to nearly 20%
share
July 2013 TEAMSAI©2013
14

PMA has made good penetration into aircraft market and some success in components
but has stalled in the high-value engine segment
Several factors mitigating against PMA in engines: ― Concerted effort by OEMs to block PMA and DER repairs
• Long Term Service Agreements (TotalCare, OnPoint, Engine Life) tie customers into OEM parts/repairs
• Long-Term Parts Supply contracts with MRO shops give price discounts in return for sole sourcing from
the OEM
• OEM-branded configurations and service centers – TRUEngines for CFM56 and CF6
– Some appraisers ascribe higher values to engines with pure OEM configuration
– e.g. IBA show value of CF6-80C2 with non-OEM parts and repairs as 25% lower than engine with
only OEM parts/repairs
– Engines make up most of the value of an older aircraft so engine valuation is key
― Lessors prohibit fitment of PMA and DER due to valuation and marketability concerns
P&W foray into CFM56 PMA has failed ― Biggest target customer (UAL) parked fleet shortly after launch and limited interest since then
Asset managers (e.g. GA Telesis, AJ Walter) are harvesting used parts from retiring
aircraft and buying surplus stock thus pressuring PMA for end-of-life products
PMA market dynamics
July 2013 TEAMSAI©2013
15
OEMs dominate new products while sunset products are dominated by asset managers with
surplus parts and tear-downs. Thus, PMA prospects brightest with mature products.

Market challenges
and responses

17
Time since EIS
New / In Production Sunset Mature
Response: prepare for necessary capabilities
July 2013 TEAMSAI©2013

Challenge: OEM dominance is changing the business model
Airframe and component OEMs
will increase their presence in the
market mirroring engine OEMs’
successful strategy
― Technology in new aircraft give OEMs
an opportunity to penetrate market
• Restricting IP and charging high
licensing fees
― OEMs pursuing support contracts at
point of sale to enter market
• Crucial for airframe OEMs entry
into aftermarket
How will the smaller independent
MRO survive?
July 2013 TEAMSAI©2013
18

Response strategies for Independent MRO survival
Become a niche player
― Target lessors with fleet support packages
― Look to LCCs
• MRO contracting is essential to their
business model
― Develop a reputation as a best in class
― Create a value proposition around
flexibility and speed
― Consider partnering with an OEM
Consider speed and quality as a financial performance multiplier
― Higher productivity through LEAN improves margins and revenue
― Customer proximity and service can drive sales
― High quality results in less rework and lower costs
July 2013 TEAMSAI©2013
19
Focus: leverage flexibility and speed for a better customer experience

Aircraft and component OEMs are following the example set by engine makers ― Boeing GoldCare, Airbus FHS, Moog Total Support, Honeywell MSP
― Given that parts make up a small part of airframe MRO, the case for airframe LTSA and disintermediation of
traditional MRO is unproven
― Component PMA packages needed to match whole component deals from OEMs – consolidation and/or
JVs?
Operating leases forecast to grow to at least 50% of aircraft and current contracting
trends suggest PMA take-up will be limited
― Softening of stance from some lessors (non-aerofoil PMA permitted by some)
Engine OEMs continuing pressure on PMA and DER ― Restricting availability of technical data
― Increasing pace of modifications to key parts
― “Influencing Parts” said to limit lives of LLPs
― TrueLLP program from GE
Appraisers marking down resale value of engines containing PMA ― Residual value guarantees possible?
Challenge: PMA Relevance
July 2013 TEAMSAI©2013
20
Technical and regulatory case for PMA had been made and won but commercial battle with
OEMs is intensifying and PMA industry needs to respond with commercial initiatives

Airline cost pressures having outsized impact on MRO
July 2013 TEAMSAI©2013
21

Brad Morgenroth Executive Consultant
TeamSAI, Inc.
404-762-7257 Ext. 108
Thank you! WWW.TEAMSAI.COM