a quantitative evaluation of nutrition education
TRANSCRIPT

The Pennsylvania State University
The Graduate School
College of Agricultural Sciences
A QUANTITATIVE EVALUATION OF NUTRITION EDUCATION
INTERVENTION WITH LOW-INCOME YOUTH
A Dissertation in
Agricultural and Extension Education
by
Olive Monalisa-Karekezi Kemirembe
© 2009 Olive Monalisa-Karekezi Kemirembe
Submitted in Partial Fulfillment of the Requirements
for the Degree of
Doctor of Philosophy
August 2009

The Dissertation of Olive Monalisa-Karekezi Kemirembe was reviewed and approved* by the following:
Rama B. Radhakrishna Professor of Agricultural and Extension Education Dissertation Advisor Chair of Committee
Edgar P. Yoder Professor of Agricultural and Extension Education
Patreese D. Ingram Professor of Agricultural and Extension Education
Sharon M. Nickols-Richardson Associate Professor of Nutritional Sciences Tracy S. Hoover Professor, and Head of the Department of Agricultural and Extension Education
*Signatures are on file in the Graduate School
iii
ABSTRACT
The purpose of this study was to evaluate whether selected nutrition education
lessons from the Up for the Challenge: Health, Fitness, and Nutrition curriculum could
contribute to change in knowledge, attitudes and behaviors about nutrition with low-
income youth in afterschool programs. Up for the Challenge is a curriculum for the
promotion of healthful nutrition knowledge, attitudes and behaviors with youth. The
curriculum is based on experiential learning model that is structured around direct
participation: experiencing, thinking, discussing, and applying what the youth have
learned to their daily lives. Five research question/hypotheses guided this investigation.
A quasi-experimental design consisting of pretest-posttest comparison control
group was used. The intervention in this study consisted of six nutrition lessons from the
curriculum. To evaluate the nutrition education lessons, three measurements were taken
at pretest (time 1), posttest (time 2), and delayed posttest (time 3). Participants included
youth in two afterschool programs receiving nutrition education lessons through the
Expanded Food and Nutrition Education Program of Penn State Nutrition Links. A total
of 86 students both in the treatment and control groups participated in the study.
A four-part evaluation tool was developed to collect data. Part one contained
questions pertaining to general nutrition knowledge and physical activity. Part two
contained statements about attitude towards nutrition, fruits and vegetable consumption,
and eating healthy and making healthful food choices. Part three contained statements on
nutrition and physical activity behaviors. Part four contained demographic questions such
as gender, age, grade level and ethnicity.

iv Hands-on nutrition education lessons were taught to youth in the treatment group
each week over a four-week period. Pretest data was collected before intervention,
posttest data collected after the four weeks of intervention, and delayed posttest data
collected after two weeks of posttest data collection. The control group did not receive
any lessons.
General linear model (GLM) procedures were performed. Results from repeated
measures ANCOVA posttest and delayed posttest with pretest as a covariate showed that
youth who received nutrition education lessons significantly improved their nutrition
knowledge, attitudes, and nutrition behaviors compared to those who did not participate
in the lessons. Physical activity knowledge and physical activity behaviors also improved
from pretest to posttest and delayed posttest. However, factorial ANOVA with repeated
measures pretest, posttest, and delayed posttest indicated no significant differences
between nutrition knowledge, attitudes, and nutrition behaviors when participants were
examined by gender, grade level, and age.
The significant improvement for nutrition knowledge and physical activity
knowledge, attitudes, and nutrition behaviors and physical activity behaviors indicated
program effectiveness regardless of the demographic characteristics examined in the
study. These results suggest that the selected nutrition education lessons form Up for the
Challenge curriculum are ready for dissemination within the studied groups. It is
recommended that the nutrition education lessons be tested in multiple settings with a
diverse group for generalization of results. Nutrition educators, youth and parents should
work closely together to implement nutrition education programs.

v
TABLE OF CONTENTS
LIST OF FIGURES .....................................................................................................vii
LIST OF TABLES.......................................................................................................viii
ACKNOWLEDGEMENTS.........................................................................................xi
Chapter 1 INTRODUCTION......................................................................................1
Statement of Problem ....................................................................................4 Model/Framework Underlying the Intervention Implementation .................7 Significance of the Study...............................................................................8
Purpose of the Study......................................................................................9 Research Questions/Hypotheses....................................................................9 Assumptions of the Study..............................................................................11 Limitations of the Study ................................................................................11 Operational Definitions .................................................................................11 Organization of the Dissertation....................................................................12
Chapter 2 REVIEW OF LITERATURE.....................................................................13
Overweight in Youth .....................................................................................13 Nutrition Knowledge, Attitudes and Behaviors ............................................16 Conceptual Framework of the Study Variables .......................................................20 Nutrition Education for Youth.......................................................................20 Afterschool Programs and Expectation .........................................................24 Experiential Learning Model.........................................................................27 Summary of Literature Review .....................................................................33
Chapter 3 METHODOLOGY.....................................................................................35
Evaluation Research Design..........................................................................36 Selection of Participants ................................................................................37 Evaluation Tools/Instruments........................................................................38 Ethical Considerations...................................................................................39 Validity and Reliability ..........................................................................39 Intervention Description................................................................................41 Training .........................................................................................................43 Intervention Implementation Period..............................................................43 Data Collection..............................................................................................45 Data Analysis.................................................................................................46 Internal and External Validity .......................................................................48

vi
Chapter 4 FINDINGS .................................................................................................50
Demographic Characteristics of Youth .........................................................52 Research Question/Hypothesis One ..............................................................53 Nutrition Knowledge Assessment ..........................................................53 Physical Activity Knowledge Assessment .............................................55 Research Question/Hypothesis Two..............................................................56 Nutrition Attitudes Assessment..............................................................56 Research Question/Hypothesis Three............................................................58 Nutrition Behaviors Assessment ............................................................58 Physical Activity Behaviors Assessment ...............................................60 Research Question/Hypothesis Four .............................................................63 Nutrition Knowledge by Demographic Characteristics .........................63 Attitudes by Demographic Characteristics.............................................69 Nutrition Behaviors by Demographic Characteristics ...........................75 Research Question/Hypothesis Five..............................................................80 Relationship between Nutrition Knowledge, Attitudes and Behaviors..80
Chapter 5 SUMMARY, DISCUSSION, CONCLUSIONS, AND RECOMMENDATIONS...........................................................................81
Summary........................................................................................................81 Discussion......................................................................................................84 Conclusions ...................................................................................................89 Recommendations .........................................................................................91
REFERENCES ............................................................................................................93
Appendix A Penn State University Human Subjects Approval Letter .......................104
Appendix B The Cen-Clear Child Services, Inc., Approval Letter ............................106
Appendix C Recruitment Letter/ Parent Letter...........................................................108
Appendix D Parent Consent Form..............................................................................110
Appendix E Child Assent Form..................................................................................113
Appendix F Penn State Nutrition Links Program- Letter of Support .........................116
Appendix G Evaluation Tools ....................................................................................118

vii
LIST OF FIGURES
Figure 1: Experintial Learning Model. ........................................................................8
Figure 2: Illustration of Quasi-Experimental Design Pretest-Posttest Comparison Control Group. ...........................................................................................37
Figure 3: Pretest, Posttest and Delayed Posttest Scores for Physical Activity Behavior.....................................................................................................62

viii
LIST OF TABLES
Table 1: Reliability Analyses of Questionaire .............................................................40
Table 2: Lesson Plan Title and Objectives/Outcome from the Up for the Challenge Curriculum ....................................................................................42
Table 3: Time schedule for the Study ..........................................................................44
Table 4: Data collection process ..................................................................................45
Table 5: Summary of Research Questions/Hypotheses, Related Variables, Scale of Measurement, and Analysis Techniques....................................................47
Table 6: Internal and External Validity. ......................................................................48
Table 7: Demographic Characteristics of Youth. ........................................................52
Table 8: Repeated Measure ANCOVA Comparing Posttest and Delayed Posttest Scores of Nutrition Knowledge with Pretest Knowledge Scores as a Covariate ........................................................................................................54
Table 9: Pretest,Posttest, Delayed Posttest Scores for Physical Activity Knowledge......................................................................................................55
Table 10: Repeated Measure ANCOVA Comparing Pretest, Posttest and Delayed Posttest Scores of Attitudes with Pretest Attitudes Scores as a Covariate ..57
Table 11: Repeated Measure ANCOVA Comparing Pretest, Posttest and Delayed Posttest Scores of Nutrition Behavior with Pretest Behavior Scores as a Covariate .....................................................................................................59
Table 12: Pretest, Posttest and Delayed Posttest Scores for Physical Activity Behavior ......................................................................................................61
Table 13: Descriptive Statistics of Nutrition Knowledge Scores Pretest, Posttest and Delayed Posttest by Group by Gender. ................................................64
Table 14: Factorial ANOVA with Repeated Measures Pretest, Posttest and Delayed Posttest of the Nutrition Knowledge by Group by Gender ...........64
Table 15: Descriptive Statistics of Nutrition Knowledge Scores Pretest, Posttest and Delayed Posttest by Group and by Grade Level...................................66

ix Table 16: Factorial ANOVA with Repeated Measures Pretest, Posttest and
Delayed Posttest of the Nutrition Knowledge by Group by Grade Level...66
Table 17: Descriptive Statistics of Nutrition Knowledge Scores Pretest, Posttest and Delayed Posttest by Group by Age.......................................................68
Table 18: Factorial ANOVA with Repeated Measures Pretest, Posttest and Delayed Posttest of the Nutrition Knowledge by Group by Age ................68
Table 19: Descriptive Statistics of Attitude Scores Pretest, Posttest and Delayed Posttest by Group by Gender.......................................................................70
Table 20: Factorial ANOVA with Repeated Measures Pretest, to Posttest and Delayed Posttest of Attitude Scores by Group by Gender ..........................70
Table 21: Descriptive Statistics of Attitude Scores Pretest, Posttest and Delayed Posttest by Group by Grade Level ..............................................................72
Table 22: Factorial ANOVA with Repeated Measures Pretest, to Posttest and Delayed Posttest of Attitude Scores by Grade Level ..................................72
Table 23: Descriptive Statistics of Attitude Scores Pretest, Posttest and Delayed Posttest by Group by Age............................................................................74
Table 24: Factorial ANOVA with Repeated Measures Pretest, to Posttest and Delayed Posttest of Attitude Scores by Age ...............................................74
Table 25: Descriptive Statistics of Nutrition Behavior Scores Pretest, Posttest and Delayed Posttest by Group by Gender ........................................................75
Table 26: Factorial ANOVA with Repeated Measures Pretest, Posttest and Delayed Posttest of Nutrition Behavior by Group by Gender.....................76
Table 27: Descriptive Statistics of Nutrition Behavior Scores Pretest, Posttest and Delayed Posttest by Group by Grade Level ................................................77
Table 28: Factorial ANOVA with Repeated Measures Pretest, to Posttest and Delayed Posttest Nutrition Behavior by Group by Grade Level.................77
Table 29: Descriptive Statistics of Nutrition Behavior Scores Pretest, Posttest and Delayed Posttest by Group by Age .............................................................78
Table 30: Factorial ANOVA with Repeated Measures Pretest, to Posttest and Delayed Posttest of Nutrition Behavior by Age..........................................79
Table 31: Correlation between Nutrition Knowledge, and Attitude and Behavior for Pretest, Posttest and Delayed Posttest Respectively..............................80

x Table 32: Summary of Increases in Nutrition Knowledge, Attitudes, Nutrition
behaviors by Demographics for the Treatment (T) and Control (C) Groups .........................................................................................................88

xi
ACKNOWLEDGEMENTS
Most importantly, I thank God Almighty for his guidance and direction
throughout my life. “He is my light, my fortress and my shield; whom shall I fear?”
To my father, Dr. Ephraim Karekezi, you inspired me to learn and grow and
believed in me ever since I was in school. I couldn’t be where I am today if it wasn’t for
the noblest values, integrity and competence you instilled in me. To my family, and
family to be, love you.
I am grateful to the members of my doctoral dissertation committee: Dr. Rama
Radhakrishna, my advisor, for proving useful insights and valuable contributions to this
study and throughout my doctoral program. I have learned from you the art of evaluation
research which I will use throughout my professional career. Dr. Edgar Yoder, whose
brilliant statistics analyses have contributed to the quality of my dissertation research. I
couldn’t learn statistical analyses from anybody else other than you. Dr. Sharon Nickols-
Richardson, your nutrition knowledge contributions have shaped my dissertation
research. Dr. Patreese Ingram, thanks for serving on my committee and contributing
valuably to this research study. To you Dr. Marvin Hall and Dr. Tracy Hoover, thanks for
your support during my doctoral program.
Many thanks go to Elise Gurgevich, State Coordinator- Penn State Nutrition
Links program, for providing me access to conduct this study. Thanks go to Ronda Stile,
Penn State nutrition educator; I truly appreciate your help for all those days we drove
across the hills of Clearfield to collect data.

Chapter 1
INTRODUCTION
Over the past three decades, the prevalence of overweight in the United States
has tripled for children ages 6–11 years and adolescents’ ages 12–19 years (Hedley,
Ogden, Johnson, Carroll, Curtin, & Flegal, 2004). An estimated 9.18 million U.S.
children and adolescents ages 6–19 years are considered overweight. If obesity levels
continue at the current rate, the lifetime risk of being diagnosed with type 2 diabetes at
some point in their lives is 30% for boys and 40% for girls (McGinnis, Gootman, &
Kraak, 2006). Moreover, overweight puts children at greater risk for cardiovascular
disease, hypertension and cancer.
The effects of childhood overweight are devastating to the health and well-being
of children now and throughout adulthood. A recent special report (Olshansky et al.,
2005) suggests that the United States could be facing its first sustained drop in life
expectancy in the modern era due to obesity. The authors suggest that unless steps are
taken to curb excessive weight gain, younger Americans will likely face a greater risk of
mortality throughout life than previous generations.
In recent years, there have been many calls for methods and programs to help
address the childhood “obesity” epidemic (Serrano & Cox, 2005; Story, 1999). To date,
prevention is recognized as one of the best methods for controlling the rapid increase in
childhood overweight (American Academy of Pediatrics, 2003; Fowler-Brown &
Kahwati, 2004; Moran, 1999).

2
Nutrition education as a means of prevention, may offer some hope for combating
obesity, and thus lessening the onset of many cancers and diabetes. Reviews of nutrition
education projects have identified a need for increased fruit and vegetable consumption,
healthy lifestyles to change life, and making healthy food choices as a means to
accomplishing an early introduction (Contento, Balch, Bronner, Lytle, Maloney, Olsen,
& Swadener, 1995; Hertzler & DeBord, 1994; Reynolds, Baranowski, Bishop, Gregson,
& Nicklas, 2001). In addition, physical activity can have an enormous impact on
improving a child’s physical and emotional well-being. Research has shown that
increased exercise and sports participation can simultaneously help children maintain a
healthy body weight, enhance their self-confidence, and offer “opportunities for social
contact, nurturing, and maturational guidance” (Centers for Disease Control and
Prevention, 2003).
A study conducted by Strong et al. (2005), on evidence based physical activity for
school-age youth found that intervention programs of moderate to vigorous physical
activity of 30 to 45 minutes duration 3 to 5 days per week would be necessary to achieve
beneficial effects on health and behavioral outcomes. The study concluded that school-
age youth need to participate daily in 60 minutes or more of moderate to vigorous
physical activity that is developmentally appropriate, enjoyable, and involving a variety
of activities.
Childhood and adolescent obesity is related to socioeconomic status (SES)
(Raman, 2002; Wang, 2001). Low SES populations tend to have elevated rates of illness
due to their low socioeconomic situations (Williams & Collins, 1995). A study conducted
by Wang (2001) of children ages 6 to 18 found that 32.7% of the low income population

3
was classified as being overweight or obese compared to 19% of the high income
population. The prevalence of overweight and obesity in low income populations may be
a result of the consumption of low cost foods that are high in fat and calorically dense,
which often happens when families lack the money to buy nutritious foods (Brown,
2002). Oftentimes, parents feel that fresh produce or fruits and vegetables are expensive,
hard to select, and difficult to store, and as a result, children have lower levels of fruit and
vegetable consumption (Treiman et al., 1996; Kirby et al., 1995; Baranowski et al., 2000;
Cullen et al., 2003; Morton & Guthrie, 1999).
In a study conducted of mothers in the Special Supplemental Nutrition Program
for Women, Infant, and Children (WIC), Treiman et al. (1996) found that although the
mothers had positive perceptions of fruits, they said they were too expensive, hard to
select, and difficult to store; and because of these reasons, they often did not purchase
fresh fruits for their families. They also considered vegetables to be healthy, but felt that
vegetables were difficult to prepare and they were not well liked by their families
(Treiman et al., 1996). Research by Morton and Guthrie (1999) found similar results,
“Low income respondents were more concerned with price, convenience and how well
food keeps than were high income participants” (Morton & Guthrie, 1999, p. 26).
Children in low income households are not being taught the importance of fresh fruits
and vegetables or being given the opportunity to taste them at home. They are less aware
of relationships between nutrition, diet and disease, less likely to utilize the nutrition
panel on food labels, and less likely to have low fat and low cholesterol diets and are less
likely to know how many servings of fruits and vegetables are recommend (Morton and
Guthrie, 1999).

4
Nutrition education, and more importantly the consumption of fruits and
vegetables is vital to the health of children (Domel et al., 1993; Kirby et al., 1995; Ness
and Powles, 1997; Liu et al., 2000; Bazzano et al., 2002; Cullen et al., 2002; Djoussé et
al., 2004). Fruit and vegetable consumption decreases the risk for cardiovascular disease,
(Liu et al., 2000) decreases concentrations of LDL cholesterol, (Djoussé et al., 2004) and
lowers stroke incidence (Bazzano et al., 2002). Including fruits and vegetables
consistently in a diet can also assist with weight control (Lin & Morrison, 2002).
Statement of Problem
Food preferences and dietary habits are established during childhood (Kirby et
al., 1995; Carter, 2002). This means that nutrition interventions need to be targeted to
young children while they are forming their lifelong habits. Research has indicated that
establishing healthy habits, which include eating fruits and vegetables (F&V) early in
childhood will decrease the likelihood of becoming overweight or obese in adulthood
(Veugelers & Fitzgerald, 2005). It is critical to begin teaching children the importance of
healthy food choices, at an early age. A healthy lifestyle, which includes good nutrition
and an adequate intake of F&V has been shown to improve weight status, decrease
disease risk, and improve overall health (Veugelers & Fitzgerald, 2005).
Schools are a resourceful place to begin nutrition education intervention programs
and are an important social environment that shapes children’s eating habits (Pilant,
2006). Several studies have been conducted to determine the effectiveness of classroom-
based nutrition education programs and targeted a variety of school-age children using a
5
number of social-psychological theories explaining nutrition behavior, knowledge, and
attitude, and their relationship. Among the theories and theoretical models that have been
used by nutrition education researchers are the Health Belief Model (Maiman & Becker,
1974), Theory of Reasoned Action (Fishbein & Ajzen, 1975), Social Cognitive Theory
(Bandura, 1977), and Theory of Diffusion of Innovation (Rogers, 1995). Work done by
researchers using each of these models has added to the understanding of the mental
processes influencing eating behavior and habits.
Although many nutrition education interventions have been designed and
evaluated, relatively few have emphasized the use of the experiential learning as a
framework for implementing curriculum-based nutrition education intervention in
afterschool settings. Initial studies have illustrated the positive effect that afterschool
nutrition intervention with urban youth can have using some of the models previously
identified in the above paragraph in increasing nutritional knowledge and causing
behavior change towards healthy eating (Rinderknecht & Smith, 2004 & Kelder et al.
2005). Other studies have also used experiential learning model as a framework for
developing and implementing garden-based nutrition learning programs (Desmond,
Grieshop, & Subramaniam, 2004), some of which have been shown to be effective at
improving the nutrition knowledge and behaviors of school students (Morris,et al., 2002).
However, there remains insufficient/inadequate information on implementing curriculum-
based nutrition education lessons using experiential learning model with low-income
youth in afterschool settings. Overweight and obesity is greatest among the low-income
groups than other groups (Morton and Guthrie, 1999; Wang, 2001). There is a need for
additional research to: (a) assess effectiveness and demonstrate positive impact of

6
nutrition education intervention with low-income youth in afterschool programs, (b)
improve programs and develop better nutrition intervention, and (c) replicate research in
other settings.
Attempting to reach low-income youth in afterschool programs is important
because school districts are increasingly reluctant to release class time for such non-
academic activities as health promotion due to lack of recognition of nutrition education
as a priority, and competition for classroom time, (Kelder, Mitchell, & McKenzie, et al.
(2003); Parcel, Perry, Kelder, & Elder, et al. (2003); Kolbe, Kann, & Brener, (2001).
Afterschool programs provide opportunity for health programs that may be difficult to
incorporate into an already-full school day. Furthermore, according to a study conducted
by Mahoney, Lord, & and Carryl, (2005a), afterschool programs for children from low-
income families can significantly improve these children's performances in school. They
found that over time, students in these programs were reading at a higher level than their
peers in any other type of educational setting.
Therefore, the current study was designed to evaluate whether selected nutrition
education lessons from the Up for the Challenge: Health, Fitness, and Nutrition
curriculum based upon an experiential learning framework could contribute to change in
knowledge, attitudes and behaviors about nutrition with low-income youth in afterschool
programs. The Up for the Challenge curriculum was designed for the promotion of
healthful nutrition knowledge, attitudes and behaviors with low-income youth. The
curriculum is based on an experiential learning model that is structured around direct
participation: experiencing, thinking, discussing, and applying what the youth have
learned to their daily lives. The intervention components of Up for the Challenge

7
curriculum include lessons on good nutrition, eating fruits and vegetables, physical
activity, and healthy lifestyle choices for elementary school, middle school and teen
youth.
Model/Framework Underlying the Intervention Design and Implementation
Experiential learning was the underlying framework guiding the design and
implementation of nutrition education lessons tested in this study. The experiential
learning model uses a five-step learning cycle (Figure 1) based on the work of Dewey
(1938), Kolb (1984) and Pfeiffer and Jones (1985), and is the most common one currently
used in youth development programs. Experiential learning offers a viable framework for
nutrition education for children using hands-on, active learning. This model allows
children to learn and construct meaning through experiencing real-life situations (Dewey,
1938; Kolb 1984). Experiential learning offers children a more learner-centered approach
which often produces deeper and more enduring learning than other approaches to
learning. The three major components and foundation of experiential model that makes
active hands-on learning more effective are “do” the activity, “reflect”, and think about
what they have learned has “application” in other areas of their lives. The experiential
learning approach helps children to experience the activity, share what they learned,
reflect/process on what they learned, generalize the life skill to their own lives, and apply
the life skill to a new situation (see figure 1).

8
Figure 1: Experiential Learning Model/Framework used in Youth Development Programs Source: Cooperative State Research, Education and Extension Services (CSREES-USDA)
Significance of the Study
This study is important for one major reason: the majority of prior studies
focusing on youth have assessed their nutrition education intervention primarily through
classroom-based observations and self-reported checklists from the teachers in the
classrooms, and garden based experiential learning approach. This study utilized an
afterschool setting using an experiential learning approach to implement and evaluate

9
curriculum-based nutrition education intervention to change nutrition knowledge,
attitudes and behaviors. Data collected from this study not only will add to the body of
knowledge on nutrition education intervention effect, but also will be made available to
county nutrition educators in order use the Up for the Challenge curriculum to improve
the health and well-being of low-income youth.
Purpose of the Study
The purpose of this study was to evaluate whether selected nutrition education
lessons from the Up for the Challenge: Health, Fitness, and Nutrition curriculum based
upon an experiential learning model contribute to change in knowledge, attitudes and
behaviors about nutrition with low-income youth in afterschool programs.
Research Questions/Hypotheses
The following research questions (RQ)/hypotheses (HO/HA) guided the study:
First, the demographic characteristics of youth participating in the study were described.
RQ1: What is the effect of nutrition education intervention (selected lessons from the
Up for the Challenge curriculum) on general nutrition and physical activity
knowledge?
HA1: Youth receiving nutrition education intervention will score significantly higher on
general nutrition knowledge compared to youth who do not receive intervention
(control group).

10
RQ2: What is the effect of nutrition education intervention on the attitudes about
nutrition, eating fruits and vegetables, eating healthy, and making healthy food
choice?
HA2: Youth receiving nutrition education intervention will score significantly higher on
attitudes compared to youth who do not receive intervention (control group).
RQ3: What is the effect of nutrition education intervention on nutrition and physical
activity behaviors?
HA3: Youth receiving nutrition education intervention will score significantly higher on
nutrition behaviors compared to youth who do not receive intervention (control
group).
RQ4: Is there a difference in nutrition knowledge, nutrition attitudes, and nutrition
behaviors when examined by participants’ demographic characteristics such as
gender, age, grade level, and ethnicity?
HO4: There will be no difference in nutrition knowledge, nutrition attitudes and
nutrition behaviors when examined by demographic characteristics of youth.
RQ5: Are there relationships between nutrition knowledge, attitudes and nutrition
behaviors?
HO5: There will be no relationships between nutrition knowledge, nutrition attitudes,
and nutrition behaviors of youth.

11
Assumptions of the Study
The following assumptions were made in the implementation and evaluation of
this study: 1) All youth taking the survey will understand and truthfully answer the
questions, 2) Nutrition education lessons from Up for the Challenge curriculum will be
administered accurately and appropriately in the experiential learning framework, 3) No
prior formal nutrition education intervention has occurred in the treatment group of
participants.
Limitations of the Study
The study is limited to youth receiving nutrition education lessons with Expanded
Food and Nutrition Education Program (EFNEP) in Clearfield and Glendale afterschool
programs. Results cannot be generalized to youth in other afterschool programs.
Operational Definitions
Dependent Variables
Behavior: The action an individual makes towards something.
Nutrition attitude: Feelings of an individual towards or about a specific nutritionally
related item.
Nutrition knowledge: The ability of an individual to respond correctly to questions on
specific facts about nutrition. Or the acquisition and comprehension of facts
and processes related to nutrition.

12
Independent Variable
Nutrition education intervention: Learning activities designed to facilitate or intervene
with the intent of modifying the outcome. For this study, nutrition lessons
from Up for the Challenge Curriculum were used as an intervention.
Others Definitions
Low-income youth: An individual, who is determined by a State educational agency or
local educational agency to be a child, aged 5 through 14, from a low-income
family, on the basis of data used to determine children eligible for free or
reduced-price lunches under the National School Lunch Act.
Experiential learning: Educational method/process of learning by making meaning from
direct experience commonly used in youth development programs.
After-school programs: Afterschool programs are safe, extracurricular structured
activities that convene regularly in the hours after school and offer activities to
help children learn new skills, and develop into responsible adults.
Organization of the Dissertation
Chapter I includes the introduction, problem statement, significance of the study,
purpose of the study, research questions/hypotheses, a definition of operational terms,
and assumptions of the study. Chapter II contains a literature review relevant to the study.
Chapter III describes the research methods/procedures used to collect data. Chapter IV
presents findings of the study. Chapter V includes a summary, discussion of the findings,
conclusions, and recommendations of the study.

Chapter 2
REVIEW OF LITERATURE
The purpose of this study was to evaluate whether selected nutrition education
lessons from the Up for the Challenge: Health, Fitness, and Nutrition curriculum based
upon experiential learning model contribute to change knowledge, attitudes and
behaviors about nutrition with low-income youth in afterschool programs.
This chapter present a review of literature related to the study and is organized
into four sections. First section presents literature related to overweight issues and youth,
followed by knowledge, attitudes and behavior of youth towards nutrition (section 2).
Section three presents literature pertaining to nutrition education of youth, while section
four discusses literature related to afterschool programming. The final section discusses
literature on experiential learning theory as related to this study. Finally, a summary of
literature review is presented.
Overweight in Youth
The increase in the number of overweight children has become a major public
health concern in industrialized nations (Veugelers & Fitzgerald, 2005). In the United
States, the Centers for Disease Control and Prevention (2007) reported that the
prevalence of overweight status among children aged 6 to 11 has more than doubled since
1985, and the rate among adolescents ages 12 to 19 has more than tripled during the same

14
time period. In addition, overweight children have a greater chance of becoming
overweight or obese adults (Center for Disease Control, 2007; Veugelers & Fitzgerald,
2005; Ritchie et al., 2006). Educating children on the health benefits of maintaining a
healthy weight is the first step in reducing the incidence of childhood overweight and
preventing future health problems.
Poor nutrition, including the lack of Fruits and Vegetable (F&V) consumption, is
widely recognized as one of the primary causes for excess body fat (Veugelers &
Fitzgerald, 2005). Research has shown a positive relationship between F&V consumption
and weight loss. In a study conducted by Fitzwater et al., (1991) obese adults were asked
to restrict their diets to low-fat, high complex carbohydrate food emphasizing unlimited
F&V. After 25 months, 69% of the participants lost an average of 13.9 pounds. Follow-
ups were conducted at a range of 4 to 76 months and showed that 53% of the participants
continued to lose or maintain their weight while staying on the high F&V diet. The mean
weight loss from pretreatment to end of follow-up was 17.6 +/- 2.2 lb. Epstein et al.
(2001) conducted a study that compared increased F&V consumption and weight loss to
decreased fat and sugar consumption and weight loss. The study design randomized
families into two groups. Both of the groups were given a comprehensive weight control
program, but one group was encouraged to increase F&V consumption while the other
group was encouraged to decrease fat and sugar consumption. After one year, the parents
from the families that increased F&V consumption had greater weight loss (p<.03)
compared to the parents from the families that decreased fat and sugar consumption.
Even though the benefit of a diet that incorporates F&V is well established,
children today are not consuming adequate levels of F&V. Only 26% of children between

15
the ages of 6 and 11 eat two or more servings of fruit each day (United States Department
of Health and Human Services (USDHHS), 2000). In addition, only 27% of boys and
24% of girls between the ages of 6 and 11 eat three servings of vegetables each day
(USDHHS, 2000). Childhood food consumption is a strong predictor of adulthood food
consumption (Edwards & Hartwell, 2002). Therefore, teaching children about nutrition,
increasing consumption of healthy foods, which includes F&V, are important objectives
in maintaining overall good health later in life.
Overweight children are at risk for the same health complications as overweight
adults including: heart disease, high cholesterol, high blood pressure, and type 2 diabetes
(Center for Disease Control and Prevention, 2007). The incidence of type 2 diabetes,
which was once considered an adult disease, has increased among children (USDHHS,
2001). This could be related to an advanced maturation process in overweight children.
Precocious puberty has been associated with insulin resistance (Ritchie et al., 2006). In
addition to the physical health threats caused by obesity, there are also psychological and
social threats (Ritchie et al., 2006). The Surgeon General (USDHHS, 2001) reported that
the most immediate consequence of being overweight, as perceived by the children
themselves, is social discrimination. Overweight children associated being teased and
shunned by their peers with their weight. Overweight children also tend to have a poor
self-image and have fewer academic and employment opportunities (Backman et al.,
2002).
The Centers for Disease Control (2007) recommends both a diet that follows the
USDA’s Dietary Guidelines and daily physical activity to manage one’s weight. A
weight loss of 5 to 15% of the total body weight of an overweight person reduces their

16
risk of some diseases, particularly heart disease. Weight loss can also lower blood
pressure, blood sugar, and improve cholesterol levels (USDHHS, 2001). Weight
maintenance and healthy diet choices, therefore, should be considered a lifelong effort
which begins in childhood.
Nutrition Knowledge, Attitudes and Behaviors
Food preferences, dietary habits, behaviors, and lifestyle choices are all developed
and established during childhood (Kirby et al., 1995; Carter, 2002). Therefore, any
unhealthy eating practices that are established at an early age contribute to chronic
disease because “young persons having unhealthy eating habits tend to maintain these
habits as they age” (Mobility and Mortality Weekly Report (MMWR), 1996, p.5). Since
many behaviors and lifestyle choices are developed while a child is in school, a student’s
food intake and physical activity at school are important determinants of body weight
(Carter, 2002).
Many children and adults do not meet the goal set by the USDA to consume at
least five servings of fruits and vegetables daily (Domel et al., 1993; Subar et al., 1995;
CDC, 1996; Krebs-Smith et al., 1996; Cullen et al., 2001). According to the Five a Day
Baseline Survey (Subar et al., 1995), the total population had a median weekly intake of
3.4 servings of fruits and vegetables per day and only 23% of the total population reports
consumed five or more servings of fruits and vegetables on a daily basis (Domel et al.,
1993; Subar et al., 1995). A sample of children, aged 2-18, that participated in a three day
diet record consumed, on average, 3.6 servings of fruit and vegetables daily, and a large

17
portion of those vegetables reported were fried potatoes (Krebs-Smith et al., 1996). Of
the children surveyed, only 20.4% did consume the recommended five or more servings
of fruits and vegetables a day, 50.8% ate less than one serving of fruit per day, and 29.3%
ate less than one non-fried vegetable daily (Krebs-Smith et al., 1996). A study conducted
by Cullen et al. (2001) reported that the average daily fruit and vegetable intake was 2.13
servings and another study indicated that only 5% of 7to 14 year olds met the “five a
day” fruits and vegetables recommendation, (St-Onge et al., 2003) both of which are a
decrease from the previous study. A 24 hour diet recall of high school students indicated
that 41% of the students surveyed did not consume any vegetables and 42% ate no fruit
the day before they participated in the survey (MMWR, 1996). The percentages of fruits
and vegetables consumed also decreased as the children got older.
The amount of fat, saturated fat, and calories consumed has increased while
physical activity has declined, which contributes to the rising number of overweight
children (CDC, 1996; Blumenthal et al., 2002). Between 1994 and 1997 there was more
than a 15% increase in the average daily calorie intake per person in the United States
(Blumenthal et al., 2002). Part of this may be due to the increase in the prevalence of
snacking between meals and the increase in fast food consumption, because fast food
consumption is connected with lower intakes of fruits and vegetables (St-Onge et al.,
2003). In 1996, it was reported that of children aged 6 to 17, 84% ate too much fat, and
91% ate too much saturated fat (CDC, 1996). The amount of physical activity among
Americans had declined in 2002, with 74% of adults stating that they did not engage in
the amount of physical activity recommended by the U.S. Department of Health and
Human Services (Blumenthal et al., 2002). During the time between 1991 and 2001, the

18
percentage of students attending daily physical education classes declined from 42% to
32% respectively (Blumenthal et al., 2002).
There are many different attitudes that children and their parents have about food,
especially fruits and vegetables (Contento, 1981; Kirby et al., 1995). According to a
study conducted by Kirby et al. (1995), many adults believe that children eat what their
parents eat or they eat what their peers eat. Many children believe that “if it’s good for
you, then it must be bad” (Kirby et al., 1995). The translation is that if something is
healthy, then it must taste bad, because the children interviewed said that “veggies taste
bad” (Kirby et al., 1995). Both parents and children view eating out as a treat and would
not normally order fruits and vegetables (Kirby et al., 1995).
A qualitative study conducted by Contento (1981) about food knowledge and
attitudes revealed that children thought that “good for you” foods were fruits, vegetables,
and meat, “food” was non-sweet foods, and “other foods” consisted of desserts and
candy. There was a difference between “food” and “snacks” and they were aware that
“food” makes one “strong” and “healthy” and “made you grow.” However, they did not
know how or why food did those things.
A study by Cullen et al. (2000) found that students did report that peers affect the
choices they make in regards to fruits and vegetables; however negative comments about
eating vegetables were not likely to cause them to stop eating a vegetable they liked. The
children and parents interviewed said that “all kids like candy more than fruit” and
parents said that “most of the children eat the same thing, a lot of junk food” (Cullen et
al., 2000). Most of the children preferred starches over vegetables and most reported that
they ate out for dinner at least twice a week (Cullen et al., 2000).

19
Preference for and positive attitudes about health food choice and fruits and
vegetables have been major predictors of fruit and vegetable consumption (Domel et al.,
1993; Resnicow et al., 1997; Cullen et al., 2000). Since many chronic disease processes
begin in childhood and carry over into adulthood and dietary preferences are learned
while children are young, strategies should be aimed at younger children to increase their
preferences and positive attitudes towards health foods and fruits and vegetables
(Baranowski et al., 1997). Strategies aimed at younger children tend to have better long-
term results than strategies focused on adolescents (Carter, 2002).
The literature on eating behavior and its relationship to nutrition knowledge is
contradictory. Some researchers have shown that nutrition knowledge was highly and
positively related to the behavior towards nutrition (Read et al., 1988, Saegert and
Young, 1983). Other researchers have found little or no correlation between nutrition
knowledge and actual choices of healthy foods (Story and Resnick, 1986). Furthermore,
other researchers have found that knowledge is not the only factor that could influence
eating behavior. Other factors and variables that could influence children eating behavior
are: food preferences, parental practices, peer pressure, media, fast foods, social norms
(Farthering, 1991; Shannon and Chen, 1988; Schwartz, 1985). Additional, findings from
this study will either support or not support findings previously found by other
researchers.

20
Conceptual Framework of the Study Variables
This study uses a traditional learning framework in which knowledge precedes
attitude, which in turn influences behavior. This approach urges that individuals first
learn about an innovation, then develop a positive attitude towards it, and after passing
through these stages, engage in the behavior (Rogers, 1995).
Attitudes Behaviors
Knowledge
Awareness Feelings Practice Understanding Action Skills
Nutrition Education for Youth
One method of exposure of a variety of nutritious foods to children is through
nutrition education efforts. The goal of nutrition education is to provide educational
programs to increase the likelihood that people will make healthy food choices consistent
with the most recent dietary advice as reflected in the Dietary Guidelines for Americans
(U.S. Department of Agriculture and U.S. Department of Health and Human Services,
2005) and the MyPyramid (U.S. Department of Agriculture, 2005). It is the position of
the American Dietetic Association (Shafer, Gillespie, Wilkins, & Borra, 1996) that
nutrition education is essential for the public to achieve and maintain optimal nutritional
health. The Association further notes that “nutrition education should be an integral
component of all health promotion, disease prevention, and health maintenance
programs, through incorporation into all appropriate nutrition communication, promotion,
and education systems” (p.1183-1187).

21
Lifelong beliefs and habits about food and health are established in early
childhood. A child’s day-to-day experiences with food and eating mold the way he/she
thinks and feels about nutrition for the rest of his/her life. Although young children are
not developmentally or cognitively ready to take over responsibility for their diets and
health behaviors, they are capable of understanding basic nutrition and health concepts;
they are interested in their growing bodies and staying healthy; and they are forming
beliefs and attitudes about nutrition and health based on their daily experiences with food
and eating (Singleton, Achterberg, & Shannon, 1992).
The impact of nutritional habits formed in childhood on current and future health
has underscored the importance of nutrition education for young children. Although
nutrition education is important throughout life, nutrition education tailored to the young
child may have the greatest potential for change not only because of the impact of early
nutrition on health, but also because of the tremendous learning readiness of young
children. Children’s natural interest and curiosity about food and their bodies provides an
excellent opportunity to provide learning experiences for children about nutrition and
health. Nutrition education for children illustrates the relationship between food and
health, helps children understand their growing bodies and how to take care of
themselves through positive eating, exercise, and health behaviors, and exposes them to a
variety of learning experiences about where food comes from and how it can be prepared.
Numerous studies have indicated the important role that a nutrition educator plays
in helping children to obtain and to develop healthy eating knowledge and behaviors
(American School Health Association, 1997; Celbuski & Farris, 2000; Escobar, 1999).
Nutrition educators work to effectively teach children about food and nutrition and apply

22
that knowledge to promote optimal health and growth. A recent review of research on
overweight in young children found that early intervention can be effective in reducing
the incidence of childhood overweight and that afterschool programs as well as schools
can be influential partners in childhood healthy weight initiatives (National Institute for
Health Care Management, 2004).
Nutrition education for children is implemented in numerous ways. Additionally,
nutrition education resources written and developed for young children deal with a
variety of topics concerning good eating habits and creating a healthy lifestyle. Effective
educational strategies with young children are the ones which provide ample
opportunities for experimentation, discovery, and self-learning. According to the National
Association for the Education of Young Children (1997), children should be involved
with actual food in order to learn about nutrition. Hands-on nutrition activities help
children develop healthy eating habits and can complement other learning, for example
math, science, language, social development, cooperation, and respect for culture.
Achterberg (1988, p. 3) notes that “meaningful learning is more likely to occur in an
interactive context that fosters positive feelings” and that “learning in one context can
affect learning in another context, especially if these contexts generate the same kind of
feelings.”
Lytle (1995) examined studies of current nutrition education efforts directed
toward school-aged children. Her findings indicated two major approaches for nutrition
education programs. The first approach termed knowledge-based nutrition education has
the goal to enhance the knowledge, skills, and attitudes needed by children to understand
broad, contemporary food and nutrition issues and to select a diet that is good for their

23
general health using a food group approach. The second approach focuses on disease
prevention and enhancement of overall health through diet. Both approaches have been
found to have merit with a school-aged audience.
Hertzler and DeBord (1994) designed and tested four lessons for developmentally
appropriate food and nutrition skills for young children in an effort to determine their
effectiveness. The authors promoted the importance of tailoring nutrition education
materials to the developmental skills of children, including muscular development as well
as math and language readiness levels. Their findings yielded several recommendations
for implementing nutrition curricula for young children: (a) a nutrition plan such as the
Food Guide Pyramid should be central to planning nutrition concepts and activities, (b)
actual teaching methods need to be appropriate to the child’s learning level and “telling”
should only be used in emergencies, (c) parental involvement and family processes are
vital to reinforce nutrition activities, and (d) nutrition education materials should
complement children’s developmental levels and be easily adapted for generating
activities.
Ciliska, Miles, O’Brien, Turl, Hale Tomasik, and Donovan (1999) conducted a
systematic review to identify nutrition education that was effective in specifically
increasing fruit and vegetable consumption in children and adults. The review concluded
that the most effective interventions: (a) gave clear messages about increasing fruit and
vegetable consumption, (b) incorporated behavioral theories and goals, providing a
consistent framework for implementation and evaluation, (c) provided longer, more
intensive interventions rather than one or two contacts, (d) actively involved influential
people such as family members and teachers, and (e) had a greater impact on those whose

24
knowledge or intake were lower at the beginning. The implications of this review led the
authors to conclude that there is a current shortage of effective nutrition education and
there must be an investment in human resources to plan, implement and evaluate public
health nutrition interventions.
A similar review examined the effectiveness of nutrition education intervention
research funded under the National Cancer Institute’s 5-A-Day for Better Health Program
(Reynolds, Baranowski, Bishop, Gregson, & Nicklas, 2001). These interventions were
specifically targeted at increasing fruit and vegetable consumption. Findings from the
review indicated that the nutrition interventions reviewed were successful in increasing
fruit and vegetable consumption among children and adolescents. However, the authors
recognized a need for further development of programs for children. Specifically, a call
was issued for increased “environmentally friendly settings” to interventions to increase
fruit and vegetable consumption for these audiences. Although “environmental settings”
were not defined, it can be assumed that a logical venue to provide children nutrition
education, such as afterschool setting, would qualify.
Afterschool Programs and Expectation
Approximately seven million children in the United States are regular attendees of
an afterschool program (ASPs) between the hours of 3 p.m. and 6 p.m. (Capizzano, Tout,
& Adams, 2000). The goals of ASPs vary, but most aim to provide a safe and structured
environment during the hours following school dismissal, while parents are working, and
opportunities for academic, social, and health promotion.

25
Afterschool programs are viewed as one of many places that can tackle the
growing problem of overweight among children and youth. Several evaluation research
studies have demonstrated that afterschool programs can contribute to improvement in
healthy lifestyles and increased knowledge about nutrition and exercise. For example:
First, an experimental study of the Girlfriends for KEEPS program, which
includes fun skill-building activities and physical activity, conducted by Story,
Sherwood, Himes, Davis, Jacobs, Cartwright, et al., (2003), showed benefits to girls’
intentions to maintain healthy behaviors, knowledge about proper diet practices, and
preferences for physical activity.
Second, the experimental study of the Cooke Middle School Afterschool
Recreation Program found increases in participants’ time spent on strength-training
activities (Lauver, 2002).
Third, the experimental study of the FitKid program, which combines academic
enrichment, healthy snacks, and physical activity, conducted by Yin, Gutin, Johnson,
Hanes, Moore, Cavnar, et al., (2005) found that participants benefited from the program
in terms of their percentage of body fat and cardiovascular fitness.
Fourth, a longitudinal study of children’s afterschool program conducted by
Mahoney, Lord, & Carryl, (2005 a & b) of over 650 youth at 25 after-school programs
found that youth who participated in after school programs were more likely than
nonparticipants to experience reductions in obesity, after accounting for a variety of
differences between participants and nonparticipants. This was true even after controlling
for youth’s initial Body Mass Index (BMI) status at the beginning of the study, as well as
demographic factors like poverty, race, and ethnicity. Likewise, a study of adolescent

26
time use and health behavior showed that afterschool activity participants spent less time
eating and watching television and more time engaged in sports compared to
nonparticipants (Vandell, Shernoff, Pierce, Bolt, & Fu, 2003). Together, these studies
point to afterschool programs’ potential power to promote the general health, fitness, and
wellness of young people by keeping them active, there by promoting the importance of
healthy behaviors, and providing healthy snacks.
Afterschool programs represent a relatively healthy developmental context when
compared to alternative arrangements. Afterschool programs typically provide a
structured, adult-supervised environment where physical recreation is a normal part of the
curriculum and eating is restricted to snack time. Therefore, over time, children who
regularly participate in this context are expected to have a lower BMI and show lower
rates of obesity than children who do not participate.
Reviews of nutrition education programs by (Contento, Balch, Bronner, Lytle,
Maloney, Olsen, & Swadener, 1995; Reynolds, Baranowski, Bishop, Gregson, & Nicklas,
2001) found that nutrition education programs based on practices and sound learning
theory produced more desirable results that are more readily evaluated. A learning theory
that provides guidelines for conducting the educational activities in the afterschool
program setting, and allows the educator to recognize success through targeted evaluation
is more appropriate.

27
Experiential Learning Model
One means of providing appropriate nutrition education experiences is through
the experiential learning model/theory. Experiential learning theory suggests that learning
is cyclical. A person has an experience, reflects on that experience, draws some
conclusions about the lessons that can be learned from that experience, and then uses
those lessons as part of his or her basis for reactions to future experiences. The
foundations of experiential learning were articulated by Dewey (1938) as he attempted to
outline his “progressive” approach to education.
Philosophical traditions and the pedagogical theories and practices of 18th and 19th
century philosophers and educators can be noted in Dewey’s writing (Dewey, 1910,
1916, 1938) which included concepts regarding the relationship between experience and
learning. Among the many concepts that Dewey espoused were: the interaction and
continuity of experience; the creation of new knowledge, awareness, and ability; the
integration and expansion of perception; and the development and understanding of self-
direction (Wilson & Burket, 1989).
Dewey provided his model of experiential learning in Experience and Education
(1938). Dewey believed that learning transforms the impulses, feelings, and desires of
concrete experience into purposeful action. Dewey’s model integrated experience,
concepts, observations, and actions. He developed several principles that created an
“intimate and necessary relation between actual experiences and education,” free
expression and cultivation of the individuality, free activity, learning through experience,
acquisition of skills and techniques as means of attaining ends. These principles allowed

28
participants to make the most of their present opportunities and acquaintance with a
changing world (Dewey, 1938, pp. 19-20).
Dewey’s emphasis on the primacy of experience was first described in the 18th
century by Rousseau in his classic book, Emile, in which he introduced the concepts of
experiential learning into the field of education. “Put the problem before him [the learner]
let him not be taught science, let him discover it” (Rousseau, 1762, pp. 130-131).
Rousseau believed that teachers should provide participants with opportunities to observe
nature, experience nature, and learn on their own. He contended that “God makes all
things good,” (Rousseau, 1762, p. 5) and educators served children best when they
recognized their innate goodness and encouraged children to follow their individual
interests and experiences of their choice. The inception of the child-centered educational
concepts of today can be found in Rousseau’s early writings on children’s innate wisdom
(Day, 1994).
The experiential learning model, in which experience is central to the learning
process, may offer potential for developing a learning atmosphere in which human
experiences can be shared and interpreted through dialogue (Kolb, 1984). According to
the experiential learning theory, “a holistic integrative perspective on learning” can be
developed which combines experience, perception, cognition, and behavior (Kolb, 1984).
Thus, the most influential proponent of the experiential approach is Dewey.
Another proponent of the experiential learning approach is Jean Piaget, a
developmental psychobiologist. He suggested that ideas were not fixed elements of
thought, but were formed and reformed through experience. The experiential learning
29
model builds on his notion that learners are co-creators of learning as they construct
knowledge in context.
Piaget created a developmental theory which concluded that intellectual
development is the result of the interaction of hereditary and environmental factors. A
central component of Piaget's developmental theory of learning and thinking is that both
involve the participation of the learner. Knowledge is not merely transmitted verbally but
must be constructed and reconstructed by the learner. Piaget asserted that for a child to
know and construct knowledge of the world, the child must act on objects and it is this
action which provides knowledge of those objects (Sigel & Cocking, 1977), organizes
reality and acts upon it. The learner must be active; he is not an empty vessel to be filled
with facts.
According to Piaget, intellectual growth involves three fundamental processes:
assimilation, accommodation, and equilibration. Assimilation involves the incorporation
of new events into preexisting cognitive structures. Accommodation means existing
structures change to accommodate to the new information. This dual process,
assimilation-accommodation, enables the child to form schemata. Equilibration involves
the person striking a balance between himself and the environment, between assimilation
and accomodation. When a child experiences a new event, disequilibrium sets in until he
is able to assimilate and accommodate the new information and thus attain equilibrium.
There are many types of equilibrium between assimilation and accomodation that vary
with the levels of development and the problems to be solved. For Piaget, equilibration is
the major factor in explaining why some children advance more quickly in the
development of logical intelligence than do others (Lavatelli, 1973).

30
A Piagetian-inspired curriculum emphasizes a learner-centered educational
philosophy. The teaching methods which most American school children are familiar
with, teacher lectures, demonstrations, audio-visual presentations and programmed
instruction, do not fit in with Piaget's ideas on the acquisition of knowledge. Piaget
espoused active discovery learning environments in our schools. Intelligence grows
through the twin processes of assimilation and accomodation; therefore, experiences
should be planned to allow opportunities for assimilation and accomodation. Children
need to explore, to manipulate, to experiment, to question, and to search out answers for
themselves.
In a Piagetian teaching model, children are allowed to make mistakes and learn
from them. Learning is much more meaningful if the child is allowed to experiment on
his own rather than listening to the teacher lecture. The teacher should present students
with materials and situations and occasions that allow them to discover new learning. In
his book, To Understand Is to Invent, Piaget (1972) stated the basic principle of active
methods can be expressed as follows: "to understand is to discover, or reconstruct by
rediscovery, and such conditions must be complied with if in the future individuals are to
be formed who are capable of production and creativity and not simply repetition" (p.
20). In active learning, the teacher must have confidence in the child's ability to learn on
his own.
Kolb’s book, Experiential Learning (1984) provides more recent information on
the experiential learning model. Derived from Dewey’s earlier cyclical model, Kolb's
cycle consists of four stages: concrete experience, reflective observation, abstract
conceptualization, and active experimentation.

31
Two quite different bodies of literature have grown out of the works of Kolb and
Dewey. A number of edited volumes by Boud et al (Boud, Cohen & Walker, 1993; Boud,
Keogh, & Walker, 1985; Boud & Miller, 1996) also an early text by Schon (1983),
provide numerous studies and examples of learning from experience. In these volumes, it
is clear that the reflective stage in Kolb's model (and other such models) is taken very
seriously, as illustrated by the title of the oldest of these volumes: Reflection: Turning
Experience into Learning (Boud et al, 1985). Indeed, similar with Kolb's theory, learning
is assumed not to occur at all unless there is active and intentional reflection. Throughout
nearly all these books, the role of the teacher is seen as critical in helping students turn
their experience into learning.
The other body of literature, which is on experiential education, exemplified in
the edited volume by Warren, Sakofs, Hunt, and Jasper (1995), similarly focuses upon
the importance of the teacher for helping typically young students interpret various
experiential opportunities that are engineered or developed as part of their formal
training. In these writings, Kolb is never cited, but much theoretical significance is given
to Dewey (e.g., 1910, 1929, 1938), in terms of his cyclical model as well as his emphasis
upon the importance of creating learning opportunities around the interests and relevant
experiences of students. Again, as with Kolb and Boud, the creation of learning depends
not on "experience" per se, but upon the intervention of a teacher who helps students
understand that experience.
Not all writings on experiential learning stress the importance of a mediator or
guide. Many books have been written to simply emphasize the other Deweyan message,
that experiential learning, or learning first hand by doing, produces deeper and more
32
enduring knowledge than isolated classroom or second-hand learning. Eisner (1994),
Hopkins (1994), and Reed (1996) all argue that formal education, which is inordinately
dependent upon book-learning is really quite shallow and relatively ineffective. The
theoretical importance of these writings is that they call into question the use of formal
learning as a benchmark against which to assess experiential learning. It could well be
that Dewey and Kolb's view of experience as somehow "raw" and undigested needing the
civilizing force of intentional reflection to make it meaningful is wrong. Certainly, this
conception of experience seems directly contradicted by some of these writings, as well
as by several writers who describe how first-hand experiences on the job provide learning
opportunities that are otherwise simply unavailable (Burnard, 1991, on nursing; Scannelli
& Simpson, 1996, on the value of student internships; Calder & McCollum, 1998, on
vocational learning). Eisner (1994) illustrates these ideas by having the reader examine a
picture of two people interacting in a restaurant and then asking them to read a well-
written description of the picture. He then asks which experience is richer, and it is
patently obvious that infinitely more information is conveyed by the picture than the
prose piece. In other words, these writers clearly see educational value in experience
itself and are not prepared to state that such experiences constitute learning only if they
are subjected to additional thought.
Young people desire and deserve opportunity to learn in an engaging, active,
participatory environment where they can connect hands and minds (Seidel, Aryeh, &
Steinberg, 2002).
33
Summary of Literature Review
This chapter reviewed overweight status in youth, nutrition knowledge, attitudes
and behaviors, previous nutrition education studies, after-schools settings, and the
experiential learning model/theory. The literature review summarized research that has
clearly shown establishing good nutrition habits at an early age is important to healthy
child outcomes. The prevalence of overweight status among children in the United States
has tremendously increased. Concomitant with overweight and obesity are greater risks
for diseases such as cardiovascular disease, hypertension, diabetes, and cancer. The lack
of nutrition knowledge, negative attitudes, and poor dietary behavior are among the many
causes of overweight which leads to obesity in youth. Prevention of obesity is recognized
as the best method for controlling it’s rise. Good nutrition, healthy food choices,
increasing fruit and vegetable consumption, and physical activity may offer one approach
to combating obesity as well as lessening the onset of many cancers and reducing
diabetes. These foods need to be introduced early in life in order to develop positive
dietary habits (Traahms & Pipes, 2000).
One method to accomplish this introduction is through nutrition education
intervention in after-school programs. In order to be effective, nutrition education needs
to meet certain criteria including being theoretically based, of a sufficient duration to
affect change, and containing appropriate activities that incorporate meaningful learning
for the child (Contento, Balch, Bronner, Lytle, Maloney, Olsen, & Swadener, 1995;
Hertzler & DeBord, 1994). Reviews of nutrition education projects aimed at good
nutrition, increasing fruit and vegetable consumption have identified a need for increased
34
numbers of interventions meeting these criteria, as well as interventions containing
environmental settings to improve learning opportunities (Reynolds, Baranowski, Bishop,
Gregson, & Nicklas, 2001). Experiential learning offers a viable framework for nutrition
education to school-aged children. This model allows children to learn and construct
meaning through real life situation.

Chapter 3
METHODOLOGY
The purpose of this study was to evaluate whether selected nutrition education
lessons from the Up for the Challenge: Health, Fitness, and Nutrition curriculum based
upon an experiential learning model contribute to change in knowledge, attitudes and
behaviors about nutrition with low-income youth in afterschool programs. The following
five research questions (RQ)/hypotheses (HA/HO) guided this investigation. First, the
demographic characteristics of youth participating in the study were described.
RQ1: What is the effect of nutrition education intervention (selected lessons from the
Up for the Challenge curriculum) on general nutrition and physical activity
knowledge?
HA1: Youth receiving nutrition education intervention will score significantly higher on
general nutrition knowledge compared to youth who do not receive intervention
(control group).
RQ2: What is the effect of nutrition education intervention on the attitudes about
nutrition, eating fruits and vegetables, eating healthy, and making healthy food
choice?
HA2: Youth receiving nutrition education intervention will score significantly higher on
attitudes compared to youth who do not receive intervention (control group).
RQ3: What is the effect of nutrition education intervention on nutrition and physical
activity behaviors?

36
HA3: Youth receiving nutrition education intervention will score significantly higher on
nutrition behaviors compared to youth who do not receive intervention (control
group).
RQ4: Is there a difference in nutrition knowledge, nutrition attitudes, and nutrition
behaviors when examined by participants’ demographic characteristics such as
gender, age, grade level, and ethnicity?
HO4: There will be no difference in nutrition knowledge, nutrition attitudes and
nutrition behaviors when examined by demographic characteristics of youth.
RQ5: Are there relationships between nutrition knowledge, attitudes and nutrition
behaviors?
HO5: There will be no relationships between nutrition knowledge, nutrition attitudes,
and nutrition behaviors of youth.
Evaluation Research Design
This study was conducted from September, 2008 to December, 2008 using two
afterschool programs. Afterschool programs were categorized into treatment (TG) and
control group (CG). Group designations were based on requests from Penn State
Nutritional Links program. The study used a quasi-experimental design consisting of
pretest-posttest comparison control group (see figure 2). The evaluation of nutrition
education intervention on nutrition knowledge, attitudes and behaviors were measured at
pretest (time 1) posttest (time 2) and delayed post-posttest (time 3).

37
Pretest Intervention Posttest Delayed Posttest
TG N=43 -------------------------------------------------------------------------------------------- CG N=43
O1
KAB
O2
KAB
Xi O3
KAB
O5
KAB
O4
KAB
O6
KAB
Figure 2: Illustration of Quasi-Experimental Design with Pretest-Posttest Comparison Control Group
TG= Treatment/Intervention group CG= Control group Xi = Nutrition Education Lessons/Intervention O1 2 3 4 5 6 = Observations at pretest, posttest, and delayed posttest KAB= Knowledge, Attitudes, Behaviors
Selection of Participants
Youth in the two afterschool programs receiving nutrition education lessons
through the Expanded Food and Nutrition Education Program (EFNEP) under Penn State
Nutrition Links were identified to participate in this study. Clearfield afterschool program
served as the treatment group, while Glendale afterschool program served as the control
group. Initially, there were 84 youth in the treatment group and 73 in control group.
However, due to a very high drop-out, regular monitoring and maintenance of attendance
list and participation requirement were necessary to obtain a sample size that would yield
reliable data for a quasi-experimental study. The minimum sample size needed in
quantitative research depends on how large the effects being studied are, so there is no
rule, but a general guideline for a minimum sample size is usually between 30-50

38
participants (Schaefer, (2001). The larger the sample size, the smaller the differences
needed between groups to attain statistical significance. Overall, a total of 86 youth
participated in the study with (treatment=43, and control=43). All youth in both groups
completed a pretest, posttest assessments, and delayed posttest/follow-up after two
weeks.
Evaluation Tools/Instrumentation
A four-part evaluation tool (see Appendix G) was developed to collect data. The
tools were developed to reflect the content of nutrition lessons based on lesson
objectives/outcome (see Table 2) described in the Up for the Challenge curriculum. Each
part contained questions that addressed the research questions/hypotheses of the study.
Part one contained 14 questions pertaining to general nutrition knowledge and
physical activity. Questions were measured using multiple choices and yes or no format.
Part two contained 14 statements about attitudes towards nutrition, fruits and vegetable
consumption, and eating healthy and making healthful food choices. Statements were
measured on a five-point, Likert-type scale that ranged from 1 = disagree very much to 5
= agree very much. Part three contained 10 questions on nutrition and physical activity
behavior. Statements were measured using a four-point scale that ranged from 1 = never
to 4= several times a day. Part four contained demographic questions such as gender, age,
grade level, and race/ethnicity.

39
Ethical Considerations
Review and Validity of Instruments
Instruments used for data collection were reviewed by a panel of experts
consisting of Penn State Nutrition Links specialists and advisers, and faculty members in
the department of Agriculture & Extension Education, and the department of Nutritional
Sciences at The Pennsylvania State University. Based on the review of the expert panel,
modifications were made to the instrument. The instrument, cover letter, parent consent
and child assent forms were reviewed and approved by the Institutional Review Board
(IRB) at the Pennsylvania State University (see Appendix A, C, D, E, F, IRB # 28899
dated 7/24/2008). In addition, a written permission was also obtained to conduct the
study in the two afterschool programs from the school district board research review
committee under the Cen- Clear Child Services Inc. in Philipsburg, Pennsylvania (see
Appendix B)
Pilot-testing/Reliability
A pilot test was conducted in mid-September of 2008 with 18 youth not included
in the study for appropriateness of content, readability, understandability and clarity of
questions, and to provide ideas that helped increase the chances of obtaining valid and
reliable data. Data from the pilot test was analyzed to estimate the reliability for each of
the sections of the instrument. Cronbach’s alpha coefficient, α was used to estimate
reliability of knowledge, attitudes, behaviors, and physical activity questions. An
acceptable Cronbach’s alpha value may be defined as a coefficient greater than .50

40
(marginally reliable), but ideally values should range from .70-.90 (Portney and Watkins
2000; Sapp and Jensen 1997). To determine consistency of question response over-time,
reliability estimates from the pilot test, pretest, posttest, and delayed posttest were
analyzed. Table 1 presents reliability estimates for the four administrations.
As shown in Table 1, reliability estimates for the pilot test were in acceptable
range; nutrition knowledge questions (α= .68), physical activity knowledge (α= .28),
attitude statements (α=.92), nutrition behavior statements (α=.49), and physical activity
behavior (α=.55). The low reliability for physical activity knowledge is due to fewer
numbers of questions analyzed.
Table 1: Reliability Analyses (Cronbach’s Alpha, α) of Questionnaire Sections Pilot
test Pretest Posttest Delayed
posttest N=18 N=43 N=43 N=43 Knowledge*
11 Nutrition knowledge questions 3 Physical activity knowledge Questions
.68 .28
.69 .28
.69 .29
.69 .29
Attitude** 14 Attitudes questions
.92
.92
.92
.92
Behavior**
7 Nutrition Behavior questions 3 Physical activity behavior questions
.49 .55
.51 .55
.51 .55
.51 .55
*Multiple choice, **Likert scale

41
Intervention Description
Six nutrition education lessons from the Up for the Challenge curriculum were
identified for use in the treatment group. This curriculum encompasses lessons to
enhance knowledge, skills, and food choices via experiential learning activities that
include food tasting, food art, food puzzles, games, identification of fruit and vegetables
and preparation of healthy snack, and physical activity. Each lesson targeted specific
objectives/outcome (see Table 2 for a brief description of each of the six lessons).
Lesson one focused on the importance and benefits of physical activity types.
Lesson two focused on the use of MyPyramid guide for healthy eating and making
healthy food choices; and significance of portion/serving size in making food choices.
Lesson three focused on the description of healthier beverages such as milk,
water, juice; reading nutrition labels to compare drink choices; comparing taste and fat
content of different types of milk and selection of low fat- dairy; and preparation of quick
and simple nutritious drinks.
Lesson four emphasized identification and the necessity of eating a variety of
fruits and vegetables, importance of color in vegetable and fruit choices, and preparation
of healthful snack.
Lesson five was on importance of starting each day with breakfast, selection of
healthy breakfast, and preparation of quick and easy breakfast.
Lesson six examined differences between high and low energy foods,
understanding of how certain foods are related to weight gain/loss, and participate in
energy burning.

42
Table 2: Lesson Plan Title and Objective/Outcome from the Up for the Challenge Curriculum
Lesson Lesson title Objectives/Outcome Lesson 1
Lesson 2
Lesson 3
Lesson 4
Lesson 5
Lesson 6
Get in the movement groove
MyPyramid: The beginning challenge
Think your drink
Emphasis on fruits and vegetables
Break it up-breakfast first & Snack attack
Calories In – calories Out
Physical activity types, importance and benefits
Use MyPyramid guide for healthy eating and making healthy food choices; and significance of portion/serving size in making food choices Description of healthier beverages such as milk, water, juice; reading nutrition labels to compare drink choices; comparing taste and fat content of different types of milk and selection of low fat- dairy; and preparation of quick and simple nutritious drinks
Identification and the necessity of eating a variety of fruits and vegetables, importance of color in vegetable and fruit choices, and preparation of healthful snack
Discover importance of starting each day with breakfast, selection of healthy breakfast, and preparation of quick and easy breakfast
Examined differences between high and low calorie foods, understand how certain foods are related to weight gain/loss, and participate in calorie burning
Note: Lesson 3 and 4 were taught in same week, and lesson 5 and 6 in the same week

43
Training
One nutrition educator working with Penn State Nutrition Links program was
selected to implement the nutrition education lessons. She was trained by nutrition
specialists prior to implementation of the lessons for about one-week. The training
sessions were dynamic, interactive workshop designed to provide the knowledge and
skills necessary for successful implementation of the nutrition education lessons.
Training included background information about the program, physical activity
demonstrations, basic group management techniques and tips on using the Up for the
Challenge curriculum. In addition, the researcher made weekly visits to the schools to
check on implementation progress, ensure quality control and to provide assistance, make
observations, providing guidance for the evaluation process, implementation, and data
collection.
Intervention Implementation Period
The time schedule for the intervention implementation period of the study is
shown in Table 3. One nutrition educator attended a workshop/training in August of 2008
to become familiarized with the nutrition intervention lessons. The nutrition lessons were
implemented in four weeks between September 30- October 28, 2008.

44
Table 3: Time Schedule of the Study for Intervention Group and Control Group Intervention Control Date Event/Activity August 14-21, 2008 September 23, 2008 Pilot testing September 30, 2008 October 7, 2008 October 14, 2008 October 21, 2008 October 28, 2008 October 29, 2008 November 13, 2008
Training/workshop on use of the nutrition lesson from curriculum1 for the treatment group Pretest data collection Demographic data Nutrition intervention period for treatment group Lesson one Lesson two Lesson three Lesson four Lesson five Lesson six Posttest data collection Delayed posttest/follow-up after two weeks of posttest
Pretest data collection Demographic data Posttest data collection Delayed Posttest
1Up for the Challenge

45
Data Collection
Data collection was completed in three stages (see Table 4). Pretest data
on knowledge, attitudes and behaviors for both the treatment and control groups was
collected first at the same time. Demographic data was also collected at the time of
collecting pretest data. Two-three hours hand-on nutrition education lessons were taught
to youth in the treatment group every week over a 4-week period, after which posttest
data was collected, followed by delayed posttest data for both groups after two weeks of
administering the survey. The control group did not receive any nutrition lessons.
Questionnaires were administered by the researcher following the appropriate protocol.
The researcher/evaluator provided assistance to children who did not understand or
needed help completing the questionnaire. The time frame and order was carefully
followed in the data collection process in order to ensure consistency of the research
conditions to minimize extraneous variations. Each questionnaire was labeled and given
an identification letter for easy data entry, management and analysis. Data from the
treatment and control groups were examined for equivalence.
Table 4: Data Collection Process Stage 1 Lesson (4 weeks) Stage 2 Stage 3
(after 2 weeks) Demographic Pretest L1 L2 L3 L4 L5 L6 Posttest Delayed posttest
Treatment X X (KAB) x x x x x x x X (KAB) X (KAB) Control X X (KAB) - - - - - - X (KAB) X (KAB)
X=data collection Wk 1=L1, wk 2= L2, wk 3= L3 and L4, wk 4= L5 and 6 x=lesson plan implementation ---- =no lessons KAB=knowledge, attitude, behavior

46
Data Analysis
Weekly sign –up sheets completed by of students were examined and only those
students/youth that participated in the intervention/treatment group for the four-weeks
and completed all the three tests were included in the data analysis. To analyze the
nutrition knowledge questions, each correct answer received “one” point. An incorrect
answer received “zero” points. Data were entered and analyzed using a Statistical
Package for Social Sciences (SPSS) version 17.0 for windows vista 2007; Chicago, IL.
The nutrition knowledge scores were summated so that each participant received a score
ranging from zero to 11 points. The higher the score, the more knowledge the student had
about general nutrition. Fourteen attitude scores with responses ranging from (1=
disagree very much to 5= agree very much) were summed to create an attitude score. The
attitude scores could range from a low of 14 to a high of 70. Seven nutrition behavior
statements/questions with responses ranging from (1=never to 4= several times a day)
were summated to create a nutrition behavior score. This score could range from a low of
7 to a high of 28. The 3 physical activity knowledge and 3 physical activity behavior
questions were analyzed using percentages. Descriptive and inferential statistics were
used to summarize data. Descriptive statistics included frequency distribution,
percentages, means and standard deviations. Inferential statistics included general linear
model (GLM) repeated measure ANCOVA, factorial repeated measure ANOVA, and
Pearson correlation coefficient (see Table 5).
General linear model repeated measure ANCOVA were used to measure the
effect of intervention on general nutrition knowledge, attitudes and nutrition behaviors.
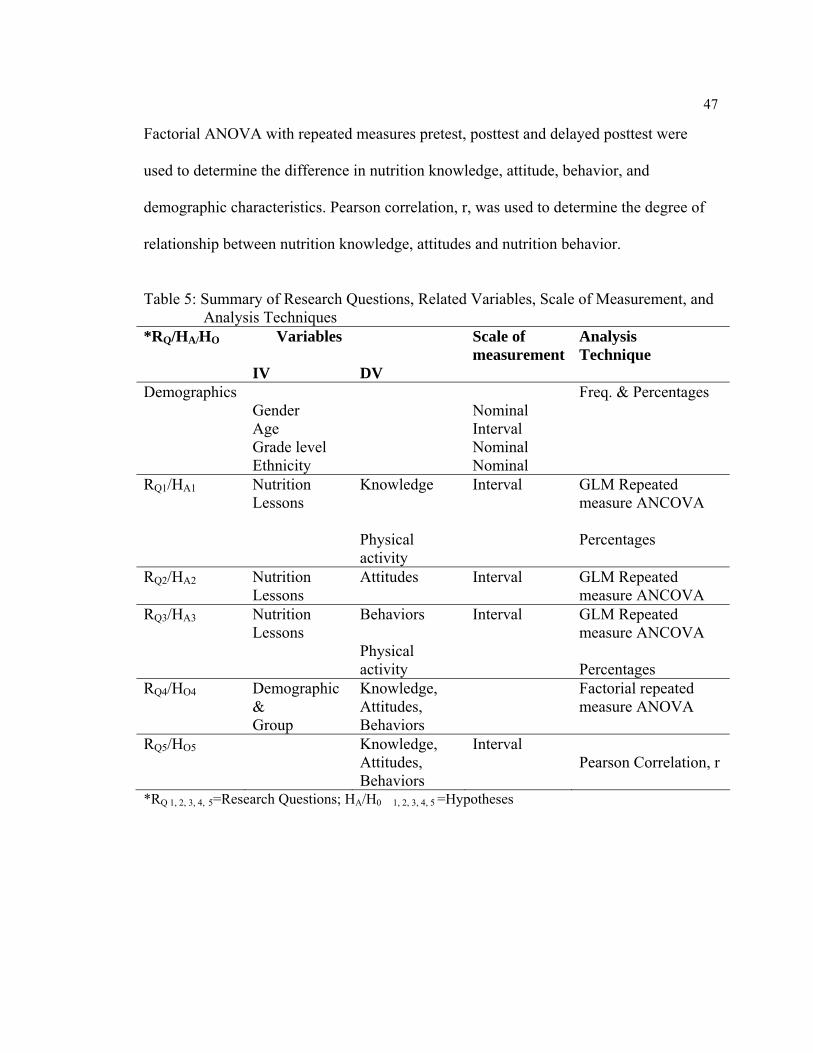
47
Factorial ANOVA with repeated measures pretest, posttest and delayed posttest were
used to determine the difference in nutrition knowledge, attitude, behavior, and
demographic characteristics. Pearson correlation, r, was used to determine the degree of
relationship between nutrition knowledge, attitudes and nutrition behavior.
Table 5: Summary of Research Questions, Related Variables, Scale of Measurement, and
Analysis Techniques *RQ/HA/HO Variables
IV
DV
Scale of measurement
Analysis Technique
Demographics Gender
Nominal
Freq. & Percentages
Age Interval Grade level Nominal Ethnicity Nominal RQ1/HA1 Nutrition
Lessons Knowledge Physical activity
Interval
GLM Repeated measure ANCOVA Percentages
RQ2/HA2 Nutrition Lessons
Attitudes Interval
GLM Repeated measure ANCOVA
RQ3/HA3 Nutrition Lessons
Behaviors Physical activity
Interval
GLM Repeated measure ANCOVA Percentages
RQ4/HO4 Demographic & Group
Knowledge, Attitudes, Behaviors
Factorial repeated measure ANOVA
RQ5/HO5 Knowledge, Attitudes, Behaviors
Interval Pearson Correlation, r
*RQ 1, 2, 3, 4, 5=Research Questions; HA/H0 1, 2, 3, 4, 5 =Hypotheses

48
Internal and External Validity
Considering the research design used in this study, the potential threats to internal
and external validity as defined by Gall, Borg & Gall (1996); Fraenkel & Wallen (2003);
Campbell & Stanley (1966); Ary, Jacobs & Razavieh (2002) were examined. Table 6
provides a definition of each of the threat present and how it was controlled by the
researcher.
Internal validity is the extent to which the changes observed in a dependent
variable are, in fact, caused by the independent variables. Threat to internal validity is
caused by extraneous variables on other possibility, and unless these variables are
controlled, they may very well produce an effect that could be mistaken for the effect of
the experiment. External validity refers to the extent to which the findings of a study can
be generalized (applied) beyond the sample. Threat to external validity help explain how
one might be wrong in making a generalization of findings.
Table 6: Threats to Internal and External Validity Threats Presence Internal Yes/No Definition Control of threat Experimental Mortality
Yes Occur when participants in both groups leave the study or miss part of it
-Kept a log of dropouts in both treatment and control groups -Started the experiment with large enough samples (TG, N=86; CG, N=73) -Used only those who provided data for pre, post, delayed post) - Go after them/or use approval procedures for handling missing data

49
A ceiling effect Yes A threat to research when the participants have knowledge of the subject prior to the research. They may score high on pretests, thus limiting room for improvement in posttest scores
-Did not control or expect this threat
Testing No Scores can improve merely from being exposed to the test more than one time
-Used ANCOVA to adjust pretest scores
Experimenter effect No Occur when the research administers the treatment and unintentionally influences the scores
-Carefully developed protocol material to be followed in the study -Used trained individual to work with the participants
Resentful demoralization
No
Happens when the control group realizes that they are not receiving the treatment and thus performs below normal
-Participants in the control group actually received treatment at a later date when the study was over
Differential selection
Yes
Threat when a difference can be seen between the treatment and control groups prior to considering effect from treatment
-Did not have much control to this threat -Did not compare unequal groups and all participants in both groups were of same age, grade level
Instrumentation No Changes occurring in the measurement procedures while the experiment is being conducted
-Used multiple choices, -Used equivalent/ similar measurements -Used valid and reliable instruments
External Interaction effect of selection biases and treatment
Yes Sample not representative of the population i.e not selected randomly
-No much control -Random assignment
Reactive experimental arrangements
No Subjects’ knowledge of participating in expt. may affect their responses
-Subjects were not aware of experiment

Chapter 4
FINDINGS
The purpose of this study was to evaluate whether selected nutrition education
lessons from the Up for the Challenge: Health, Fitness, and Nutrition curriculum based
upon an experiential learning model contribute to change in knowledge, attitudes and
behaviors about nutrition with low-income youth in afterschool programs. The following
five research questions (RQ)/hypotheses (HA/HO) guided this investigation.
RQ1: What is the effect of nutrition education intervention (selected lessons from the
Up for the Challenge curriculum) on general nutrition and physical activity
knowledge?
HA1: Youth receiving nutrition education intervention will score significantly higher on
general nutrition knowledge compared to youth who do not receive intervention
(control group).
RQ2: What is the effect of nutrition education intervention on the attitudes about
nutrition, eating fruits and vegetables, eating healthy, and making healthy food
choice?
HA2: Youth receiving nutrition education intervention will score significantly higher on
attitudes compared to youth who do not receive intervention (control group).
RQ3: What is the effect of nutrition education intervention on nutrition and physical
activity behaviors?

51
HA3: Youth receiving nutrition education intervention will score significantly higher on
nutrition behaviors compared to youth who do not receive intervention (control
group).
RQ4: Is there a difference in nutrition knowledge, nutrition attitudes, and nutrition
behaviors when examined by participants’ demographic characteristics such as
gender, age, grade level, and ethnicity?
HO4: There will be no difference in nutrition knowledge, nutrition attitudes and
nutrition behaviors when examined by demographic characteristics of youth.
RQ5: Are there relationships between nutrition knowledge, attitudes and nutrition
behaviors?
HO5: There will be no relationships between nutrition knowledge, nutrition attitudes,
and nutrition behaviors of youth.
The findings of this study are reported sequentially based on research
questions/hypotheses. First, the demographic characteristics such as gender, grade level,
age, and ethnicity of youth participating in the study are described.
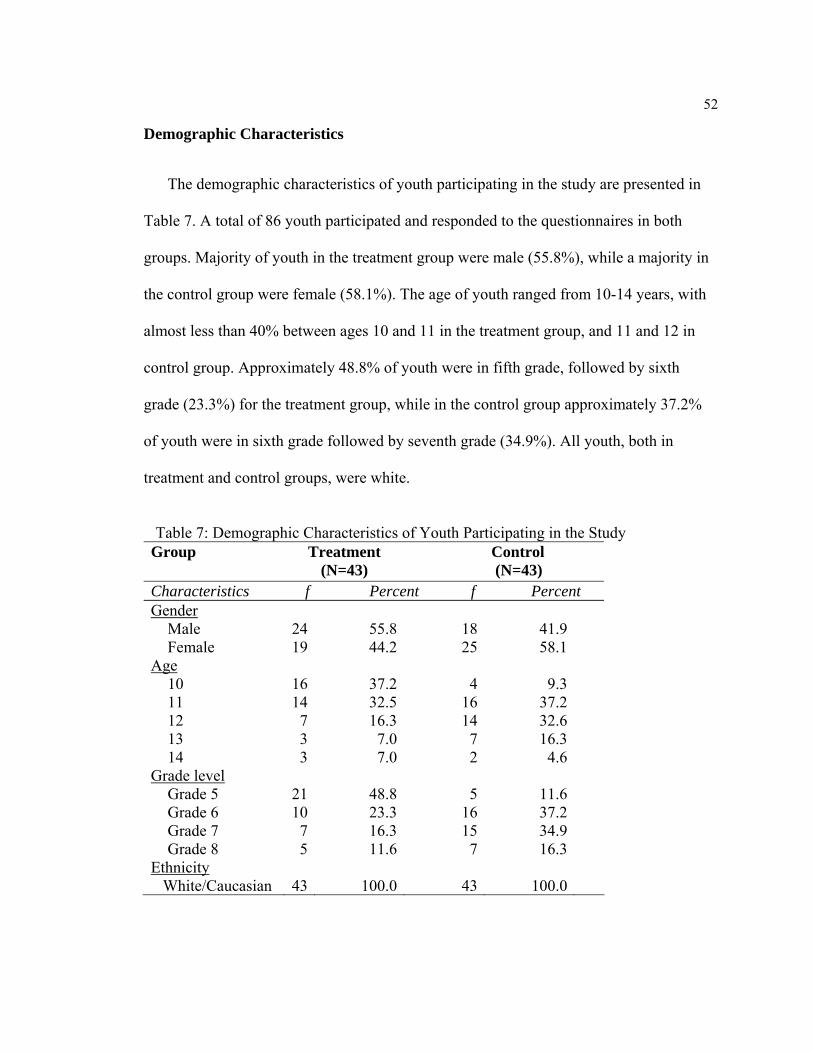
52
Demographic Characteristics
The demographic characteristics of youth participating in the study are presented in
Table 7. A total of 86 youth participated and responded to the questionnaires in both
groups. Majority of youth in the treatment group were male (55.8%), while a majority in
the control group were female (58.1%). The age of youth ranged from 10-14 years, with
almost less than 40% between ages 10 and 11 in the treatment group, and 11 and 12 in
control group. Approximately 48.8% of youth were in fifth grade, followed by sixth
grade (23.3%) for the treatment group, while in the control group approximately 37.2%
of youth were in sixth grade followed by seventh grade (34.9%). All youth, both in
treatment and control groups, were white.
Table 7: Demographic Characteristics of Youth Participating in the Study
Group
Treatment (N=43)
Control (N=43)
Characteristics f Percent f Percent Gender
Male Female
Age 10 11 12 13 14
Grade level Grade 5 Grade 6 Grade 7 Grade 8
Ethnicity White/Caucasian
24 19
16 14 7 3 3
21 10 7 5
43
55.844.2
37.232.516.37.07.0
48.823.316.311.6
100.0
1825
4161472
516157
43
41.958.1
9.337.232.616.34.6
11.637.234.916.3
100.0

53
Research Question/Hypothesis One:
Nutrition Knowledge Assessment
Nutrition knowledge of youth was assessed at pretest, posttest and delayed
posttest using 11 knowledge questions. The 11 knowledge questions focused on:
identification and importance of eating different kinds of fruits and vegetables, eating
breakfast as part of a healthy lifestyle, eating high-fiber cereal, whole grain bread,
reading nutrition labels, MyPyramid food group, sources of calcium with the lowest
amount fat, and snack choice that is lower in fat and sugar.
General linear model (GLM) repeated measures analysis of covariance
(ANCOVA) was performed with posttest and delayed posttest nutrition knowledge scores
as factors and pretest nutrition knowledge scores as a covariate. Sphericity assumption
(of covariance matrix) using Mauchly’s test were not met; significant value was <.05.
Therefore, F-value of Greenhouse-Geisser was used to determine level of significance.
Results indicated a significant increase in nutrition knowledge [F (1.000, 83.00)
=10.12, p<.001] from posttest to delayed posttest when controlling for pretest knowledge
scores, and nutrition knowledge increased regardless of the group [F (1.000, 83.00)
=19.37, p<.001]. However, increase in nutrition knowledge co-varies with pretest
nutrition knowledge of youth [F (1.000, 83.00) =4.819, p<.05], but, the covariate (pretest
nutrition knowledge) has no significant effect [F 1, 83) =.57.056, p>.05) on the increase
in nutrition knowledge scores (Table 8). Thus, the hypothesis that youth receiving
nutrition education intervention would score significantly higher on general nutrition

54
knowledge compared to youth who do not receive intervention (control group) was
supported.
Table 8: Repeated Measure ANCOVA Comparing Posttest and Delayed Posttest Scores of Nutrition Knowledgea with Pretest Scores as a Covariate
Group Adjusted Std Means Error
Post-test Treatment 8.747 .223 Control 5.741 .223Delayed posttest Treatment 9.968 .238 Control 5.544 .238Source of variation df SS MS F p(sig) Posttest, delayed (factor 1) Factor 1 by covariate (pretest knowledge) Factor 1 by group (treatment & control) Error (factor 1) Covariate (pretest knowledge) Group Error
1.000 1.000 1.000 83.00 1 1 83
7.767 3.703 14.88 63.78 168.62 408.46 245.29
7.767 3.703 14.88 .768 168.62 408.46 2.955
10.12 4.819 19.37 57.056 138.22
<.001 .031 <.001 .101 <.001
ascores range from 0 to 11 Knowledge measured by multiple choice, yes/no format

55
Physical Activity Knowledge Assessment
Three questions assessed youth’s knowledge on physical activity. Results
indicated there was an increase in knowledge scores on physical activity for youth who
participated in the intervention/treatment group compared to the control group (Table 9).
More than 50% of youth reported a correct response on the activity that kept them
healthy at pretest, posttest and delayed posttest (79%, 83.7%, 100%) respectively.
Similarly, results were found for importance of physical activity (44.2% 69.8%, 83.7%),
and the amount of time needed to be physically active (55.8%, 88.4%, 88.4%) for pretest,
posttest, and delayed posttest respectively.
However, in the control group, less than 35% of the youth answered correct on
physical activity knowledge questions. There was no increase in scores for physical
activity knowledge at pretest, posttest and delayed posttest.
Table 9: Pretest, Posttest and Delayed Posttest Scores for Physical Activity Knowledgeb Treatment Control Pretest Posttest Delayed Pretest Posttest Delayed Physical activity items
% % % % % %
Activity that keeps me healthy and active Importance of physical activity Amount of time needed to be physically active
79.1 44.2 55.8
83.7 69.8 88.4
100.0 83.7 88.4
32.6 32.6 32.6
32.5 30.2 30.2
34.9 32.0 30.2
b percent scores of correct responses for 3 items

56
Research Question/Hypothesis Two:
Nutrition Attitude Assessment
Attitude towards nutrition was assessed at pretest, posttest and delayed posttest
using 14 statements. The 14 attitude statements focused on how youth feel about nutrition
and eating fruits and vegetables, and making healthy related foods choices. The 14
statements were measured on a five-point, Likert-type scale that ranged from 1 = disagree
very much to 5 = agree very much. The physical activity statements were removed from
the analysis since they were measured on a different scale.
General linear model (GLM) repeated measures analysis of covariance
(ANCOVA) was performed with posttest and delayed posttest attitude scores as factors
and pretest attitude scores as a covariate. Sphericity assumption (of covariance matrix)
using Mauchly’s test were not met; significant value was <.05. Therefore, F-value of
Greenhouse-Geisser was used to determine level of significance.
Results indicated a significant change in attitude scores [F (1.000, 83.00) =16.57,
p<.001] from posttest to delayed posttest when controlling for pretest attitude scores, and
nutrition attitude changed regardless of the group [F (1.000, 83.00) =81.34, p<.001].
However, change in attitudes co-varies with pretest attitudes of youth [F (1.000, 83.00)
=4.288, p<.05], but, the covariate (pretest attitude) has no significant effect [F (1, 83.00)
=21.60, p>.05) on the change in attitude scores (Table 10). Thus, the hypothesis that
youth receiving nutrition education intervention would score significantly higher on
attitudes compared to youth who do not receive intervention (control group) was
supported.

57
Table 10: Repeated Measure ANCOVA Comparing Posttest and Delayed Posttest Scores of Attitudesc with Pretest Attitudes Scores as a Covariate
Group Adjusted Std Means Error
Post-test Treatment 59.24 .734 Control 32.57 .704Delayed posttest Treatment 64.35 .734 Control 31.88 .704Source of variation df SS MS F p(sig) Pretest, posttest, delayed (factor 1) Factor 1 by covariate (pretest attitudes) Factor 1 by group (treatment & control) Error (factor 1) Covariate (pretest attitudes) Group Error
1.000 1.000 1.000 83.00 1 1 83
66.866 17.301 328.20 334.88 827.32 34123.123178.64
66.866 17.301 328.203 4.035 827.32 34123.12 38.297
16.57 4.288 81.34 21.60 891.02
<.001 .041 <.001 .201 <.001
cscores could range from 14 to 70 Attitude measured on five- point scale (1) disagree very much to (5) agree very much.

58
Research Question/Hypothesis Three:
Nutrition Behavior Assessment
For nutrition behavior assessment, seven items that focused on time/period youth
ate fruits, vegetables, ate low-fat and sugar free foods, drank milk or consumed milk
products were analyzed at pretest, posttest and delayed posttest.
General linear model (GLM) repeated measures analysis of covariance
(ANCOVA) was performed with posttest and delayed posttest nutrition behavior scores
as factors and pretest nutrition behavior scores as a covariate. Sphericity assumption (of
covariance matrix) using Mauchly’s test were met; significant value was >.05. Therefore,
F-value for Sphericity Assumed was used to determine level of significance.
Results indicated a significant increase in nutrition behavior scores [F (1, 83)
=3.290, p<.001] from posttest to delayed posttest, and nutrition behaviors increased [F
(1, 83) =55.34, p<.001] regardless of the group. However, the increase in nutrition
behavior co-varies with pretest nutrition behaviors of youth [F (1, .83) =.921, p<.05], but
the covariate (pretest nutrition behavior) has no significant effect [F 1, 83) =.54.76,
p>.05) on the increase in nutrition behaviors (Table 11). Thus, the hypothesis that youth
receiving nutrition education intervention would score significantly higher on nutrition
behavior compared to youth who do not receive intervention (control group) was
supported.

59
Table 11: Repeated Measure ANCOVA Comparing Posttest and Delayed Posttest Scores
for Nutrition Behaviord with Pretest Behavior Scores as a Covariate Adjusted Std Group Means Error
Post-test Treatment 16.93 .226 Control 12.51 .226Delayed posttest Treatment 19.11 .224 Control 12.47 .224Source of variation df SS MS F p(sig) Pretest, posttest, delayed (factor 1) Factor 1 by covariate (pretest behaviors) Factor 1 by group (treatment & control) Error (factor 1) Covariate (pretest behaviors) Group Error
1 1 1 83 1 1 83
4.300 1.204 46.19 108.49 151.02 1144.75 228.91
4.300 1.204 46.19 1.307 151.02 1144.75 2.758
3.290 .921 35.34 54.76 415.07
<.001 .034 <.001 .113 <.001
dscores could range from 7 to 28 Behavior measured on scale (1) Never, (2) 2-3 times/week, (3) once/day, (4) several times a day

60
Physical activity Behavior Assessment
For physical activity behavior assessment, three questions relative to time/period
youth engaged in physical activity, involved in physical activity outside of school, and
watched television (TV) were analyzed at pretest, posttest and delayed posttest (Table 12
and figure 3).
Results indicated changes/improvement in physical activity behavior for the
intervention/treatment group from not being physically active (pretest, 23.3%) to being
physically active at least 30 minutes per day (posttest, 48.8%), and for 4-6 days per week
(delayed posttest, 51.2%). There was change in behavior from not being involved in
physical activity outside of school (pretest, 30.2%), to being involved everyday (posttest,
51.2%), and to being involved 4-6 days per week (delayed posttest, 46.5%). Watching
television (TV) did not change from pretest (69.8%), posttest (44.2%) and delayed
posttest (51.2%).
For the control group, there was no change in physical activity behavior. About
50% of youth were not physically active (53.5%, 46.5%, 46.5%) at pretest, posttest, and
delayed posttest respectively. Closer to one-half of youth were not involved in physical
activity outside of school (48.8%, 46.5%, 46.5%) for the pretest, posttest, and delayed
posttest respectively. About one-half of youth watched TV (51.2%, 48.8%, 48.8%) for 4-
6 days per week for the pretest, posttest and delayed posttest respectively. Overall,
compared to the treatment group, control group watched less TV.

61
Table 12: Pretest, Posttest and Delayed Posttest Scores for Physical Activity Behaviord
Treatment Control Pretest Posttest Delayed Pretest Posttest Delayed Physical activity items
% % % % % %
Period of being physically active
30 min/day 4-6 days/wk 1-3 days/wk Not physically active
Involvement in physical activity outside of school
Everyday 4-6 days/week 2-3 days/week 1 day/week Not Involved
Period of watching TV
Everyday 4-6 days/week 2-3 days/week 1 day/week
14.0 34.9 27.8 23.3 4.7 11.6 23.3 30.2 30.2 69.8 9.2 7.0 14.0
48.8 37.2 11.6 2.3 51.2 30.2 16.3 2.3 - 44.2 30.2 25.6 -
23.3 51.2 25.6 - 32.6 46.5 18.6 2.3 - 41.8 51.2 7.0 -
2.3 20.9 23.3 53.5 - - 7.0 44.2 48.8 30.2 51.2 16.3 2.3
2.3 20.9 30.3 46.5 - - 7.0 46.5 46.5 32.6 48.8 16.3 2.3
2.4 20.9 30.2 46.5 - - 7.0 46.5 46.5 32.6 48.8 16.3 2.3
d percent physical activity behavior scores for 3 questions ___ underlined scores which indicate changes in physical activity behavior over time from pretest to posttest to delayed posttest are illustrated in figure 3.

62
Figure 3: Pretest, Posttest and Delayed Posttest Scores for Physical Activity Behaviors

63
Research Question/Hypothesis Four:
Nutrition Knowledge by Demographic Characteristics
Additional comparisons were performed for nutrition knowledge using factorial
ANOVA with repeated measures pretest, posttest and delayed posttest to determine if
there were significant differences between scores when youth were categorized by
gender, grade level and age.
Gender: For the treatment group, males started with slightly higher scores
compared to female students/youth at pretest, posttest and delayed posttest, while females
in the control group started with high scores than males (Table 13).
Factorial ANOVA with repeated measure showed that both male and females in
the treatment group significantly increased their knowledge scores from pretest to
posttest to delayed posttest. However, there was no significant differences (p>.05)
between scores of male and female youth on nutrition knowledge both in the treatment
and control groups. Youth scored significantly different (p<.001) in nutrition knowledge
between the treatment and control group (Table 14).

64
Table 13: Descriptive Statistics of Nutrition Knowledge Scores Pretest, Posttest and Delayed Posttest by Group by Gender
Group Gender Mean* SD N Male 7.50 1.61 24 Treatment Female 7.21 1.78 19 Male 4.67 1.94 18
Pretest
Control Female 5.16 1.97 25 Male 9.79 1.25 24 Treatment Female 9.16 1.34 19 Male 4.78 2.13 18
Posttest
Control Female 5.12 2.09 25 Male 10.6 0.72 24 Treatment Female 10.5 0.84 19 Male 4.56 2.31 18
Delayed posttest
Control Female 5.28 2.09 25
* Mean score could theoretically range from 0 to 11 Table 14: Factorial ANOVA with Repeated Measures Pretest, Posttest and Delayed
Posttest of the Nutrition Knowledge by Group by Gender Source of variation Df SS MS F p(sig) Pretest, posttest, delayed (factor 1) Factor 1 by group (treatment & control) Factor 1 by gender Factor 1 by group by gender Error (factor 1) Group Gender Group by gender Error
2 2 2 2 164 1 1 1 82
110.88 109.28 2.170 0.105 184.371 1111.17 0.488 11.80 560.44
55.44 54.64 1.085 0.053 1.124 1111.17 0.488 11.80 6.835
49.31 48.60 0.965 0.047 162.58 0.071 1.727
<.001 <.001 0.383 0.954 <.001 0.790 0.192

65
Grade level: The descriptive statistics for the pretest, posttest and delayed posttest
scores for nutrition knowledge by grade level in the treatment group indicated that fifth
graders had the highest increase in knowledge scores with an increase of 2.15 points (pre
vs post), 0.85 points (post vs delayed) and, 3.0 points (delayed vs pre). Sixth graders
started with slightly higher scores but had almost the same scores as seventh through
eighth graders at posttest and delayed posttest (Table 15). For the control group, nutrition
knowledge scores remained the same for all grade levels.
Factorial ANOVA with repeated measures for pretest, posttest and delayed in the
treatment group showed that all three grade levels significantly increased knowledge
scores from pretest to posttest and delayed posttest. However, no significant differences
(p>.05) were found between nutrition knowledge scores of grade 5, grade 6 and grade 7-8
in both treatment and control groups (Table 16). Results also showed that youth scored
significantly different in nutrition knowledge between the treatment and control group
(p<.05).

66
Table 15: Descriptive Statistics of Nutrition Knowledge Scores Pretest, Posttest and Delayed Posttest by Group and by Grade Level
Group Grade Mean* SD N 5 7.71 1.98 21 6 7.50 1.58 10
Treatment
7-8 6.67 0.89 12 5 2.60 1.67 5 6 5.12 1.99 16
Pretest
Control
7-8 5.36 1.65 22 5 9.86 1.24 21 6 9.20 1.23 10
Treatment
7-8 9.17 1.47 12 5 4.60 2.30 5 6 5.13 2.16 16
Posttest
Control
7-8 4.95 2.08 22 5 10.71 0.46 21 6 10.30 1.06 10
Treatment
7-8 10.42 0.90 12 5 4.60 2.70 5 6 5.13 2.16 16
Delayed posttest
Control
7-8 4.95 2.19 22 * Mean score could theoretically range from 0 to 11 Table 16: Factorial ANOVA with Repeated Measures Pretest, Posttest and Delayed
Posttest of the Nutrition Knowledge by Group by Grade Level Source of variation Df SS MS F p(sig) Pretest, posttest, delayed (factor 1) Factor 1 by group (treatment & control) Grade by factor 1 Factor 1 by group by grade Error (factor 1) Group Grade Group by grade Error
2 2 4 4 160 1 2 2 82
122.07 59.51 9.571 15.95 167.29 945.04 4.264 28.93 543.15
61.03 29.76 2.393 3.987 1.046 945.04 2.132 14.47 6.789
58.57 28.46 2.288 2.919 139.19 0.314 2.131
<.001 <.001 0.062 0.057 <.001 0.731 0.125
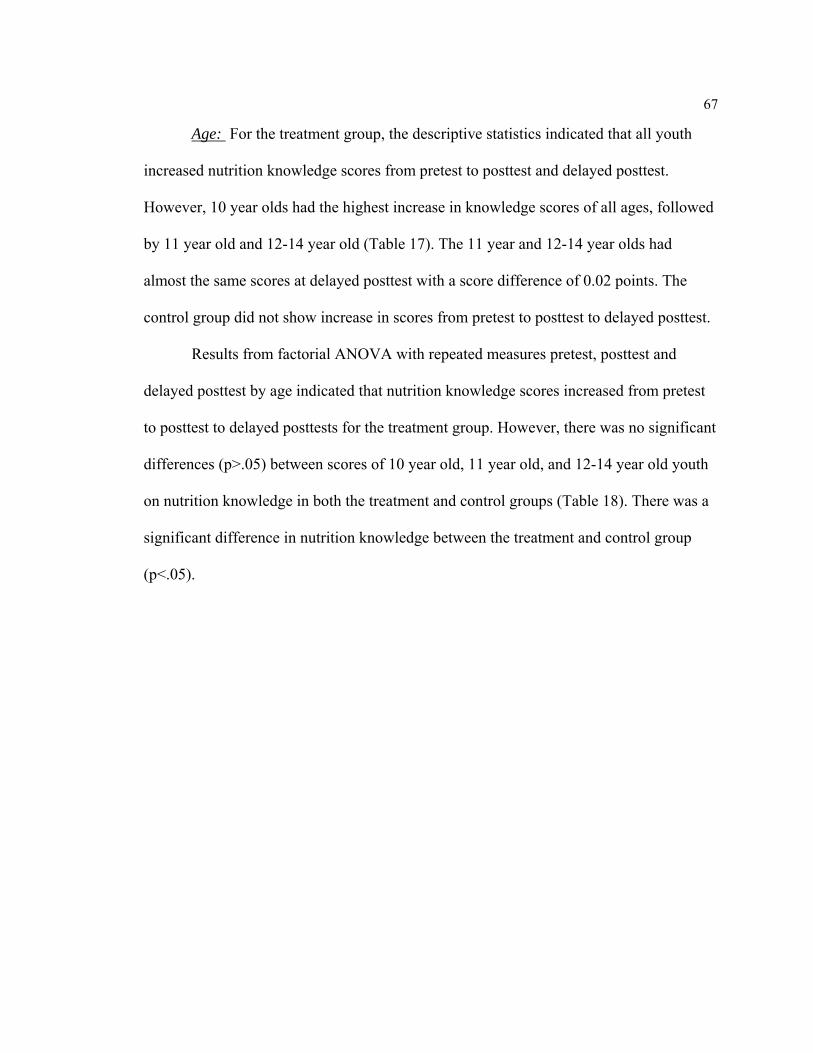
67
Age: For the treatment group, the descriptive statistics indicated that all youth
increased nutrition knowledge scores from pretest to posttest and delayed posttest.
However, 10 year olds had the highest increase in knowledge scores of all ages, followed
by 11 year old and 12-14 year old (Table 17). The 11 year and 12-14 year olds had
almost the same scores at delayed posttest with a score difference of 0.02 points. The
control group did not show increase in scores from pretest to posttest to delayed posttest.
Results from factorial ANOVA with repeated measures pretest, posttest and
delayed posttest by age indicated that nutrition knowledge scores increased from pretest
to posttest to delayed posttests for the treatment group. However, there was no significant
differences (p>.05) between scores of 10 year old, 11 year old, and 12-14 year old youth
on nutrition knowledge in both the treatment and control groups (Table 18). There was a
significant difference in nutrition knowledge between the treatment and control group
(p<.05).

68
Table 17: Descriptive Statistics of Nutrition Knowledge Scores Pretest, Posttest and Delayed Posttest by Group by Age
Group Age Mean* SD N 10 7.69 2.056 16 11 7.57 1.697 14
Treatment
12-14 6.77 0.927 13 10 3.00 1.633 4 11 5.19 2.040 16
Pretest
Control
12-14 5.13 1.817 23 10 9.81 1.223 16 11 9.43 1.342 14
Treatment
12-14 9.23 1.423 13 10 5.50 1.291 4 11 5.19 2.198 16
Posttest
Control
12-14 4.74 2.158 23 10 10.81 0.403 16 11 10.36 0.842 14
Treatment
12-14 10.38 0.961 13 10 5.50 2.082 4 11 5.19 2.198 16
Delayed posttest
Control
12-14 4.74 2.261 23 * Mean score could theoretically range from 0 to 11
Table 18: Factorial ANOVA with Repeated Measures Pretest, Posttest and Delayed Posttest of the Nutrition Knowledge by Group by Age
Source of variation Df SS MS F p(sig) Pretest, posttest, delayed (factor 1) Factor 1 by group (Treatment & Control) Age by factor 1 Factor 1 by group by age Error (factor 1) Group Age Group by age Error
2 2 4 4 160 1 2 2 80
128.21 48.99 12.667 17.03 165.15 843.94 5.011 5.666 559.71
64.10 24.49 3.167 4.257 1.032 843.94 2.505 2.833 6.996
62.10 23.73 3.068 4.125 120.63 0.358 0.405
<.001 <.001 0.058 0.060 <.001 0.700 0.668

69
Nutrition Attitudes by Demographic Characteristics
Additional comparisons were performed for nutrition attitude using factorial
ANOVA with repeated measures pretest, posttest, and delayed posttest to determine if
there was a significant difference between scores when youth were categorize by gender,
grade level and age.
Gender: Male students started with higher scores compared to females at pretest,
while females had higher scores at posttest and delayed posttest in the treatment group
compared to the control group (Table 19). While both male and females significantly
increased their attitude scores from pretest to posttest and to delayed posttest, there was
no significant differences (p>.05) between male and female youth relative to nutrition
attitude scores in both treatment and control group (Table 20).

70
Table 19: Descriptive Statistics of Attitude Scores Pretest, Posttest and Delayed Posttest by Group by Gender
Group Gender Mean* SD N Male 39.25 13.867 24 Treatment Female 37.84 14.404 19 Male 32.33 6.417 18
Pretest
Control Female 31.44 6.063 25 Male 59.96 4.438 24 Treatment Female 60.16 4.113 19 Male 32.28 6.351 18
Posttest
Control Female 31.40 6.191 25 Male 64.83 3.908 24 Treatment Female 65.11 3.365 19 Male 31.39 5.782 18
Delayed posttest
Control Female 31.20 5.993 25
*Mean computes on a scale of 1=disagree very much to 5=agree very much Mean score could theoretically range from a low of 14 to a high of 70 Table 20: Factorial ANOVA with Repeated Measures Pretest, to Posttest and Delayed
Posttest of Attitude Scores by Group by Gender Source of variation SS Df MS F p(Sig) Pretest, posttest, delayed (factor1) 8055.50 2 4027.75 120.16 <.001 Factor1 by group (treatment & Control) 8599.08 2 4299.54 128.27 <.001 Factor1 by gender 15.623 2 7.812 .233 .792 Factor1 by group by gender 6.787 2 3.393 .101 .904 Error(factor1) 5497.11 164 33.519 Group 33004.88 1 33004.88 315.04 <.001 Gender 14.729 1 14.729 .141 .709 Group by gender 1.840 1 1.840 .018 .895 Error 8590.57 82 104.763

71
Grade level: The descriptive statistics for the pretest, posttest and delayed posttest
scores for attitude by grade level indicated that sixth graders had the highest increase in
attitude scores with an increase of 1.25 points (pre vs post). Fifth graders started with low
scores but scored high at posttest and delayed posttest in the treatment group (Table 21).
Factorial ANOVA with repeated measures for attitude pretest, posttest and
delayed posttest by grade level indicated that all three grade levels in the treatment group
significantly increased their attitude scores from pretest to posttest and delayed posttest.
However, there was no significant difference between attitude scores of grade 5, grade 6
and grade 7-8 youth in both the treatment and control group (Table 22).

72
Table 21: Descriptive Statistics of Attitude Scores Pretest, Posttest and Delayed Posttest by Group by Grade Level
Group Grade Mean* SD N 5 36.62 13.891 21 6 43.10 12.991 10
Treatment
7-8 38.42 15.120 12 5 33.80 7.497 5 6 30.44 7.127 16
Pretest
Control
7-8 32.36 5.104 22 5 60.29 3.621 21 6 60.60 4.142 10
Treatment
7-8 59.17 5.458 12 5 33.40 7.057 5 6 30.62 7.580 16
Posttest
Control
7-8 32.23 4.947 22 5 65.90 3.129 21 6 63.90 4.701 10
Treatment
7-8 64.17 3.353 12 5 33.20 6.979 5 6 30.44 7.127 16
Delayed posttest
Control
7-8 31.45 4.595 22 *Mean computed on a scale of 1=disagree very much to 5=agree very much Mean score could theoretically range from a low of 14 to a high of 70 Table 22: Factorial ANOVA with Repeated Measures Pretest, to Posttest and Delayed
Posttest of Attitude Scores by Grade Level Source of variation SS Df MS F p(Sig) Pretest, posttest, delayed (factor1) 5862.38 2 2931.19 89.326 <.001 Factor1 by group (treatment & control) 6238.93 2 3119.46 95.064 <.001 Factor1 by grade 82.210 4 20.553 .626 .644 Factor1 by group by Grade 119.99 4 29.999 .914 .457 Error(factor1) 5250.32 160 32.814 Group 25795.03 1 25795.05 245.26 <.001 Grade 26.363 2 13.181 .125 .882 Group by grade 188.64 2 94.319 .897 .412 Error 8414.01 80 105.18

73
Age: The descriptive statistics for pretest, posttest and delayed posttest for age
indicated that all youth increased their attitude scores from pretest to posttest and delayed
posttest. However, the 10 year olds started with lower scores but scored high at posttest
and delayed posttest in the treatment group (Table 23).
Results from factorial ANOVA with repeated measures for pretest, posttest and
delayed posttest by age indicated that all age groups significantly increased their attitude
scores from pretest to posttest to delayed posttest. However, there was no significant
difference (p>.05) between attitude scores of 10 year old, 11 year old and 12-14 year old
youth in both the treatment and control groups (Table 24).
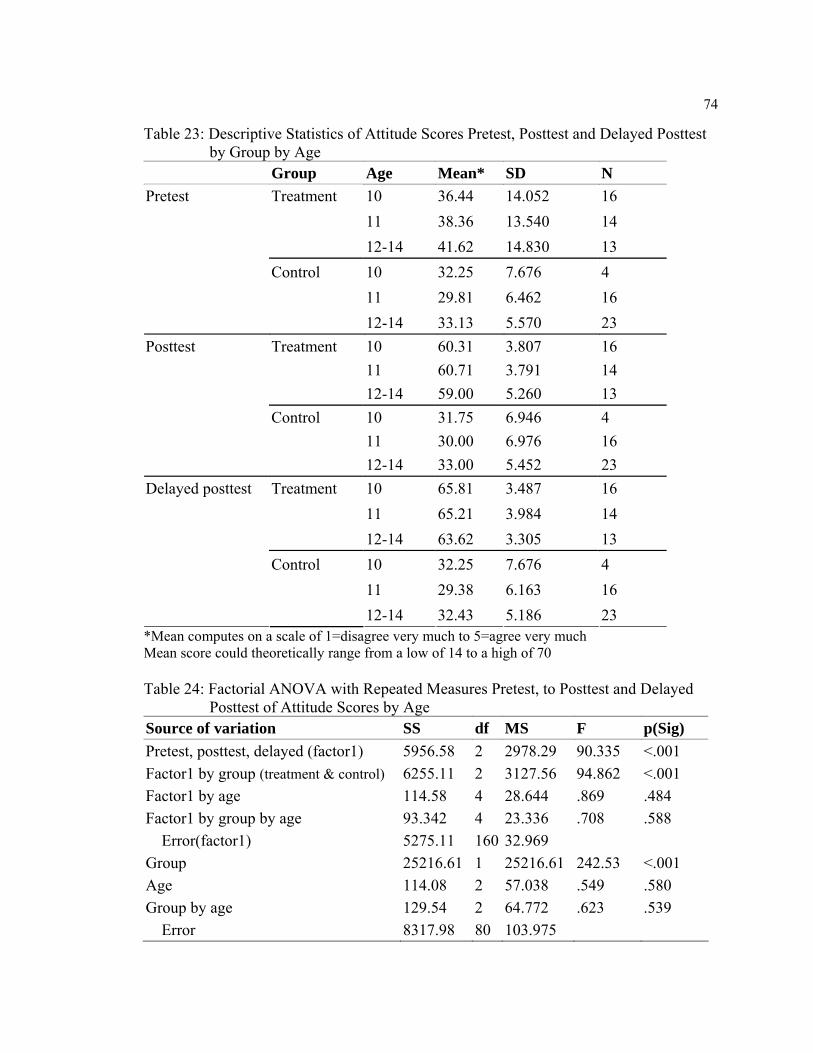
74
Table 23: Descriptive Statistics of Attitude Scores Pretest, Posttest and Delayed Posttest by Group by Age
Group Age Mean* SD N 10 36.44 14.052 16 11 38.36 13.540 14
Treatment
12-14 41.62 14.830 13 10 32.25 7.676 4 11 29.81 6.462 16
Pretest
Control
12-14 33.13 5.570 23 10 60.31 3.807 16 11 60.71 3.791 14
Treatment
12-14 59.00 5.260 13 10 31.75 6.946 4 11 30.00 6.976 16
Posttest
Control
12-14 33.00 5.452 23 10 65.81 3.487 16 11 65.21 3.984 14
Treatment
12-14 63.62 3.305 13 10 32.25 7.676 4 11 29.38 6.163 16
Delayed posttest
Control
12-14 32.43 5.186 23 *Mean computes on a scale of 1=disagree very much to 5=agree very much Mean score could theoretically range from a low of 14 to a high of 70 Table 24: Factorial ANOVA with Repeated Measures Pretest, to Posttest and Delayed
Posttest of Attitude Scores by Age Source of variation SS df MS F p(Sig) Pretest, posttest, delayed (factor1) 5956.58 2 2978.29 90.335 <.001 Factor1 by group (treatment & control) 6255.11 2 3127.56 94.862 <.001 Factor1 by age 114.58 4 28.644 .869 .484 Factor1 by group by age 93.342 4 23.336 .708 .588 Error(factor1) 5275.11 160 32.969 Group 25216.61 1 25216.61 242.53 <.001 Age 114.08 2 57.038 .549 .580 Group by age 129.54 2 64.772 .623 .539 Error 8317.98 80 103.975

75
Nutrition Behavior by Demographic Characteristics
Additional comparisons were performed for nutrition behavior using factorial
ANOVA with repeated measures to determine if there were significant differences
between scores when youth were categorized by gender, grade level, and age.
Gender: For the treatment group, female youth started with higher scores
compared to males at pretest and posttest but had almost similar scores at delayed posttest
(Table 25). While both male and female youth increased their nutrition behavior scores
from pretest to posttest and to delayed posttest, there was no significant difference
(p>.05) between nutrition behavior scores of male and females in both the treatment and
control groups (Table 26).
Table 25: Descriptive Statistics of Nutrition Behavior Scores Pretest, Posttest and Delayed Posttest by Group by Gender
Group Gender Mean* SD N Male 13.12 1.918 24 Treatment Female 13.74 1.881 19 Male 11.72 1.638 18
Pretest
Control Female 12.20 1.826 25 Male 17.08 1.530 24 Treatment Female 17.63 2.033 19 Male 11.83 1.505 18
Posttest
Control Female 12.32 1.909 25 Male 19.54 1.641 24 Treatment Female 19.32 1.529 19 Male 11.89 1.451 18
Delayed posttest
Control Female 12.32 1.909 25
*Mean computes on a scale of 1=never to 4=several times a day Mean score could theoretically range from a low of 7 to a high of 28

76
Table 26: Factorial ANOVA with Repeated Measures Pretest, to Posttest and Delayed Posttest of Nutrition Behaviors by Group by Gender
Source of variation SS Df MS F p(Sig) Pretest, posttest, delayed (factor1) 410.55 2 205.27 149.89 <.001 Factor1 by group (treatment & control) 372.04 2 186.02 135.83 <.001 Factor1 by gender 2.587 2 1.294 .945 .391 Factor1 by group by Gender 2.014 2 1.007 .735 .481 Error(factor1) 224.59 164 1.369 Group 1391.26 1 1391.26 214.93 <.001 Gender 9.530 1 9.530 1.472 .228 Group by gender .374 1 .374 .058 .811 Error 530.80 82 6.473
Grade level: The descriptive statistics for the pretest, posttest and delayed posttest
scores for nutrition behavior by grade level indicated all grades increased their scores in
nutrition behavior in the treatment group (Table 27). Factorial ANOVA with repeated
measures pretest, posttest and delayed posttest indicated no significant differences
between nutrition behavior scores of grade 5, grade 6 and grade 7-8 students in both the
treatment and control groups (Table 28).

77
Table 27: Descriptive Statistics of Nutrition Behavior Scores Pretest, Posttest and Delayed Posttest by Group by Grade Level
Group Grade Mean* SD N 5 13.38 1.687 21 6 13.30 2.111 10
Treatment
7-8 13.50 2.236 12 5 11.80 1.789 5 6 12.00 2.221 16
Pretest
Control
7-8 12.05 1.397 22 5 17.19 1.861 21 6 18.00 1.633 10
Treatment
7-8 17.00 1.706 12 5 12.00 1.581 5 6 12.13 2.094 16
Posttest
Control
7-8 12.14 1.583 22 5 19.43 1.777 21 6 19.10 .876 10
Treatment
7-8 19.75 1.712 12 5 12.00 1.581 5 6 12.13 2.094 16
Delayed posttest
Control
7-8 12.18 1.532 22 *Mean computes on a scale of 1=never to 4=several times a day Mean score could theoretically range from a low of 7 to a high of 28 Table 28: Factorial ANOVA with Repeated Measures Pretest, to Posttest and Delayed
Posttest Nutrition Behavior by Group by Grade Level Source of variation SS Df MS F p(Sig) Pretest, posttest, delayed (factor1) 331.81 2 165.91 120.19 <.001 Factor1 by group (treatment & control) 298.11 2 149.06 107.99 <.001 Factor1 by grade 5.336 4 1.334 .966 .428 Factor1 by group by Grade 4.893 4 1.223 .886 .474 Error(factor1) 220.86 160 1.380 Group 1103.41 1 1103.41 163.52 <.001 Grade .720 2 .360 .053 .948 Group by grade .120 2 .060 .009 .991 Error 539.85 80 6.748

78
Age: The descriptive statistics for pretest, posttest and delayed posttest scores for
age indicated that all youth increased from pretest to posttest and delayed posttest in the
treatment group. However, the 10 years old in the treatment group had the highest
increase in behavior scores of all ages, followed by 11 year olds (Table 29). Factorial
ANOVA with repeated measures indicated no significant differences (p>.05) between
nutrition behavior scores of 10 year old, 11 year old and 12-14 year old youth in both the
treatment and control group (Table 30).
Table 29: Descriptive Statistics of Nutrition Behavior Scores Pretest, Posttest and Delayed Posttest by Group by Age
Group Age Mean SD N 10 13.50 1.414 16 11 13.50 2.594 14
Treatment
12-14 13.15 1.676 13 10 11.25 1.500 4 11 11.94 2.175 16
Pretest
Control
12-14 12.17 1.466 23 10 17.13 1.996 16 11 17.79 1.718 14
Treatment
12-14 17.08 1.553 13 10 11.50 1.291 4 11 12.06 2.048 16
Posttest
Control
12-14 12.26 1.630 23 10 19.69 1.778 16 11 19.07 1.207 14
Treatment
12-14 19.54 1.713 13 10 11.50 1.291 4 11 12.06 2.048 16
Delayed posttest
Control
12-14 12.30 1.579 23 *Mean computes on a scale of 1=never to 4=several times a day Mean score could theoretically range from a low of 7 to a high of 28

79
Table 30: Factorial ANOVA with Repeated Measures Pretest, to Posttest and Delayed Posttest of Nutrition Behavior by Age
Source of variation SS Df MS F p(Sig) Pretest, posttest, delayed (factor1) 317.16 2 158.58 114.48 <.001 Factor1 by group (treatment & control) 282.09 2 141.04 101.82 <.001 Factor1 by age 3.573 4 .893 .645 .631 Factor1 by group by age 3.423 4 .856 .618 .650 Error(factor1) 221.63 160 1.385 Group 1107.01 1 1107.01 166.35 <.001 Age 3.225 2 1.612 .242 .785 group by age 7.348 2 3.674 .552 .578 Error 532.36 80 6.655
Overall, the above findings support the hypothesis that there was no significant
difference in nutrition knowledge, nutrition attitudes, and nutrition behaviors by
demographic characteristics (gender, grade level and age) of youth in both the treatment
and control groups. Significant difference was only found between the treatment and
control groups.

80
Research Question/Hypothesis Five:
Relationship between Nutrition Knowledge, Attitudes and Behaviors
Correlation analysis was used to examine the relationship between nutrition
knowledge at pretest, posttest, delayed posttest, and nutrition attitudes at pretest, posttest
and delayed posttest, and nutrition behaviors at pretest, posttest, and delayed posttest
respectively.
Results indicated a non-significant correlation for knowledge and attitude pretests,
and attitude and behavior pretest scores; non- significant correlation for knowledge,
attitude, and behavior posttest scores; a negative correlation for knowledge, attitude, and
behavior delayed posttest scores (Table 31). Thus, the hypothesis that there would be no
relationship between nutrition knowledge, nutrition attitudes, and nutrition behavior of
youth who participated in the intervention was supported. However, there was correlation
(r=.253, p<.05) between knowledge and behavior pretests scores, and correlation (r=
.302, p<.05) between attitude posttest and behavior posttest scores.
Table 31: Correlation between Nutrition Knowledge, and Attitude and Behavior for Pretest, Posttest and Delayed Posttest Respectively
Attitude Pretest
Behavior Pretest
Attitude posttest
Behavior posttest
Delayed attitude
Delayed behavior
Knowledge pretest Attitude pretest
Knowledge posttest Attitude posttest Knowledge delayed Attitude delayed
.063
.253*
.145
.026
.152 .302*
-.179
.075 -.021
*correlation significant at 0.05

Chapter 5
SUMMARY, DISCUSSION, CONCLUSIONS, AND RECOMMENDATIONS
This chapter presents a summary of the study’s procedures, discussion of the
findings, conclusions, and recommendations for future research, practice and suggestions
for program improvement.
Summary
The purpose of this study was to evaluate whether selected nutrition education
lessons from the Up for the Challenge: Health, Fitness, and Nutrition curriculum based
upon an experiential learning model contribute to change in knowledge, attitudes and
behaviors about nutrition with low-income youth in afterschool programs. The following
five research questions (RQ)/hypotheses (HA/HO) guided this investigation.
RQ1: What is the effect of nutrition education intervention (selected lessons from the
Up for the Challenge curriculum) on general nutrition and physical activity
knowledge?
HA1: Youth receiving nutrition education intervention will score significantly higher on
general nutrition knowledge compared to youth who do not receive intervention
(control group).
RQ2: What is the effect of nutrition education intervention on the attitudes about
nutrition, eating fruits and vegetables, eating healthy, and making healthy food
choice?

82
HA2: Youth receiving nutrition education intervention will score significantly higher on
attitudes compared to youth who do not receive intervention (control group).
RQ3: What is the effect of nutrition education intervention on nutrition and physical
activity behaviors?
HA3: Youth receiving nutrition education intervention will score significantly higher on
nutrition behaviors compared to youth who do not receive intervention (control
group).
RQ4: Is there a difference in nutrition knowledge, nutrition attitudes, and nutrition
behaviors when examined by participants’ demographic characteristics such as
gender, age, grade level, and ethnicity?
HO4: There will be no difference in nutrition knowledge, nutrition attitudes and
nutrition behaviors when examined by demographic characteristics of youth.
RQ5: Are there relationships between nutrition knowledge, attitudes and nutrition
behaviors?
HO5: There will be no relationships between nutrition knowledge, nutrition attitudes,
and nutrition behaviors of youth.
A quasi-experimental design consisting of pretest-posttest comparison control
group was used. To evaluate the selected nutrition lessons from the Up for the Challenge:
Health, Fitness, and Nutrition curriculum, three measurements were taken at pretest (time
1), posttest (time 2), and delayed posttest (time 3). Participants included youth in two
afterschool programs registered with Expanded Food Nutrition Education program

83
(EFNEP) of Penn State Nutrition Links. A total of 86 youth participated in the study
(treatment=43, and control=43).
A four-part questionnaire was developed to collect data. Part one contained 14
questions pertaining to general nutrition knowledge and physical activity. Questions were
measured on multiple choice and yes or no format. Part two contained 14 statements
about attitudes towards nutrition and fruits and vegetable consumption, and eating
healthy and making healthful food choices. Statements were measured on a five-point
Likert-type scale that ranged from 1 = disagree very much to 5 = agree very much. Part
three contained 11 statements on nutrition and physical activity behavior measured on a
four-point scale that ranged from 1 = never to 4= several times a day. Part four contained
demographic questions such as gender, age, grade level, and ethnicity.
The questionnaire was reviewed by a panel of experts consisting of nutrition
specialists and advisers, and faculty members in the department of Agricultural and
Extension Education at The Pennsylvania State University. The instrument was pilot
tested with students not included in the study. The reliability estimates were in acceptable
range; nutrition knowledge questions (pilot test, α= .68; posttest, α=.69), physical activity
knowledge questions (pilot test, α= .28; posttest, α=.29), attitude statements (pilot test,
α=.92; posttest, α=.92), nutrition behavior (pilot test, α=.49; posttest, α=.51), and physical
activity behavior (pilot test, α=.55; posttest, α=.55).
Data collection was completed in three stages. Pretest data on knowledge,
attitudes and behaviors was collected first for both the treatment and control groups at the
same time. Two-three hours hands-on nutrition education lessons were taught to youth in
the treatment group every week over a 4-week period, after which posttest data was

84
collected, followed by delayed posttest/follow-up for both groups after two weeks of
posttest data collection. The control group did not receive any nutrition lessons.
Data were entered and analyzed using a Statistical Package for Social Sciences
(SPSS). Descriptive and inferential statistics were used to analyze data. Descriptive
statistics included frequency distribution, percentages, means and standard deviations.
Inferential statistics included repeated measures ANCOVA, factorial ANOVA with
repeated measures for pretest, posttest, and delayed posttest, and Pearson correlation, r.
Discussion
Overall, youth who received nutrition education lessons from the Up for the
Challenge Healthy Fitness, and Nutrition curriculum significantly improved their
nutrition and physical activity knowledge, attitudes, and nutrition and physical activity
behaviors compared to the youth who did not receive the intervention (control group).
It is important to note that physical activity knowledge and physical activity
behavior scores for the treatment group at pretest were higher than the pretest scores for
the control group. This finding indicates that youth in the treatment group were 1) either
already knowledgeable about physical activity from their families, 2) previously exposed
to other physical activity related activities, and/or 3) the questions were too easy and not
challenging enough for the students. The research study did not consider other factors in
afterschool programs or family settings known to influence the high scores given the fact
that the two afterschool program sites were a little bit different geographically, and the
researcher had no control of selecting study sites.

85
Nutrition and Physical Activity Knowledge
The nutrition knowledge scores for youth participating in nutrition education
lessons from the Up for the Challenge curriculum significantly (p<.001) increased from
pretest to posttest and delayed posttest compared to youth in the control group. Previous
research has shown an increase in knowledge after nutrition intervention among children
in afterschool programs (Kelder, Hoelscher, Barrosa, Walker, Cribbs, & Hu, 2005;
Kelder, Michell, McKenzie, Derby, Strikmiller, Luepker, et al. 2003). Also, in a meta-
analysis of nutrition education studies, Lytle (1995) found that 71% of studies reporting
on knowledge outcomes showed significant gains in knowledge for the treatment group
as compared to the control group.
Physical activity knowledge scores also increased from pretest to posttest and
delayed posttest for youth participating in the nutrition education lessons.
Additional comparisons revealed that both male and female youth participating in
the nutrition education lessons from the Up for the Challenge curriculum (treatment
group) increased their nutrition knowledge scores. However, no significant difference
between male and female youth on nutrition knowledge was found regardless of the
group (treatment or control).
All youth in three grade levels (fifth, sixth, seventh-eighth) increased their
nutrition knowledge scores from pretest to posttest and delayed posttest. However, no
significant difference between grade levels on nutrition knowledge was found regardless
of the group (treatment or control). However, fifth graders had the highest increase in
nutrition knowledge scores compared to sixth, and seventh -eighth graders in the

86
treatment group. This suggests that just being in a higher grade does not necessarily
translate into scoring better or higher on nutrition knowledge.
All age groups (10 year, 11 year, and 12-14 year olds) increased nutrition
knowledge scores from pretest to posttest to delayed posttest. However, no significant
difference between age groups on nutrition knowledge was found regardless of the group
(treatment or control). The 10 year olds had the highest increase in scores compared to
other age groups.
It is important to note that fifth graders and 10 year olds had the highest increase
in nutrition knowledge scores (see Table 32 for a brief summary). This suggests that the
nutrition education lessons from the Up for the Challenge curriculum had more of an
effect on the younger youth, meaning the nutrition activities may be better geared toward
younger children in lower grade levels for knowledge acquisition. These findings concur
with previous research conducted by Carter (2002) and Baranowski et al. (1997) stating
that nutrition strategies should be aimed more at younger children and not youth entering
adolescence.
Nutrition Attitudes
The attitude towards nutrition and eating fruits and vegetables, eating healthy, and
making healthy food choices for youth participating in nutrition education lessons from
the Up for the Challenge curriculum significantly (p<.001) increased from pretest to
posttest and to delayed posttest when compared to the control group.
A closer examination of gender, grade level, and age revealed that there was no
significant differences between scores of male and female, grade levels (5, 6, 7-8

87
graders), and age groups (10, 11, 12-14), on attitudes towards nutrition, fruits and
vegetables, eating healthy and making healthy food choices.
Nutrition and Physical Activity Behaviors
Nutrition behavior scores of youth participating in nutrition education lessons
from the Up for the Challenge curriculum increased significantly (p <.001) from pretest
to posttest and delayed posttest compared to the control group. The findings achieved in
this study concur with findings of Powers, Struempler, Guarino, & Parmer (2005), who
found that children participating in nutrition intervention curriculum (dairy consumption,
fruits and vegetable consumption, food guide pyramid knowledge) exhibited significantly
greater improvements in overall nutrition behavior than the children in the control group.
The findings from physical activity behavior assessment also showed that youth
participating in nutrition education lessons from the Up for the Challenge curriculum
increased scores from pretest to posttest and delayed posttest.
Additional comparison of nutrition behavior scores by gender, grade levels, and
age group increased pretest to posttest and delayed posttest. However, no significant
difference were found between scores of male and female, grade levels (5, 6, 7-8) and age
(10, 11, 12-14) on nutrition behavior in both treatment and control groups.
However, 10 year olds had the greatest increase in nutrition behavior scores
compared to 11 year old and 12-14 year old. Also, fifth graders had the greatest increase
in behavior compared to sixth, and seventh-eighth graders (see Table 32 for a brief
summary). This suggests that just being older and in a higher grade does not necessarily
translate into better eating behavior. The possible reason for these results could be

88
because the majority of children in grades six and seven-eight are entering
puberty/adolescents and as children get older negative behaviors about certain foods
develop (Santrock, 1993).
Table 32: Summary of Increases in Nutrition Knowledge, Attitude, Nutrition behavior by Demographics for the Treatment (T) and Control (C) Groups
Demographics Nutrition Knowledge
Attitude Nutrition Behavior
T C T C T C Gender Male Female
- - - -
- - - -
- - - -
Age 10 11 12-14
+ - - - - -
- - - - - -
+ - - - -
Grade level 5 6 7-8
+ - - - - -
- - - - - -
+ - - - - -
+ = highest increase in knowledge, attitude, behavior scores - = lowest increase in scores
Relationships
Pearson correlation coefficient showed no significant relationship between
nutrition knowledge, attitudes, and behavior scores of youth participating in the selected
nutrition education lessons from the Up for the Challenge curriculum. The correlations
were weak. Other studies have found a weak or non-significant correlation between
nutrition knowledge and behavior (Powers, Struempler, Guarino, & Parmer, 2005; and
Pirounznia, 2001). Worsley (2002) points out several reasons that might contribute to low
or weak correlation: 1) the small number of subjects which do not have the statistical
power to detect any relationship, 2) different age groups respond differently to different

89
types of questions, hence questions/responses cannot be correlated, 3) type of statistical
tests performed, and 4) other factors that the researchers have no control may affect the
relationship.
Conclusions
The findings from this study should be viewed with caution because of threats to
the validity of the study and confounding/extraneous variables as previously discussed.
Despite all the limitations described, overall, there was a program effect on the treatment
group. The significant improvement for nutrition and physical activity scores, attitude
scores, and nutrition and physical activity behavior scores indicated that the nutrition
education lessons from the Up for the Challenge Healthy Fitness, and Nutrition
curriculum can be used to change/improve youths’ knowledge, attitudes and behaviors
regarding nutrition and physical activity. Youth who were in the control group did not
receive any lessons, and therefore, did not improve or change knowledge, attitudes or
behaviors.
These findings also imply that irrespective of time taken to implement the
nutrition education lessons, youth were able to retain nutrition and physical activity
information. This evidence is indicated by the significant increases in scores from pretest
to posttest (four weeks) and a slight increase of scores from posttest to delayed posttest
after two weeks of posttest data collection.

90
However, the curriculum did not have the same effect on all age groups and grade
levels. The insignificant results of nutrition knowledge, attitude and nutrition behavior
scores when compared to demographic variables may be due to the small sample size.
The non-significant relationship between nutrition knowledge, attitudes and
behaviors suggest that, for young children, nutritional knowledge alone does not
necessarily influence their nutrition behavior, but does provide them with the ability to
know how to make healthy food choices at times when they are or not given an
opportunity to make decisions on what to eat (Ruzita et al. 2000).
The results from this study cannot be generalized as a result of data collection for
a relatively small sample in two afterschool programs. Also the students’ demographic
characteristics are not diverse but relatively homogenous within each group, for example
ethnicity.
The findings from this study demonstrates that implementing curriculum-based
nutrition education lessons using hands-on, experiential learning approach for youth in
afterschool program can have positive effects on their nutrition knowledge, attitudes, and
nutrition behaviors. These findings are consistent with Heneman, Junge, Zidenberg-
Cherr, (2008) who found improvement of nutrition knowledge and behaviors of
elementary students using nutrition lessons from the “Reading Across My Pyramid
(RAMP)” curriculum that was based on experiential learning model.

91
Recommendations for Future Research
The following recommendations for future research are suggested.
Further testing of the nutrition education lessons from the Up for the Challenge
curriculum with a diverse group of youth, representing greater diversity is very important
given the fact that ethnicity was ruled out of the analysis as all youth were white. It is not
known how the effect of ethnicity would have altered the results.
Collection of data from multiple afterschool programs would yield a large sample
for analysis which would be easier for generalization of results, but also detect the
relationships, and differences in nutrition knowledge scores, attitudes scores, and
nutrition behaviors scores across demographic characteristics.
Differential selection was a major threat in this study. Selection of study sites
(control and treatment groups) that are similar at the beginning of the experiment should
be considered given the fact that the scores for both groups were significantly different at
the beginning of the study.
The high scores at pretest for the treatment group (physical activity) is an
indication that the evaluation questions were not challenging enough for youth and needs
to be revised. Revisions in terms of length and difficulty are suggested.
Finally, further research should include open-ended or qualitative evaluation
questions in addition to closed-ended/quantitative questions to provide opportunity for
participants to express themselves fully on particular nutrition and physical activity
issues.

92
Recommendations for Practice and Suggestions for Program Improvement
Given the fact that fifth graders and 10 year olds had the highest increase in
knowledge and behavior scores compared to sixth, and seventh through eighth graders, it
is recommended that youth should be taught nutrition lessons separately according to
their grade levels and/or age. This would help nutrition educators reinforce more lessons
early on to young students.
Another recommendation when implementing and evaluating nutrition education
programs is to involve youths’ parents. Parents should be involved to provide information
on the eating habits of their children. This would help nutrition educators find out what
information from lessons children are sharing with their parents. Perhaps, further study
involving parents should be undertaken.
Parents should be given fliers that include information on nutrition lessons which
would inform them what their child is learning and reinforce the information at home for
good nutrition practices. Such efforts and sharing of information will ensure
communication among parents and youth.
Additional attention should be placed on increasing the number of nutrition
educators to deliver lessons given the large number of youth turnout in afterschool
programs. One nutrition educator faces a challenge of teaching the nutrition lessons and
engaging all youth to participate in each and every scheduled activity during the
implementation process.

93
References
Achterberg, C. (1988). Factors that influence learner readiness. Journal of the American
Dietary Association, 88, 1426–1428. American Academy of Pediatrics Committee on Nutrition. (2003). Prevention of pediatric
overweight and obesity. Pediatrics, 112(2), 424-430. American School Health Association (1997). Guidelines for school health programs to
promote lifelong healthy eating. Journal of School Health, 67(1), 9-27. Ary, D., Jacobs, L.C., & Razavieh, A . (2002). Introduction to research in education, (6th
ed.) Fort Worth, TX: Harcourt Brace College Publishers. Backman, D.R., Haddad, E.H., Lee, J.W., Johnston, P.K., & Hodgkin, G.E. (2002)
Psychosocial predictors of healthful dietary behavior in adolescents. Journal of Nutrition Education and Behavior, 34(4):184-92.
Bandura, A. (1977) Social Learning Theory. Prentice-Hall, Englewood
Cliffs, NJ. Baranowski, T., Davis, M., Resnicow, K., Baranowski, J., Doyle, C., Lin, L.S.,
Smith, M., & Wang, D.T. (2000). Gimme 5 fruit, juice, and vegetable for fun and health: outcome evaluation. Health Education and Behavior, 27 (1): 96-111(116).
Baranowski, T., Smith, M., Hearn, L.M., Lin, L. Baranowski, J., Doyle, C., Reniscow, K.
& Wang, D. (1997). Patterns in children’s fruits and vegetable consumption by meal and day of the week. Journal of the American College of Nutrition, 16: 216-223.
Bazzano, L., J. He, L. Ogden, C. Loria, S. Vupputuri, L. Myers, and P. Whelton. (2002).
Fruit and vegetable intake and risk of cardiovascular disease in US adults: The first National Health and Nutrition Examination Survey Epidemiologic Follow-up Study. American Journal of Clinical Nutrition. 76: 93-99.
Becker, M. H., Maiman, L. A., Kirscht, J. P. & Drachman, R. H. (1977). The health
belief model and prediction of dietary compliance: A field experiment. J. Hlth. Soc. Behav. 18: 348-366.
Boud, D., Keogh, R., & Walker, D. (Eds.). (1985). Reflection: Turning experience into
learning. New York: Nicholls Publishing.

94
Blumenthal, S.J., Hendi, J., & Marsillo, L. (2002). A public health approach to decreasing obesity. http://www.amaassn.org/scipubs/msjama/articles/vol_288/no_17/jms1106023.htm
Boud, D., & Miller, N. (Eds.). (1996). Working with experience: Animating learning.
New York: Routlege. Boud, D., Cohen, R., & Wlaker, D., (1993). Introduction: Understanding learning from
experience. In Boud, D., Cohen, R., & Walker, D. (Eds.), Using experience for learning. (pp. 1-17). Buckingham, England: The Society for Research into Higher Education & Open University Press.
Brown, J.L. (2002). The consequences of hunger and food insecurity for children:
Evidence from recent scientific studies. Center on Hunger and Poverty, Heller School for Social Policy and Management, Brandeis University. pp. 1-12.
Burnard, P. (1991). Experiential learning in action. Brookfield, Vermont: Gower
Publishing. Calder, J., & McCollum, A. (1998). Open and flexible learning in vocational education
and training. London: Kogan Page. Campbell, D.T., & Stanley, J.C. (1966). Experimental and quasi-experimental designs for
research. Chicago, IL: Rand McNally and Campany. Capizzano, J., Tout, K. & Adams, G. (2000). Child care patterns of school-
age children with employed mothers. Washington, D.C.: The Urban Institute. Assessing the New Federalism Occasional, Paper 41.
Carter, R.C. (2002). The impact of public schools on childhood obesity. Journal of the
American Medical Association. 288: 2180. Celebuski, C., & Farris, E. (2000). Nutrition education in public elementary school
classrooms, k-5.Washington, DC: U.S. Government Printing Office. Center for Disease Control and Prevention, National Center for Chronic Disease
Prevention and Health Promotion. Healthy Youth! Health Topics Childhood Obesity. (n.d.). Retrieved October 20, 2007, from http://www.cdc.gov/healthyyouth/obesity/index.htm
Centers for Disease Control and Prevention, “Physical Activity Levels Among Children
aged 9-13 years: United States, 2002,” Morbidity and Mortality Weekly Report, 52: 785-788, 2003.

95
CDC. 1996. Summary of CDC’s guidelines for school health programs to promote lifelong healthy eating. Journal of Nutrition Education. 29:45-46.
Ciliska, D., Miles, E., O’Brien, M.A., Turl, C., Hale Tomasik, H., & Donovan, M.
(1999). Enhancing fruit and vegetable consumption in people four years of age and older. Hamilton, Ontario: Public Health Research Education and Development Program, Effective Public Health Project.
Contento, I. 1981. Children’s thinking about food and eating – a Piagetian-based study.
Journal of Nutrition Education. 13: S86-S90. Contento, I., Balch, G.I., Bronner, Y.L., Lytle, L.A., Maloney, S.K,, Olson, C.M.,
Swadener, S.S. (1995).The effectiveness of nutrition education and implications for nutrition education policy, programs, and research: A review of research. J Nutr Educ. 27:1-142.
Cullen, K.W., T. Baranowski, L. Rittenberry, C. Cosart, E. Owens, D. Herbert, and C.
deMoor. (2000). Socioenvironmental influences on children’s fruit, juice and vegetable consumption as reported by parents: Reliability and validity of measures. Public Health Nutrition. 3: 345-456.
Cullen, K.W., T. Baranowski, E. Owens, C. de Moor, L. Rittenberry, N. Olvera, and K.
Resnicow. (2002). Ethnic differences in social correlates of diet. Health Education Research, 17: 7-18.
Cullen, K.W., T. Baranowski, E. Owens, T. Marsh, L. Rittenberry, and C. de Moor.
(2003). Availability, accessibility, and preferences for fruit, 100% fruit juice, and vegetable influence children’s dietary behavior. Health Education & Behavior, 30: 615-626.
Cullen, K.W., T. Baranowski, L. Rittenberry, C. Cosart, D. Herbert, and C. de Moor.
(2001). Child-reported family and peer influences on fruit, juice and vegetable consumption: Reliability and validity measures. Health Education Research. 16: 187-200.
Day, B. (1994). Early childhood education: Developmental/experiential teaching and
learning. New York: Macmillan. Dewey, J. (1910). How we think. Boston: D.C. Heath. Dewey, J. (1916). Democracy and education: An introduction to the philosophy of
education. New York: The Free Press. Dewey, J. (1938). Experience and education. New York: The Macmillan Company.

96
Desmond, D., Grieshop, J., & Subramaniam, A. (2004). Revisiting garden-based learning in basic education.Paris, France: International Institute for Educational Planning.
Djousse, L., D. Arnett, H. Coon, M. Province, L. Moore, & C. Ellison. 2004. Fruit
and vegetable consumption and LDL cholesterol: The National Heart, Lung, and Blood Institute Family Heart Study. American Journal of Clinical Nutrition. 79: 213-217.
Domel, S.B., T. Baranowski, H. Davis, W. Thompson, S. Leonard, P. Riley, J.
Baranowski, B. Dudovitz, and M. Smyth. (1993). Development and evaluation of a school intervention to increase fruit and vegetable consumption among 4
th and
5th
grade students. Journal of Nutrition Education, 25: 345-349. Edwards, J.S.A. & Hartwell, H.H. (2002). F&V-attitudes and knowledge of Primary
school children. Journal of Human Nutrition and Dietetics, 15: 365- 374.
Eisner, E. (1994). Cognition and curriculum reconsidered (second ed.). New York:
Teachers College Press.
Epstein, L.H., Raynor, H.A., Beddome, M., Kilanowski, C.K., & Paluch, R. (2001). Increasing fruit and vegetable intake and decreasing fat and sugar intake in families at risk for childhood obesity. Obesity Research, 9 (3): 171-178.
Escobar, A. (1999). Factors influencing children's dietary practices: A review. Family
Economics and Nutrition Review, 12(3/4), 45-56. Farthering, M.C. (1991). “Current eating patterns of adolescents in the United States”,
Nutrition Today, 26 (2), 35-39. Fishbein, M. & Ajzen, I. (1975) Belief, Attitude, Intention, and Behavior: An Introduction
to Theory and Research. Addison-Wesley Publishing Co., Reading, MA Fitzwater, S.L., Weinsier, R.L., Wooldridge et al. (1991). Evaluation of long-term weight
Changes after a multidisciplinary weight control program. Journal of the American Dietetic Association, 91;171-178.
Fowler-Brown, A., & Kahwati, L.C. (2004). Prevention and treatment of overweight in
children and adolescents. American Family Physician, 69, 2591-2598. Fraenkel, J.R & Wallen, N.E (2003). How to design and evaluate research in education,
(5th ed.). New York: McGraw-Hill Publishing Co.

97
Gall, M. D., Borg, W. R., & Gall, J. P. (1996). Educational research: An introduction. White Plains, NY: Longman.
Hedley, A.A., Ogden, C.L., Johnson, C.L., Carroll, M.D., Curtin, L.R., & Flegal, K.M.
(2004). Prevalence of overweight and obesity among US children, adolescents, and adults, 1999-2002. Journal of the American Medical Association, 291(23), 2847-2850
Heneman,K., Junge, S.K., and Zidenberg-Cherr, S. (2008). Reading Across My Pyramid,
a nutrition and health education curriculum, increases the health behavior knowledge of lower elementary students. Journal of child nutrition and management, 32(1).
Hertzler, A.A., & DeBord, K. (1994). Preschoolers' developmentally appropriate food
and nutrition skills. Journal of Nutrition Education, 26, 166-167. Hopkins, R.L. (1994). Narrative schooling: Experiential learning and the transformation
of American education. New York: Teachers College Press. Kelder, S.H., Mitchell, P.D., McKenzie, T.L., Derby, C., Strikmiller, P.K., Luepker,
R.V., et al. (2003). Long-term implementation of the CATCH physical education program. Health Education & Behavior, 30(4): 463–75.
Kelder, S., Hoelscher, D.M., Barroso, C.S., Walker, J.L., Cribb, P., Hu, S. (2005). The
CATCH Kids Club: a pilot after-school study for improving elementary students’ nutrition and physical activity. Public Health Nutrition, 8(2):133-140.
Kirby, S.D., T. Baranowski, K.D. Reynolds, G. Taylor, and D. Brinkley. (1995).
Children’s fruit and vegetable intake: Socioeconomic, adult-child, regional, and urban-rural influences. Journal of Nutrition Education, 27: 261-271.
Kolbe L.J, Kann L, Brener ND. (2001). Overview and summary of findings: School
Health Policies and Programs Study 2000. Journal of School Health, 71(7): 253–9.
Kolb, David A. (1984). Experiential Learning: Experience as the Source of Learning and
Development. Prentice-Hall, Inc., Englewood Cliffs, N.J. Krebs-Smith, S.M., D.A. Cook, A.F. Subar, L. Cleveland, J. Friday, and L.L. Kahle.
(1996). Fruit and vegetable intakes of children and adolescents in the United States. Archives of Pediatrics and Adolescent Medicine. 150: 81-86.
Lauver, S. C. (2002). Assessing the benefits of an after-school program for urban youth:
An impact and process evaluation. Philadelphia: Author.

98
Lavetelli, C. (1973). Piaget's theory applied to an early childhood curriculum. Boston: American Science and Engineering, Inc.
Lin, B., & Morrison, R.M. 2002. Higher fruit consumption linked with lower body
mass index. Food Review, 25: 28-32. Liu, S., Manson, J., Lee, I., Cole, S., Hennekens, C., Willett, W., & Buring, J. (2000).
Fruit and vegetable intake and risk of cardiovascular disease: The Woman’s Health Study. American Journal of Clinical Nutrition, 72: 922-928.
Lytle, L. (1995). Nutrition education for school-aged children. Journal of Nutrition
Education, 27(6), 298-311. Mahoney, J.L., Lord, H., & Carryl, E. (2005a). An Ecological Analysis of After-School
Program Participation and the Development of Academic Performance and Motivational Attributes for Disadvantaged Children. Child Development, (6)4: 811-825.
Mahoney, J. L., Lord, H., & Carryl, E. (2005b). Afterschool program participation and
the development of child obesity and peer acceptance. Applied Developmental Science, 9(4), 202–215.
Maiman, L.A. & Becker, M.H (1974). The health belief model: Origins and correlates in
psychology theory. Health Education Monograph, 2: 336-353. McGinnis, J.M., Gootman, J.A., & Kraak, V.I. (Eds.). (2006). Food marketing to children
and youth: Threat or opportunity? Washington, DC: National Academics Press. Moran, R. (1999). Evaluation and treatment of childhood obesity. American Family
Physician, 59, 861-868 Morris, J. L., Koumjian, K. L., Briggs, M., & Zidenberg-Cherr, S. (2002). Nutrition to
grow on: A garden-enhanced nutrition education curriculum for upper-elementary schoolchildren. Journal of Nutrition Education and Behavior, 34, 175-176
Morton, J. F., & Guthrie, J.F. (1999). Diet related knowledge, attitudes, and practices of
low income households with children. The Journal of Early Education and Family Review. 6: 26-33.
Mobility and Mortality Weekly Report (MMWR). (1996). Guidelines for school health
programs to promote lifelong healthy eating. Centers for Disease Control and Prevention. 45: 1-41.

99
National Institute for Health Care Management. (2004). Obesity in young children: Impact and intervention. Washington, DC: National Institute for Health Care Management Foundation.
National Association for the Education of Young Children. (1997). Healthy eating from
the start: Nutrition education for young children. Retrieved November 15, 2007, from http://npin.org/library/1998/n00015/n00015.html
Ness, A., and J. Powles. (1997). Fruit and vegetables, and cardiovascular disease: A
review. International Journal of Epidemiology, 26: 1-13. Olshansky, S.J., Passaro, D.J., Hershow, R.C., Layden, J., Carnes, B.A., Brody, J.,
Hayflick, L., Butler, R.N., Allison, D.B., & Ludwig, D.S. (2005). A potential decline in life expectancy in the United States in the 21
st century. New England
Journal of Medicine, 352(11), 1138-1145. Parcel, G.S., Perry, C.L., Kelder, S.H., Elder, J.P., Mitchell, P.D., Lytle, L.A., et al.
(2003). School climate and the institutionalization of the CATCH program. Health Education & Behavior. 30(4): 489–502.
Pfeiffer, J. W., & Jones, J. E., Eds. (1985). Reference guide to handbooks and annuals
(revised). San Diego: University Associates Publishers. Piaget, J. (1972). To understand is to invent. New York: The Viking Press, Inc. Pilant, V.B. (2006). Position of the American Dietetic Association: local support for
nutrition integrity in schools. Journal of the American Dietetic Association, 106:122-133.
Pirouznia, M. (2001). The association between nutrition knowledge and eating behavior
in male and female adolescents in the United States. International Journal of Food Sciences and Nutrition, 52: 127-132.
Powers, A.R., Struempler, B.J., Guarino, A. & Pamer, S.M. (2005). Effect of nutrition
education program on the dietary behavior and nutrition knowledge of second-grade and third-grade students. Journal of School Health, 75(4): 129-133.
Portney, L. G., & Watkins, M. P. (2000). Foundations of Clinical Research: Application
to Practice (2nd Edition). Upper Saddle River, NJ: Prentice Hall Health. Raman, R.P. (2002). Obesity and health risks. Journal of the American College of
Nutrition. 21: 134S-139S. Read, M.H., Harveywebster,M. & Usinger-Lesquereux, J. (1988). Adolescent compliance
with dietary guidelines: health and education implications, Adolescence, 23: 91.
100
Reed, E.S. (1996). The necessity of experience. New Haven: Yale University Press. Reniscow, K., Baranowski, T., & M. Hearn, M. 1997. Social cognitive predictors of fruit
and vegetable intake in children. Health Psychology, 16: 272-276. Reynolds, K.D., Baranowski, T., Bishop, D., Gregson, J., & Nicklas, T. (2001). 5-A-Day
behavior change research in children and adolescents (NIH Publication 01-5019). Washington, DC: National Cancer Institute.
Rinderknecht, K., & Smith, C. (2004). Social Cognitive Theory in an After-School Nutrition
Intervention for Urban Native American. Youth. Journal of Nutrition Behavior, 36(6), 298-304.
Ritchie, L.D., Crawford, P.B., Hoelscher, D.M., & Sothern, M.S. (2006). Position of the
American Dietetic Association: individual-, family-, school-, and community-based interventions for pediatric overweight. Journal of the American Dietetic Association, 106:925-945.
Rogers, E. M. (1995). Diffusion of Innovations (4th ed.). Free Press, New York, NY. Rousseau, J.-J. (1762). Emile. London: Penguin. Ruzita, A.T., Fatimah, A., Young, K.L., Roslee, R., & Idris, M.N. (2000). Evaluation of a
video package as a nutrition education tool for overweight and obese primary school children, J. Mal. Society of Health, 18, 1-5
Saegert, J. & Young, E.A. (1983). Nutrition knowledge and health food consumption.
Nutrition and Behavior, 1: 103-113. Santrock, J.W. (1993). Adolescent: An introduction, Wm. C. Brown Company, Dubuque,
IA. Sapp, S.G., & Jensen, H.H. (1997): The reliability and validity of nutrition knowledge
and diet-health awareness tests developed from 1989 ± 1991 diet and knowledge surveys. Journal of Nutrition Education, 29, 63 ± 72.
Scannelli, J., & Simpson, K. (1996). Shaping the college experience Outside the
classroom. Rochester, NY: University of Rochester Press. Schon, D.A. (1983). The reflective practitioner: How professionals think in action. New
York: Basic Books.
Schaefer, S.A. (2001). Understanding Research: Top Ten Tips for Advocates and Policymakers. Washington, DC: National Association of Child Advocates.

101
Schwartz, N.E. (1985). Nutrition knowledge, attitudes, and practices of high school graduates. Journal of the American Dietetic Association, 66: 28-31.
Seidel, S., Aryeh, L., & Steinberg, A. (2002). Project-Based and Experiential Learning in
After-School Programming. Project Zero, Harvard Graduate School of Education, 124 Mount Auburn Street, 5th Floor, Cambridge, MA 02138.
Serrano, E., & Cox, R. (2005). Preventing childhood obesity ( Food Assistance Needs of
South’s Vulnerable Populations Food Assistance Policy Series No. 10). Starkville, MS: Mississippi State University, Southern Rural Development Center.
Shafer, L., Gillespie, A., Wilkins, J.L., & Borra, S. T. (1996). Nutrition education for the
public - position of ADA. Journal of the American Dietetic Association, 96, 1183-11 Nutrition education for the public - Position of ADA.87.
Shannon, B. and Chen, A. (1988). A three-year school based nutrition education study.
Journal of nutrition education, 20: 114-124. Sigel, I., & Cocking, R. (1977). Cognitive development from childhood to adolescence: A
constructivist perspective. New York: Holt, Rinehart and Winston. Singleton, J.C., Achterberg, C.L., & Shannon, B.M. (1992). Role of food and nutrition
in the health perceptions of young children. Journal of the American Dietetic Association, 92(1), 67-70.
St.-Onge, M., K.L. Keller, & S.B. Heymsfield. (2003). Changes in childhood food
consumption patterns: A cause for concern in light of increasing body weights. American Journal of Clinical Nutrition, 78: 1068-1073.
Story, M. & Resnick, M.D. (1986). Adolescent views on food and nutrition. Journal of
Nutrition Education, 18:188-192. Story, M. (1999). School-based approaches for preventing and treating obesity.
International Journal of Obesity, 23(Suppl. 2), S43-S51. Story, M., Sherwood, N. E., Himes, J. H., Davis, M., Jacobs, Jr., D. R., Cartwright, Y., et
al. (2003). An after-school obesity prevention program for African-American girls: The Minnesota GEMS Pilot Study [Supplement 1]. Ethnicity & Disease, 13(1), 54–64.
Strong, W.B., Malina, R.M., Blimkie, C.J.R., Daniels, S.R., Dishman, R.K., Gutin, B.,
Hergenroede, A. C., Aviva Must, A., Patricia A. Nixon, P.A., James M. Pivarnik, J.M., Thomas Rowland, J., Trost, S., & François Trudeau, F. (2005). Evidence based physical activity for school-age youth. The Journal of Pediatrics, 146(6): 732-737.

102
Subar, A., J., Heimendinger, B., Patterson, S., Krebs-Smith, E., Pivonka, & Kessler, R. (1995). Fruit and vegetable intake in the United States: The baseline survey of the five a day for better health program. American Journal of Health Promotion, 9: 352-360.
Traahms, C.M., & Pipes, P. (2000). Nutrition in childhood. In B. S. Worthington-
Roberts & S. R. Williams (Eds.), Nutrition throughout the life cycle (4th ed., pp. 226-261). Boston, MA: McGraw Hill.
Treiman, K., V. Freimuth, D. Damron, A. Lasswell, J. Anliker, S. Havas, P. Langenberg,
and R. Feldman. (1996). Attitudes and behaviors related to fruits and vegetables among low-income women in the WIC program. Journal of Nutrition Education, 28: 149-156.
United States Office of Health and Human Services. (2000). Healthy People 2010.
Washington DC: U.S. Government Printing Office. U.S. Department of Health and Human Services (USDHHS). (2001). The Surgeon
General's call to action to prevent and decrease overweight and obesity. Rockville, MD: U.S. Department of Health and Human Services, Public Health Service, Office of the Surgeon General.
U.S. Department of Agriculture, Center for Nutrition Policy and Promotion. (2005).
MyPyramid. Available at www.mypyramid.gov. 86.
Vandell, D.L., Shernoff, D.J., Pierce, K.M., Bolt, D.M., Fu, J. (2003, April). Experience and Time Use of Adolescence in After School Programs. Paper presented at the symposium, After-School Experiences During Adolescence: Programs and Activities that Support Development for the biennial meeting of the Society for Research in Child Development, Tampa Bay, FL.
Veugelers, P. J. & Fitzgerald, A.L. (2005). Prevalence of and risk factors for childhood
overweight and obesity. Canadian Medical Association Journal, 173(6), 607-613. Wang, Y. (2001). Cross national comparison of childhood obesity: the epidemic and the
relationship between obesity and socioeconomic status. International Journal of Epidemiology, 30: 1129-1136.
Warren, K., Sakofs, M., Hunt, J., & Jasper S. (Eds.). (1995). The theory of experiential
education. Dubuque, Iowa: Kendall/Hunt. Williams, D.R. and Collins, C. (1995). Us Socioeconomic and racial differences in
health: Patterns and explanations. Annual Review of Sociology. 21:349-386.
103
Wilson, A.L., & Burket, L. (1989). What makes learning meaningful? Paper presented at the Annual Meeting of the American Association for Adult and Continuing Education, Atlantic City, New Jersey.
Worsley, A. (2002). Nutrition knowledge and food consumption: can nutrition
knowledge change food behavior? Asian Pacific Journal of Nutrition 11 (Suppl): S579-S585.
Yin, Z., Gutin, B., Johnson, M., Hanes, J., Jr., Moore, J. B., Cavnar, M., et al. (2005). An
environmental approach to obesity prevention in children: Medical College of Georgia FitKid Project year 1 results. Obesity Research, 13, 2153–2161.

Appendix A
Penn State University Human Subjects Approval Letter

105
(814) 865-1775 Fax: (814) 863-8699 www.research.psu.edu/orp/
The Pennsylvania State University 201 Kern Graduate Building University Park, PA 16802-3301
Senior Vice President for ResearchOffice for Research Protections
Date: July 24, 2008
From: Andrea R. Seisler, IRB Administrator
To: Olive Monalisa K. Kemirembe
Subject: Results of Review of Proposal - Expedited (IRB #28899) Approval Expiration Date: July 10, 2009 “A Quantitative Evaluation of Nutrition Education Intervention with Low-Income Youth”
The Social Science Institutional Review Board (IRB) has reviewed and approved your proposal for use of human participants in your research. By accepting this decision, you agree to obtain prior approval from the IRB for any changes to your study. Unanticipated participant events that are encountered during the conduct of this research must be reported in a timely fashion. Enclosed is/are the dated, IRB-approved informed consent(s) to be used when recruiting participants for this research. Participants must receive a copy of the approved informed consent form to keep for their records. If signed consent is obtained, the principal investigator is expected to maintain the original signed consent forms along with the IRB research records for this research at least three (3) years after termination of IRB approval. For projects that involve protected health information (PHI) and are regulated by HIPAA, records are to be maintained for six (6) years. The principal investigator must determine and adhere to additional requirements established by the FDA and any outside sponsors. If this study will extend beyond the above noted approval expiration date, the principal investigator must submit a completed Continuing Progress Report to the Office for Research Protections (ORP) to request renewed approval for this research. On behalf of the IRB and the University, thank you for your efforts to conduct your research in compliance with the federal regulations that have been established for the protection of human participants. Please Note: The ORP encourages you to subscribe to the ORP listserv for protocol and research-related information. Send a blank email to: [email protected] ARS/ars Enclosure cc: Rama B. Radhakrishna

106
Appendix B
The Cen-Clear Child Services, Inc., Board of Directors Approval Letter

107
Cen-Clear Child Services Inc. 1633 Philipsburg Bigler Highway, Philipsburg, PA, 16866
September 12, 2008
Olive Monalisa Karekezi Kemirembe Graduate Research Assistant, Agricultural & Extension Education 12 Ferguson Building Penn State University University Park, PA 16802
Dear Ms. Kemirembe,
I am pleased to inform you that your request to complete your research project entitled “A Quantitative Evaluation of Nutrition Education Intervention with Low-Income Youth” has been presented and approved by the Cen-Clear Child Services, Inc. Board of Directors. This approval also requires that the results of the research are provided to Cen-Clear Child Services, Inc. The research will be conducted in collaboration with the Project SUCCESS Program. Your contact will be Cinde Schuckers. She can be reached at 814-342-5678 or [email protected]. I want to take this opportunity to wish you success with your research.
Sincerely,
Pauline Raab Assistant to the Executive Director Cen-Clear Child Services, Inc. CC: Cinde Schuckers

108
Appendix C
Recruitment Letter/ Parent Letter

109
Department of Agricultural and Extension Education College of Agricultural Sciences Olive Monalisa K. Kemirembe The Pennsylvania State University Phone: 814-404-8987 012 Ferguson Building Fax: 814-863-4753 University Park, PA 16802-4300 E-mail: [email protected]
Dear Parent: I am writing to request for your consent to include your child in my research study. I am a graduate student at The Pennsylvania State University. I am conducting a study on: A Quantitative Evaluation of Nutrition Education Intervention with Low-income Youth. Children in afterschool programs in Clearfield County, Pennsylvania will participate in this research study. The purpose of the study is to help children learn the importance of eating fruits and vegetables, the USDA dietary guidelines for children, and how to make healthy food choices. It is important to know and understand whether the nutrition information taught in after-school programs is having effect in changing children’s knowledge, attitude and behavior about their eating habits. During the study, I, the researcher and nutrition education advisers will assist in teaching your child the basic information about nutrition. Your child will complete three questionnaires: one before the study begins, the second, immediately after the completion of the nutrition education program, and a follow up, two weeks later. Attached to this letter is a consent form which gives your permission as a parent for your child to participate in this study. If you allow your child to participate in this study, please read and sign the attached consent form, a copy of which you will retain for your records. If your child is under age 13, a verbal assent will be read to him or her before the study begins by the researchers, and no need of signing the form. However, if he or she is age 13 and older, we request you to indicate your child agreement by letting him or her sign and date on the consent form. Thank you for consenting your child’s participation in the study. If you have any questions or concerns about the study, please contact Olive Monalisa K. Kemirembe at 814-404-8987, email: [email protected], or Rama Radhakrishna at 814-863-7069, email: [email protected], and Elise Gurgevich at 814-863-3447, email: [email protected]. Sincerely,
Olive Monalisa K. Kemirembe Graduate Research Assistant

110
Appendix D
Parent Consent Form

111
ORP USE ONLY: IRB# 28899 Doc.# 1 The Pennsylvania State University Office for Research Protections Approval Date: 07/24/2008 ARS Expiration Date: 07/10/2009 ARS Social Science Institutional Review Board
PARENTAL CONSENT FORM
Project title: A Quantitative Evaluation of Nutrition Education Intervention with Low-income Youth. Investigators: The following investigators are available for questions and concerns about this project from, Monday through Friday, 8:00am-5:00pm. Principal Investigator Project Advisor Project Collaborator Olive Monalisa Kemirembe Dr. Rama Radhakrishna Elise Gurgevich, MPH, PhD Graduate Research Assistant Associate Professor State Coordinator Ag & Extension Education Ag & Extension Education PSU Nutrition Links 12 Ferguson Building 212 Ferguson Building 208 Special Service Building Penn State University Penn State University Penn State University University Park, PA 16802 University Park, PA 16802 University Park, PA 16802 Phone: 814-404-8987 Phone: 814-863-7069 Phone: 814-863-3447 Email: [email protected] Email: [email protected] Email: [email protected] Purpose of the study: The purpose of this research is to determine the effect of nutrition education interventions on nutrition knowledge and attitudes of youth. It is believed that, improved nutrition knowledge and attitudes should lead to improved behavior. Project procedures: The project will take place in afterschool programs in Clearfield County, Pennsylvania. Before the project starts each child will fill out a pretest questionnaire to determine their knowledge, attitude and behavior about eating fruits and vegetables, making health food choice and physical activity. During the next 2-4 weeks, children will use the nutrition education curriculum to learn about the benefits of eating Fruits and Vegetables, making food choice, and physical activity after which a posttest questionnaire will be administered, and a follow up, two weeks later. Duration: It will take about 30 minutes to complete each questionnaire. Discomforts and Risks: There are no risks involved in participating in this research beyond those experienced in everyday life. Benefits: Your child will learn about the importance and benefit of eating fruits and vegetables, the USDA dietary guidelines for children, how to make healthy food choices and being physically active. At the end of the program, your child will have more information to make decisions about fruits and vegetables and physical activity.

112
Statement of Confidentiality: Participation in this research is confidential. Participant’s information in this study may be reviewed by the investigators. Results of the study may be published, but no names or identifying information will be included for publication. Participant identity will remain confidential. Penn State’s Office for Research Protection, the social Science Institutional Review Board, and the Office for Human Research Protections in the Department for Health and Human Services may review records related to this project. Right to Ask Questions: Please contact Olive Monalisa Kemirembe at (814) 404-8987 with questions, complaints or concerns about this research. You can also call this number it you feel this study has harmed you. Questions about your right as a research participant may be directed to Penn State University Office for Research Protections at (814) 865-1775. Voluntary Participation: Participation is strictly voluntarily, and a child will become part of the study only if both the child and the parent/guardian agree to the child’s participation. Your child can choose not to answer certain questions. Even if you choose not to participate in the study your child will still receive the nutrition education programming. Refusing to participate or withdrawing early from the study will involve no penalty or loss of benefits your child would be entitled to otherwise. You must be 18 years of age or older to take part in this research study. If you agree to take part in this research study and the information outlined above, please sign your name and indicate the date below. You will be given a copy of this consent form for your records. I give permission for my child, _____________________________, to participate in this research. ______________________________ ____________________________ Parent Signature Date __________________________ ____________________________ Assent: Age 13 and Older Child’s Signature Date ______________________________ ____________________________ Person Obtaining Consent Date

113
Appendix E
Child Assent Form

114
ORP USE ONLY: IRB# 28899 Doc.# 2 The Pennsylvania State University Office for Research Protections Approval Date: 07/24/2008 ARS Expiration Date: 07/10/2009 ARS Social Science Institutional Review Board
CHILD ASSENT FORM TO BE READ ALOUD TO 7TH GRADERS (under age of 13) Title of Project: A Quantitative Evaluation of Nutrition Education Intervention with Low-Income Youth. Principal Investigator: Olive Monalisa K. Kemirembe, Graduate Research Assistant, Agricultural & Extension Education 12 Ferguson Building Penn State University, University Park, PA 16802 Phone: 814-404-8987 Email: [email protected] Project Advisor: Dr. Rama Radhakrishna, Associate Professor, Agricultural & Extension Education 212 Ferguson Building Penn State University, University Park, PA 16802 Phone: 814-863-7069 Email: [email protected] Project Collaborator: Elise Gurgevich, CHES, MPH, PhD State Coordinator- Penn State Nutrition Links program 208 Special Service Building Penn State University, University Park, PA 16802 Phone: 814-863-3447 Email: [email protected] 1. What is project about? You are being asked to participate in a research study. Studies
like this one help researchers determine the effect of nutrition education intervention on nutrition knowledge, attitudes and eating behavior of youth. This form will tell you about the study to help you decide whether or not you want to participate. You can ask any questions you have before making up your mind. You can think about it and discuss it with your family or friends before you decide. It is okay to say “No” if you don’t want to be in the study. If you say “Yes” you can change your mind and quit being in the study at any time without getting in trouble. Your parent and/or guardian has already given permission for you to be in the study.

115
2. What is the research about? The research will help researchers understand the relationship between of nutrition education intervention and knowledge, attitude and eating behavior of youth.
4. How long will it take me? The research lasts about 30 minutes long filling out a survey (but could be shorter). If you feel uncomfortable answering any of the questions, you can stop at any time.
5. Voluntary Participation: Your participation in the regular nutrition education
programming will not be affected if you decide that you do not want to participate and no penalty will be involved. When we get the results back from the study, we will be happy to share them with you. It feels good to be involved in a project to help make your health better.
6. Confidentiality of Answers: All of the answers you write on the questionnaire will
remain confidential, meaning that it will be kept a secret between you and the researcher only. I, the researcher, will analyze the data, but never match your answers with your name or other information about you when I summarize, present, or publish the results of the research.
7. If you do not want to participate in the research, please tell your teacher so that she/he makes sure to remove your answers from the worksheets that the researcher will use for her project.
Thank you for considering your involvement in this research. ***Verbal assent: ______________________ has verbally indicated THAT HE OR SHE IS NOT INTERESTED in participating.
1. 2. 3. 4. 5. 6. 7. 8.
Witnessed by: Date _______________
Research Investigator Date

116
Appendix F
Penn State Nutrition Links Program- Letter of Support
117

118
Appendix G
Evaluation Tools

119
PART ONE
Nutrition and Physical Activity Knowledge
Pretest/Posttest/Delayed-post
For question 1-14, please CIRCLE the ONE CORRECT ANSWER for each question. 1. Fruits and Vegetables are part of a healthy diet.
(a) Yes (b) No 2. It is important to eat different kinds of vegetables every day.
(a) Yes (b) No 3. It is important to eat different kinds of fruit every day.
(a) Yes (b) No 4. Eating breakfast is an important part of a healthy lifestyle.
(a) Yes (b) No 5. Reading nutrition labels is important for making health food choice.
(a) Yes (b) No 6. Eating high-fiber cereal is very important for my health.
(a) Yes (b) No 7. Eating whole grain bread is good for my health.
(a) Yes (b) No 8. From which MyPyramid food group SHOULD YOU eat most of your foods?
a. Milk b. Meat & Beans c. Fruits d. Vegetables e. Grains f. All groups
9. Which of the following is good source of calcium with the lowest amount fat?
a. Whole milk b. 2% milk c. Skim milk

120
10. Which of the following is the healthiest snack choice that is lower in fat and added sugar?
a. Soda pop and chips b. Milkshake and fries c. Fruit juice and pretzels
11. Which of the following are some ways of eating more fruits and vegetables? a. Eat an apple for dessert b. Making a Banana smoothie c. Using carrot and celery sticks for dipping in your bean dip d. All of the above
12. Which of the following activity can help keep me healthy by being more active? a. Playing computer games b. Watching TV c. Walking d. I do not know
13. Being physically active is important because…… a. It keeps you healthy b. It gives you energy c. It makes you happy d. All of the above
14. The amount of time I need to be physically active is…….. a. 60 minutes everyday b. 4-6 days/week c. 1-3 days/week d. I do not need to be physically active

121
PART TWO
Attitudes
Pretest/Posttest/Delayed-post
Please place an X in the box that best answers the question.
1 I Disagree very much
2 I Disagree a little
3 I am not sure
4 I Agree a little
5 I Agree very much
Healthy food choice/eating
1. I think healthy food taste
good
2. I think eating healthy is very important
3. I believe my health in future may be affected by what I eat today
4. I believe I eat a balanced healthy diet at home
5. I believe I eat a balanced healthy diet at school
6. I think eating breakfast every day is good for my health
7. Drinking a glass of fat-free milk everyday is good for my health
8. I think drinking a glass of water every day is good for my health
Fruits and vegetables I feel that if I eat fruits and vegetables every day…..
9. It will help me have a healthy weight
10. I will be healthier. 11. I will have more energy. 12. I will be stronger. 13. I will think better in
class.
14. My family will be proud of me.

122
PART THREE
Nutrition Behavior and Physical Activity Behavior
Pretest/Posttest/Delayed-post
For questions 1-13, please CIRCLE the ONE ANSWER that best describes what you have done over the past week.
1. How often did you eat vegetables?
Several times a day Once a day 2-3 times/week Never 2. How often did you eat fruits?
Several times a day Once a day 2-3 times/week Never 3. How often did you skip meals?
Several times a day Once a day 2-3 times/week Never 4. How often did you eat a variety of foods?
Several times a day Once a day 2-3 times/week Never
5. How often did you ask a parent or adult to buy fruit or vegetables that you like?
Several times a day Once a day 2-3 times/week Never 6. How often did you change what you eat because of how much fat or sugar it has?
Several times a day Once a day 2-3 times/week Never 7. How often did you drink milk or eat milk products like cheese or yogurt?
Several times a day Once a day 2-3 times/week Never
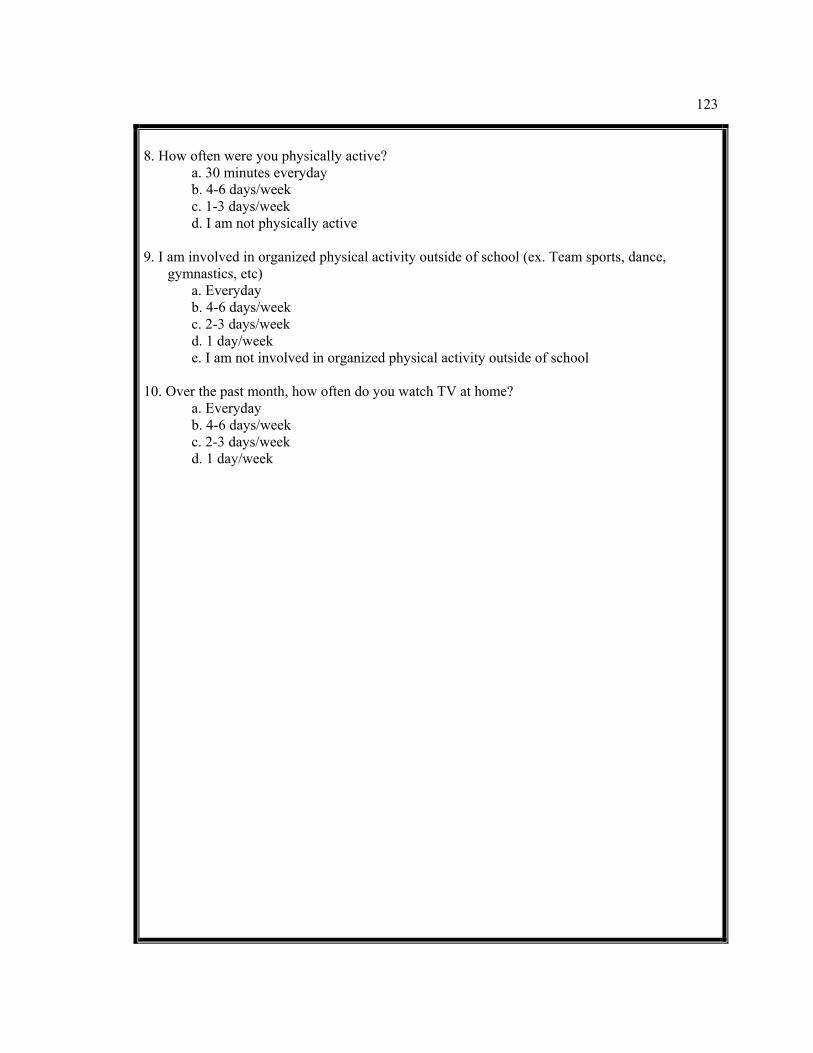
123
8. How often were you physically active?
a. 30 minutes everyday b. 4-6 days/week c. 1-3 days/week d. I am not physically active
9. I am involved in organized physical activity outside of school (ex. Team sports, dance,
gymnastics, etc) a. Everyday b. 4-6 days/week c. 2-3 days/week d. 1 day/week
e. I am not involved in organized physical activity outside of school 10. Over the past month, how often do you watch TV at home?
a. Everyday b. 4-6 days/week c. 2-3 days/week
d. 1 day/week

124
PART FOUR
Demographics Today’s Date: ____________________________ Name Initials: ____________________________
Tell us about you…… For Question 1-4, CIRCLE the ONE ANSWER that best describes who you are. 1. Circle if you are a:
Girl Boy 2. Circle the number that shows how old you are today 9 10 11 12 13 14 15 3. Circle the number that shows what grade you are in
5th Grade 6th Grade 7th Grade 8th Grade 9th Grade
4. Circle if you are:
White African American Asian American Indian/Alaskan Hawaiian/Pacific islander Hispanic:
Other___________________

Curriculum Vita OLIVE MONALISA-KAREKEZI KEMIREMBE
Education Aug, 2009 Doctor of Philosophy (Ph.D.), Agricultural & Extension Education Emphasis: Evaluation and Research Methods The Pennsylvania State University
May, 2004 Masters of Science (M.S), Agricultural & Extension Education Emphasis: International Agriculture and Education Development Michigan State University Dec, 2001 Bachelor of Science (B.S), Agriculture National University of Rwanda Professional Experience
Jan, 2006-May, 2009 Graduate Research Assistant, Pennsylvania State University Jan, 2004-Dec, 2005 Lecturer, National University of Rwanda Aug, 2001-Dec, 2003 Graduate Research Assistant, Michigan State University May, 2001-Jul, 2001 Teaching Assistant, National University of Rwanda Publications and Presentations
Kemirembe, O.M.K., Radhakrishna, R.B., & Gurgevich, E.A. (2009). A quantitative evaluation of
nutrition education program with low-income youth. Paper accepted for presentation at the American Evaluation Association (AEA) conference, November 11-14, Orlando, Florida.
Kemirembe, O.M.K., Hall, M.H., & Radhakrishna, R.B. (2008). Evaluation of Interactive, Computer-
Based Teaching (CBT) Modules for Forage Courses. NACTA Journal. Radhakrishna, R.B., Hall, M.H., & Kemirembe, O.M.K. (2008). Evaluation of computer-based
interactive (CBI) modules in six universities: Lessons learned. Abstract presented at the American evaluation association (AEA) conference. November 5-8, Denver, Colorado.
Radhakrishna, R.B., Hall, M.H., & Kemirembe, O.M.K. (2007). Developing, Implementing, and
Evaluating Interactive, Computer-based Teaching Modules for Agricultural Courses. Paper presented, Proceedings of International Conference on 21st Century: Challenges to sustainable Agri-food systems, Bangalore, India.
Professional Affiliations American Evaluation Association (AEA) Gamma Sigma Delta Honor Society Association for International Agricultural and Extension Education (AIAEE) American Educational Research Association (AERA) Washington Evaluators