a public health blueprint for healthy aging copd, diabetes, cancers, renal impairment, hiv, possibly...
TRANSCRIPT
A Public Health Blueprint for
Healthy Aging
Red Ribbons, Silver Threads:
Healthy Aging in the Era of HIV/AIDS
Linda P. Fried, M.D., M.P.H.
Longevity with HIV/AIDS:
Adding successful aging to clinical
and public health planning
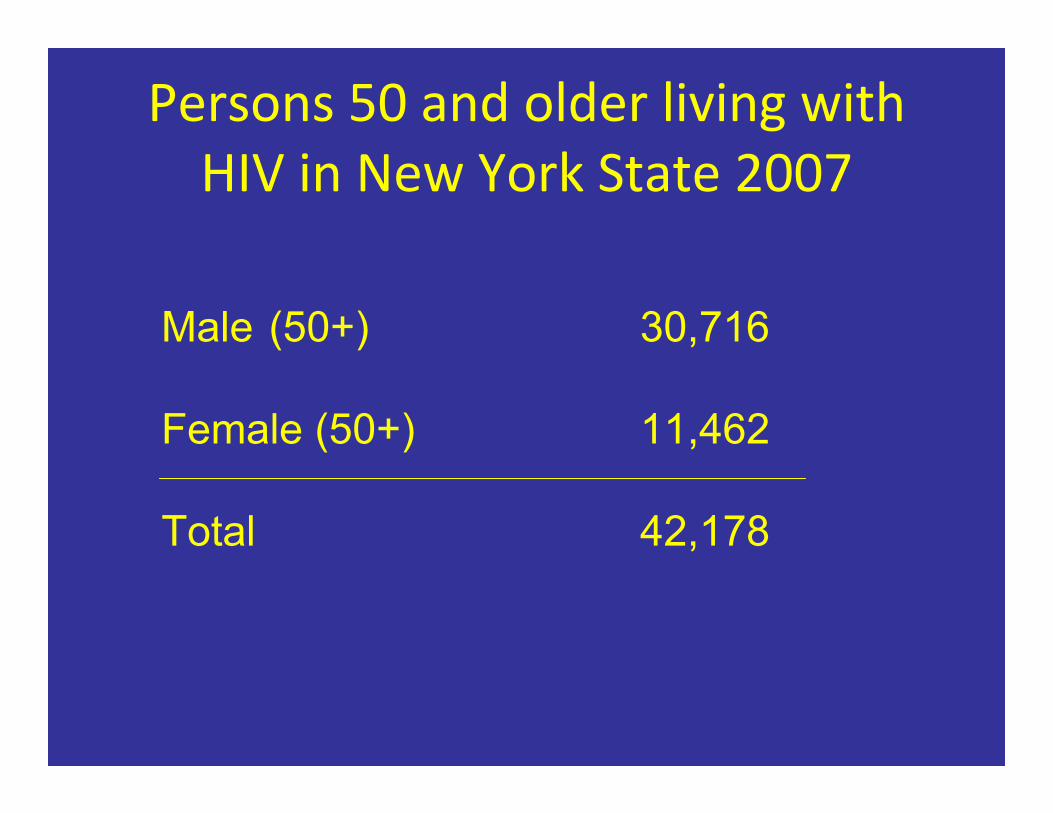
Persons 50 and older living with HIV in New York State 2007
Male (50+) 30,716
Female (50+) 11,462
Total 42,178
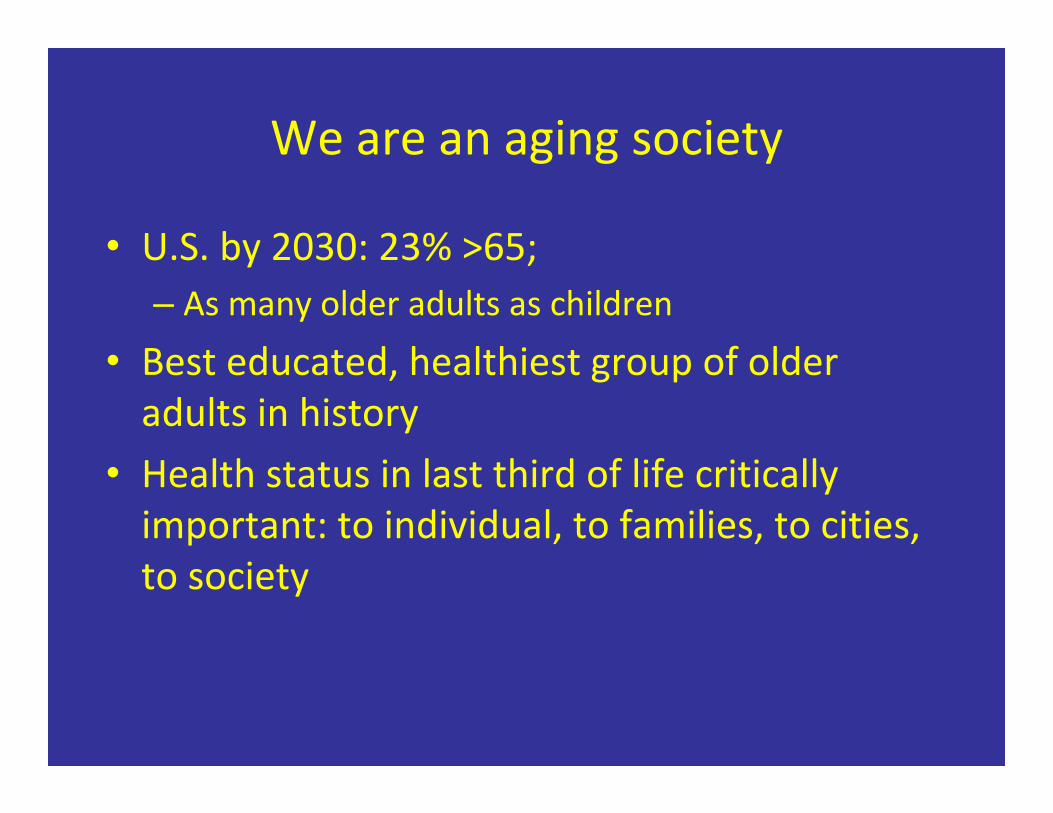
We are an aging society • U.S. by 2030: 23% >65;
– As many older adults as children • Best educated, healthiest group of older
adults in history
• Health status in last third of life critically
important: to individual, to families, to cities,
to society

Public Health Goals for an Aging
Society Life expectancy: 79 years
Will people be living longer years
healthy or ill?

Chronic Diseases Become the Norm
Adults 65 and older:
80% 1 or more diseases
50% 2 or more diseases
40% with disability in walking

“Compression of Morbidity” • Improving healthy later years through delaying onset of morbidity and disability to
latest points in the lives of older adults.
• Public health and clinical goal for improving
the health of an aging society.

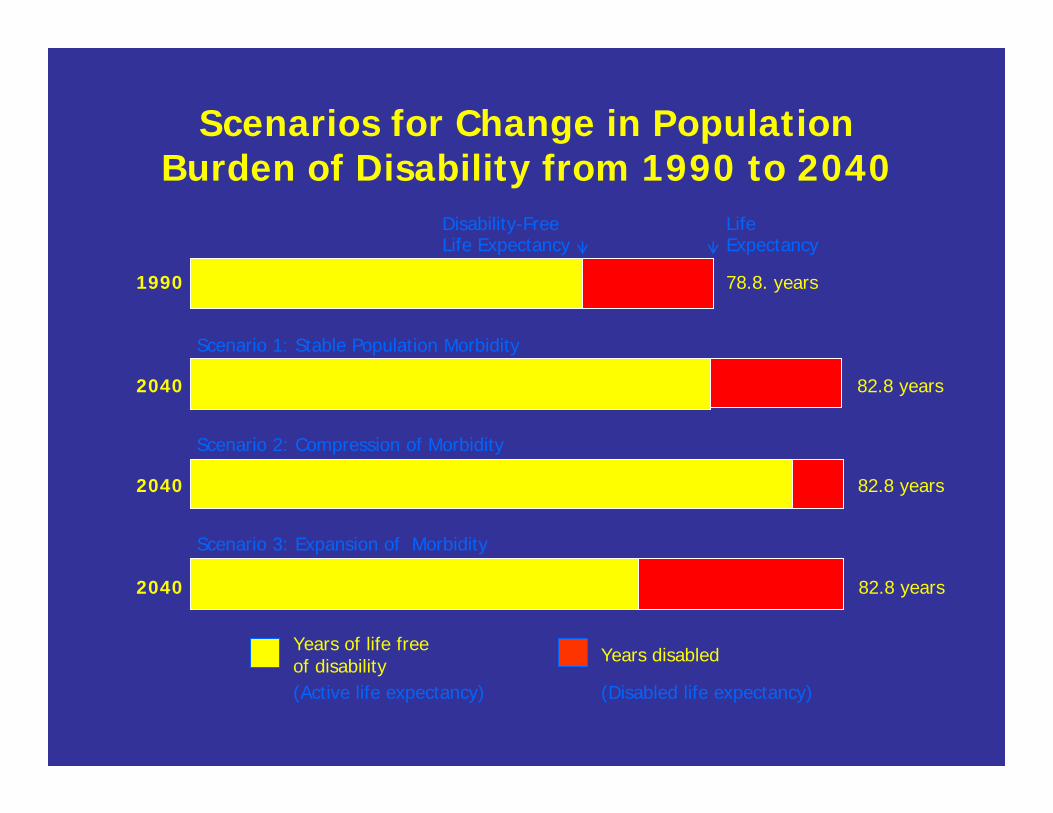
Scenarios for Change in Population Burden of Disability from 1990 to 2040
1990
Disability-Free Life Expectancy
Life Expectancy
78.8. years
Scenario 1: Stable Population Morbidity
2040 82.8 years
Scenario 2: Compression of Morbidity
2040 82.8 years
Scenario 3: Expansion of Morbidity
(Active life expectancy) (Disabled life expectancy)
Years of life free of disability Years disabled
2040 82.8 years
Changing realities

Age‐ and Disease‐Associated
Outcomes Emerge, 65+
• Chronic diseases (>80%) • Multimorbidity (>50%) • Frailty (7‐10%)
• Falls (31%)
• Disability (40%)

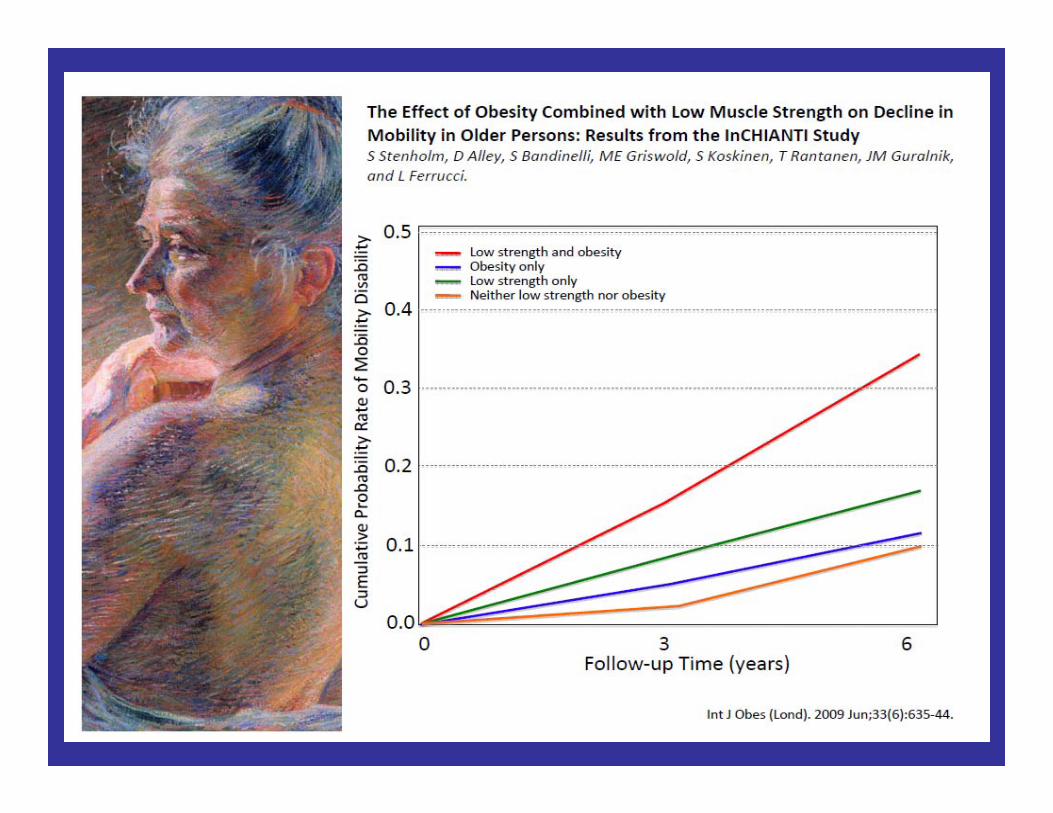
Specific Diseases Cause Disability
• Heart disease
• Knee OA
• Hip fracture
• Diabetes
• Stroke
• Claudication • COPD
• Visual Impairment
• Depression
• Cognitive Impairment

.2
.3
.4
.5
.6
.7
prop
ortio
n w
ithou
t diff
icul
ty
-36 -30 -24 -18 -12 -6 +6 +12 +18 +24 +30 +36
Months before or after incident event
CHD CHF stroke random
Event
event Onset of physical disability in high energy mobility tasks, men and women 65-101 in Cardiovascular Health Study

Health Disparities Persist • Disability in Inner City African Americans 49‐65
years:
– Occurs 10 years earlier than in suburban AAs and
whites
– Prevalence: 60% with >1 disability (women > men)
– Mediated by race and SES Miller D et al, 2005
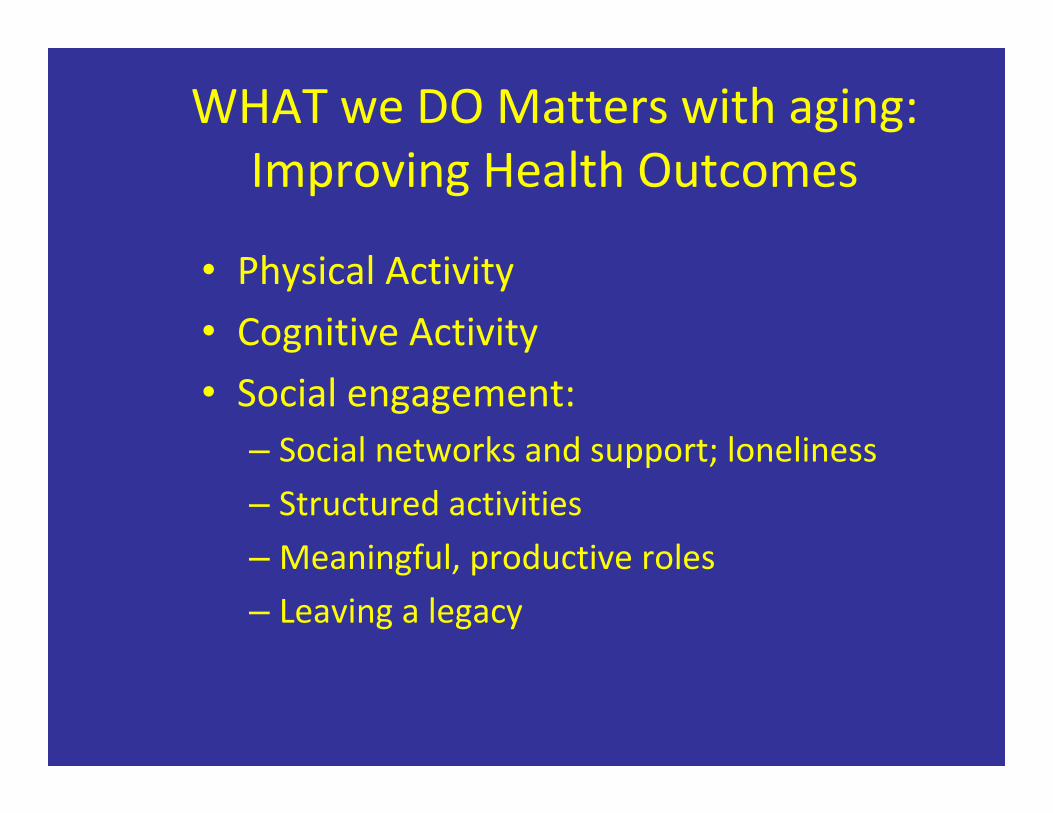
WHAT we DO Matters with aging: Improving Health Outcomes
• Physical Activity
• Cognitive Activity
• Social engagement: – Social networks and support; loneliness
– Structured activities
– Meaningful, productive roles
– Leaving a legacy
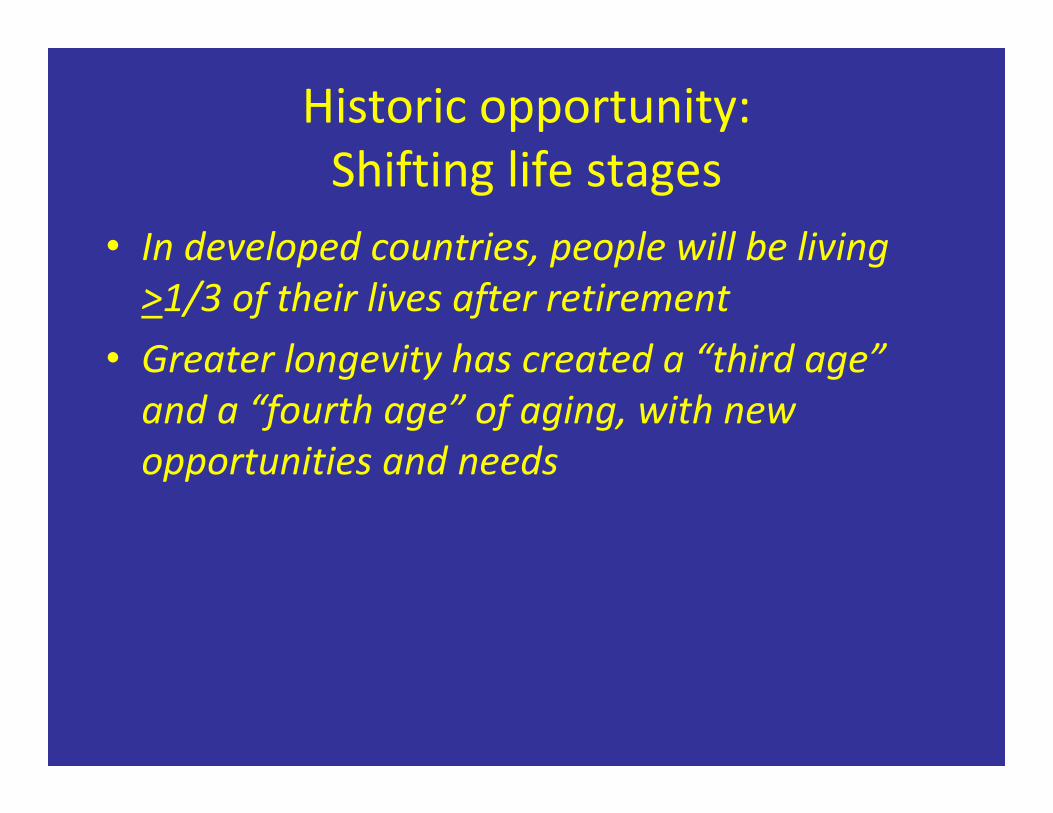
Historic opportunity:
Shifting life stages • In developed countries, people will be living
>1/3 of their lives after retirement • Greater longevity has created a “third age”
and a “fourth age” of aging, with new
opportunities and needs

Psychological Development
Continues over the Life
Course
(Erickson; Cohen G; others)
“generativity” is key to successful aging
• Leaving a legacy; Leaving the world better for
future generations (Erikson)
– Productive, meaningful engagement
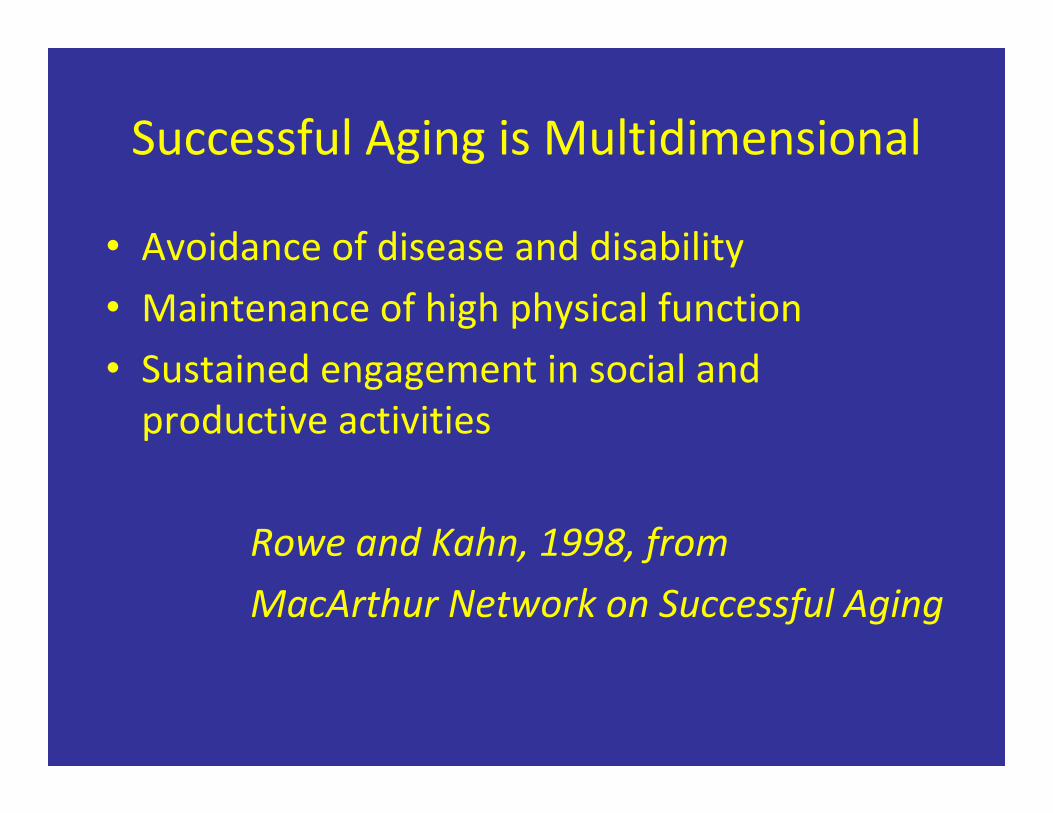
Successful Aging is Multidimensional
• Avoidance of disease and disability • Maintenance of high physical function
• Sustained engagement in social and
productive activities Rowe and Kahn, 1998, from
MacArthur Network on Successful Aging
Potential for Prevention and
Compression of Morbidity

We now know how to accomplish
healthy and successful aging –
enough to get started…..
Translation, and new knowledge, will
be key
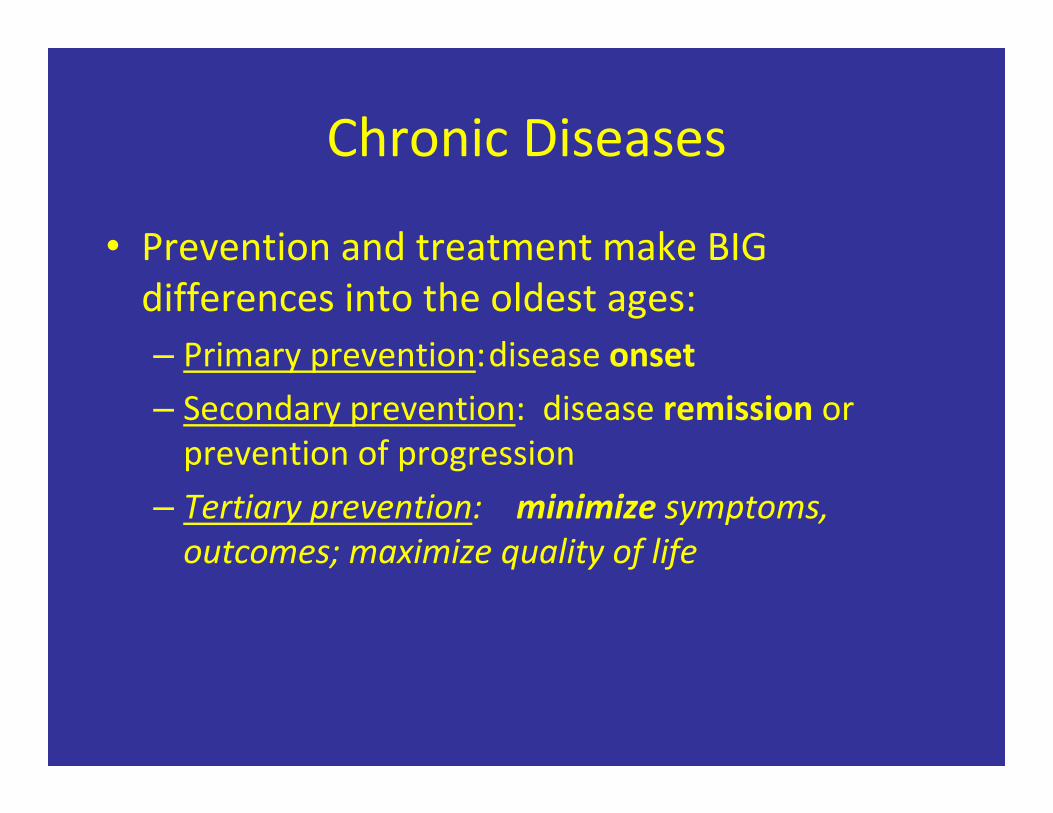
Chronic Diseases • Prevention and treatment make BIG differences into the oldest ages: – Primary prevention:disease onset
– Secondary prevention: disease remission or
prevention of progression – Tertiary prevention: minimize symptoms,
outcomes; maximize quality of life
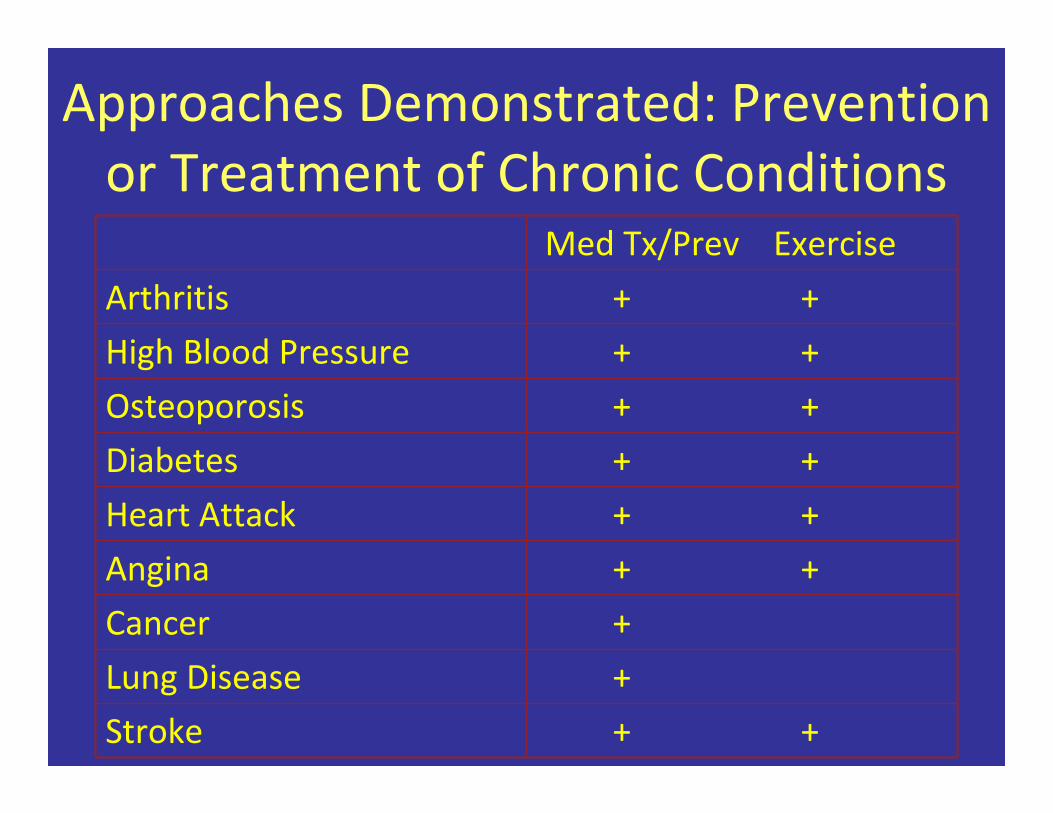
Approaches Demonstrated: Prevention
or Treatment of Chronic Conditions
Med Tx/Prev Exercise
Arthritis + +
High Blood Pressure + +
Osteoporosis + +
Diabetes + +
Heart Attack + +
Angina + +
Cancer +
Lung Disease +
Stroke + +

Impact of Effective Prevention: Change in U.S. death rates,
1950‐1997
Age Group % change
Heart Disease 65‐74
75‐84
85+
‐58%
‐54%
‐31%
Stroke 65‐74 75‐84
85+ ‐76%
‐65%
‐46%
Bureau of the Census

Decline in CVD Mortality, U.S. • Decline in CVD mortality, 1980‐1990: 34% overall
• Contributing factors:
– 25%: primary prevention of CVD
– 29%: secondary prevention
– 43%:improved medical care for patients with CVD
Hunink M,… Goldman L JAMA, 1997
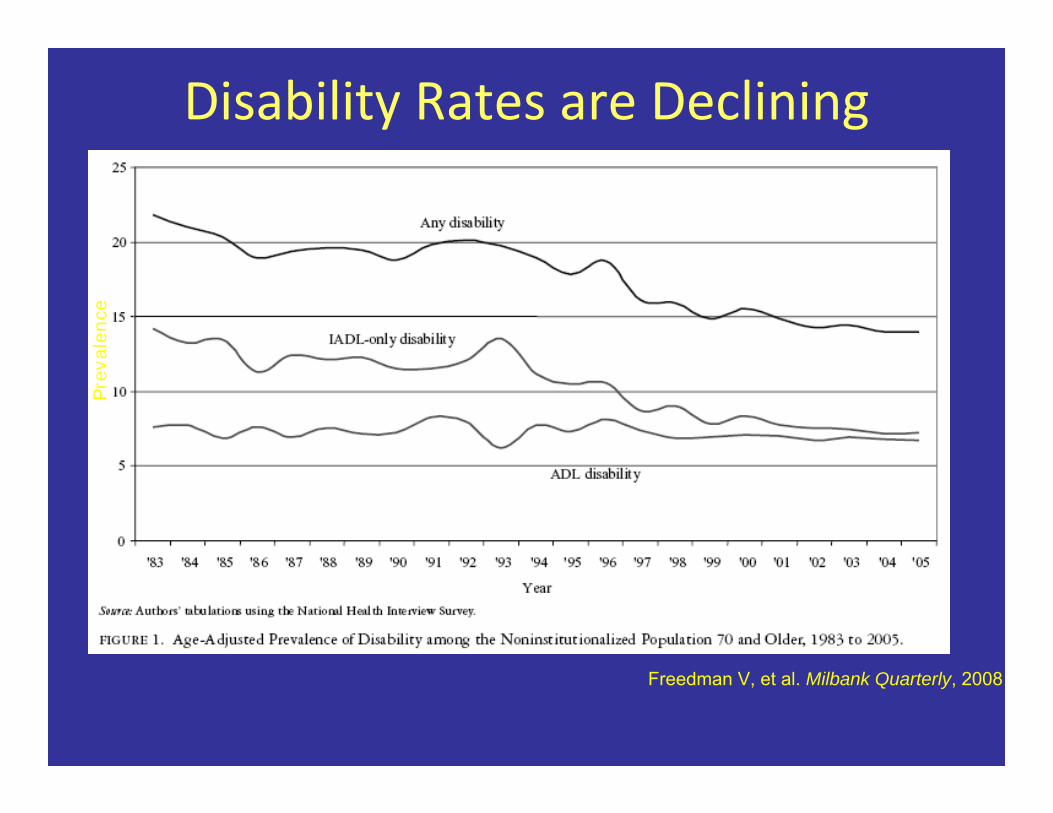
Disability Rates are Declining
Freedman V, et al. Milbank Quarterly, 2008
Pre
vale
nce

What will healthy aging require?
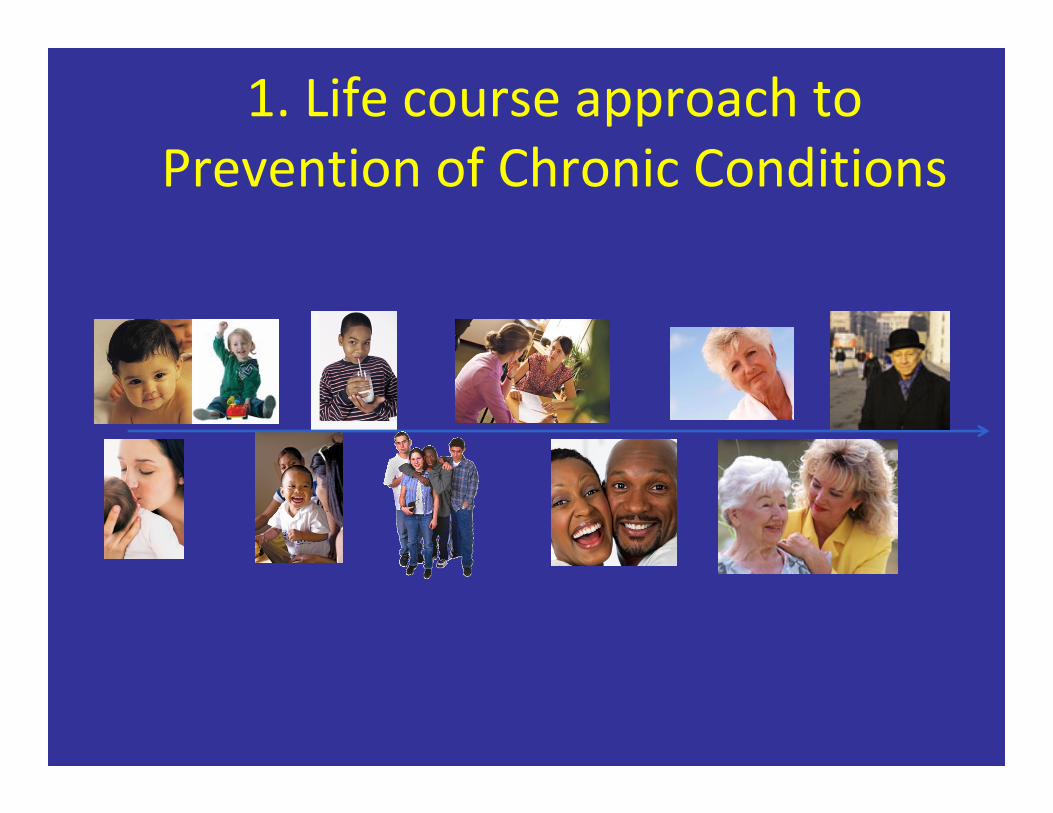
1. Life course approach to Prevention of Chronic Conditions

Chronic diseases develop over many years;
prevention is key
J. Fries. The Milbank Quarterly, 2005
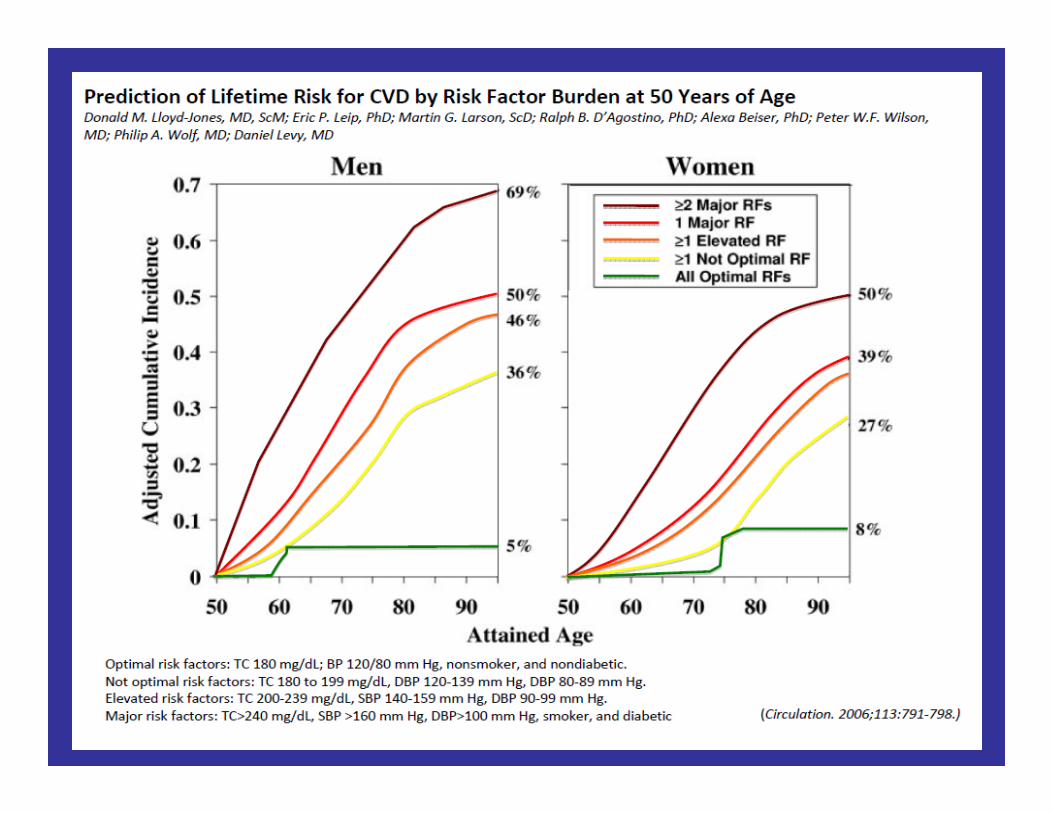
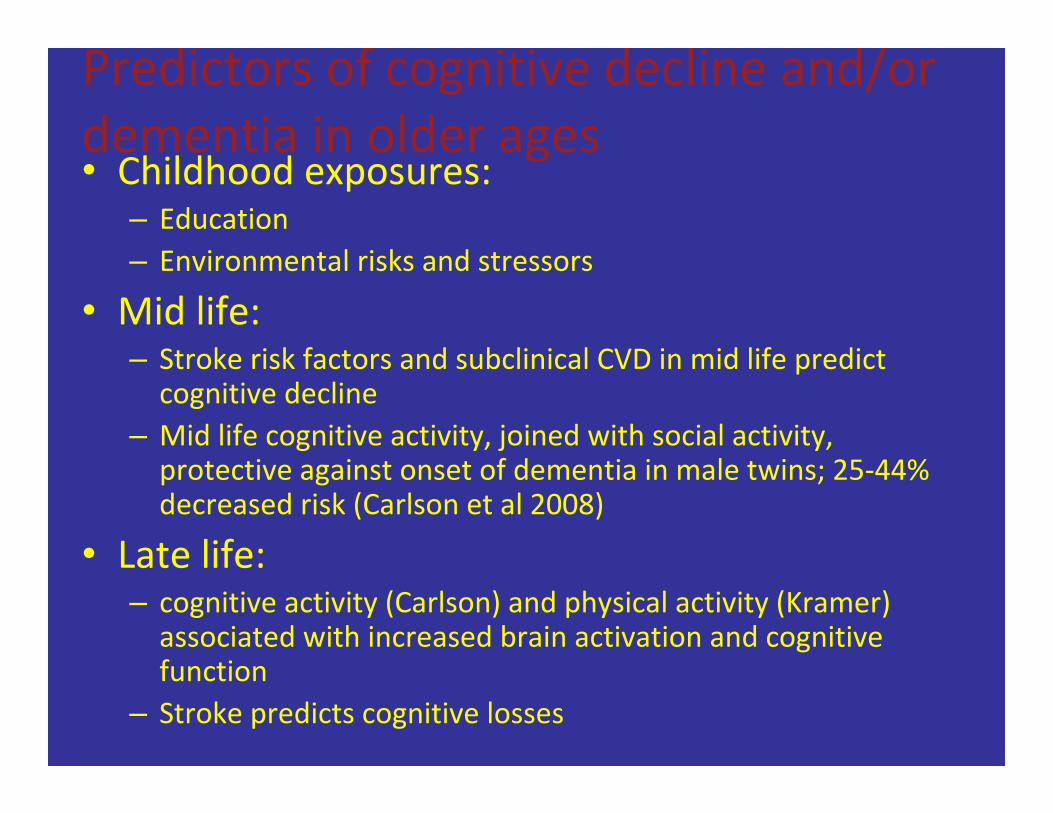
Predictors of cognitive decline and/or dementia in older ages• Childhood exposures:
– Education
– Environmental risks and stressors
• Mid life:
– Stroke risk factors and subclinical CVD in mid life predict
cognitive decline
– Mid life cognitive activity, joined with social activity,
protective against onset of dementia in male twins; 25‐44%
decreased risk (Carlson et al 2008)
• Late life:
– cognitive activity (Carlson) and physical activity (Kramer)
associated with increased brain activation and cognitive
function
– Stroke predicts cognitive losses

Cumulative risk manifests at older ages
• Health disparities in older adults – African American older adults manifest
• More chronic diseases
• Disability 10 years earlier than whites
(Miller, Wolinsky, et al)

Excess disability in inner city African‐Americans 49‐65, compared with suburban sample
• Excess Disability:
– 30% excess disability: walking one‐half mile
– 215% excess disability: managing medications
Miller D et al, J Ger: Med Sci, 2005
2. Knowledge of how health,
prevention and care needs change
with age
With longer age comes serious health issues not found at younger
ages:
Geriatric conditions
Multimorbidity
Frailty
Disability

Diseases/conditions can
contribute to other outcomes
Prevention of distal outcomes is key

.2
.3
.4
.5
.6
.7
prop
ortio
n w
ithou
t diff
icul
ty
-36 -30 -24 -18 -12 -6 +6 +12 +18 +24 +30 +36
Months before or after incident event
CHD CHF stroke random
Event
event Onset of physical disability in high energy mobility tasks, men and women 65-101 in Cardiovascular Health Study


Intrinsic physical and cognitive reserves evolve with aging
Baltes Hypothesis: loss of reserves with aging
Age +75

Decreased reserves necessitate:
‐ new approaches to understanding
vulnerabilities in aging,
‐ new approaches to prevention,
care

Frailty Phenotype – Definition [1]
An individual is “frail” if ≥ 3 components - of 5 - are present
- Physical shrinking (unintentional weight loss)
- Weakness (grip strength)
- Slowness (time to walk 15 feet)
- Low physical activity level (weighted score of kcal/week
- Exhaustion (self-reported)
Validated phenotype and medical syndrome [2]
[1] Fried LP, et al. J. Gerontol. A Biol. Sci. Med. Sci. 2001; 56:M146-56. [2] Bandeen-Roche K, et al, J. Gerontol. A Biol. Sci. Med. Sci. 2006; 61:262-66.
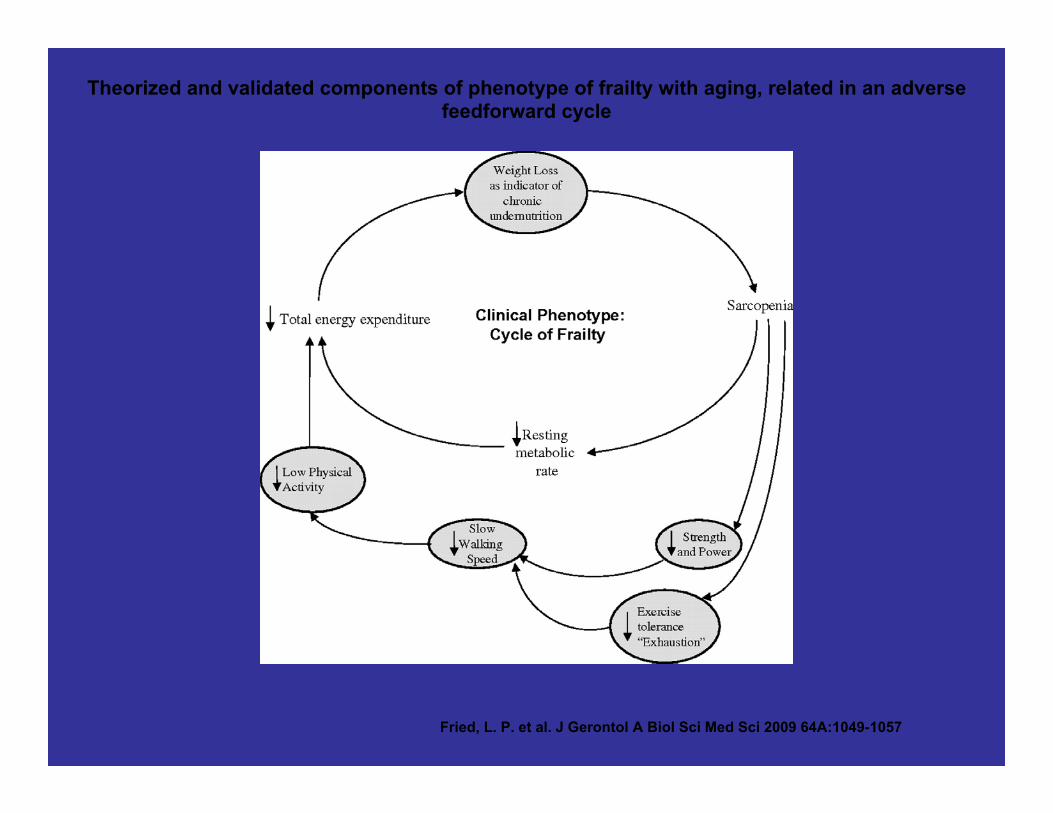
Theorized and validated components of phenotype of frailty with aging, related in an adverse
feedforward cycle
Fried, L. P. et al. J Gerontol A Biol Sci Med Sci 2009 64A:1049-1057
Frailty status predicts poor
outcomes
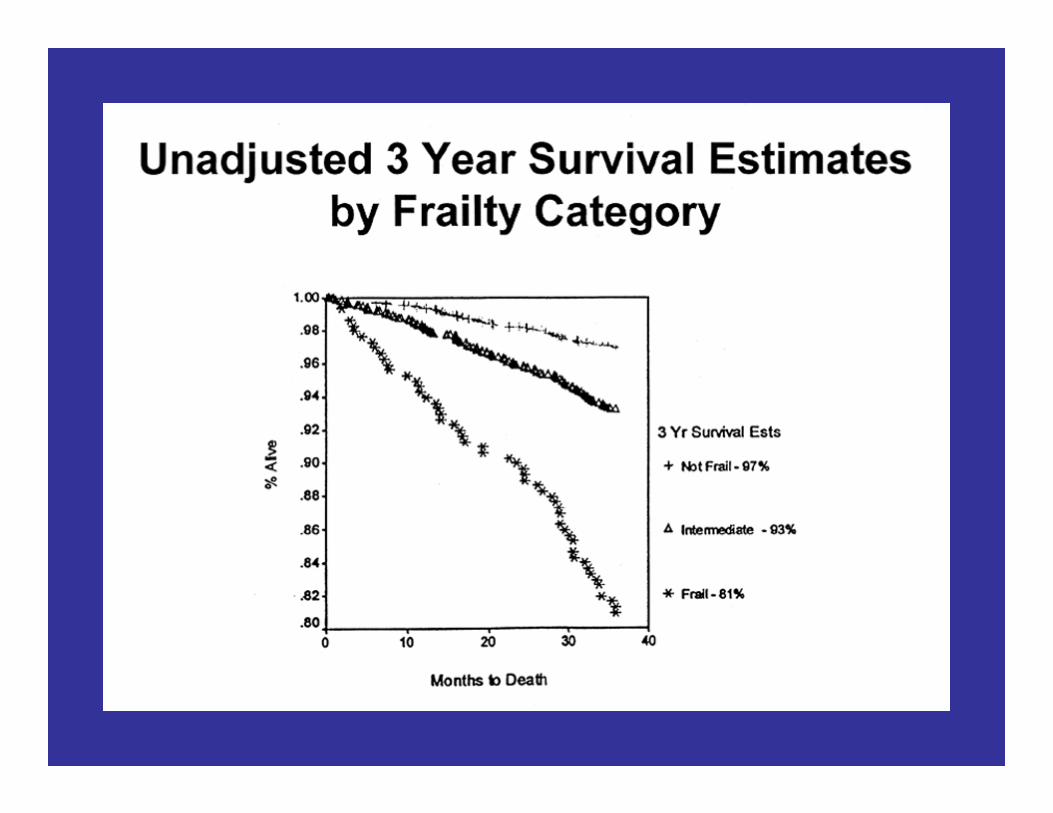
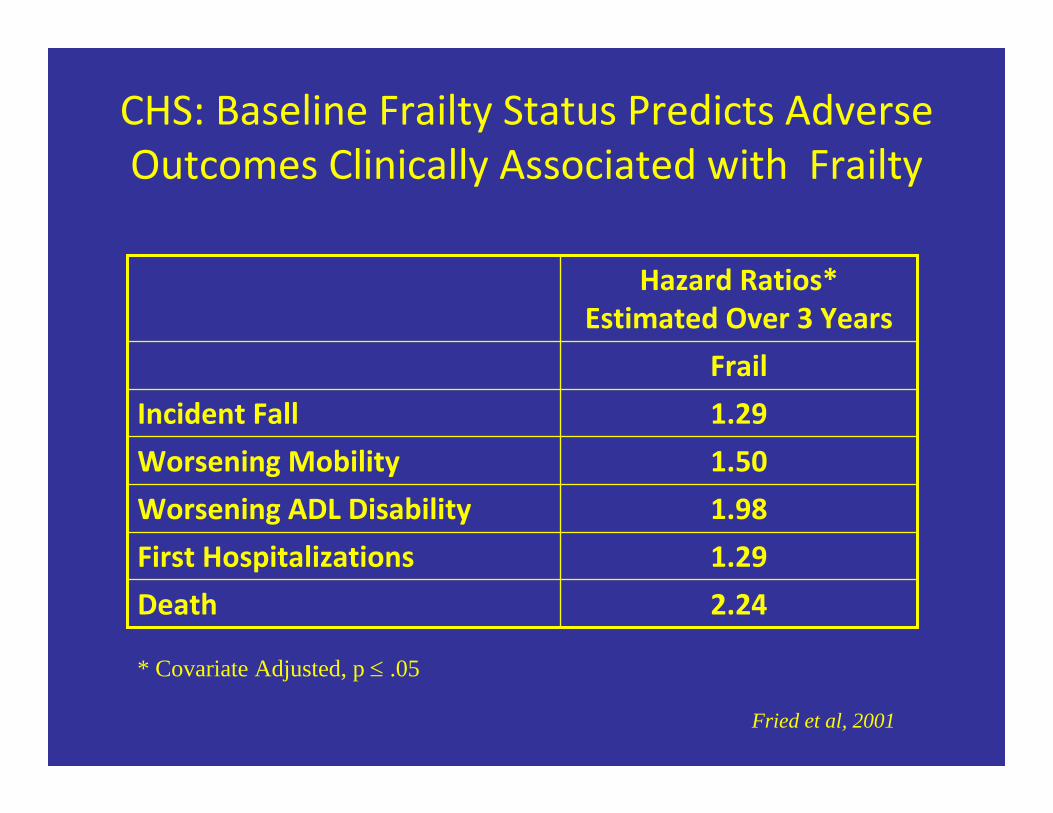
CHS: Baseline Frailty Status Predicts Adverse Outcomes Clinically Associated with Frailty
Hazard Ratios*
Estimated Over 3 Years
Frail
Incident Fall 1.29
Worsening Mobility 1.50
Worsening ADL Disability 1.98
First Hospitalizations 1.29
Death 2.24
* Covariate Adjusted, p ≤ .05
Fried et al, 2001
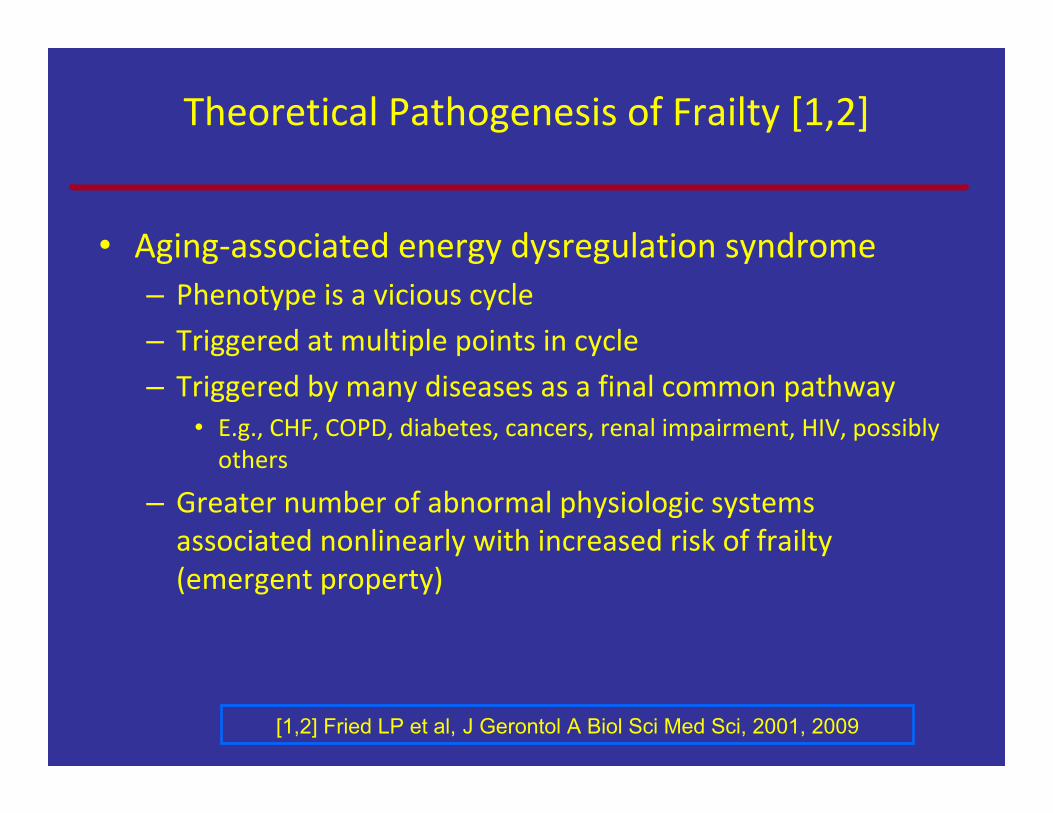
Theoretical Pathogenesis of Frailty [1,2]
• Aging‐associated energy dysregulation syndrome
– Phenotype is a vicious cycle
– Triggered at multiple points in cycle – Triggered by many diseases as a final common pathway
• E.g., CHF, COPD, diabetes, cancers, renal impairment, HIV, possibly
others
– Greater number of abnormal physiologic systems
associated nonlinearly with increased risk of frailty
(emergent property)
[1,2] Fried LP et al, J Gerontol A Biol Sci Med Sci, 2001, 2009
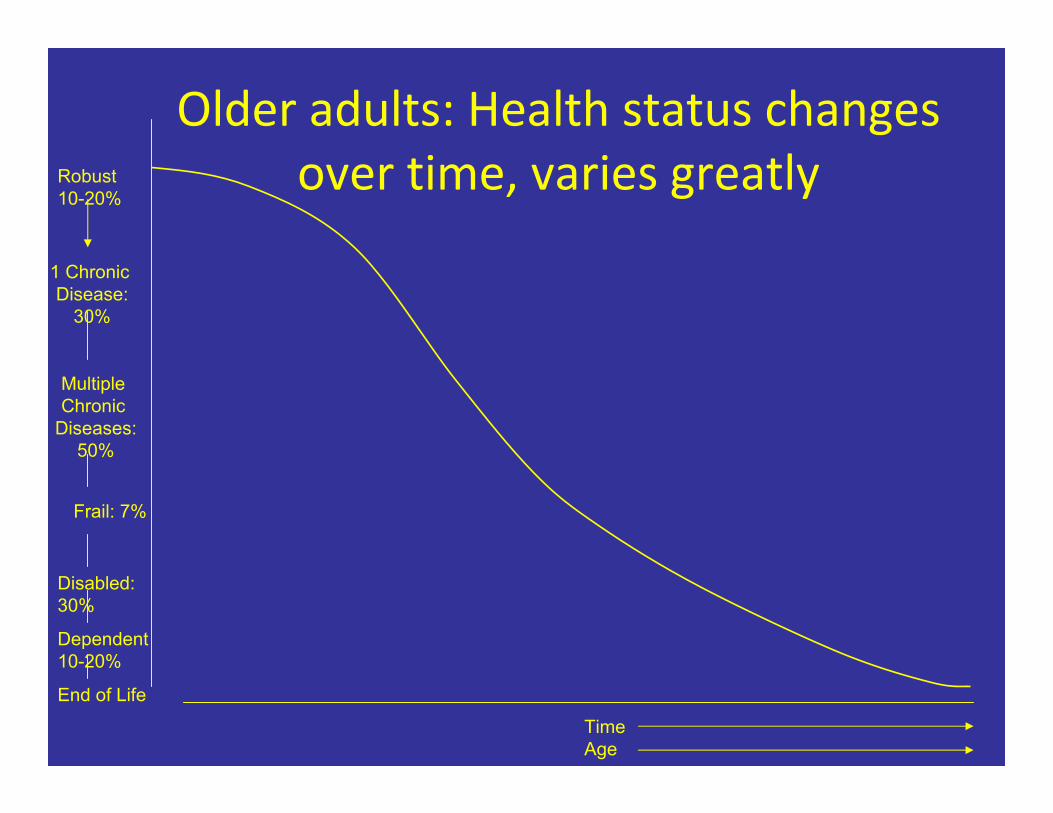
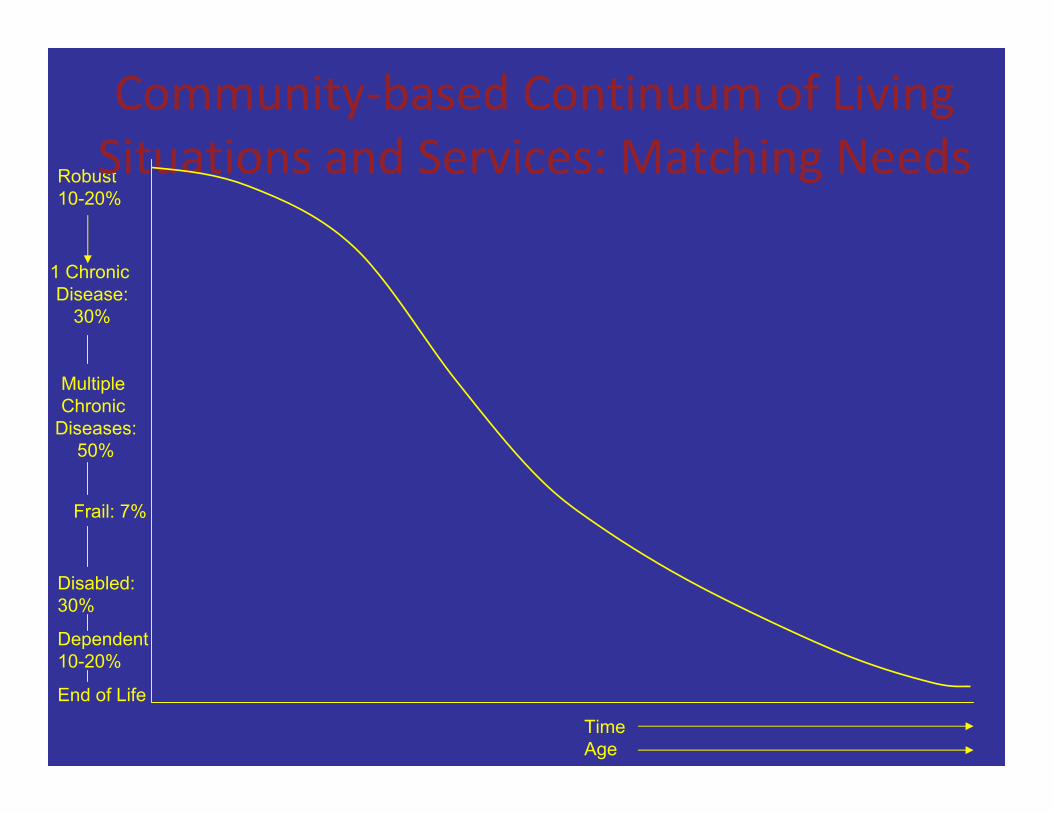
Older adults: Health status changes Robust over time, varies greatly 10-20%
1 Chronic Disease:
30%
Multiple
Chronic
Diseases:
50%
Frail: 7%
Disabled:
30%
Dependent
10-20%
End of Life
Time Age
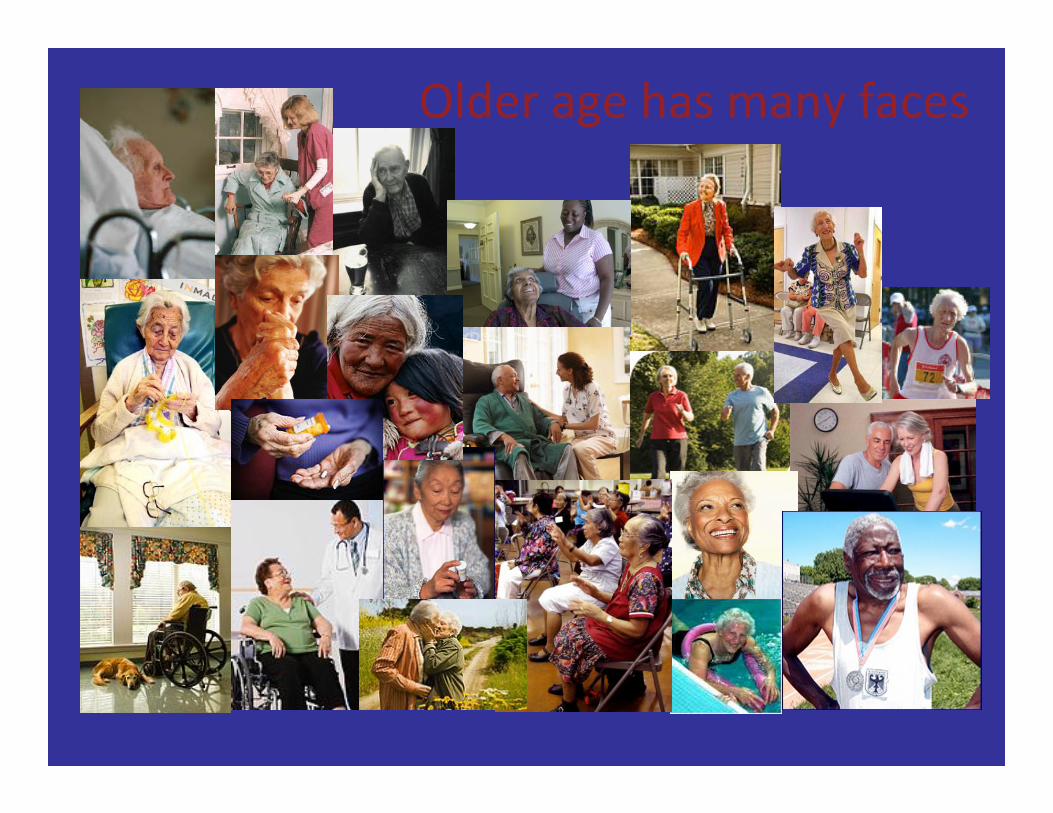
Older age has many faces
3. Health promotion for those
living with HIV
Aging‐related needs

Current HAART Era: Age Issues • HIV as a “chronic disease”
– Chronic disease care and prevention principles
– Co‐morbidities / toxicities (malignancies,
metabolic pertubations, cardiovascular, kidney,
liver, neurologic) ‐ which have an age component
– Geriatric conditions: • Polypharmacy
• Falls
• Frailty
• Disability – Mortality
30
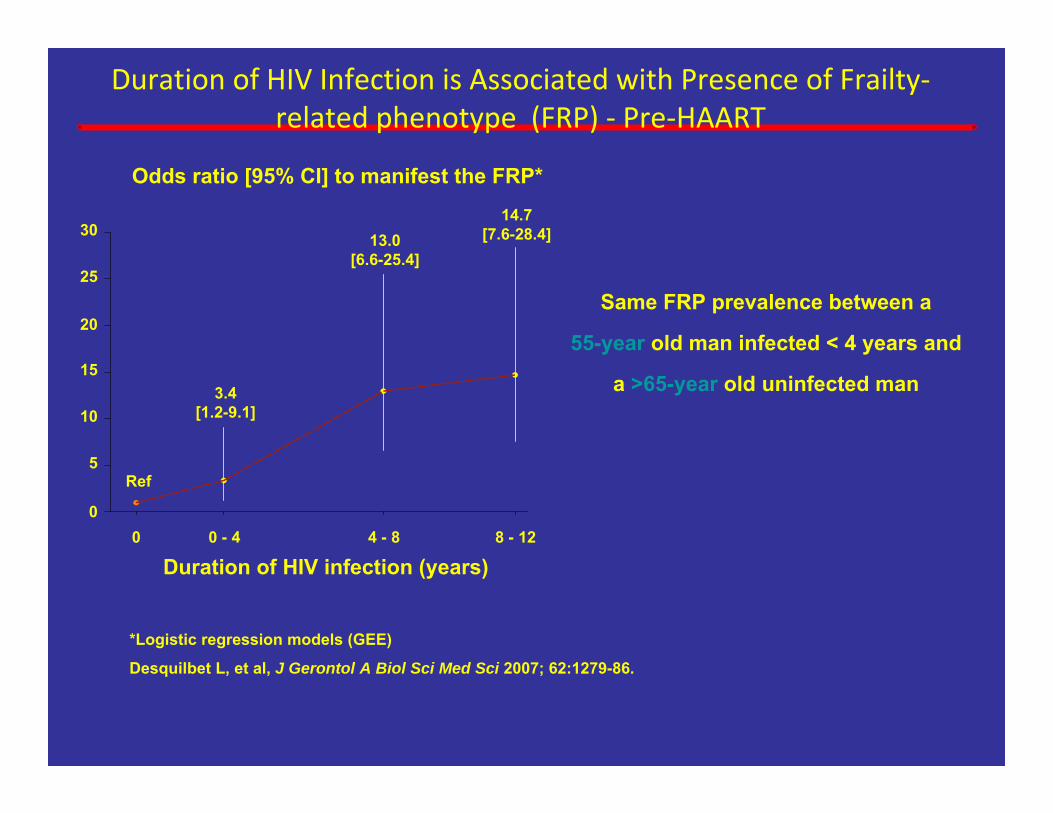
Duration of HIV Infection is Associated with Presence of Frailty‐related phenotype (FRP) ‐ Pre‐HAART
Odds ratio [95% CI] to manifest the FRP*
14.7 [7.6-28.4] 13.0
Same FRP prevalence between a
55-year old man infected < 4 years and
a >65-year old uninfected man
0 0 - 4 4 - 8 8 - 12
Duration of HIV infection (years)
*Logistic regression models (GEE) Desquilbet L, et al, J Gerontol A Biol Sci Med Sci 2007; 62:1279-86.
0
5
10
15
20
25
Ref
3.4 [1.2-9.1]
[6.6-25.4]
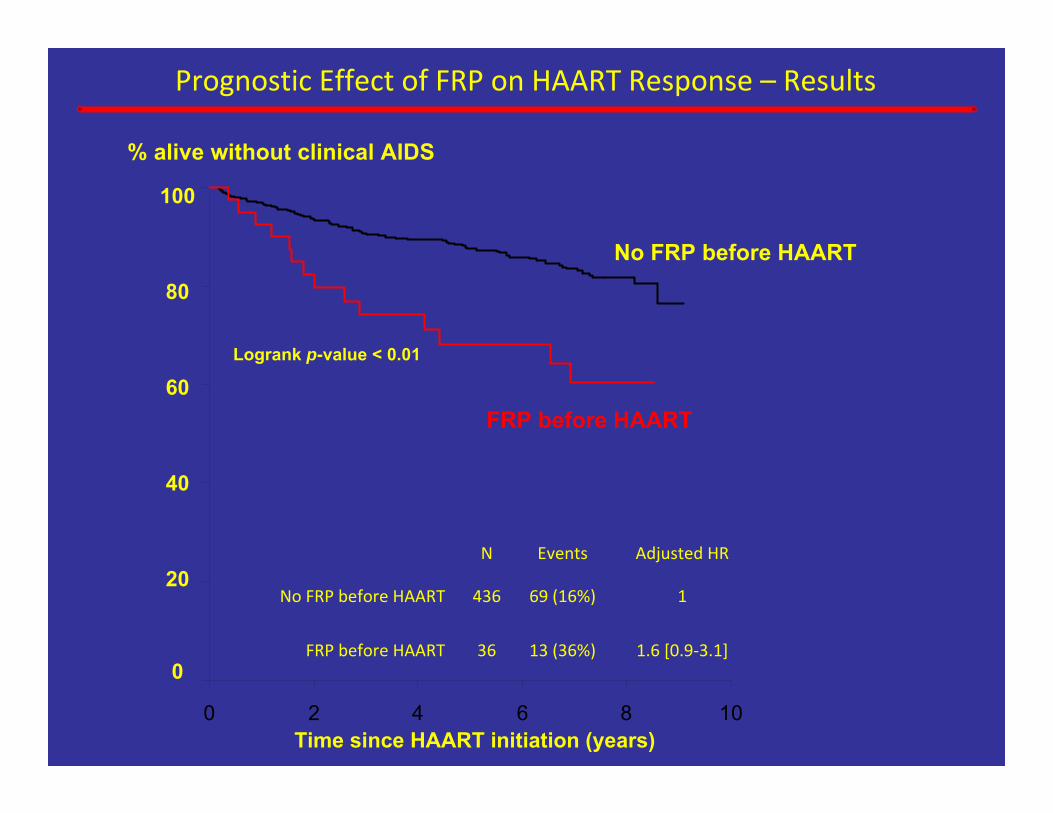
Prognostic Effect of FRP on HAART Response – Results % alive without clinical AIDS
100
80
60
40
20
0
Time since HAART initiation (years) 0 2 4 6 8 10
No FRP before HAART
FRP before HAART
N Events Adjusted HR
No FRP before HAART 436 69 (16%) 1
FRP before HAART 36 13 (36%) 1.6 [0.9‐3.1]
Logrank p-value < 0.01

Age‐specific and health needs‐
specific public health and health
care approaches matter
Integration of public health and medicine
– in both prevention and care
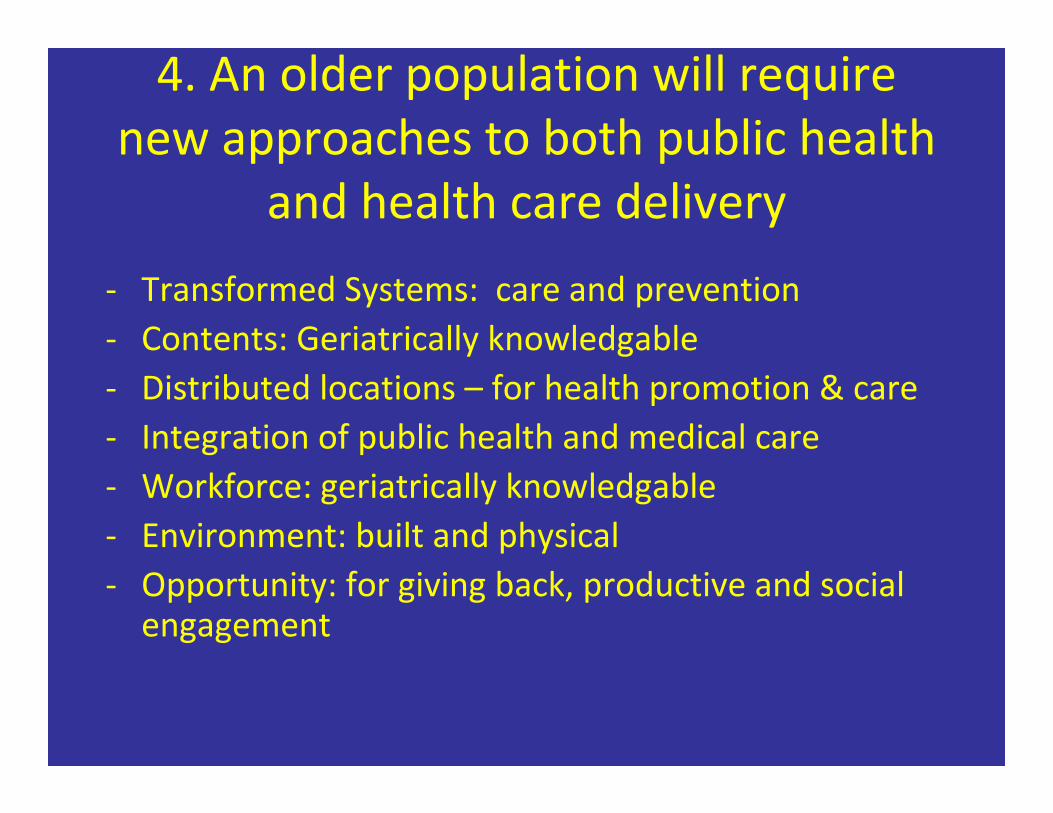
4. An older population will require new approaches to both public health
and health care delivery ‐ Transformed Systems: care and prevention
‐ Contents: Geriatrically knowledgable ‐ Distributed locations – for health promotion & care
‐ Integration of public health and medical care
‐ Workforce: geriatrically knowledgable
‐ Environment: built and physical
‐ Opportunity: for giving back, productive and social
engagement

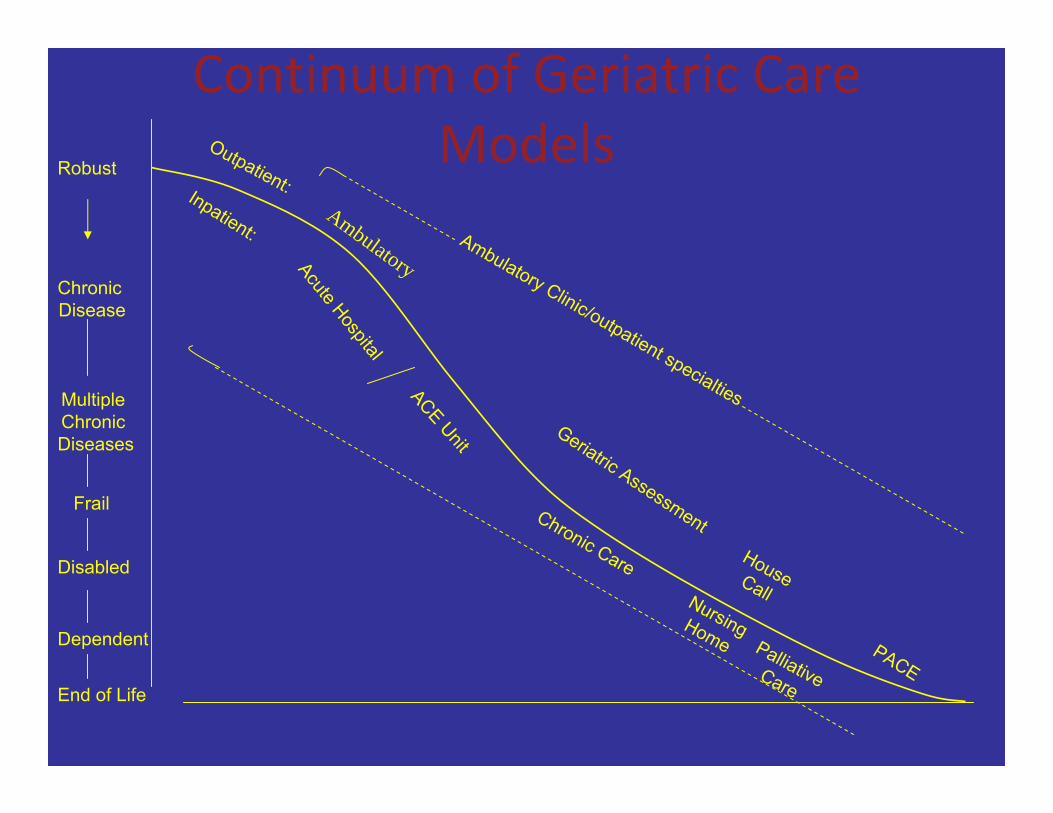
Challenge: The Health Care System Not Ready for Chronic Care Needs of
Older Adults • Acute event‐based care in a chronic disease world
• Effective geriatric care not implemented or
reimbursed
– Community‐based coordinated continuum of care needed
• Prevention needs to be inserted into medical care
and linked to community‐based approaches
– Institute of Medicine. Retooling for an Aging America:
Building the Health Care Workforce, 2008
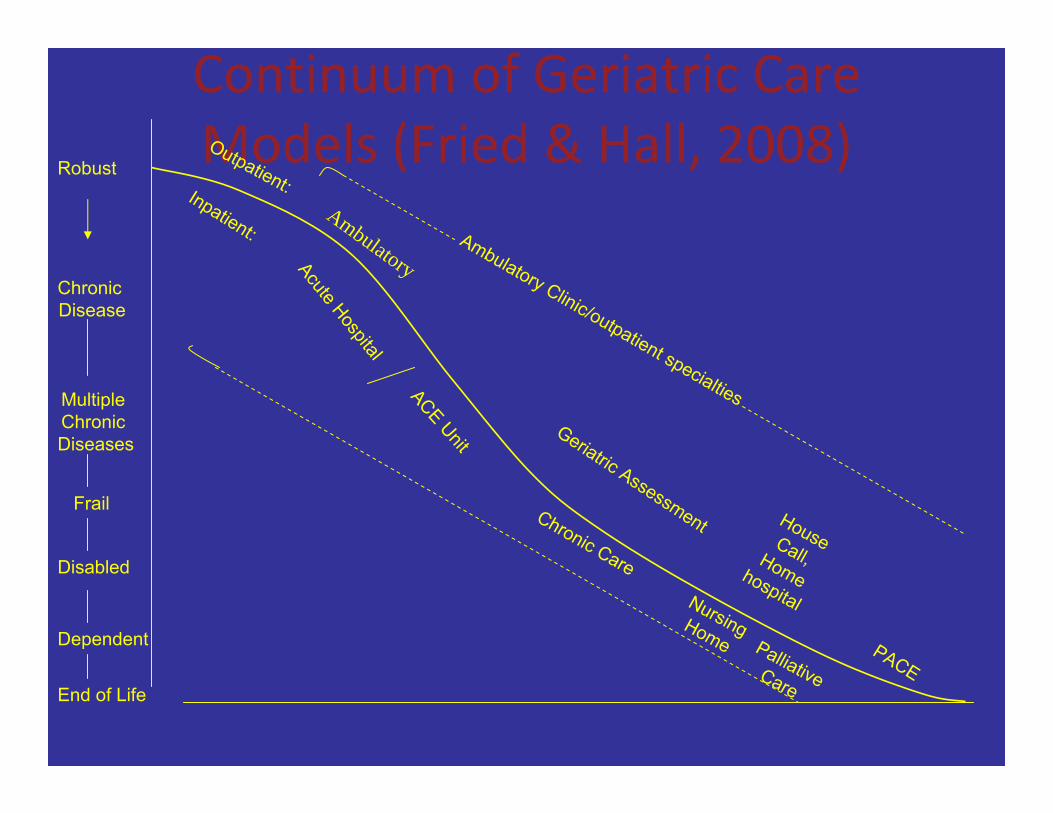
Continuum of Geriatric Care Models (Fried & Hall, 2008) OutpatRobust
Chronic Disease
Multiple Chronic Diseases
Frail
Disabled
Dependent
End of Life
ient:Inpatient: Ambulatory Clinic/outpatient specialties
Acute Hospital
Geriatric Assessment HC
Amb l tor
Chronic Care HomeNurs
italingHome
ouseall,hosp
Palliative
PACE
u ay
Care
ACEUnit

There are now evidence‐based interventions for geriatric syndromes
that improve outcomes • Medications management
• Delirium
• Falls
• Incontinence
• Weakness, frailty, mobility • Function, disability
• Transitions in care
These interventions are linked to positive outcomes

Sarcopenia modifiable
• In “frail”, disabled nursing home patients,
resistance exercise increased: – muscle mass by 180%
– strength by 100%
Fiatarone et al, 1993

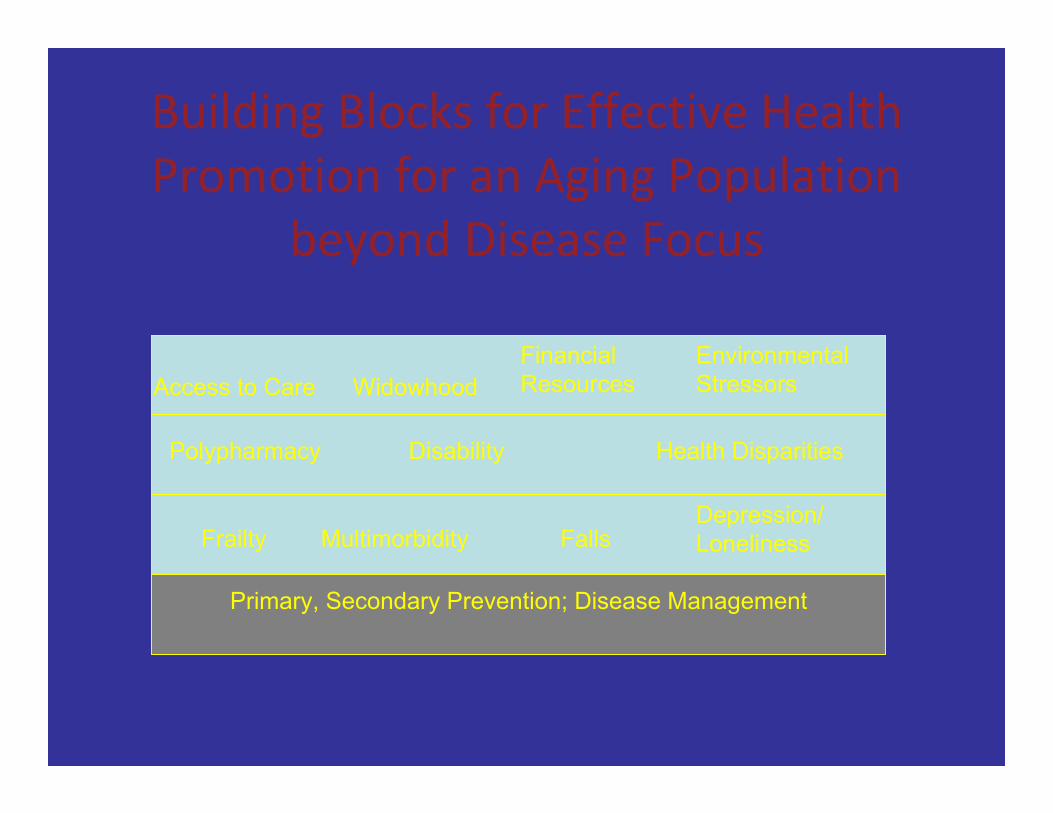
Building Blocks for Effective Health Promotion for an Aging Population
beyond Disease Focus
Primary, Secondary Prevention; Disease Management
Frailty Multimorbidity Falls Depression/ Loneliness
Polypharmacy Disability Health Disparities
Access to Care Meaningfull y engaged
Financial Resources
Environmental Stressors

Key Policy Challenge:
Who is on first?
• Public health and aging services networks are
siloed

Palombo R, et al. Public Health and Aging, 2005
Designing New York to support
successful and healthy aging

Age‐Friendly City: Key Domains (WHO)
• Housing
• Transportation
• Outdoor spaces and buildings • Social participation
• Civic engagement and employment
• Respect, social inclusion v. ageism,fear
• Communication re: services
• Community support and health services

Accomplishing positive health
behaviors for an aging population
will require novel, multilevel,
community‐based approaches

Insert walkability slide
Increasing Physical Activity in Older Adults: public health and health
care working together • Physician prescription
• Communities that permit/support being
active
• Exercise programs • Community‐based approaches to enhance
usual physical activity
Community‐based approaches to
health promotion:
Generativity as a vehicle
Meaningful roles to make a
difference:
Experience Corps as an example

Cortical
plasticity; Memory
Executive function
Experience Corps
Participation -
Generative Role
Performance
Intervention Primary Pathways Mechanisms
Performance-based measures Secondary outcomes and intermediate mechanisms
Primary/ [Self Report] Outcomes
Strength, balance
↑ or preserved function or delayed decline in:
Social Integration & Support
Generativity
Physical Activity
Cognitive Activity
Social Activity, Engmnt. Psycho-Social
Well-being
Walking Speed
Mobility Function
Causal Pathway: Experience Corps
IADLs
Falls
Frailty
Complex task performance
Preliminary evidence: EC Baltimore
Pilot RCT, Physical Activity
• For those previously with low activity:
– Increased physical activity within range obtained by
exercise trials (< 700 kcal/wk) – sustained dose; high retention
– Increase sustained over 3 years, relative to
comparison group • Participation by high risk subsets, including
African American older adults
(Tan et al, 2006, 2009)
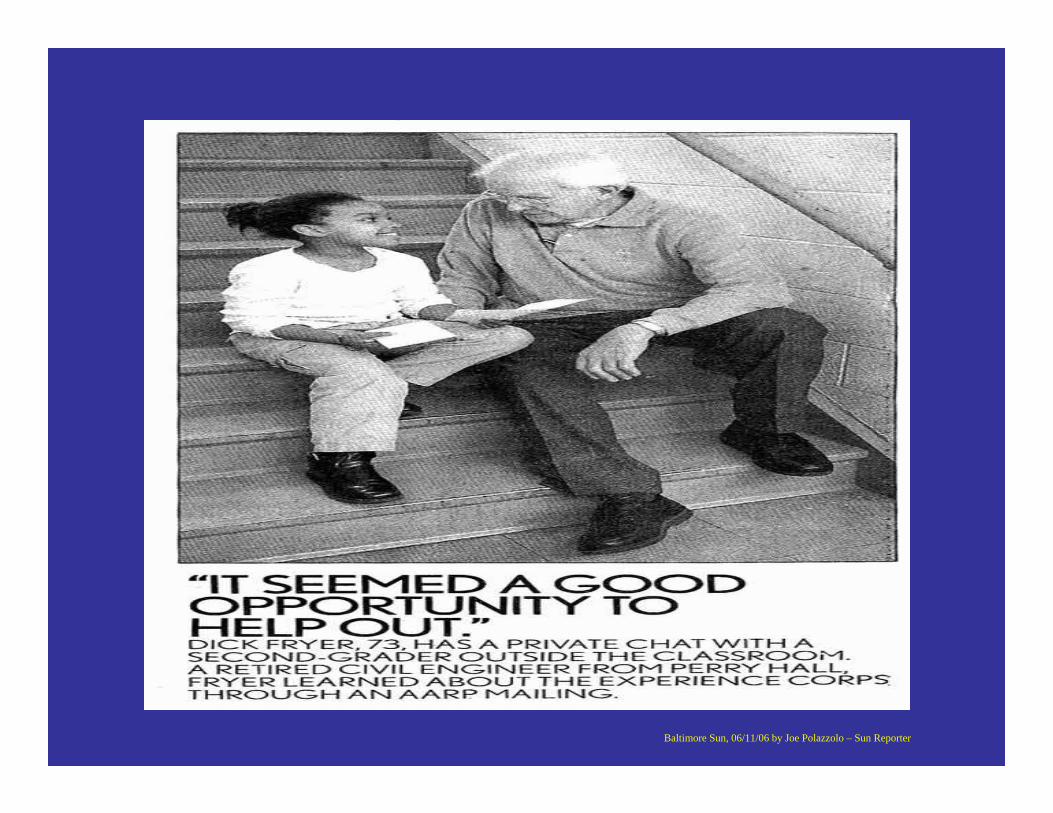
Baltimore Sun, 06/11/06 by Joe Polazzolo – Sun Reporter
Change in Executive Function in
EC volunteers v. controls
‐Low normal executive function at baseline
‐ 6 month follow‐up
(Carlson et al 2009)
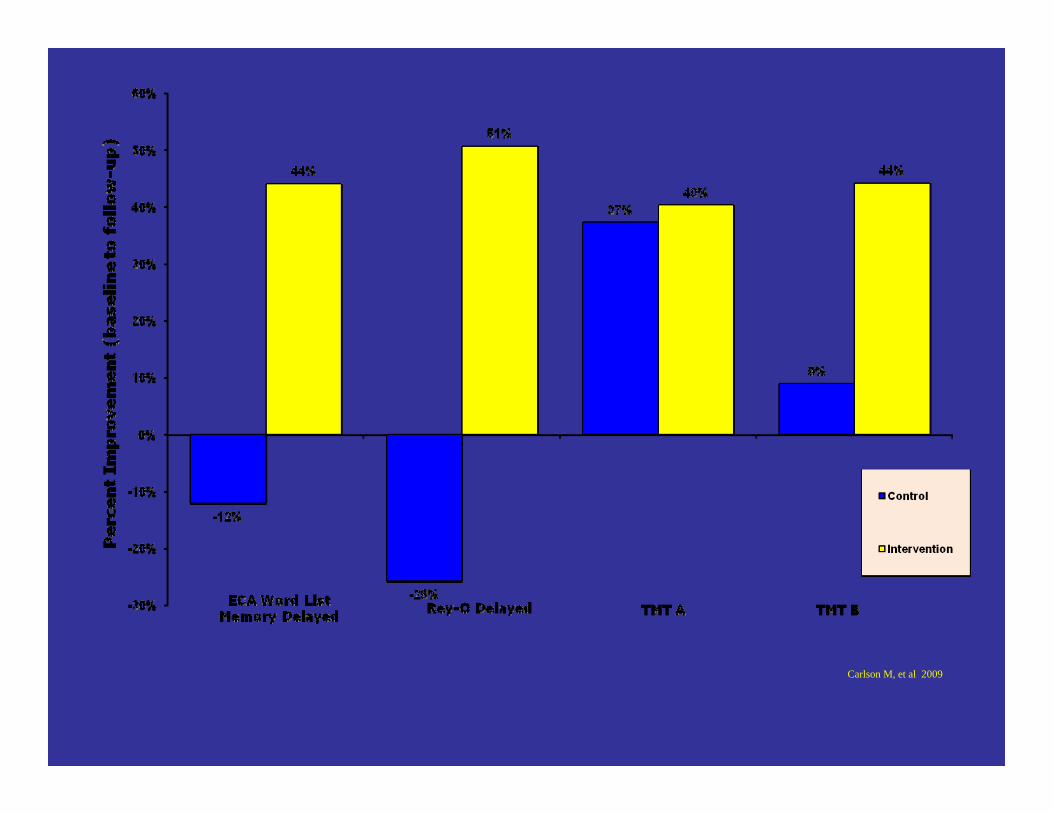
Carlson M, et al 2009
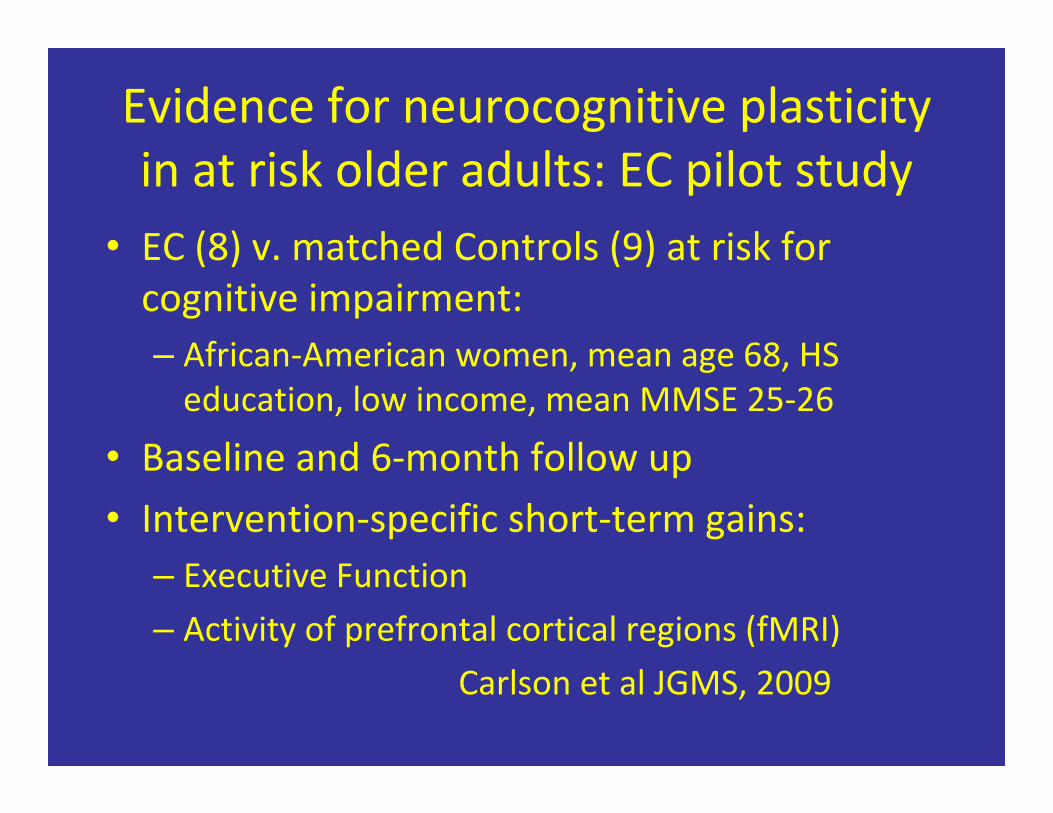
Evidence for neurocognitive plasticity in at risk older adults: EC pilot study
• EC (8) v. matched Controls (9) at risk for
cognitive impairment:
– African‐American women, mean age 68, HS
education, low income, mean MMSE 25‐26
• Baseline and 6‐month follow up
• Intervention‐specific short‐term gains:
– Executive Function
– Activity of prefrontal cortical regions (fMRI)
Carlson et al JGMS, 2009

EC participants > Controls on test of executive
function following 6 month exposure
PFC= prefrontal cortex; ACC= anterior cingulate cortex
Carlson, Erickson, Kramer, …Fried, JGMS 2009

Baltimore Sun, 06/11/06 by Joe Polazzolo – Sun Reporter
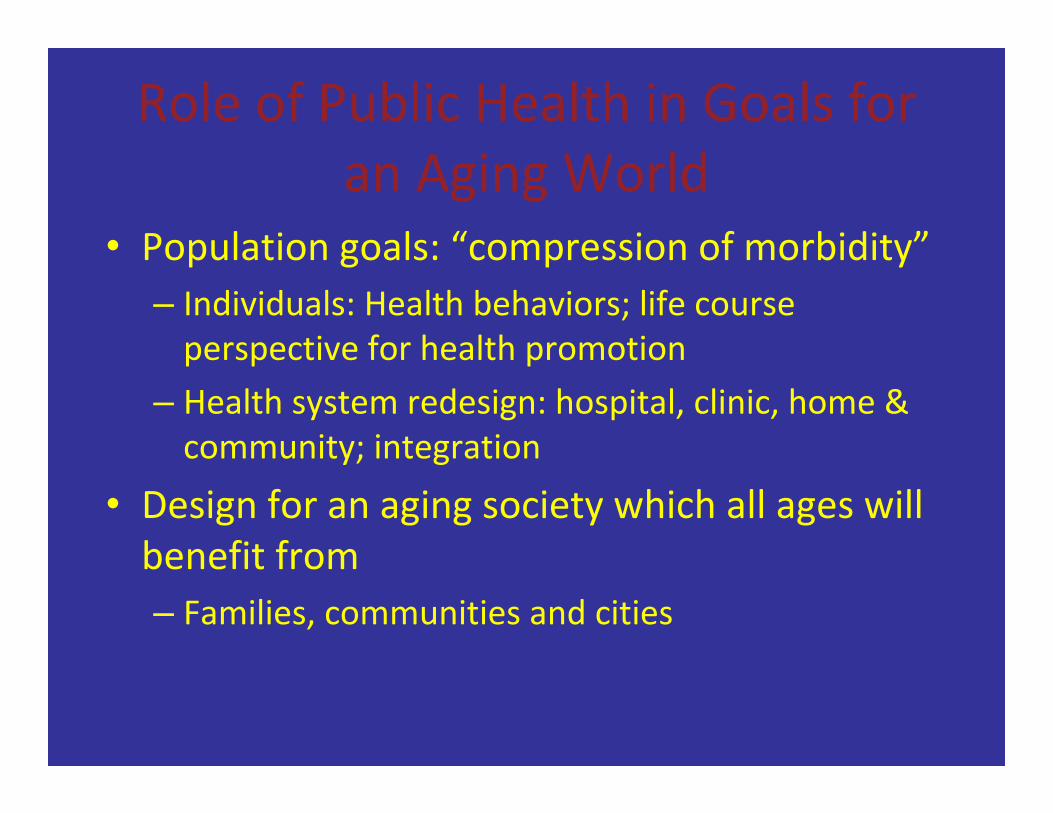
Role of Public Health in Goals for an Aging World
• Population goals: “compression of morbidity”
– Individuals: Health behaviors; life course
perspective for health promotion – Health system redesign: hospital, clinic, home &
community; integration • Design for an aging society which all ages will
benefit from
– Families, communities and cities
Healthy, successful aging:
a critical societal goal


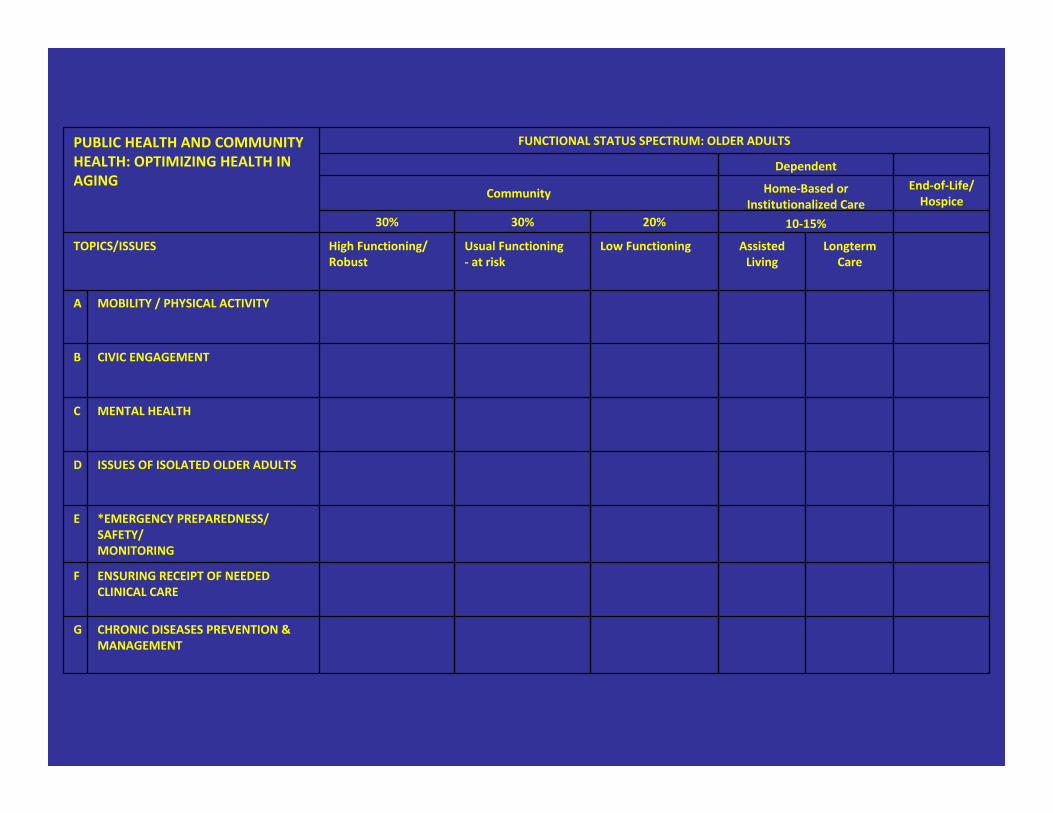
PUBLIC HEALTH AND COMMUNITY FUNCTIONAL STATUS SPECTRUM: OLDER ADULTS
HEALTH: OPTIMIZING HEALTH IN
AGING
Dependent
Community Home‐Based or Institutionalized Care
End‐of‐Life/
Hospice
30% 30% 20% 10‐15%
TOPICS/ISSUES High Functioning/
Robust
Usual Functioning
‐ at risk
Low Functioning Assisted Living
Longterm
Care
A MOBILITY / PHYSICAL ACTIVITY
B CIVIC ENGAGEMENT
C MENTAL HEALTH
D ISSUES OF ISOLATED OLDER ADULTS
E *EMERGENCY PREPAREDNESS/
SAFETY/
MONITORING
F ENSURING RECEIPT OF NEEDED
CLINICAL CARE
G CHRONIC DISEASES PREVENTION &
MANAGEMENT

FRP in the 3 years before HAART initiation independently predicts subsequent clinical AIDS or death (N= 596 men in MACS) ‐adjusting for other predictors (multivariate Cox models)
AIDS‐free at HAART (N=472) AIDS at HAART (N=124)
Exposures at HAART initiation aHR1 P‐value aHR2 P‐value
Education ≥ college 1∙01 0∙96 0∙87 0∙70
Ethnicity = White non Hispanic
(vs others)
1∙32 0∙45 0∙64 0∙38
Age (per 10 years increase) 1∙43 0∙03 1∙31 0∙32
Nadir CD4+ T‐cell count (per
100 cell/mm3 increase)3 0∙85 0∙05 0∙94 0∙61
Maximum plasma viral load
(per 1 log10 copies/ml
increase)3
2∙08 < 0∙01 1∙31 0∙38
Proportion of FRP + visits
before HAART (for a 25%
increase)3
1∙35 0∙04 1∙63 <0∙01
FRP, frailty‐related phenotype; aHR, hazard ratios adjusted for variables listed in the table; 1 adjusted hazard
ratios for AIDS/death; 2 adjusted hazard ratios for death only; 3 within the 3 years before HAART


Physical disability in community‐dwelling persons 70 and older, U.S.:
due to chronic diseases • 10% incidence/year
• Difficulty: Men Women
‐Walking 30% 33%
‐ IADLs 13% 7%
‐ ADLs 22% 17%
NCHS, 1999

Preliminary Evidence of Intermediate Effects: EC vs.
Controls • Behavioral Risk Factors:
– Physical activity
– Cognitive activity
– Social supports • Intermediate effects:
– Cognition (executive); brain activation
– Strength, performance, energy, falls
– Depressive symptoms
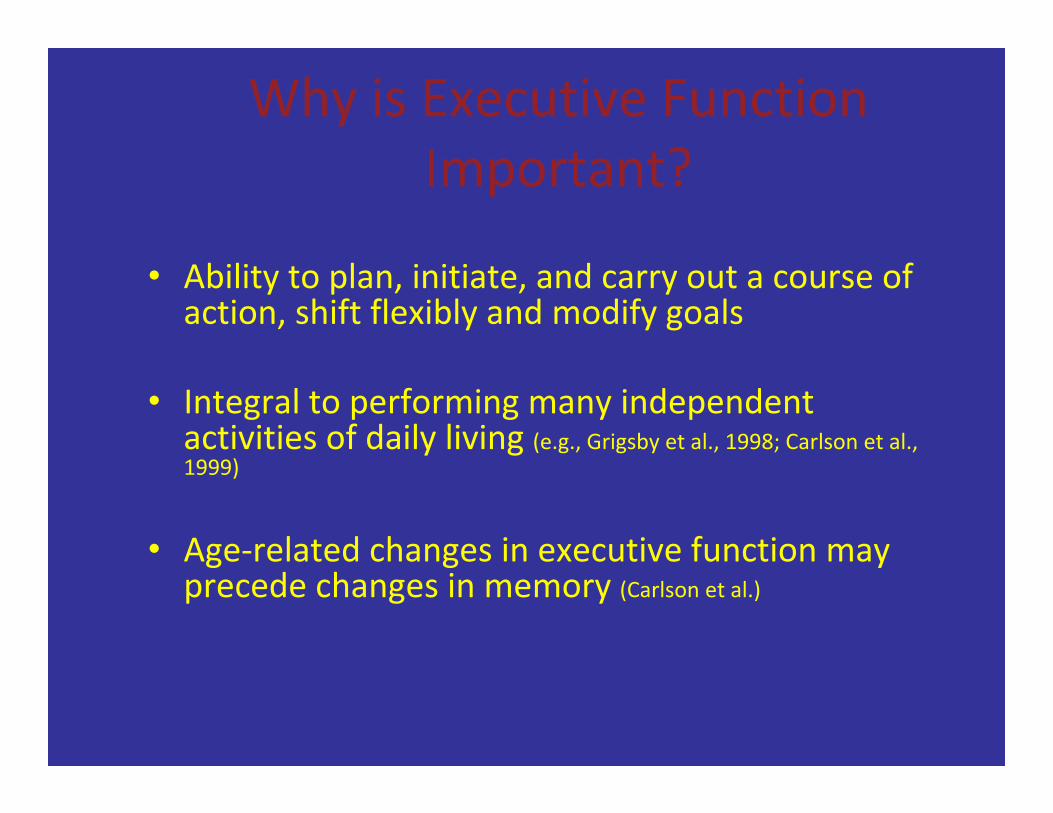
Why is Executive Function Important?
• Ability to plan, initiate, and carry out a course of
action, shift flexibly and modify goals
• Integral to performing many independent
activities of daily living (e.g., Grigsby et al., 1998; Carlson et al.,
1999)
• Age‐related changes in executive function may
precede changes in memory (Carlson et al.)

Large‐scale RCT of Experience Corps being conducted in Baltimore, MD
• Funded by NIA BSR, plus AmeriCorps, Weinberg
Foundation, MacArthur Foundation • Initiated Fall 2006
• Randomizing 600 people 60 years and older to EC or
low‐activity volunteering control;
• 20+ public elementary schools to EC; matched
controls
• Outcomes for older adults: physical disability,
mobility, frailty, fall risk, memory and intermediate
neurocognitive changes
• Outcomes for children: standardized scores;
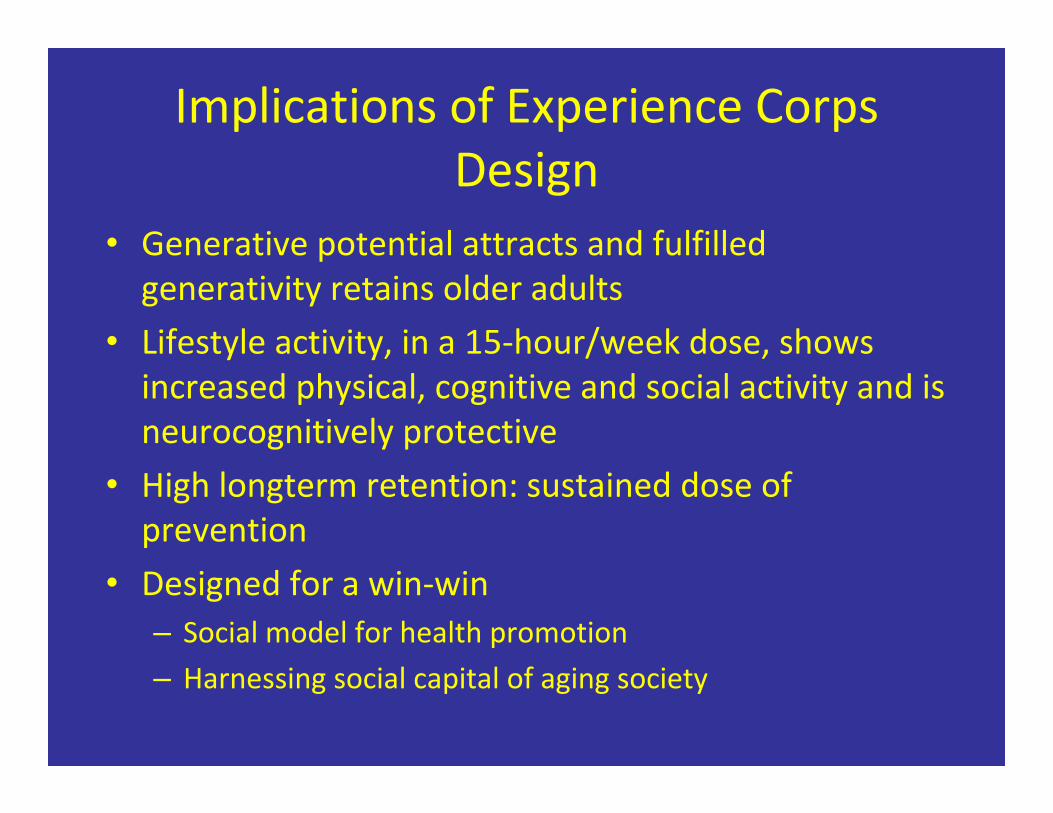
Implications of Experience Corps Design
• Generative potential attracts and fulfilled generativity retains older adults
• Lifestyle activity, in a 15‐hour/week dose, shows
increased physical, cognitive and social activity and is
neurocognitively protective • High longterm retention: sustained dose of
prevention
• Designed for a win‐win
– Social model for health promotion
– Harnessing social capital of aging society

New York: growing older • 2005, New York City
– 65 and older: 12% of New York City; 17% of some
neighborhoods
• 43% with some disability
• 18.1% poor (U.S. 9%)
• 12.1% poor and disabled (U.S. 5.5%)

Life course approach to healthy aging is essential
Chronic Disease & Susceptibility Over the Life Course
• Cumulative disease processes develop chronically and progressively over the life course
• Initiators, Promoters, Modifiers and Mediators are
active
• In many trajectories, exposure and intervention at any point can make a difference; however, there may be points of particular opportunity for prevention
• At different ages, additional age-specific issues emerge and may require unique interventions
“… the ills that flesh is heir to… it must be that many a taint grows
deeply, mysteriously grained in their being ...”
-Virgil, The Aeneid, 1st Century BCE

0 20
40
60
80
10
0
perc
ent
0 1 2 3 4 5 6 7 8 9
In full CHS cohort
Year since baseline
Difficulty in physical function: high energy tasks
Trends in the overall CHS cohort
dead severe moderate mild none


.4
.6
.8
1 pr
opor
tion
with
out d
iffic
ulty
-36 -30 -24 -18 -12 -6 +6 +12 +18 +24 +30 +36
Months before or after incident event
CHD CHF stroke random
Event
event Self-reported physical function: medium energy tasks
Compression of Morbidity:
Major public health goal for an aging
society

Life Course Across the Lecture
• Frederica Perera
– in utero environmental exposures and effects in
childhood and beyond
• Ezra Susser
– latent and transgenerational effects
• Bruce Link
– disparities and disease risk
• Linda Fried

Chronic Diseases Emerge Over the Life Course
0 40 80
Death
Symptoms
Subclinical Disease
Average Trajectory
Trajectory Under Conditions of Disadvantage
Trajectory Modified
Age
Health Biography of Older Age

Scenarios for Change in Population Burden of Illness/Disability
from 1990 to 2040 Active Life Life Expectancy Expectancy
78.8. years1990
Scenario 1: Stable Population Morbidity
2040 82.8 years
Scenario 2: Compression of Morbidity
2040 82.8 years
Scenario 3: Expansion of Morbidity
2040 82.8 years
Years of life free Years disabled of disability
(Active life expectancy) (Disabled life expectancy)
Compression of Morbidity:
Major public health goal for an aging
society • Push back development of disease and
disability to latest points in human life span
• Add “life to years”
Potential for Prevention and
Compression of Morbidity
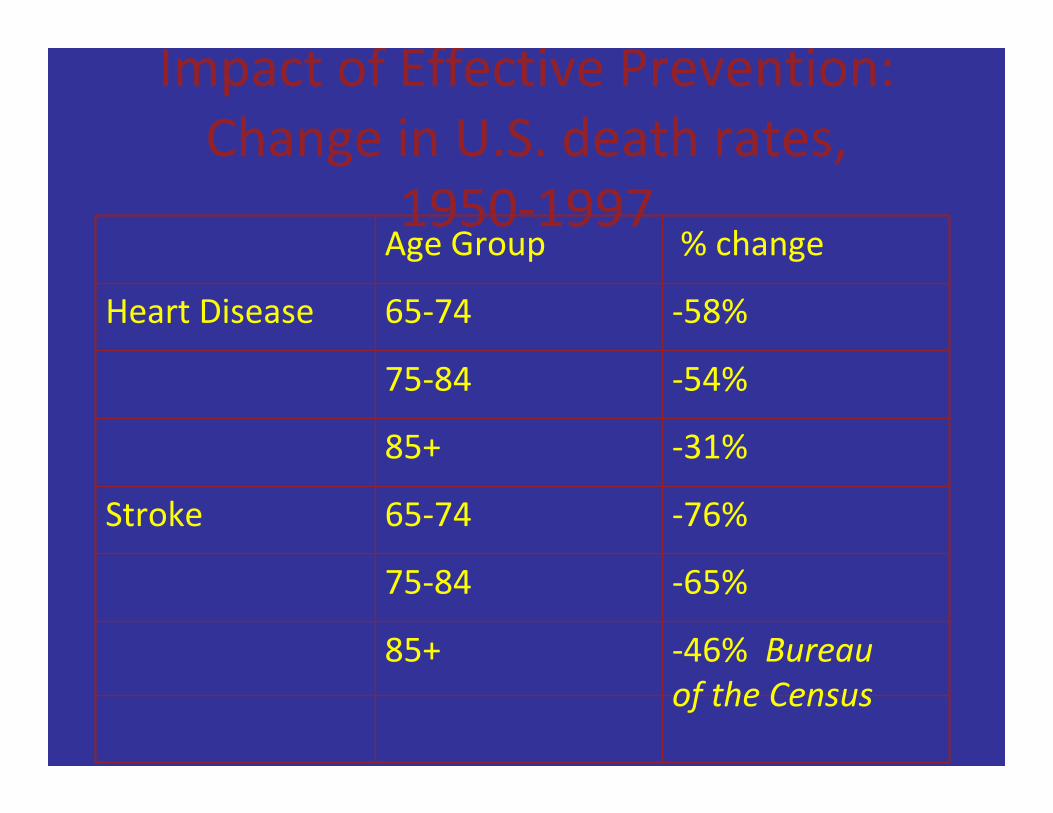
Impact of Effective Prevention: Change in U.S. death rates,
1950‐1997 Age Group % change
Heart Disease 65‐74 ‐58%
75‐84 ‐54%
85+ ‐31%
Stroke 65‐74 ‐76%
75‐84 ‐65%
85+ ‐46% Bureau
of the Census

Approaches Demonstrated: Prevention
or Treatment of Chronic Conditions
Med Tx/Prev Exercise
Arthritis + +
High Blood Pressure + +
Osteoporosis + +
Diabetes + +
Heart Attack + +
Angina + +
Cancer +
Lung Disease +
Stroke + +
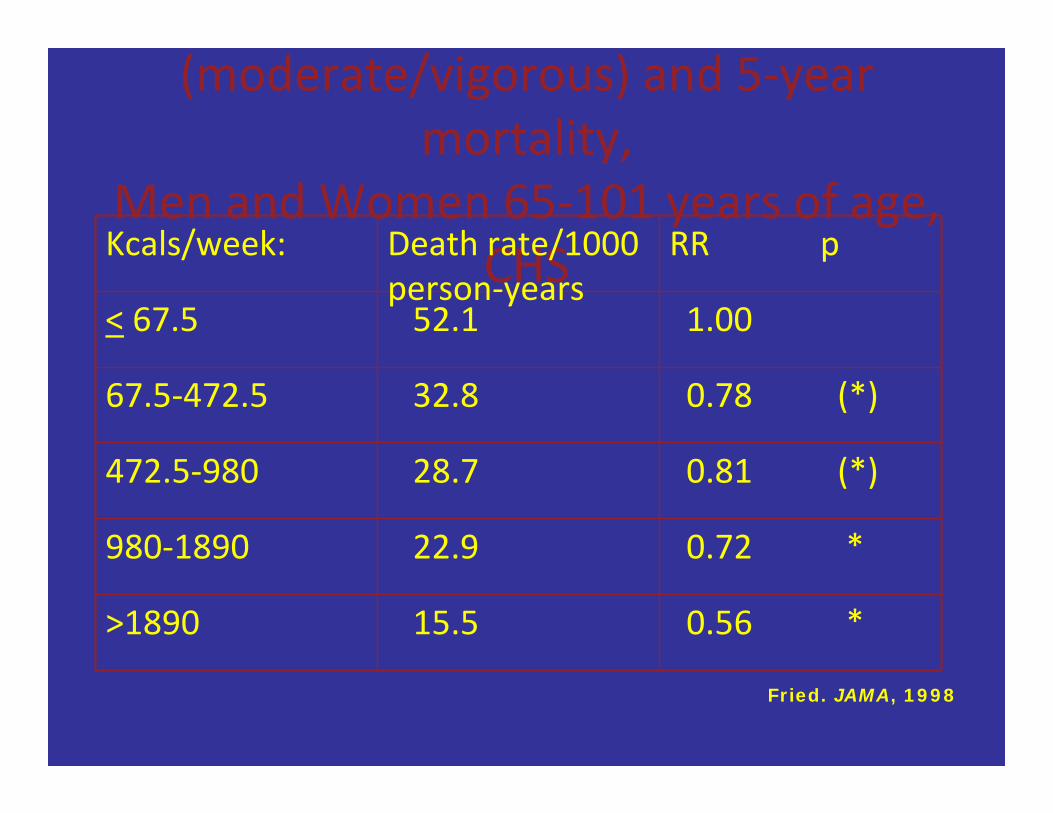
(moderate/vigorous) and 5‐year mortality,
Men and Women 65‐101 years of age,
Kcals/week: CHSDeath rate/1000 RR p
< 67.5
person‐years52.1 1.00
67.5‐472.5 32.8 0.78 (*)
472.5‐980 28.7 0.81 (*)
980‐1890 22.9 0.72 *
>1890 15.5 0.56 *
Fried. JAMA, 1998
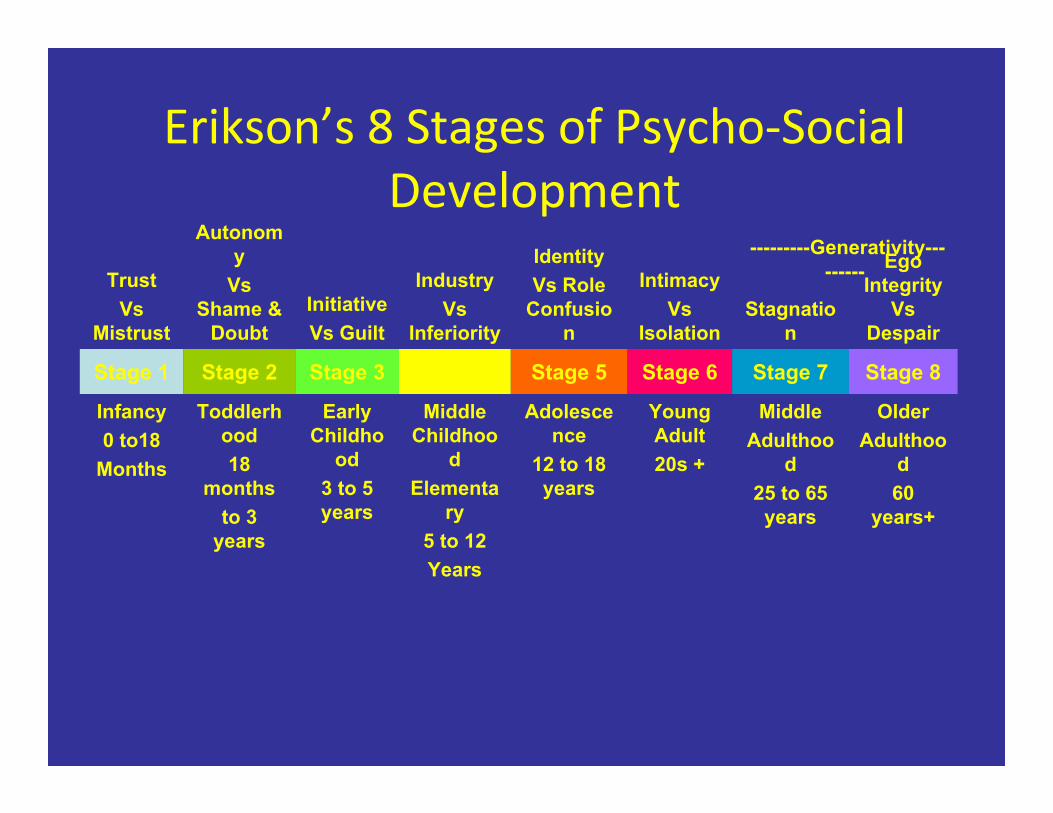
Erikson’s 8 Stages of Psycho‐Social Development
Trust Vs
Mistrust
Autonom y
Vs Shame &
Doubt Initiative Vs Guilt
Industry Vs
Inferiority
Identity Vs Role
Confusio n
Intimacy Vs
Isolation
---------Generativity---------
Stagnatio n
Ego Integrity
Vs Despair
Stage 4
Infancy 0 to18
Months
Toddlerh ood 18
months to 3
years
Early Childho
od 3 to 5 years
Middle Childhoo
d Elementa
ry 5 to 12 Years
Adolesce nce
12 to 18 years
Young Adult 20s +
Middle Adulthoo
d 25 to 65 years
Older Adulthoo
d 60
years+
Stage 1 Stage 2 Stage 3 Stage 5 Stage 6 Stage 7 Stage 8

• Goal: Healthy aging
• Opportunities for optimizing health and
wellbeing? • When to intervene?
Life course

Times of particular risk, of
development and of malleability • Perinatal
• Infancy
• Childhood
• Adolescence
• Young adulthood
• Middle age
• Young‐old
• Old‐old
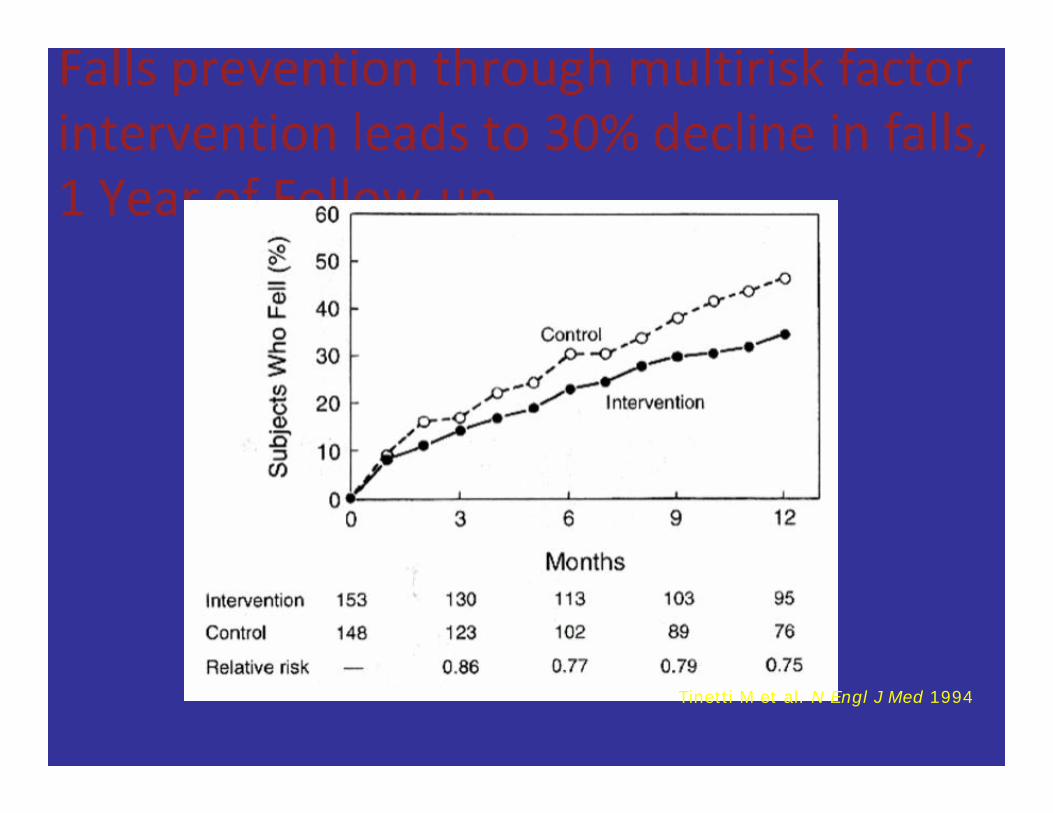
Falls prevention through multirisk factor intervention leads to 30% decline in falls,
1 Year of Follow‐up
Tinetti M et al. N Engl J Med 1994
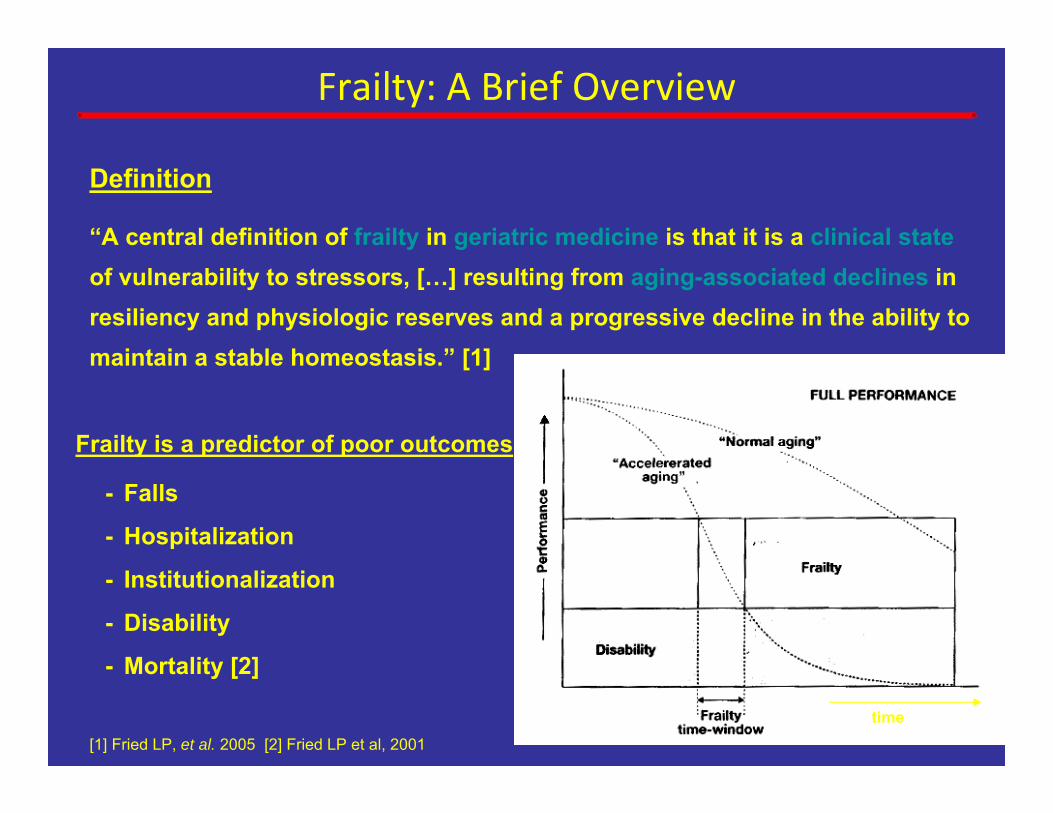
Frailty: A Brief Overview
Definition
“A central definition of frailty in geriatric medicine is that it is a clinical state of vulnerability to stressors, […] resulting from aging-associated declines in resiliency and physiologic reserves and a progressive decline in the ability to maintain a stable homeostasis.” [1]
[1] Fried LP, et al. 2005 [2] Fried LP et al, 2001
Frailty is a predictor of poor outcomes
- Falls
- Hospitalization
- Institutionalization
- Disability
- Mortality [2]
time
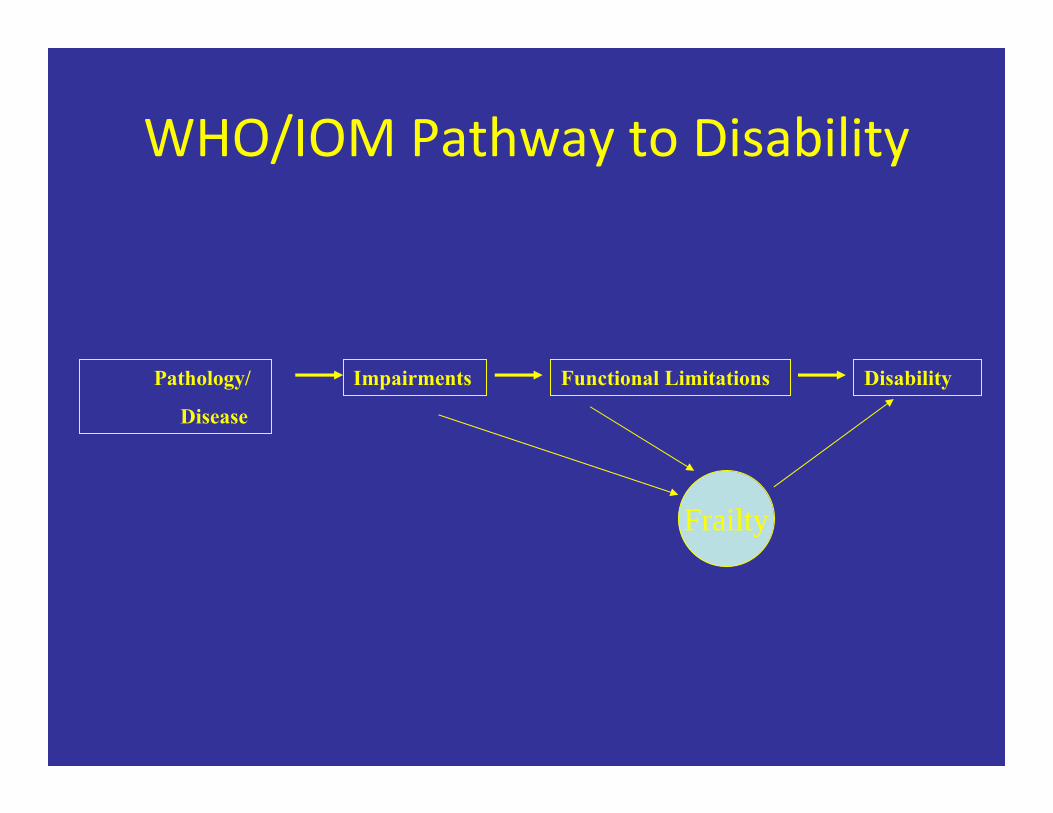
WHO/IOM Pathway to Disability
Pathology/
Disease
Impairments Functional Limitations Disability
Frailty
WHAT older adults DO affects their health…
• Activity and engagement
– Physical
– Social
• Networks, support
• Engagement;
• Regular structured activities
– Cognitive
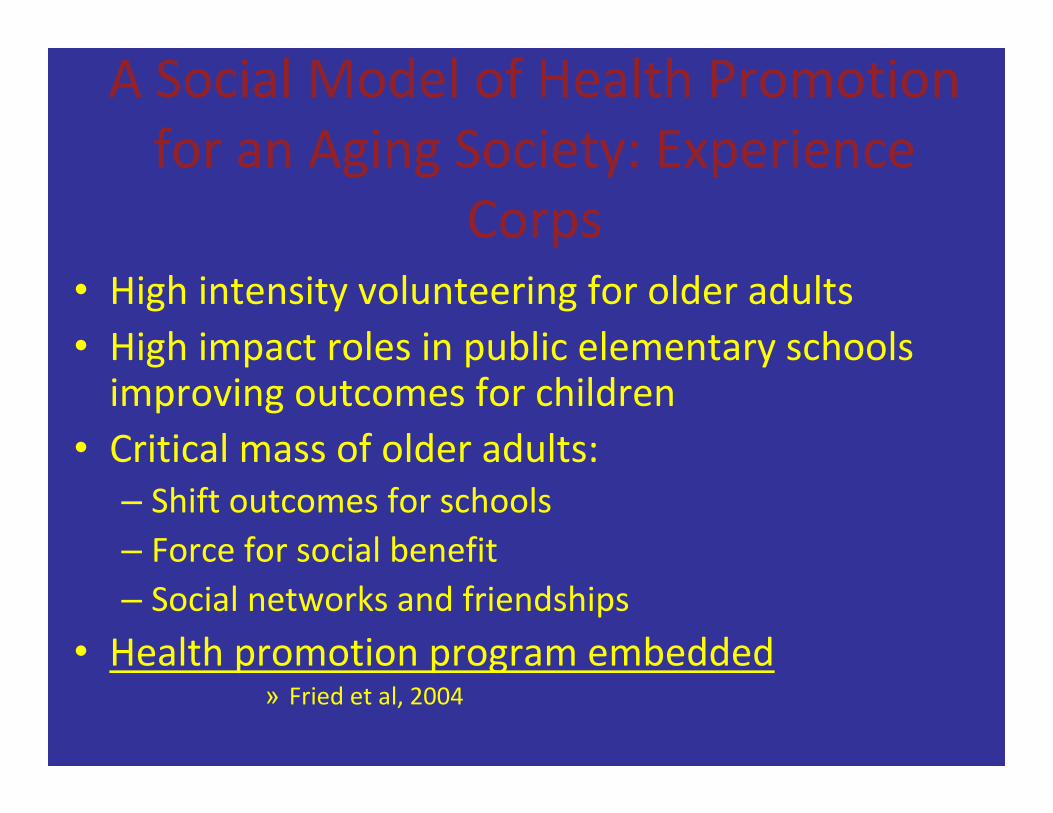
A Social Model of Health Promotion for an Aging Society: Experience
Corps
• High intensity volunteering for older adults
• High impact roles in public elementary schools
improving outcomes for children
• Critical mass of older adults: – Shift outcomes for schools
– Force for social benefit
– Social networks and friendships
• Health promotion program embedded
» Fried et al, 2004
Aging issues in HIV/AIDS • Frailty
• Multimorbidity
• Polypharmacy
• Disability

HIV and Aging
• Similarities between HIV and aging at the biological level
– T‐lymphopenia, decreased cellular immunity
– Replicative senescence of T‐lymphocytes
– Ï pro‐inflammatory markers (IL‐6, TNF‐α, IFN‐γ)
• Similarities between HIV and aging at the clinical level
– Sarcopenia, weight loss, wasting
– Cognitive disorders, dementia
– Rheumatologic disorders, decrease in bone mineral density
– Frailty‐like clinical presentation presaging death
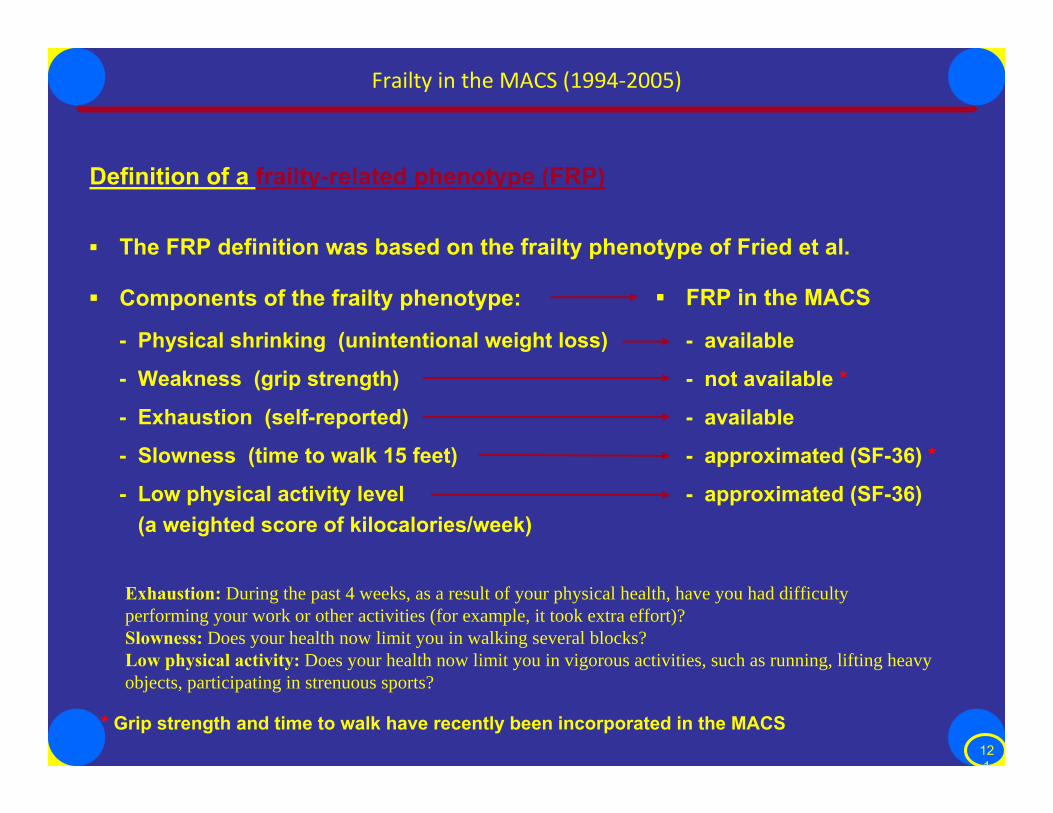
Frailty in the MACS (1994‐2005)
Definition of a frailty-related phenotype (FRP)
▪ The FRP definition was based on the frailty phenotype of Fried et al.
▪ FRP in the MACS▪ Components of the frailty phenotype:
- Physical shrinking (unintentional weight loss) - available
- Weakness (grip strength) - not available *
- Exhaustion (self-reported) - available
- Slowness (time to walk 15 feet) - approximated (SF-36) *
- Low physical activity level - approximated (SF-36) (a weighted score of kilocalories/week)
Exhaustion: During the past 4 weeks, as a result of your physical health, have you had difficulty
performing your work or other activities (for example, it took extra effort)?
Slowness: Does your health now limit you in walking several blocks?
Low physical activity: Does your health now limit you in vigorous activities, such as running, lifting heavy
objects, participating in strenuous sports?
* Grip strength and time to walk have recently been incorporated in the MACS 12 1
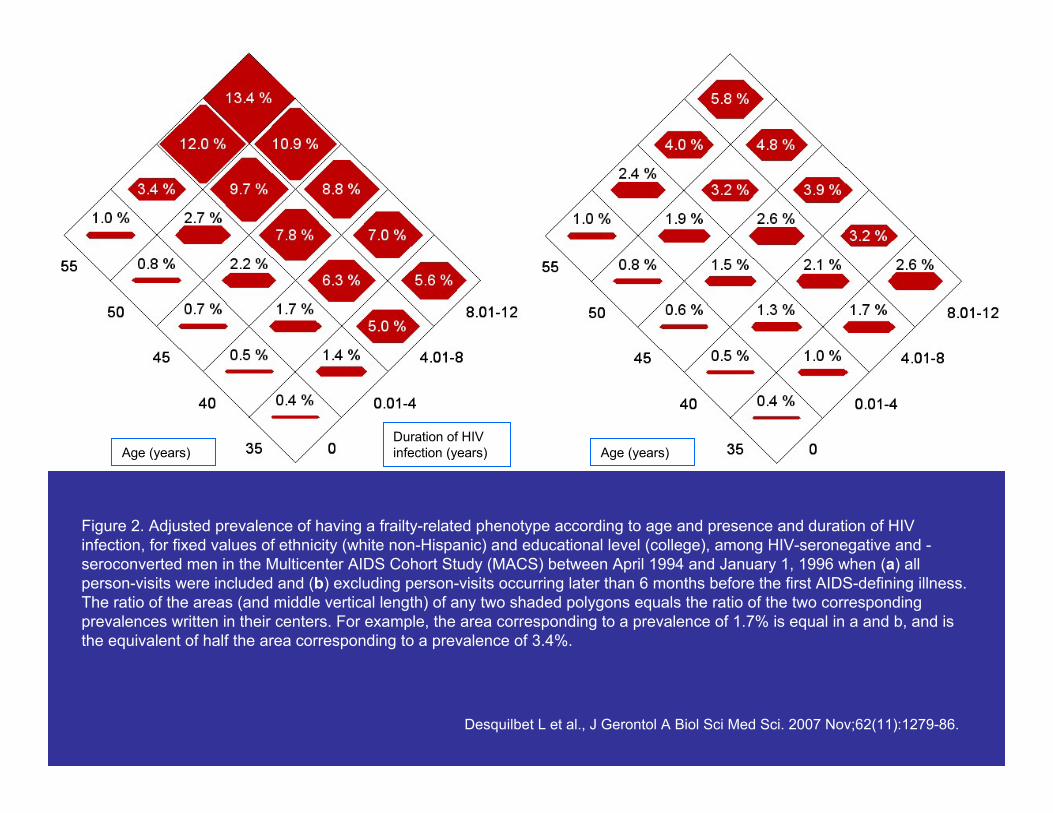
Duration of HIV infection (years)
Figure 2. Adjusted prevalence of having a frailty-related phenotype according to age and presence and duration of HIV infection, for fixed values of ethnicity (white non-Hispanic) and educational level (college), among HIV-seronegative and seroconverted men in the Multicenter AIDS Cohort Study (MACS) between April 1994 and January 1, 1996 when (a) all person-visits were included and (b) excluding person-visits occurring later than 6 months before the first AIDS-defining illness. The ratio of the areas (and middle vertical length) of any two shaded polygons equals the ratio of the two corresponding prevalences written in their centers. For example, the area corresponding to a prevalence of 1.7% is equal in a and b, and is the equivalent of half the area corresponding to a prevalence of 3.4%.
Desquilbet L et al., J Gerontol A Biol Sci Med Sci. 2007 Nov;62(11):1279-86.
Age (years) Duration of HIV infection (years) Age (years)
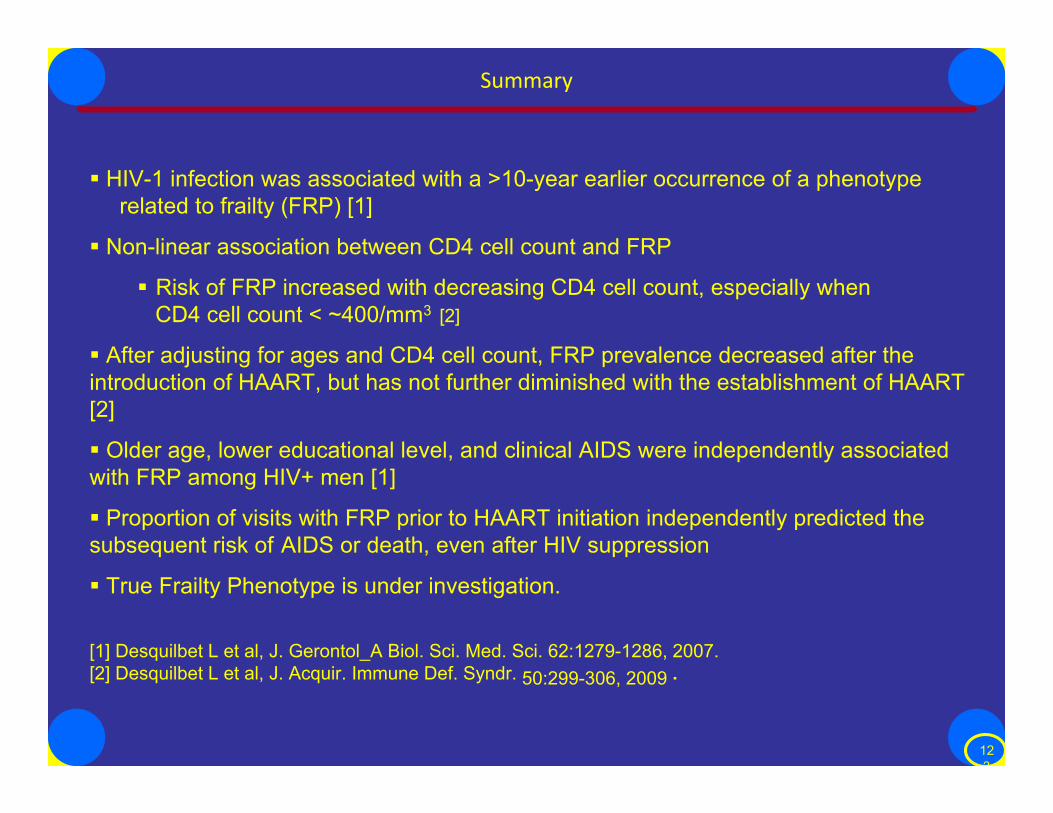
Summary
� HIV-1 infection was associated with a >10-year earlier occurrence of a phenotype related to frailty (FRP) [1]
� Non-linear association between CD4 cell count and FRP
� Risk of FRP increased with decreasing CD4 cell count, especially when CD4 cell count < ~400/mm3 [2]
� After adjusting for ages and CD4 cell count, FRP prevalence decreased after the introduction of HAART, but has not further diminished with the establishment of HAART [2]
� Older age, lower educational level, and clinical AIDS were independently associated with FRP among HIV+ men [1]
� Proportion of visits with FRP prior to HAART initiation independently predicted the subsequent risk of AIDS or death, even after HIV suppression
� True Frailty Phenotype is under investigation.
[1] Desquilbet L et al, J. Gerontol_A Biol. Sci. Med. Sci. 62:1279-1286, 2007. [2] Desquilbet L et al, J. Acquir. Immune Def. Syndr. 50:299-306, 2009 .
12 3
Completing the epidemiologic
transition: preventing chronic
disease ‐ associated with aging
Transitioning to a chronic disease
world
Chronic, progressive
Multifactorial etiology
Multilevel solutions
Both public health and medical care
Robust
Chronic Disease
Multiple Chronic Diseases
Frail
Disabled
Dependent
End of Life
Continuum of Geriatric Care Models Outpatient:Inpatient: Ambulatory Clinic/outpatient specialties
Acute Hospital
Geriatric AssessmentChronic Care NursingHome
HouseCall
PACE
Ambulatory
PalliativeCare
ACEUnit

Challenge: The Public Health System Not Ready for Aging
• Evidence on primary, secondary and tertiary
prevention for older adults not implemented
through public health • 20% of older adults in community isolated,
without access to care; ineffective links to
clinical care provision
• Responsibility for public and community
health for an aging population not allocated
Challenge: Public Health could
lead by designing an integrated
health system – that invests in
prevention
Public health and medical care in one
coordinated system

Building Blocks for Effective Health Promotion for an Aging Population
beyond Disease Focus
Primary, Secondary Prevention; Disease Management
Frailty Multimorbidity Falls Depression/ Loneliness
Polypharmacy Disability Health Disparities
Access to Care Widowhood Financial Resources
Environmental Stressors
1 Chronic Disease:
30%
Multiple
Chronic
Diseases:
50%
Frail: 7%
Disabled:
30%
Dependent
10-20%
End of Life
Time Age
Community‐based Continuum of Living
Robust 10-20%
Situations and Services: Matching Needs

Age‐Friendly City: Key Domains
• Housing
• Transportation
• Outdoor spaces and buildings • Social participation
• Civic engagement and employment
• Respect and social inclusion; address
ageism,fear • Communication and information re: services
• Community support and health services
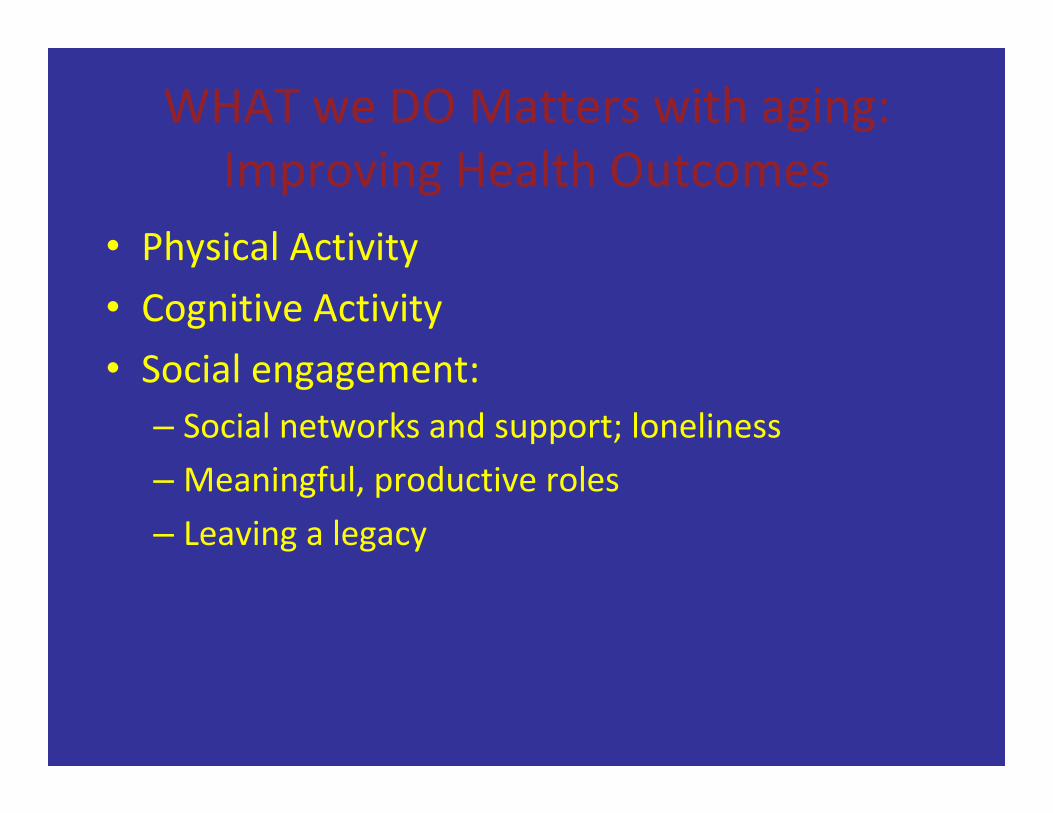
WHAT we DO Matters with aging: Improving Health Outcomes
• Physical Activity
• Cognitive Activity
• Social engagement:
– Social networks and support; loneliness
– Meaningful, productive roles
– Leaving a legacy
Population based studies: Lack of activity and engagement adversely affect health outcomes for older
adults.
• Social isolation
• Loneliness
• Non‐stimulating environments
• Sedentariness
• Little sense of purpose

Few meaningful roles for older adults
• At same time, society needs the contributions
of older adults:
– Only increasing natural resource
– Best educated cohort of older adults in history of
world
– Time, experience, wisdom
– Wanting to leave the world a better place
Ho: “generativity” is key to successful aging
• Leaving a legacy; Leaving the world better for
future generations (Erikson) – Productive, meaningful engagement
What if we could create new,
meaningful, generative ways for
people to stay engaged after
retirement ‐ and design them to
promote health?
A win‐win: target roles to societal unmet
needs
Public health for an aging society will benefit all of us
• Systems for health designed to prevent and
ameliorate chronic conditions • Healthy older adults; successful aging
• Healthy communities • Healthy cities
• Institutions that support continued
engagement and productivity with aging
• Strengthening win‐wins across generations
• Who we are as a society
Challenge: The Health Care System Not Ready for Chronic Care Needs of
Older Adults • Acute event‐based care in a chronic disease world
• Effective geriatric care not implemented or
reimbursed
– Community‐based coordinated continuum of care needed
• Prevention needs to be inserted into medical care
and linked to community‐based approaches
– Institute of Medicine. Retooling for an Aging America:
Building the Health Care Workforce, 2008

Robust
Chronic Disease
Multiple Chronic Diseases
Frail
Disabled
Dependent
End of Life
Continuum of Geriatric Care Models Outpatient:Inpatient: Ambulatory Clinic/outpatient specialties
Acute Hospital
Geriatric AssessmentChronic Care NursingHome
HouseCall
PACE
Ambulatory
PalliativeCare
ACEUnit
Challenge: The Public Health System Not Ready for Aging
• Evidence on primary, secondary and tertiary
prevention for older adults not implemented
through public health • 20% of older adults in community isolated,
without access to care; ineffective links to
clinical care provision
• Responsibility for public and community
health for an aging population not allocated

Challenge: Public Health could
lead by designing an integrated
health system – that invests in
prevention
Public health and medical care in one
coordinated system
Building Blocks for Effective Health Promotion for an Aging Population
beyond Disease Focus
Primary, Secondary Prevention; Disease Management
Frailty Multimorbidity Falls Depression/ Loneliness
Polypharmacy Disability Health Disparities
Access to Care Widowhood Financial Resources
Environmental Stressors


FIGURE 1. Estimated prevalences of a FRP as a function of CD4 T-cell count in the MACS for fixed values of age (45 years), fixed percentage for ethnicity (80% white non-hispanic), education (52% >=college), and prevalence of AIDS (20%), in the pre-HAART era (1994-1995; dotted line), introduction of HAART era (1996-1999; dashed line), and established HAART era (20002005; plain line). The curves for the 2 HAART eras do not differ significantly from each other, but both are significantly different from that of the pre-HAART era (see text for odds ratios and P values comparing the 3 different eras).
Desquilbet L et al. J Acquir Immune Defic Syndr. 2009 Mar 1;50(3):299-306
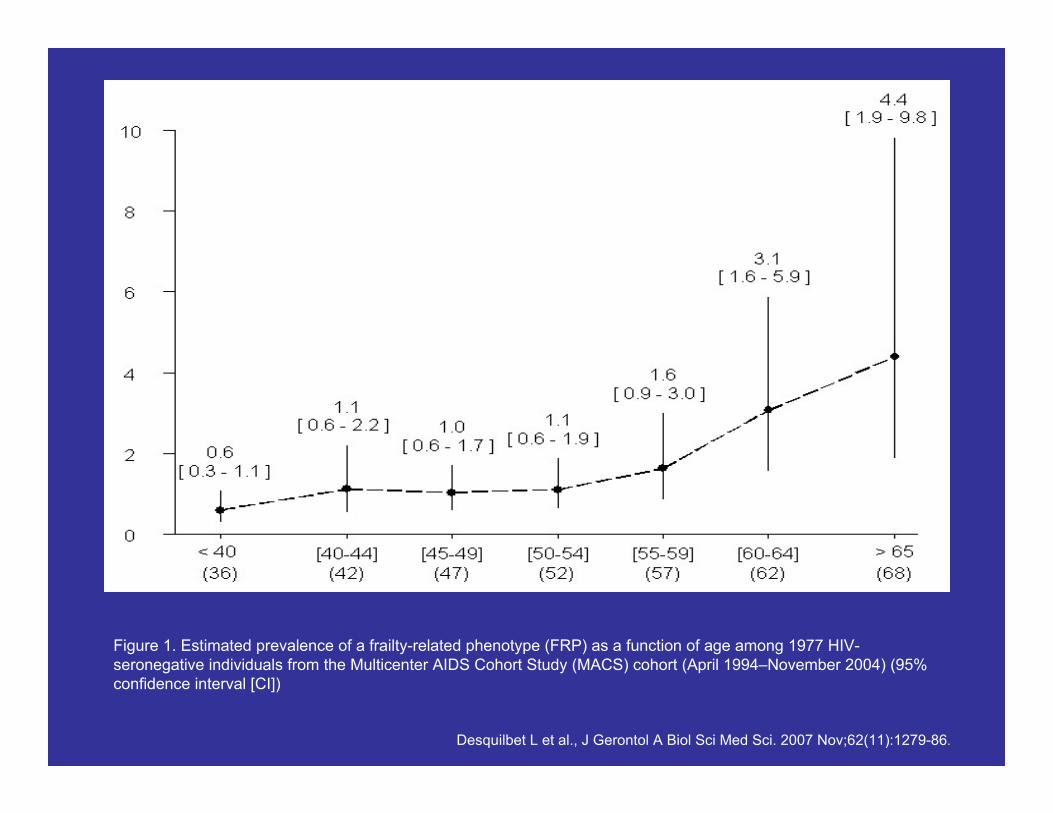
Figure 1. Estimated prevalence of a frailty-related phenotype (FRP) as a function of age among 1977 HIV-seronegative individuals from the Multicenter AIDS Cohort Study (MACS) cohort (April 1994–November 2004) (95% confidence interval [CI])
Desquilbet L et al., J Gerontol A Biol Sci Med Sci. 2007 Nov;62(11):1279-86.

Area Profile
New York State 2007
New York State Department of Health
Bureau of HIV/AIDS Epidemiology

Pe rsons* Ages 13 and Older,
Living with HIV/AIDS by Gender, Risk and Current Age New Yor k State
Male Female
100 N = 82,219 100 N = 36,892
80 80
13-24 25-49 50+
60
40
60
Perc
ent
40
2020
0
N=2,746 N=48,757 N=30,716 N=1,852 N=23,578 N=11,462
0 13-24 25-49 50+
Perc
ent
MSM IDU MSM/IDU Hetero Blood Pediatric Unk/Under Investigation
NYSDOH/BHAE * Includes prisoners.
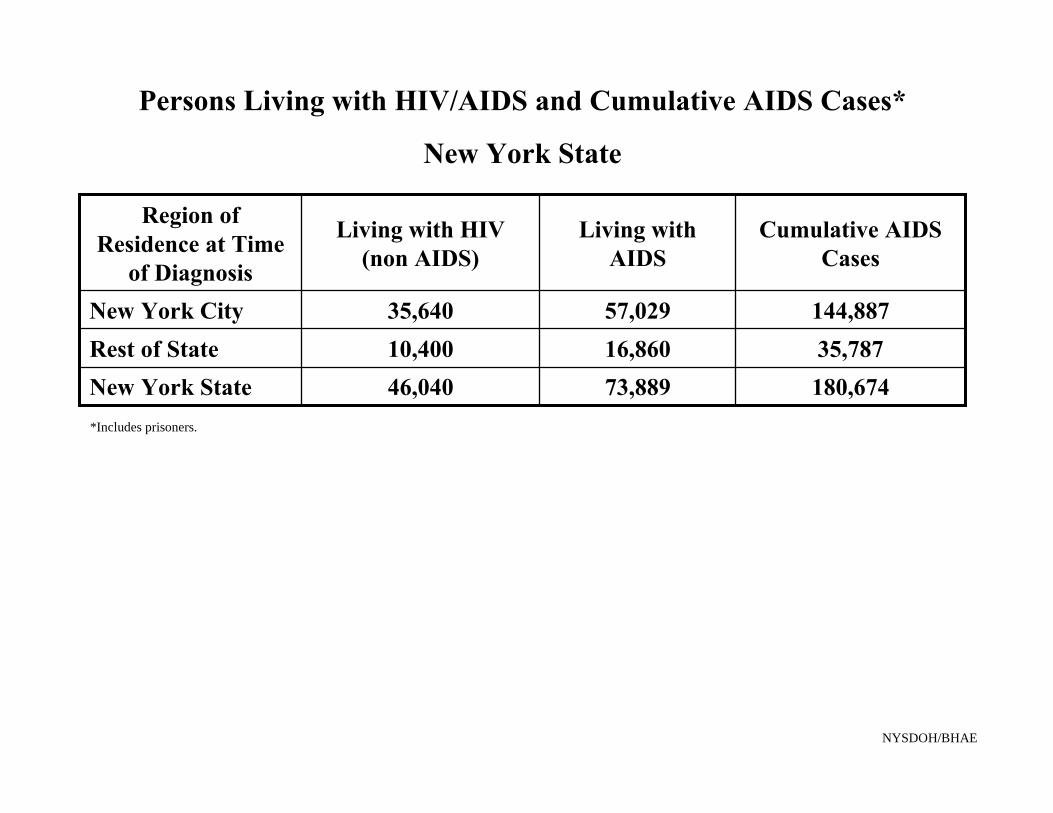
Persons Living with HIV/AIDS and Cumulative AIDS Cases* New York State
Region of Residence at Time
of Diagnosis
Living with HIV (non AIDS)
Living with AIDS
Cumulative AIDS Cases
New York City 35,640 57,029 144,887 Rest of State 10,400 16,860 35,787 New York State 46,040 73,889 180,674 *Includes prisoners.
NYSDOH/BHAE

Estimated numbers of persons living with HIV/AIDS, by year and selected characteristics, 2004–2007—34 states and 5 U.S. dependent areas with confidential name‐based HIV infection reporting (Numbers derived from Table 9)
Age 2004 2005 2006 2007
50–54 53,903 60,030 67,082 74,582
55‐59 28,077 33,023 38,186 43,985
60‐64 13,363 15,309 17,705 20,962
≥65 10,512 12,361 14,363 16,982
105855 120,723 137,336 156,511
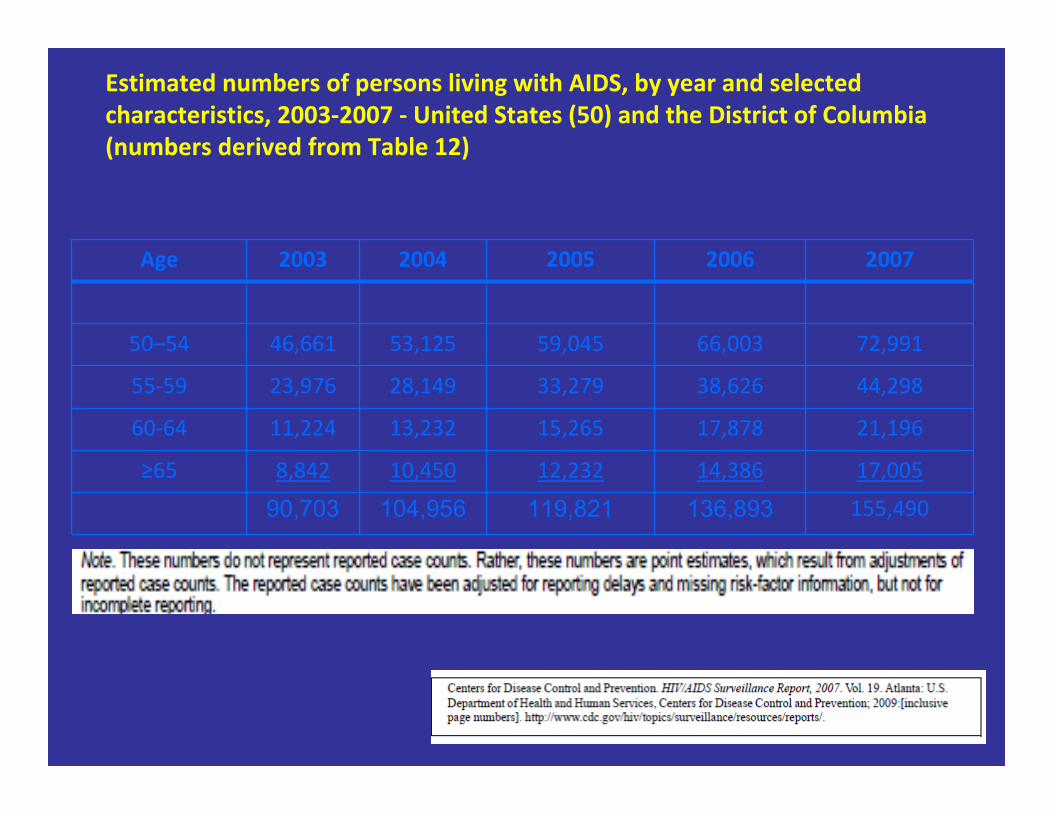
Estimated numbers of persons living with AIDS, by year and selected
characteristics, 2003‐2007 ‐ United States (50) and the District of Columbia (numbers derived from Table 12)
Age 2003 2004 2005 2006 2007
50–54 46,661 53,125 59,045 66,003 72,991
55‐59 23,976 28,149 33,279 38,626 44,298
60‐64 11,224 13,232 15,265 17,878 21,196
≥65 8,842 10,450 12,232 14,386 17,005
90,703 104,956 119,821 136,893 155,490

Frailty and HIV in the Multicenter AIDS
Cohort Study (MACS)
Joseph B. Margolick, L. Desquilbet, L. P.
Fried, L. P. Jacobson

Studies of a Frailty-Related Phenotype in the MACS
4 4954 MSM followed semiannually since 1984 4 The FRP was present if ≥ 3 of the above 4 components were
answered “yes” (#1 and #2) or “yes, limited a lot” (#3 and #4) 4 Covariates: Age, Education, Ethnicity, CD4 cell count, HIV RNA 4 Study population
• MACS individuals enrolled before 1996 • Seroconverter and seroprevalent men • ≥ 1 measurement of CD4 cell count between visit 21 and visit 41
4 Visits: • All HIV+ visits between visit 21 and visit 41
4 Final study population: N = 1045 (N person-visits = 12,916) • 98 men had no measurement of CD4 count
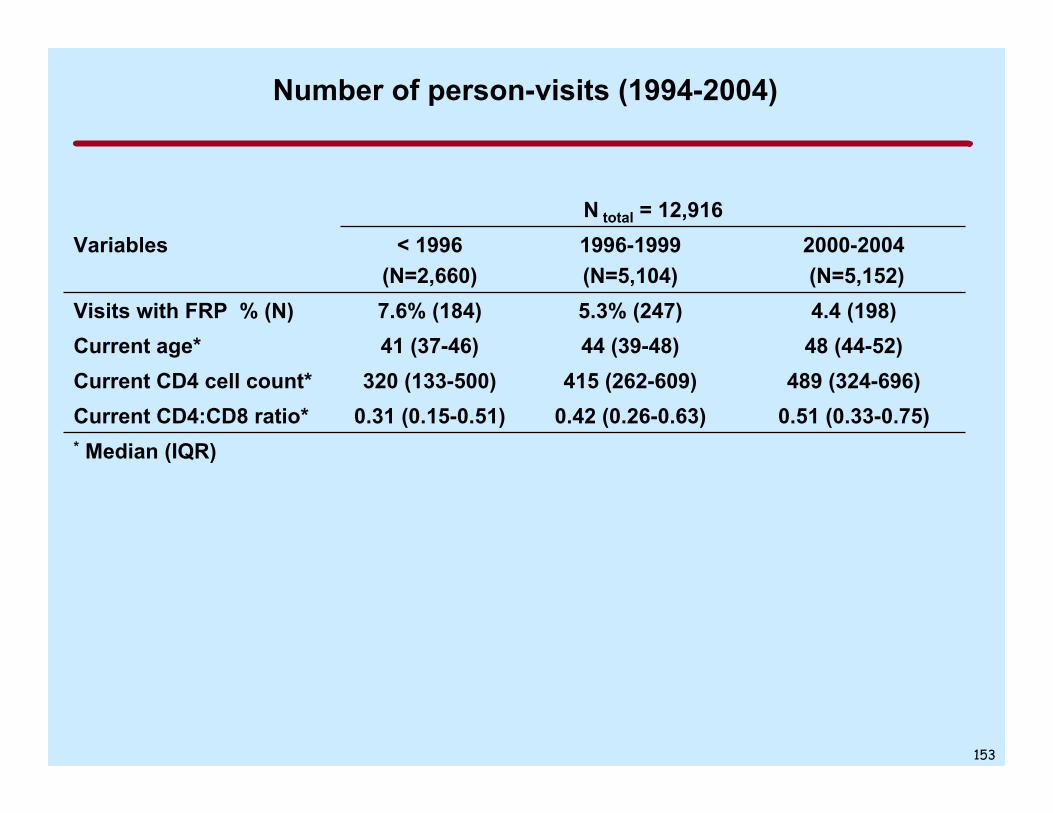
Number of person-visits (1994-2004)
N total = 12,916 Variables < 1996 1996-1999 2000-2004
(N=2,660) (N=5,104) (N=5,152) Visits with FRP % (N) 7.6% (184) 5.3% (247) 4.4 (198) Current age* 41 (37-46) 44 (39-48) 48 (44-52) Current CD4 cell count* 320 (133-500) 415 (262-609) 489 (324-696) Current CD4:CD8 ratio* 0.31 (0.15-0.51) 0.42 (0.26-0.63) 0.51 (0.33-0.75) * Median (IQR)
153

(95%
CI)
Relationship between CD4 T-cell count and Prevalence of
Frailty-Related Phenotype, by Calendar Period
0
5
10
15
20
% F
RP
------ 1994-1995
_ _ _ _ 1996-1999
_____ 2000-2005
0 100 200 300 400 500 600 700 800 900 1000
CD4 T-cell count (cells/µl)
Desquilbet L et al, 2009; J. Acquir. Immune Def. Syndr. 50:299-306

Effect of Age Decreases for
Low CD4 T-Cell Counts
Prev
alen
ce (%
) of F
RP
[95%
CI]
14
10
6
2
Established HAART era
40 years old
55 years old
Estimated % 95% CI
100 200 300 400 500 600 700 800 900 1000
CD4 T-cell count (cells/mm3)

Time to AIDS or Death After Starting HAART, by Presence or Absence of a Frailty-Related Phenotype

Acknowledgements
4 Multicenter AIDS Cohort Study (MACS) • J. Phair (Chicago) • R. Detels, B. Jamieson
(Los Angeles) • L. Jacobson
(Baltimore)
• C. Rinaldo, M. Holloway (Pittsburgh)
4 Columbia Mailman School of Public Health • L. Fried
4 Parisian National Veterinary School • L. Desquilbet
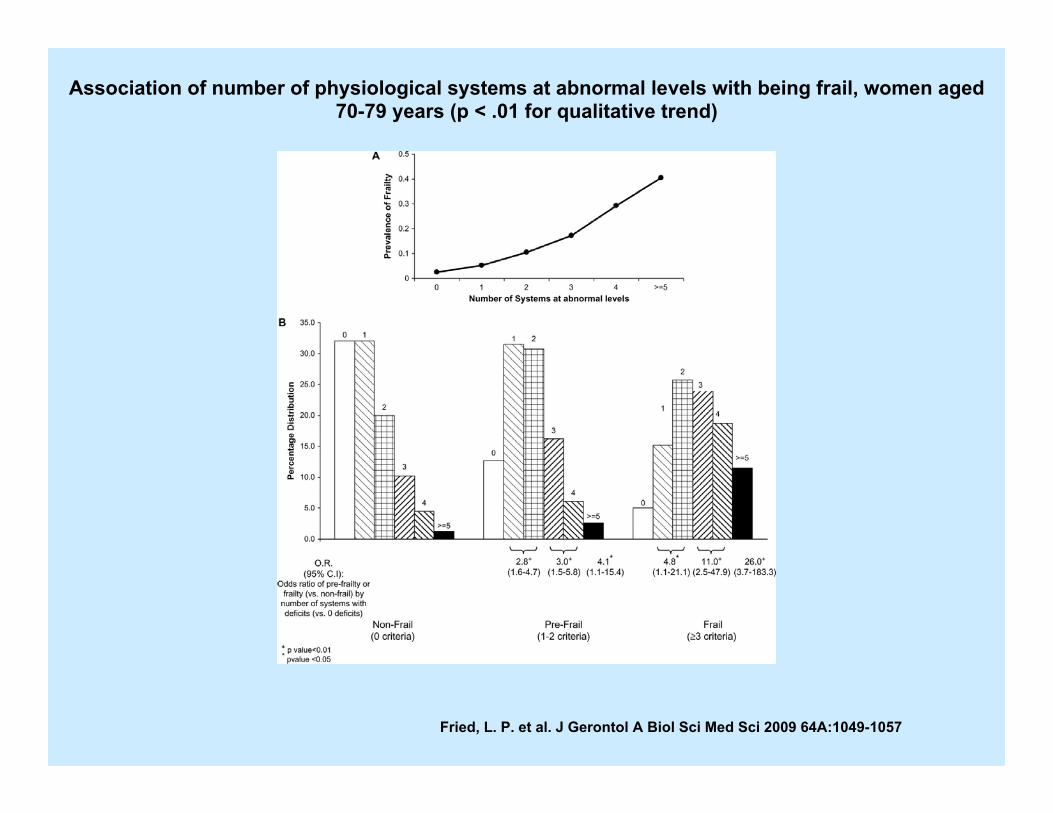
Association of number of physiological systems at abnormal levels with being frail, women aged
70-79 years (p < .01 for qualitative trend)
Fried, L. P. et al. J Gerontol A Biol Sci Med Sci 2009 64A:1049-1057

-
25
30
Observed FRP prevalence according to CD4 count%
20
15
10
5
0 < 50 50 100- 150- 200- 250- 300- 350- 400- 450- 500- 550- 600- 650- 700- 750- 800- 850- 900- > 950
100 150 200 250 300 350 400 450 500 550 600 650 700 750 800 850 900 950
< 1996
1996-1999
2000-2004
(1994-2004)
FRP 86 22 8 10 14 7 5 7 5 1 2 4 0 0 0 0 1 0 1 1 174 < 1996
Total 322 155 131 152 151 179 165 165 163 156 116 104 71 69 38 41 25 24 19 76 2322
1996- FRP 34 26 22 14 27 18 25 10 14 8 9 3 7 0 2 4 0 4 1 2 230
1999 Total 169 152 204 246 294 351 398 350 345 330 297 227 219 205 145 132 102 99 55 221 4541
2000- FRP 9 13 9 13 17 12 18 13 10 13 8 9 6 5 6 6 4 2 4 5 182
2004 Total 70 68 97 180 222 266 348 310 336 325 280 271 252 208 172 155 124 131 103 389 4307 159

Effect of FRP status at HAART Initiation on Outcomes ▪ Among AIDS-free men
Outcomes n (%)
No outcome
AIDS/death
Among AIDS/death
AIDS
Death with no previous AIDS
FRP prior to HAART1
No (n=475) Yes (n=36)
394 (83) 22 (61)
81 (17) 14 (39)
54 (67) 8 (57)
27 (33) 6 (43)
Total (n=511)
416 (81)
95 (19)
62 (65)
33 (35)
FRP, frailty related phenotype 1 within a 3-year period prior to HAART
▪ Among AIDS-diagnosed men
Outcome n (%)
No outcome
Death
FRP prior to HAART1
No (n=91) Yes (n=50)
71 (78) 29 (58)
20 (22) 21 (42)
Total (n=141)
100 (71)
41 (29)
FRP, frailty related phenotype 1 within a 3-year period prior to HAART 160


Current HAART Era: Age Issues 4 Immunologic mechanisms leading to worse HIV disease
• Decreased T-cell replacement • Decreased cellular response to HAART • Decreased function on a per lymphocyte basis • Dysregulation leading to impaired responses • Exacerbation of normal age-related immune deterioration
‒ Immune activation (remains present on HAART) 4 Non-immunologic mechanisms leading to worse prognosis
• Frailty- may have immunologic basis even without HIV • Age-related morbidities
‒ Interactions with HAART
4 Possibility of immune-modulatory therapy for HIV 4 Vaccine responses
• HIV • Others
(Margolick, JB, unpublished)