a prosperity index model of regional tourism industry
TRANSCRIPT

Abstract: In recent years, the ice and snow tourism
industry has developed rapidly, which plays an important
role in boosting regional economy. The prosperity index of
the ice and snow tourism industry was compiled, and the
early warning model of the ice and snow tourism industry
in Heilongjiang Province of China was built, which was
taken as a comprehensive scale to observe the fluctuation
of the ice and snow tourism industry. Combined with the
current economic situation, the composite index, the
situation of the industry and the turning point of the
industry cycle volatility are analyzed, to determine the
situation and trend of the industry volatility. This can
provide reference for the policy formulation of the ice and
snow tourism industry in Heilongjiang province and the
micro-management of tourism companies.
Keywords—Heilongjiang Province of China, ice and
snow tourism, composite index, early warning.
I. REVIEW OF RESEARCH STATUS ce and snow tourism is a highly participatory, experiential and stimulating activity, which integrates aesthetic
experience, fitness and entertainment, and is deeply loved by tourists. Ice and snow tourism contains three main parts. The first is sightseeing-style ice and snow tourism, including natural ice and snow landscapes—snow mountains, snowfields, artificial ice and snow landscapes—snow sculptures and ice lanterns; the second is ice and snow sports tourism, including skiing, skating, winter swimming, ice and snow football and other leisure sports activities; the third is ice and snow entertainment tourism, including items such as ice sledge and dog sledding. The development of ice and snow tourism industry can promote the development of transportation industry, hotel industry, catering industry, entertainment industry, environmental protection industry and other industries, and has a direct and indirect role in promoting the economy. Due to the unique geographical location and climate
characteristics of Heilongjiang Province, the ice and snow tourism industry is developing well. At present, three types of ice and snow tourism projects, including ice sculpture, snow sculpture, and skiing, have exerted great influence at home and abroad. In 1985, Harbin Ice and Snow Festival, the first national ice and snow activity project, was established in Harbin, Heilongjiang Province of China, and became one of the four world famous ice and snow festivals. Ice and snow tourism has become a new economic growth point in Heilongjiang Province. The work report of Heilongjiang Provincial government in 2015 pointed out that "in winter, we mainly promote the characteristic advantages of ice and snow, highlighting the important selling points such as Harbin Ice and Snow World, Snow Town and Yabuli Skiing".
At present, more and more researchers are paying attention to ice and snow tourism in Heilongjiang Province and have achieved certain research results. Scholars' research on ice and snow tourism in Heilongjiang province mainly focuses on the analysis and evaluation of tourism resources and tourism market development.
HuiqiuGuo and Guang Meng proposed to use ice and snow tourism to promote the economic development of Heilongjiang Province. At the same time, they proposed to consider the establishment of industrial development fund and reduce the entry threshold of the industry, so as to guide social funds to invest in the ice and snow tourism industry and other measures to speed up the industrial development process[1]. Limei Zhang used economic models in "Ice and Snow Tourism Planning" to study the development strategies of the ice and snow industry in Heilongjiang Province[2]. Changbo Shi pointed out that it is necessary to analyze the advantages and disadvantages based on the unique ice and snow resources, and transform resource advantages into advantages for promoting economic development[3]. From the perspective of the government, Shan Zhan et al. proposed that Heilongjiang Province should develop ice and snow tourism under the objective reality of economy, society, environment and resources, and insist on sustainable development[4].
Zuobin Zhang et al. suggested that winter tourism should be raised to the same height as summer tourism, and the two should be developed and supported simultaneously, and the
A Prosperity Index Model of Regional Tourism Industry Based on Composite Index
Dandan Qi1, Jingwen Fang2, Jiaxin Liu2, Qinglin Zhou3, Ping Han2 1Institute of Economic History, Harbin University of Commerce, Harbin, China
2School of Economics, Harbin University of Commerce, Harbin, China 3Financial Department, Harbin University of Commerce, Harbin, China
*Corresponding author is Ping Han: [email protected]
I
INTERNATIONAL JOURNAL OF CIRCUITS, SYSTEMS AND SIGNAL PROCESSING DOI: 10.46300/9106.2021.15.10 Volume 15, 2021
E-ISSN: 1998-4464 80
Received: November 28, 2020. Revised: January 30, 2021. Accepted: February 9, 2021. Published: February 11, 2021.

policy of snow and ice tourism should be moderately tilted[5]. Dalin Luo proposed to broaden financing channels to
promote financing of the ice and snow tourism industry, and set up an ice and snow tourism investment fund to attract more funds from all aspects of society, thereby optimizing the investment structure and promoting the combination of ice and snow assets[6]. Xianren Sun analyzed the location and transportation disadvantages, human capital disadvantages and operating mechanism disadvantages of the ice and snow tourism industry in Heilongjiang Province, and proposed strategies for fostering competitive advantages, optimizing industrial structure, creating high-quality products, and cultivating professional talents[7]. Weiwei Wu, Yexin Liu, et al. constructed an evaluation index system and evaluation model for the competitiveness of the ice and snow tourism industry, and carried out a comprehensive and systematic evaluation of the competitiveness of the ice and snow tourism industry in Heilongjiang Province[8]. Shumei Xu et al. used AHP analytic hierarchy process to analyze the ice and snow tourism development strategy and policy measures in Heilongjiang Province by combining qualitative and quantitative analysis, and put forward the ice and snow tourism development strategy in Heilongjiang Province[9]. Mengdi Zhai used the time series of Heilongjiang Province's ice and snow tourism revenue and gross domestic product (GDP) from 1986 to 2014 as indicators to measure ice and snow tourism and regional economic growth. At the same time, she used co-integration theory to analyze Granger causality and finally built a VARX model. And she quantitatively studied the long-term equilibrium relationship and short-term change trend between ice and snow tourism and regional economic growth in Heilongjiang Province[10].The above researche have a wide range of directions and content, involves a relatively large area. These studies are mostly qualitative analysis, and mainly focus on the analysis and evaluation of ice and snow tourism resources and tourism market development. There are also some researche on the problems and solutions in the ice and snow tourism industry from the management level. However, the overall analysis of the ice and snow tourism industry in Heilongjiang province from the perspective of quantitative analysis results are few, even more lack of in-depth quantitative analysis.
In addition to long-term growth, the total economic volume of the ice and snow tourism industry has also shown greater volatility. The management of ice and snow tourism is mainly ex-post management, lacking necessary monitoring means and proactive prospective management. Therefore, it is necessary to have an overall grasp of the medium and long-term development trend of ice and snow tourism in Heilongjiang province, to establish an effective monitoring system. According to the relevant data of snow and ice tourism in Heilongjiang province, it is suitable for the development of ice and snow tourism industry in Heilongjiang to study by the method of compiling the industry prosperity index. Compiling the industry prosperity index can not only make an effective prediction and early warning of the operating trend of Heilongjiang's ice and snow tourism industry, but also provide
technology and early warning for preventing industry risks before a major economic turning point and do a good job of corresponding risk prevention. So far, no one has done any research in this area. By refining the key indicators and analyzing the cyclical changes in the development of ice and snow tourism reflected in the prosperity index, it can not only provide some reference for making more scientific and reasonable economic policies, but also provide macro guidance for enterprises to make micro decisions. At the same time, it can also provide a basis for travel agencies or restaurants to formulate regulations and development strategies, and even provide some help for investors to enter or exit the industry in a timely manner.
II. PROSPERITY INDEX RESEARCH DESIGN A. The Research Methods
The prosperity index is a quantitative method to process and summarize the qualitative indicators in the survey, to comprehensively reflect the status or development trend of a specific survey group or a certain socio-economic phenomenon. This is a systematic method, which includes the functions of various models. In 1946, the National Bureau of Economic Research developed the Diffusion Index (DI)[11]. In 1967, the National Bureau of Economic Research and the U.S. Department of Commerce collaborated to develop a composite index (CI) to monitor economic fluctuations[12]. The improvement of CI compared with DI is to reflect the fluctuation trend of the business cycle and the amplitude of the business cycle fluctuation, make up for the shortcomings of DI. In 1984, the Japan Economic Planning Agency (EPA) compiled a composite index to measure the activity state of the Japanese economy[13].
In China, the prosperous research in the field of tourism is relatively late. In 2006, Hui Zhang compiled the Tourism prosperity index of Shichahai Scenic spot. Dai Bin et al. then studied the hotel, travel agency and other industries[14]. The media center which called Bang Zhong Bang compiled the prosperity index of domestic travel destinations and the prosperity index of outbound travel destinations. The China Tourism Academy conducted a questionnaire survey on the travel agency industry across the country on a quarterly basis and analyzed the prosperity index of travel agencies. In 2007, Xia Yan and Xuan Huang conducted a research on the method of using the prosperity index of Chinese hotels[15]. In 2009, Ping Lei compiled an analysis circle on the prosperity of the inbound tourism market for foreign tourists[16]. In 2011, Jian Yang conducted a research on the prosperity index of Henan travel agency industry[17].
In 2013, Chengcai Tang analyzed and studied the prosperity index of Beijing inbound tourism market[18]. PingGao has carried on the construction and the empirical study to the Shanghai tourism market monitoring index[18]. In recent years, more and more achievements have been made in the study of tourism industry by using the method of prosperity index, which provides us with experience[19]. B. Data Selection and Preprocessing
Prosperity index analysis of the data has more stringent
INTERNATIONAL JOURNAL OF CIRCUITS, SYSTEMS AND SIGNAL PROCESSING DOI: 10.46300/9106.2021.15.10 Volume 15, 2021
E-ISSN: 1998-4464 81

requirements, it needs continuous data. As the ice and snow tourism industry is restricted by seasons and regions, the ice and snow tourism in Heilongjiang Province is mainly concentrated in the four months of January, February, November, and December. It is difficult to obtain weekly and monthly data. Therefore, the measurability of indicators and data are considered. We mainly select annual data to compile the prosperity index of the ice and snow tourism industry in Heilongjiang Province.
The sample data selected in this article are statistical data of important economic indicators closely related to the ice and snow tourism industry in Heilongjiang Province from 2000 to 2016, such as CPI, RMB savings deposits of urban and rural residents, RMB exchange rate, fixed assets of star-rated hotels, tens of thousands of domestic Number of tourists,f oreign inbound tourists, total operating revenue of star-rated hotels, operating revenue of tourist scenic spot in Heilongjiang, total revenue from ice and snow tourism during the Spring Festival Golden Week in Heilongjiang Province, the number of ice and snow tourism in heilongjiang province, passenger traffic, etc. Taking the year 2000 as the benchmark date, this paper analyzes the relevant statistical data of the ice and snow tourism market in Heilongjiang. And finally constructs the prosperity index system of the ice and snow tourism industry in Heilongjiang. The data mainly comes from the "China Statistical Yearbook", "China Tourism Statistical Yearbook", "Heilongjiang Province Statistical Yearbook", "China Tourism Statistical Yearbook (copy)", etc. The slightly missing data are supplemented by data from the website of China Tourism Administration and Heilongjiang Provincial Tourism Administration[20]. C. Selection of Benchmark Indicators
By using the method of collecting indicators with dragnet, all the factors that affect the prosperity indicators of Heilongjiang's tourism industry are listed and 30 effective indicators are selected in total. As shown in Table 1, 2 and 3. Use the HDI historical diffusion index to initially calculate the benchmark date. The prosperity index is based on the time difference between the prosperity variables to refer to the trend of the recession. It is mainly divided into leading indicators, synchronous indicators and lagging indicators. Before determining the index classification, the benchmark cycle index should be determined first. By combining with the actual situation, the cycle of important indicators is taken as the benchmark cycle, and this index is taken as the benchmark index. Total revenue is an important indicator that reflects the benchmark cycle of commercial economic fluctuations, which is the dominant indicator in the index system and a synchronous indicator widely recognized by experts. Under normal circumstances, it is natural for us to take the total revenue of ice and snow tourism as the benchmark index. However, considering the actual situation, it is difficult to make data statistics due to the seasonal and regional characteristics of ice and snow tourism. At present, there is no official valid data, and the data is not sufficient, which is contrary to the data adequacy in the benchmark principle of index selection. Therefore, considering all aspects, the "total
tourism revenue" that best reflects the development of the tourism market is selected as the reference system for judgment, that is, the benchmark index. Historical experience shows that the fluctuations of "total tourism revenue" can basically be consistent with the cyclical fluctuations of the ice and snow tourism industry. If conditions permit in the future, the "total revenue from ice and snow tourism" can be considered as a benchmark indicator in the improvement process after obtaining the data.
III. THE PROCESS OF COMPILING THE COMPOSITE INDEX OF ICE AND SNOW TOURISM IN HEILONGJIANG PROVINCE
The method of time difference correlation analysis is used to classify the selected effective indicators, and they are divided into three indicator groups: advance, synchronization, and lag[20].
Hypothesis: The selection index and the benchmark index are respectively 1 2{ , ... ... }nx x x x , 1 2{ , ... ... }ny y y y . The correlation coefficient of time difference is r. Then: yt is an element in the benchmark index (y1, y2……yn); xt-l is an element (x1, x2……xn) in the corresponding selected index. x is the average value of each element of the selected index. y is the average value of each element of the benchmark index. L is the maximum delay number. And l is the leading and lagging period. ni is the number after the data has been collected. ni=2L+1 is the number of integers.
1
2 2
1 1
( )( )
( ) ( )
l
l l
n
t l t
ll
n n
t l t
l l
x x y y
r
x x y y
0, 1, 2, ,l L (1)
Using the time difference correlation analysis method, assisted by k-L information method, cluster analysis and expert scoring[21].
K-L Divergence was proposed by statisticians Kullback and Leibler to determine the closeness of two probability distributions. In recent years, the amount of K-L Divergence has been used in economic analysis. For accidental phenomena with random properties, they can usually be regarded as some realization values of random variables subject to a certain probability distribution. If the true probability distribution is known (or hypothesized), and we want to estimate how close the model we choose is to this true probability distribution, to evaluate the quality of the model, we need a metric, which is the Kullback-Leibler Divergence.
Hypothesize the probability distribution of the (benchmark) random variable be listed as p { , , , }p p pm1 2 , which pi is the probability of occurrence of the event wi , pi 0 ,
pi
i
m
11
.
Suppose the probability distribution of (evaluated) random variables is listed as q q q qm1 2, , , , which qi is the probability of occurrence of the event wi , the expectation is
INTERNATIONAL JOURNAL OF CIRCUITS, SYSTEMS AND SIGNAL PROCESSING DOI: 10.46300/9106.2021.15.10 Volume 15, 2021
E-ISSN: 1998-4464 82
I pp
qi
i
ii
m
p q, ln
1
(2)
i.e., the K-L Divergence of the distribution column q about the distribution column p.
Since any sequence p that satisfies p pi i 0 1, can be regarded as the probability distribution sequence of a random variable.
Standardize the benchmark indicators so that the sum of the indicators is unit 1, and the processed sequence is denoted as p,
1
, t=1, n, y 0tt tn
j
j
yp
y
(3)
The normalized sequence is denoted as q,
1
, t=1, n, 0tt tn
j
j
xq x
x
(4)
the K-L Divergence is,
ln
t lt
t
tlq
ppk
1ln (5)
After calculating the 2 1L K-L Divergence, choosing a
minimum value k l ' as the selected K-L Divergence of the
benchmark index y,
k klL l L
l
min . (6)
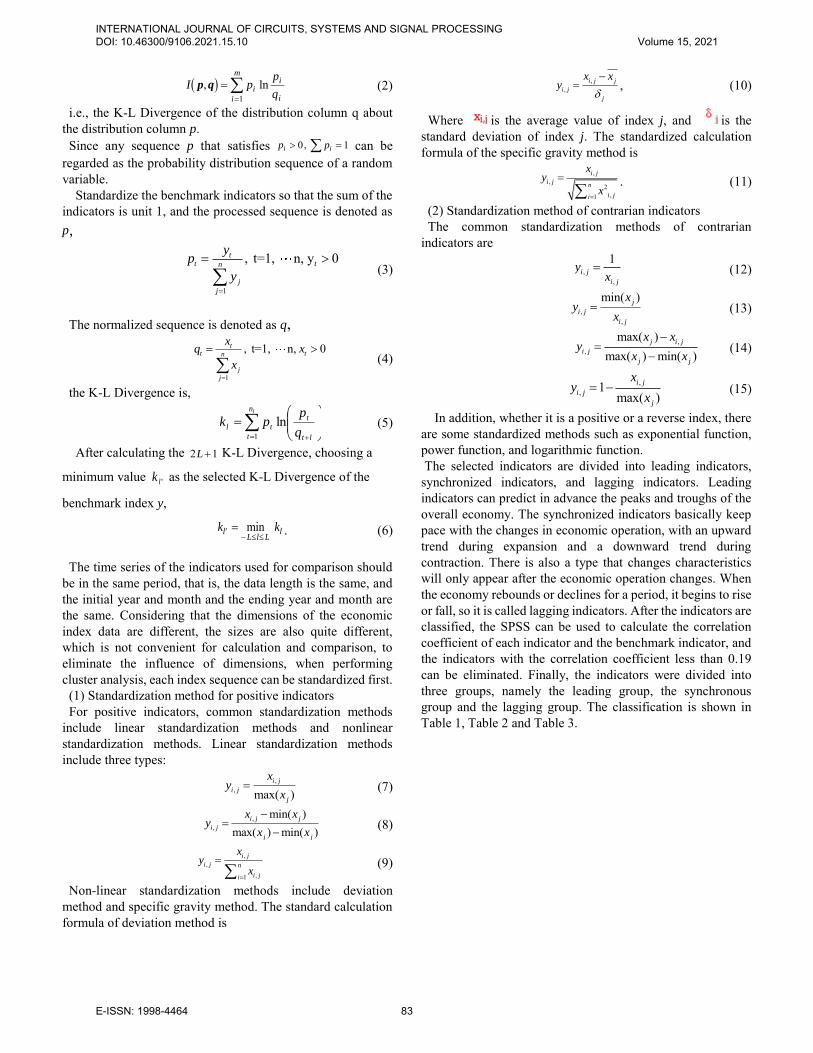
The time series of the indicators used for comparison should be in the same period, that is, the data length is the same, and the initial year and month and the ending year and month are the same. Considering that the dimensions of the economic index data are different, the sizes are also quite different, which is not convenient for calculation and comparison, to eliminate the influence of dimensions, when performing cluster analysis, each index sequence can be standardized first.
(1) Standardization method for positive indicators For positive indicators, common standardization methods
include linear standardization methods and nonlinear standardization methods. Linear standardization methods include three types:
,, max( )
i j
i j
j
xy
x (7)
,,
min( )max( ) min( )
i j j
i j
j j
x xy
x x
(8)
,,
,1
i j
i j n
i ji
xy
x
(9)
Non-linear standardization methods include deviation method and specific gravity method. The standard calculation formula of deviation method is
,,
i j j
i j
j
x xy
, (10)
Where is the average value of index j, and is the standard deviation of index j. The standardized calculation formula of the specific gravity method is
,,
2,1
i j
i jn
i ji
xy
x
. (11)
(2) Standardization method of contrarian indicators The common standardization methods of contrarian
indicators are
,,
1i j
i j
yx
(12)
,,
min( )j
i j
i j
xy
x (13)
,,
max( )max( ) min( )
j i j
i j
j j
x xy
x x
(14)
,, 1
max( )i j
i j
j
xy
x (15)
In addition, whether it is a positive or a reverse index, there are some standardized methods such as exponential function, power function, and logarithmic function. The selected indicators are divided into leading indicators, synchronized indicators, and lagging indicators. Leading indicators can predict in advance the peaks and troughs of the overall economy. The synchronized indicators basically keep pace with the changes in economic operation, with an upward trend during expansion and a downward trend during contraction. There is also a type that changes characteristics will only appear after the economic operation changes. When the economy rebounds or declines for a period, it begins to rise or fall, so it is called lagging indicators. After the indicators are classified, the SPSS can be used to calculate the correlation coefficient of each indicator and the benchmark indicator, and the indicators with the correlation coefficient less than 0.19 can be eliminated. Finally, the indicators were divided into three groups, namely the leading group, the synchronous group and the lagging group. The classification is shown in Table 1, Table 2 and Table 3.
INTERNATIONAL JOURNAL OF CIRCUITS, SYSTEMS AND SIGNAL PROCESSING DOI: 10.46300/9106.2021.15.10 Volume 15, 2021
E-ISSN: 1998-4464 83

Table 1 Leading Indicator Group of Ice and Snow Tourism in Heilongjiang Province indicator name lag order correlation coefficient General Retail Price Index -5 0.459 Consumer Price Index(CPI) -5 0.402 Per capita consumption expenditure of urban resident -3 0.793 Gross Regional Product (100 million yuan) -3 0.977 The total retail sales of social consumer goods -4 0.75 Number of star-rated hotels -4 0.298 Total operating revenue of star-rated hotels -5 0.752 Number of Tourism Employees -3 0.919 RMB exchange rate -4 0.958 Total post and telecommunications business -3 0.627 Note: "-" means first
Table 2 Synchronous Indicator Group of Ice and Snow Tourism in Heilongjiang Province
indicator name lag order correlation coefficient Total revenue from ice and snow tourism during the Spring Festival Golden Week -1 0.916 Number of visitors to Harbin Ice and Snow Festival -1 0.872 Number of Domestic tourists 0 0.962 Visitors from Hong Kong, Macao and Taiwan -1 0.79 Engel Coefficient of Urban Households 0 0.63 National average salary of employees -1 0.943 Number of foreign tourists 0 0.752 Number of beds in star-rated hotels 1 0.352 Average room occupancy rate of star-rated hotels 1 0.78 Travel agency operating revenue -1 0.80 Total tourism revenue Benchmark indicator Total Passenger traffic -1 0.232
Note: "-" means first
Table 3 Lagging Indicator Group of Ice and Snow Tourism in Heilongjiang Province
indicator name lag order correlation coefficient Land area of Ice and Snow World 2 0.945 The total cost of national tourism 2 0.72 Tax paid by travel agency 3 0.48 Star-rated hotel business tax 3 0.81 Total labor productivity of star-rated hotels 4 0.695 Star-rated hotel fixed assets 5 0.383 Turnover of tourist attractions 3 0.81 Year-end balance of savings deposits of urban and rural residents in the province 2 0.943 Note: "-" means first
After completing indicator grouping, we calculate the rate of change of indicator symmetry and get the composite index by
weighting. The specific process is as follows STEP1 Calculate the symmetrical change rate of the index
INTERNATIONAL JOURNAL OF CIRCUITS, SYSTEMS AND SIGNAL PROCESSING DOI: 10.46300/9106.2021.15.10 Volume 15, 2021
E-ISSN: 1998-4464 84

and standardize it. Hypothesis: Indicator ( )ijY t is the indicator i of the indicator group, and j is used to represent the leading, synchronous, and lagging indicator groups (j=1,2,3).The indicator number in the group is i(i=1,2,…k). Solve the symmetric change rate ( )ijC t for
( ) ( 1)( ) 200
( ) ( 1)ij ij
ij
ij ij
Y t Y tC t
Y t Y t
- -= ΄
+ -, 2,3, ,t n (16)
When there are zero or negative values in the indicator or the indicator is a ratio series, take the first-order difference
Standardized the symmetric change rate of each indicator, and obtained the standardized factor
ijA
2
( )1
nij
ij
i
C tA
n=
=-
ε , 2,3, ,t n (17)
Use ijA to standardize ( )ijC t to get the standardized rate of change
2
( )1
nij
ij
i
C tA
n=
=-
ε , 2,3, ,t n (18)
STEP2 Calculate the standardized average rate of change ( )jR t for each indicator group
1
1
( ) ( )( )
( )
k
ij ij
ij k
ij
i
S t W t
R t
W t
=
=
-
=ε
ε, 1,2,3j , 2,3, ,t n (19)
ijW is the weight of the i-th indicator in the j-th group. In this model, calculate the index standardization factor
2
2
2
( )1
( )( )
1
nj
tj n
t
R t
nF t
R tn
=
=
-=
-
ε
ε ,
1,2,3j
(20)
Note: 2 1F =
Calculate the standardized average rate of change ( )jV t
( )
( ) j
j
j
R tV t
F=
, 2,3, ,t n (21)
STEP3 Calculate the initial composite index ( )jI t
set (1) 100jI = ,
200 ( )( ) ( 1)
200 ( )j
j j
j
V tI t I t
V t
+= - ΄
-, 1,2,3j , 2,3, ,t n (22)
STEP4 Make a composite index with a benchmark year of 100
ˆ ( )( ) 100
ˆ ( )j
j
j
I tCI t
I t= ΄ (23)
Among them, ˆ ( )jI t is ˆ ( )jI t the average value of i in the
benchmark year. Based on the data in Table 1, construct the leading, synchronous, and lagging index of the ice and snow tourism industry in Heilongjiang Province. As shown in Figure 1.
Fig. 1 Composite Index of Ice and Snow Tourism in Heilongjiang Province of China
A composite index is a statistical tool that groups together
many different equities, securities, or indexes to create a representation of overall market or sector performance.
Composite indexes are used to conduct investment analyses, measure economic trends, and forecast market activity.
As can be seen from Figure 1, heilongjiang's tourism
( )ijY t
INTERNATIONAL JOURNAL OF CIRCUITS, SYSTEMS AND SIGNAL PROCESSING DOI: 10.46300/9106.2021.15.10 Volume 15, 2021
E-ISSN: 1998-4464 85

operation fell to the bottom of the prosperity cycle in 2001 and 2003, and major social disasters or safety problems had a great impact on the ice and snow tourism in Heilongjiang. The terrorist attacks of September 11 and SARS had a certain
impact on the ice and snow tourism industry in Heilongjiang Province. From 2006 to 2007, the ice and snow tourism in Heilongjiang province was in a relatively stable development
development of Heilongjiang's cultural tourism industry. Through the Russian "Year of Tourism in China" platform, rich activities will be carried out. It has brought the two sides closer cooperation in tourism market development, tourism education and training, tourism safety cooperation, tourism investment and tourism product trading, and at the same time attract many Russian tourists to Heilongjiang and China. The ice and snow tourism industry also showed a rapid development momentum, reaching a new peak of 10.89. According to the synchronization index in Figure 1, the ice and snow tourism in Heilongjiang province entered a new fluctuation cycle after a small contraction in 2014.In 2016, the ice and snow tourism industry in Heilongjiang Province maintained steady development. It should be because Heilongjiang Province is accelerating the transformation and upgrading of the tourism industry based on the development concept of "clear water and green mountains are gold and silver mountains, and ice and snow are also gold and silver mountains". In addition, the Tourism Development Committee was established in Heilongjiang province in 2016, which has contributed to the overall development of the tourism industry and promoted the status of the ice and snow tourism industry. Through the above analysis of the index system and actual policies, we believe that the previously established prosperity indicator system is more reasonable. According to the volatility chart of the leading and synchronized indices, it can be seen that the trend of the leading index from 2006 to 2009 corresponds to the trend of the synchronous index from 2010 to 2013, the trend of the leading index in 2006 corresponds to the trend of the synchronous index in 2010,and the trend of the leading index from 2010 corresponds to the trend of the synchronous index from 2014.It can be seen that there is a relatively stable lead-lag relationship between the various indexes, and the leading index is about 4 years ahead. From 2013 to 2016, it can be seen from the leading index that although there is a small fluctuation in the ice and snow tourism market in Heilongjiang province in the next few years, it generally presents an upward trend, and the overall ice and snow tourism market is in a prosperous state.
IV. CONSTRUCTION OF EARLY WARNING MODEL AND EMPIRICAL ANALYSIS
A. Determination of Early Warning Limits
The determination of the critical point of a single indicator plays a key role in the compilation of early warning signal system, and it is a complex and detailed work. Whether the early warning limits are properly determined is related to whether the changes of various economic indicators can be monitored accurately, to make a correct judgment on the operation status of the entire ice and snow tourism industry. There are two principles for determining the critical point of a single indicator.
First, we determine the actual fall point of the fluctuation
center line of the index according to the historical data of each index and take it as the center of the normal area of the index; Then the basic critical point is obtained according to the probability requirement of the index appearing in different regions.
Second, when the data is too short or the economy is in an abnormal state for a long time, it is necessary to judge through relevant economic theory and experience, eliminate the abnormal value of the indicator, determine the center line of the indicator, and the centerline of indicators should be determined to adjust the basic critical points. By means of mathematical statistics and empirical analysis, the status of the snow and ice tourism industry is divided into five levels, namely, too cold, slightly cold, normal, slightly hot, and too hot. According to the error theory, a 3σ method is proposed to deal with. The normal and abnormal reference value of each indicator is not a single value, but a range, which should obey normal distribution. According to the principle of normal distribution, the data x is distributed near the expectation. The closer to the expectation, the higher probability P is. The more deviating from the expectation, the lower probability P is. If the deviation exceeds 1 standard deviation σ, the probability is only 31.74%. If the deviation exceeds 2 times the standard deviation, the probability is only 4.55%. If the deviation exceeds 3 times the standard deviation, the probability is only 0.27%.
0.6826, 1( ) ( ) ( ) 0.9545, =2
0.9973, =3
k
P X k k k k
k
(24)
In a normal economic system, the possibility that data deviates from the stable value too much or too little is very low. The relevant data of the ice and snow tourism industry in Heilongjiang Province has great volatility. Choosing a standard deviation of 1 time is too strict for the data. Therefore, we use the standard deviation of 2 times as the basis for abnormalities. At the same time, the deviation from 1 to 2 standard deviations is considered as the basic normal interval. After the development of the ice and snow tourism industry is more mature, the data fluctuation is relatively stable and the standard deviation range will also converge. The 3σ method is to calculate the expected value of early warning at all levels of each composite indicator data series, and then find that the interval that deviates from the expected 1 standard deviation belongs to the normal interval, namely [x-σ, x+σ]; the interval deviating by 1 to 2 standard deviations from the expectation belongs to the basic normal interval, namely [x-2σ, x-σ] and [x+σ, x+2σ];the interval deviating by more than 2 standard deviations from the expectation is an abnormal interval namely [-∞, x-2σ] and [x+2σ, ∞].In this way, 5 intervals of evaluation and forecast warning are obtained, as shown in Table 4.
INTERNATIONAL JOURNAL OF CIRCUITS, SYSTEMS AND SIGNAL PROCESSING DOI: 10.46300/9106.2021.15.10 Volume 15, 2021
E-ISSN: 1998-4464 86

Table 4 Division of early warning status interval
early warning status too cold slightly cold normal slightly hot too hot
interval [-∞, x-2σ] [x-2σ, x-σ] [x-σ, x+σ] [x+σ, x+2σ] [x+2σ, ∞]
Determine the critical value based on established standards,
or empirically divided based on past historical data. We can calculate the critical value of each early warning indicator.
Table 5 Critical values of early warning indicators
too hot● slightly hot▲ normal○ slightly cold▽ too cold□
95-76 76-66.5 66.5-47.5 47.5-38 38-0
Set early warning limits for each indicator. The early
warning limit is 4 numerical values. With these 4 check values as critical values, 5 signals of red, yellow, green, light blue, and blue light are determined, respectively with the ● for red light, ▲ for yellow light, ○ for green light, ▽ for light blue light, □ for blue light. When the detected sequence exceeds a certain check value, the corresponding signal will be displayed. Each signal is given a different score, 5 points for red light, 4 points for yellow light, 3 points for green light, 2 points for light blue light, and 1 point for blue light. Suppose that M early warning indicators are selected. When all indicators are red lights, the composite score is the highest score of 5M; when all indicators are blue lights, the composite score is the lowest score of M. Each month, the signal scores shown by the M indicators are added together to obtain a
comprehensive score, and 80% of the full score is the boundary between the red light area and the yellow light district, 70% and 50% of the full score are the upper and lower boundaries of the green light area, and the full score is 40 % is the dividing line between the light blue light and the blue light, and then the comprehensive score value is used to comprehensively judge which light should be on for the early warning signal of the month. By illuminating different signal lights, you can judge the future situation of the ice and snow tourism industry and whether the industry is too hot or too cold. The change of signal lights can provide basis and reference for management agencies. Each ice and snow tourism-related industry can also adjust investment plans and development directions according to changes in signals.
Table 6. Critical values of early warning indicators
2000
2001
2002
2003
2004
2005
2006
2007
2008
2009
2010
2 0 1 1
2012
2013
2014
2015
2016
Interval Per capita consumption expenditure of urban residents ▽ ▽ ▽ ○ ○ ○ ○ ○ ○ ○ ○ ○ ○ ▲ ▲ ▲ ▲
GDP of Heilongjiang Province ▽ ▽ ▽ ▽ ○ ○ ○ ○ ○ ○ ○ ○ ▲ ▲ ▲ ▲ ▲
The total retail sales of social consumer goods ▲ ○ ○ ○ ○ ○ ○ ○ ○ ○ ○ ○ ○ ○ □ ▽ ▽
Employment in tourism ▲ ▲ ▲ ○ ○ ○ ○ ○ ○ ○ ▲ ○ ○ ○ ○ ○ ○
Total post and telecommunications business ○ ○ ○ ○ ○ ○ ○ ○ ○ ▲ ▲ ○ ○ ○ ○ ○ ▲
Total tourism revenue ▽ ▽ ○ ○ ○ ○ ○ ○ ○ ○ ○ ○ ▲ ▲ ▲ ▲ ▲
Average room occupancy rate of star-rated hotels ○ □ ○ ○ ○ ▽ ▽ ○ ▲ ▲ ○ ○ ○ ○ ○ ○ ○
INTERNATIONAL JOURNAL OF CIRCUITS, SYSTEMS AND SIGNAL PROCESSING DOI: 10.46300/9106.2021.15.10 Volume 15, 2021
E-ISSN: 1998-4464 87

Passenger traffic ○ ○ ○ ○ ○ ○ ▲ ● ▽ ○ ○ ○ ○ ○ ○ ○ ▽
Foreign tourists ▽ ▽ ▽ ▽ ○ ○ ○ ○ ▲ ○ ○ ▲ ▲ ○ ▽ □ □
National average salary of employees ▽ ▽ ▽ ▽ ○ ○ ○ ○ ○ ○ ○ ○ ○ ▲ ▲ ▲ ▲
Number of domestic tourists ○ ○ ○ ○ ○ ○ ○ ○ ○ ○ ○ ▲ ▲ ● ○ ○ ○
Number of tourists at Harbin Ice and Snow Festival ▽ ▽ ▽ ○ ○ ○ ○ ○ ○ ○ ○ ○ ▲ ▲ ▲ ▲ ▲
Total revenue from ice and snow tourism during the Spring Festival Golden
Week ○ ○ ○ ○ ○ ○ ○ ○ ○ ○ ○ ○ ○ ▲ ▲ ▲ ▲
Land area of ice and snow world ▽ ▽ ○ ○ ▽ ▽ ○ ○ ○ ○ ○ ○ ▲ ▲ ▲ ▲ ▲
Total National Tourism Expenditure ○ ○ ○ ○ ○ ○ ○ ○ ○ ▲ ▲ ▲ ▲ ▲ ○ ▲ ▲
Tax paid by travel agency ○ ○ ● □ ○ ○ ○ ○ ○ ○ ▲ ○ ○ ○ ○ ▽ ▽
Star-rated hotel fixed assets ○ ○ ○ ○ ○ ○ ○ ○ ○ ○ ○ ○ ○ ▲ ▲ ▲ ▲
Operating revenue of Heilongjiang tourist attractions ○ ○ ○ ○ ○ ○ ○ ○ ○ ○ ○ ○ ● ○ ○ ○ ○
Year-end balance of savings deposits of urban and rural residents ○ ○ ○ ○ ○ ○ ○ ○ ○ ○ ○ ○ ○ ▲ ▲ ▲ ▲
Comprehensive early warning Index ○ ○ ○ ○ ○ ○ ○ ○ ○ ○ ○ ○ ○ ▲ ○ ○ ○
Note: ○ means normal, ● means overheating, ▲ means too hot, ▽ means too cold,□ means too cold.
Fig. 2. Comprehensive Early Warning Index
The "early warning signals" in the above table are sensitive
indicators selected from a series of leading, synchronized and lagging indicators that reflect the ice and snow tourism industry in Heilongjiang Province, and combined to obtain a comprehensive early warning index. Table 5 shows that most of the indicators have been in the normal range since 2000.Under the influence of macro-control, the overheated trend of
heilongjiang's tourist attractions' revenue and domestic tourist Numbers has been controlled, but the total retail sales of consumer goods, foreign inbound tourists and taxes paid by travel agencies have shown a slightly cold or too cold trend. Figure 2 shows the fluctuation of the early warning index. From 2000 to 2016, the early warning index of ice and snow tourism in Heilongjiang province was generally in a normal state. From
INTERNATIONAL JOURNAL OF CIRCUITS, SYSTEMS AND SIGNAL PROCESSING DOI: 10.46300/9106.2021.15.10 Volume 15, 2021
E-ISSN: 1998-4464 88

2001 to 2013, although the economy fluctuated to some extent, although the overall trend fluctuated, the overall trend was upward. The cold state in 2005 gradually increased to a stable state. In 2008, under the impact of the international financial crisis, the early warning index declined. With the development of the economy of Heilongjiang Province, it reached its highest point in 2013, causing overheating. After that, the development of the entire industry declined to a certain extent, and reached a relatively low point of 63 in 2014 and then began to rebound. However, as a whole, the comprehensive early warning index of the ice and snow tourism industry in Heilongjiang province was mostly within a normal and stable range. From 2012 to 2016, some early warning indicators appeared to be hot, and the recent comprehensive early warning index was within the normal range.
V. CONCLUSION AND SUGGESTION This paper uses the composite index method to compile the
prosperity index of the ice and snow tourism industry in Heilongjiang Province and establish an early warning model. Due to the difficulty in collecting monthly and weekly data, we used annual data to analyze the cyclical fluctuations of Heilongjiang's ice and snow tourism industry since 2000.The research results show that the three types of composite indexes with leading, synchronous and lagging relationships verify the rationality of the indicator system we constructed. From the perspective of the change of the early warning index, its trend is close to the consistent index, and the two are mutually confirmed.
At this stage, Heilongjiang province is in an important period of economic transformation. Since the prosperity indicator system of the ice and snow tourism industry is not invariable, it should be adjusted and revised continuously with the improvement of statistical data. The weight of some indicators is relatively small, but its influence in the market activity is not negligible. For such an index, we should increase its weight when compiling the composite index. In the next step, to verify whether the weighted indicators are consistent with actual market activities, we need to establish mathematical modeling for them. At the same time, the rationality is verified and the accuracy of the composite index model is further modified. In addition, the statistical data of ice and snow tourism is not complete, so the compilation of the prosperity index of ice and snow tourism industry in Heilongjiang province is still in the preliminary exploration stage and should be continued. This article provides a new method to study the ice and snow tourism industry in Heilongjiang Province, which has certain reference significance for the study of ice and snow tourism prosperity and tourism industry operation monitoring.
At present, the ice and snow tourism industry in Heilongjiang province is expected to become a new pillar industry. However, it has to be admitted that the industry is only in the initial stage of market competition and will face a severe test with many problems. First, most of the business projects are similar. There are many regions in Heilongjiang province that develop ice and snow tourism, and there are always mutual plagiarism and lack of innovation. The potential
of the brand also needs to be further developed. Heilongjiang Province does not have its own characteristics and cannot compete with the famous ice and snow tourism festivals in other regions. Some tourist routes have unfair competition for customers by using ultra-low prices. The vicious price war has led to the tourism product industry is still operating at a low profit. All these have affected the initiative to explore the business model of heilongjiang's ice and snow tourism industry and to develop tourism-related products. Second, there are shortcomings in the downstream of the ice and snow tourism industry chain. Taking ski resorts as an example, the consumption of ski tourists is basically concentrated on tickets, accommodation and food, while the consumption potential of ski equipment, clothing and related ski equipment has not been tapped. The level of shopping and entertainment consumption is weak. Third, the disadvantage of human capital. Large-scale ski resorts in Heilongjiang Province have special requirements for professional skills and professionalism in the selection of managers and coaches. Many small ski resorts lack attention to human capital, leading to low market competitiveness and reduced market share in the process of market development, which will affect the sustainable development of the ice and snow economy. In addition, the shortage of innovative talents in research and development leads to the fact that all the skiing supplies and equipment in the upstream of the ice and snow tourism industry in Heilongjiang province have to be imported from abroad, which greatly increases the tourism cost. Fourth, the industry failed to form a strong influence of the leading enterprises. From the perspective of the scale of individual enterprises, the scale is small and lack of competitiveness. In terms of the scale of individual enterprises, the scale is small and lacks competitiveness. There is still a big gap between the ice and snow tourism industry in Heilongjiang Province and the group operation. In the development of tourism, each region is in its own way, and the industries do not strengthen their relations with each other, which makes it impossible to form cluster effect and industrial chain relationship. As a result, the resource allocation is unreasonable and many high-quality resources cannot be distributed to the snow and ice tourism industry, and the cluster effect cannot be exerted. Fifth, in the province’s tourism market, domestic tourism is mainly operated. In the international travel sector, it is neither capable of organizing inbound travel from overseas tourists, nor does it have strong resources and channels to organize outbound travel.
In view of the problems existing in the ice and snow tourism industry in Heilongjiang Province, the following suggestions are proposed:
Firstly, the development of ice and snow tourism industry must rely on the overall economic development of its own industry and the region. At present, Heilongjiang province is still in a period of weak transition. Low per capita income, low consumption potential, limited capital investment, and poor investment environment will affect the development of the tourism industry. Secondly, efforts should be made to develop collectivization. In order to enhance the competitiveness of the province, a few high-profile, influential and well-founded ice
INTERNATIONAL JOURNAL OF CIRCUITS, SYSTEMS AND SIGNAL PROCESSING DOI: 10.46300/9106.2021.15.10 Volume 15, 2021
E-ISSN: 1998-4464 89

and snow tourism enterprises will be selected for key support. Create a reputation, build a brand, enhance competitiveness, and finally build an ice and snow tourism industry group in Heilongjiang Province. It is also possible to introduce the transportation industry, engineering machinery, real estate and other enterprise group penetration into the ice and snow tourism industry. These enterprises can also penetrate into the ice and snow tourism industry through capital penetration, further promote the division and integration of the industrial chain. Centering on ice and snow sports, we will further build an ice and snow industrial chain integrating ice and snow tourism, ice and snow equipment manufacturing and ice and snow industry service. Thirdly, we should cultivate the innovative ability of enterprise groups and build brands. Pay attention to the cultivation of employees' innovation ability, and actively encourage employees' pioneering and innovative spirit. Encourage creative employees and provide more training and learning opportunities. This is also a necessary investment to enhance the overall competitiveness of the ice and snow tourism industry. Fourth, expand the brand effect of ice and snow tourism in Heilongjiang province. Speed up the pace of technological innovation and the development and production of high-end products in the ice and snow equipment industry. Enterprises should work hard on the research and development of new ice and snow products, vigorously develop ice and snow products manufacturing through technological innovation and improve the market competitiveness of ice and snow tourism products in Heilongjiang province. Fifth, expand international tourism business and promote international business strategy. At present, outbound tourism is a shortcoming in the province's ice and snow tourism industry. Therefore, in the development process of tourism industry and related industries, it is necessary to have strategic vision, construct enterprise groups, and follow international standard operation. Such as the establishment of tourism branches in the overseas, so as to facilitate cross-border operations, etc. It is also necessary to broaden the scope of entry and exit operations to remove policy barriers for the development of international business strategies.
The composite index is a weighted comprehensive average of a type of characteristic indicators with their respective change ranges as weights. That is, the weighted average of multiple indicators. Can predict the turning point of business cycle fluctuations and can reflect the amplitude of business cycle fluctuations in a sense. However, the judgment of the turning point of the economy cannot show the degree of economic spillover and penetration among various sectors of the economy. This indicator is usually used to analyze problems in comparison with the past, the magnitude and speed of economic changes.
Acknowledgements This work is supported by National Social Science Foundation (Project No. 19CMZ032), Young Innovative Talents of Harbin University of Commerce (Project No. 019CX49).
References [1] H. Guo and G. Meng, "Exploration of using ice and
snow tourism to promote the economic development of Heilongjiang province," Journal of Northeast
Agricultural University (Social Science Edition), vol. 3, 2010.
[2] L. Zhang, "Ice and Snow Tourism Planning," Harbin
Institute of Technology Press, 2011. [3] C. Shi and S. Xu, "Ice and Snow Tourism Planning "
Harbin Institute of Technology Press, vol. 1, pp. 170-172, 2007.
[4] S. Zhan and Z. Yu, "Research on the development status and countermeasures of ice and snow tourism in Heilongjiang province " Journal of Harbin Institute of
Physical Education, vol. 2, 2011. [5] Z. Zhang, J. Ji, and T. Wang, "Constraints and
countermeasures for the development of ice and snow tourism in Heilongjiang province," Urban Tourism
Planning, vol. 2, 2014. [6] D. Luo and L. Yin, "Thoughts on the development of
ice and snow tourism industry in Heilongjiang Province," Ice and Snow Sports., vol. 9, 2014.
[7] X. Sun, "Research on the development of ice and snow tourism industry in Heilongjiang province," Ice and
Snow Sports, vol. 6, 2014. [8] W. Wu, Y. Liu, and e. al, "Research on the evaluation
of the competitiveness of the ice and snow tourism industry in Heilongjiang province based on resource value," Ice and Snow Sports, vol. 4, 2016.
[9] S. Xu, J. Lv, and H. Shen, "AHP decision-making analysis of ice and snow tourism development strategy in Heilongjiang province," Humanities Geography,
vol. 1, 2008. [10] M. Zhai, "Discussion on the relationship between ice
and snow tourism and regional economic growth in Heilongjiang province," Frontiers of Social Sciences,
vol. 4, 2016. [11] A. F. Burns and W. C. Mitchell, "Measuring Business
Cycles," BusinessCycles (New York:National Bureau
of Economic Research 1946. [12] J. Shiskin and e. al, "The X-11 Variant of the Census
Method ⅡSeasonal Adjustment Program," Technical
Paper,US.Departmentof Commerce Bureau of the
Census, 1967. [13] F. X.Diebold and G. e. D. R. ch, "Meas u ring Bus
iness Cycles:A Modern Perspective," The Review of
Economi cs and St at istics, vol. 78, no. 1, pp. 67-77, 1996.
[14] H. Zhang, "Research on the Construction of Urban Inbound Tourism Prosperity Index——Taking Beijing as an example," Tourism Science, vol. 12, 2013.
[15] X. Yan and X. Huang, "Research on the indexation of the prosperous cycle of China's travel agency industry," Journal of Northeast Agricultural
University (Social Science Edition), vol. 9, 2007.
INTERNATIONAL JOURNAL OF CIRCUITS, SYSTEMS AND SIGNAL PROCESSING DOI: 10.46300/9106.2021.15.10 Volume 15, 2021
E-ISSN: 1998-4464 90

[16] P. Lei, "The compilation and application of China's foreign tourists inbound tourism market prosperity index," Tourism Journal, vol. 11, 2009.
[17] J. Yang, "Research on the prosperity index of Henan travel agency industry," Management Engineer, vol. 6, 2011.
[18] P. Gao, "The construction and empirical research of Shanghai tourism market monitoring index," Market
Research, vol. 3, 2013. [19] M. KUBALCIK, V. BOBAL, and T. BAROT,
"Modifications of Optimization Algorithms Applied in Multivariable Predictive Control " WSEAS
Transactions on Systems and Control, vol. 13, pp. 497-505, Jun 2018.
[20] J. F. ROSENBLUETH, "Normality and Quasinormality in Nonlinear Programming and Optimal Control," WSEAS Transactions on Systems
and Control, vol. 13, pp. 510-513, Jun 2018. [21] L. SETLAK and R. KOWALIK, "Control System of
the Multi-rotor in Flight in the Presence of Strong Wind," WSEAS Transactions on Systems and Control,
vol. 14, pp. 437-444, Jun 2019.
Creative Commons Attribution License 4.0 (Attribution 4.0 International, CC BY 4.0)
This article is published under the terms of the Creative Commons Attribution License 4.0 https://creativecommons.org/licenses/by/4.0/deed.en_US
INTERNATIONAL JOURNAL OF CIRCUITS, SYSTEMS AND SIGNAL PROCESSING DOI: 10.46300/9106.2021.15.10 Volume 15, 2021
E-ISSN: 1998-4464 91