a prospective study of blood selenium levels and the …avangeen/publications/documents/...1 1 2 a...
TRANSCRIPT
1
1 A Prospective Study of Blood Selenium Levels and the Risk of Arsenic-2
related Premalignant Skin Lesions 3 4 Yu Chen 1, 2, 3, Marni Hall 4, Joseph H. Graziano 4, Vesna Slavkovich 4, Alexander van 5 Geen 5, Faruque Parvez 4, and Habibul Ahsan 1, 6 6 7 Authors’ affiliations: 8 1Department of Epidemiology, Mailman School of Public Health, Columbia University 9 2Department of Environmental Medicine, New York University School of Medicine 10 3New York University Cancer Institute, New York University School of Medicine 11 4Department of Environmental Health Sciences, Mailman School of Public Health, 12 Columbia University 13 5Lamont-Doherty Earth Observatory of Columbia University 14 6Herbert Irving Comprehensive Cancer Center, Columbia University 15 16 Address for reprints: 17 Reprint requests and correspondence should be addressed to: 18 Dr. Habibul Ahsan, Department of Epidemiology, Mailman School of Public Health, 19 Columbia University Medical Center, 722 West 168th Street, Room 720G, New York, 20 N.Y. 10032. Phone: (212) 305-7636; Fax: (212) 342-2129; E-mail: [email protected]. 21 22 Running head: 23 Selenium and risk of skin lesions 24 25 Grants and acknowledgments: This research was supported by U.S. National Institute 26 of Environmental Health Sciences Grants P42ES10349, P30ES09089, and National 27 Cancer Institute Grants R01CA107431, and R01CA102484. The authors would like to 28 thank the staff, field workers and study participants in Bangladesh without whom this 29 work would not have been possible. The authors would also like to thank Dr. Wei-Yann 30 Tsai for his helpful comments. 31 32 33 34 Abbreviations: 35 36 Health Effects of Arsenic Longitudinal Study (HEALS) 37 Arsenic (As) 38 Selenium (Se) 39 Food frequency questionnaire (FFQ) 40 41 Key words: 42 43 Arsenic 44 Bangladesh 45 Case-cohort study 46 Premalignant skin lesions 47 Selenium 48

2
49 50 51 Abstract 52 53 Arsenic exposure from drinking water is considered to be a risk factor for skin and 54
internal cancers. Animal studies suggest a potential antagonism between As and Se in 55
the body. We performed a case-cohort analysis to prospectively evaluate the association 56
between As-related premalignant skin lesions and prediagnostic blood Se levels in 303 57
cases of skin lesions newly-diagnosed from November 2002 to April 2004 and 849 58
subcohort members randomly-selected from the 8,092 participants in the Health Effects 59
of As Longitudinal Study with available baseline blood and urine samples collected in 60
2000. Incidence rate ratios for skin lesions in increasing blood Se quintiles were 1.00 61
(ref), 0.68 (95% confidence interval (CI): 0.39, 1.18), 0.51 (95% CI: 0.29, 0.87), 0.52 62
(95% CI: 0.30, 0.91), and 0.53 (95% CI: 0.31, 0.90). Effect estimates remained similar 63
with adjustments for age, sex, BMI, smoking status, excessive sunlight exposure (in 64
men), well water As concentration at baseline, and nutritional intakes of folate, iron, 65
protein, Vitamin E, and B Vitamins. At any given As exposure level, the risk of 66
premalignant skin lesions was consistently greater among participants with blood Se 67
lower than the average level. The findings support the hypothesis that dietary Se intake 68
may reduce the incidence of As-related premalignant skin lesions among populations 69
exposed to As exposure from drinking water. 70
71
3
72
Background 73 The presence of inorganic arsenic (As) in groundwater has been recognized as a 74
public health hazard in many countries. The International Agency for Research on 75
Cancer has classified arsenic as a group 1 human carcinogen. Epidemiologic studies have 76
documented associations between As exposure from drinking water and elevated risks of 77
premalignant skin lesions, skin and internal cancers, and cardiovascular diseases (1-3). 78
In Bangladesh, more than 50 million people have been chronically exposed to drinking 79
groundwater with As concentrations exceeding the WHO standard (10 µg/L) (4). We 80
have estimated the cancer burden to be doubling in Bangladesh (5). Clearly, As 81
mitigation and cancer preventive programs are urgently needed to reduce As toxicity in 82
the population. 83
Cutaneous abnormalities are well known early signs of chronic inorganic As 84
poisoning. Melanosis is considered as early-stage skin lesions. Keratosis is the most 85
frequent manifestation preceding the appearance of As-related skin cancer (6). Unlike 86
As-related internal cancers that could have long latencies, these premalignant skin lesions 87
may appear with shorter periods of As exposure (7). They give rise to the majority of As-88
induced basal and squamous cell skin cancers (6, 8, 9). In 428 cases of skin cancer in an 89
As-exposed population in Taiwan, 90% were associated with hyperpigmentation and 90
72% were associated with keratosis (6). In other historical case series, 81-100% of As-91
related skin cancer cases were related to keratosis (10, 11). 92
It has been hypothesized that susceptibility to As toxicity differs by dietary 93
selenium (Se) intake levels (12, 13). Se is an essential human dietary trace element 94
required for synthesis of a variety of Se-containing proteins, some of which are 95
selenoproteins that incorporate Se in the form of the amino acid selenocysteine (SeCys) 96
during translation (14). Selenoproteins and their metabolites are critical in maintaining 97
antioxidant/anti-inflammatory homeostasis. In experimental studies, As exposure has 98
been associated with a greater production of free radicals and increased oxidative stress 99
(15) that may be reduced by selenoproteins. Additionally, animal studies have 100
demonstrated an interaction between Se and As, such that uptake of one of these elements 101
causes release, redistribution, or elimination of the other element by urinary and/or biliary 102
routes (16, 17). However, findings from epidemiologic studies about the protective effect 103
4
of Se intake on risks of As-related diseases such as premalignant skin lesions and 104
blackfoot disease (a unique peripheral vascular disease in lower extremities related to 105
high levels of As exposure) in populations exposed to As exposure have been 106
inconclusive (13, 18-21). Limitations of these studies include small sample sizes, 107
unavailability of prediagnostic Se levels (in observational studies), and methodological 108
shortcomings such as the lack of blindness in randomization (in intervention studies). 109
We conducted a case-cohort study nested in the Health Effects of As Longitudinal 110
Study (HEALS) to prospectively assess the association between prediagnostic levels of 111
Se in whole blood and the subsequent risk of premalignant skin lesions. We also 112
evaluated whether the relationship between long-term As exposure from drinking water 113
and risk of skin lesions is modifiable by blood Se levels. 114
115
Methods 116 The Health Effects of As Longitudinal Study (HEALS) 117
The parent study HEALS is an ongoing prospective cohort study in Araihazar, 118
Bangladesh. Details of the study methodologies have been presented elsewhere (22, 23). 119
Briefly, prior to subject recruitment, water samples and geographic positional system data 120
were collected for 5,966 contiguous wells in a well-defined geographic area of 25 square 121
km in Araihazar. Between October, 2000 and May, 2002, 11,746 men and women aged 122
18 years and above were recruited, with a participation rate of 97.5% (22). The cohort is 123
being followed with in-person visits at two year intervals. Verbal consent was obtained 124
from study participants. The study procedures were approved by the Columbia 125
University Institutional Review Board and the Ethical Committee of the Bangladesh 126
Medical Research Council. 127
At baseline recruitment, venous whole blood samples were collected in 3 ml 128
Vacutainers containing EDTA as anticoagulant for 91.8% of the overall 11,746 cohort 129
participants. At baseline and the follow-up visits, a spot urine sample was collected in 50 130
ml acid-washed tubes for 95.6% and 94.5% of the cohort participants, respectively. Both 131
blood and urine samples were kept in portable coolers immediately after collection. 132
Within 2–8 hours, blood and urine samples were processed and transferred to -20° C 133
freezers in the study office located in Dhaka city. All samples were kept frozen and 134
shipped to Columbia University on dry ice within 1–2 months. 135

5
Trained physicians completed a comprehensive physical examination at baseline 136
and follow-up visits. Details of the clinical examination protocol for premalignant skin 137
lesion diagnosis were previously described (22). We instituted a structured protocol 138
adapting the method for quantitative assessment of the extent of body surface 139
involvement in burn patients. The principle is based on dividing the entire body skin 140
surface into 11 segments and assigning percentages to each of them based on their size 141
relative to the whole body surface. This method requires a physician to record 142
presence/absence, type, size, shape of skin lesions and extent of skin involvement. 143
Physicians were blind to information on the As level in participants’ drinking wells. In 144
the present study, presence of premalignant skin lesions was defined as existence of any 145
melanosis and/or keratosis. 146
147
Selection of cases and subcohort 148
A case-cohort study design (24) was used to evaluate the relationship between 149
blood Se level and risk of skin lesions. The case-cohort study design has been used to 150
analyze cohort data efficiently when most observations are censored (non-diseased) (24). 151
It provides the advantages of a cohort study in that it allows the direct calculation of a 152
rate ratio without the collection and analysis of full information on every member of the 153
cohort. A random sample of the cohort, or “subcohort,” is designated as the comparison 154
group for the newly-diagnosed cases of skin lesion observed in the overall cohort. 155
Among the 9,727 participants who gave both urine and blood samples and 156
completed the physical examination at baseline, 712 were prevalent cases of skin lesions. 157
They were excluded from the current analysis. Additionally excluded from the study 158
were 923 randomly selected subjects whose blood samples were previously consumed in 159
a study of genetic susceptibility. The present analysis included a 10.5% random sample 160
of the remaining 8,092 participants (n=849) and 303 cases of newly-diagnosed skin 161
lesions. The 303 cases of skin lesions were diagnosed at the first two-year follow up 162
from the 8,092 participants between November, 2002 and April, 2004; 221 of the cases 163
had only melanosis, while the remaining 82 had both hyperkeratosis and melanosis. 164
Among the 303 newly-diagnosed cases, 31 were also part of the 849 subcohort members. 165
166
6
Measurements of As exposure 167
At baseline, water samples from all 5,966 tube wells in the study area were 168
collected in 50 ml acid-washed tubes following well pumping for 5 minutes (25, 26). 169
Total As concentration was determined by graphite furnace atomic-absorption 170
spectrometry (GFAA) with a Hitachi Z-8200 system at the Lamont-Doherty Earth 171
observatory of Columbia University (25). Samples that fell below the detection limit of 172
GFAA (5 µg/L) were subsequently analyzed by inductively coupled plasma mass 173
spectrometry (ICP-MS), with a detection limit of 0.1 µg/L (27). Analyses for time-series 174
samples collected from 20 tube wells in the study area showed that the As concentration 175
in well water is relatively stable over time (27). Therefore, we derived a time-weighted 176
As concentration (TWA) as a function of drinking durations and well As concentrations 177
(28, 29). The TWA represents the average As exposure that accrued for 9 years on 178
average in the cohort members prior to the time of baseline visits. 179
Total urinary As concentration in urine samples collected at both baseline and follow-up 180
visits was measured by GFAA, using a Perkin-Elmer AAnalyst 600 graphite furnace 181
system, as previously described (30). Urinary creatinine was analyzed using a method 182
based on the Jaffe reaction for adjustment of urinary total As concentration (31). 183
184
Measurements of Se and As in whole blood 185
Whole blood samples collected at baseline were analyzed for blood Se and As 186
concentrations using a Perkin-Elmer Elan DRC II ICP-MS equipped with an AS 93+ 187
autosampler. ICP-MS-DRC methods for metals in whole blood were developed (with 188
modifications) based on published methods (32). Whole blood samples were thawed, 189
thoroughly mixed, diluted 50 times with diluent containing 1% HNO3 + 0.2% Triton-X-190
100 + 0.5% NH4OH, and centrifuged for 10 minutes at 3500 rpm with the supernatant 191
reserved for analysis. A multi-element standard solution was used for instrument 192
calibration, with Se and As concentrations chosen to cover the expected ranges of analyte 193
in the blood samples. We used iridium to correct matrix-induced interferences. A stock 194
internal standard spiking solution was added to all calibrators and samples in the same 195
concentration, 10 ng iridium per tube. Polyatomic interferences were suppressed with the 196
instrument’s Dynamic Reaction Cell (DRC) technology feature, utilizing oxygen as a 197
second gas. Interclass correlation coefficient between the expected and observed 198
7
concentrations in quality control samples (blood samples with known analyte 199
concentrations obtained from the Laboratory for ICP-MS Comparison Program in 200
Quebec), was 0.99 and 0.90 for blood Se and As, respectively. 201
202
Measurements of Dietary Intakes 203
Dietary intakes were measured at baseline with a validated semi-quantitative food 204
frequency questionnaire (FFQ) designed for the study population. Detailed information 205
on the design and the validation of the FFQ has been published elsewhere (33). Briefly, 206
to assess the validity of the FFQ, two 7-day food diaries (FD) were completed in two 207
separate seasons by trained interviewers for 189 of the 200 participants randomly selected 208
from the overall HEALS study population. Correlations for macronutrients and common 209
micronutrients including total fat, monounsaturated fat, polyunsaturated fat, saturated fat, 210
protein, carbohydrate, dietary fiber, sodium, potassium, vitamin B6, vitamin B12, 211
riboflavin, manganese, thiamin, and iron ranged from 0.30 to 0.76 (33). We used both 212
the United States Department of Agriculture (USDA) Nutrient Database for Standard 213
Reference (abbreviated version) (34) and an Indian food nutrient database (35) to convert 214
food intakes to nutrient intake values (33). 215
216
Statistical Analysis 217
Incidence rate ratios (RRs) for skin lesions were estimated using Cox 218
proportional hazards models with the PROC PHREG procedure in SAS. Standard errors 219
were estimated using the robust variance estimator proposed by Barlow (36). The 220
random cohort was weighted by the inverse of the sampling fraction from the source 221
population. Follow-up time, defined for each person as the time of baseline visit to the 222
time of the first follow-up visit, was 1.9 years on average with a range of 0.9 to 3.5 years. 223
Risk sets were created with age at the time of follow-up visit as a matching variable. For 224
each case, members of the random subcohort whose age at the time of follow-up were 225
older than that of the case by ≤ 3 years were included as the comparison for the case, i.e. 226
those who had not been diagnosed with skin lesions at the age the case was diagnosed. 227
Blood Se categories were determined according to quintile values in the subcohort. 228
Previous studies from our group have suggested that age, sex, body mass index (BMI), 229
and tobacco smoking may modify the risk of premalignant skin lesions (28, 29). These 230
8
factors, along with well As concentration, were considered the primary potential 231
confounders in evaluating the main effect of blood Se level because these factors may 232
also be related to Se intake level. Other risk factors of premalignant skin lesions 233
including indicators of short-term changes in As exposure (well switching status since 234
baseline and total urinary As level at the time of follow-up), excessive sunlight exposure 235
(in men) (28), and nutrient intakes that have been related to As toxicity in the literature 236
(37-39) were also considered. These were evaluated in a separate model (model 2) 237
because values were not available for all the study participants. 238
RRs in relation to joint effects of long-term As exposure and blood Se were also 239
estimated. Since RRs for the main effect of blood Se did not differ by additional 240
adjustments, RRs for joint effect of As exposure and Se were adjusted for primary 241
potential confounders (except for As exposure) only. We further calculated relative 242
excess risk due to interaction (RERI) to assess the additivity of the joint effects (40). 243
The subcohort is a good representation of the underlying source population. 244
We performed linear regression models to evaluate the relationships of blood Se with 245
various socio-demographics, lifestyles, As exposure-related variables, food intakes that 246
have been shown to be related to blood Se, and nutrient intakes that have been associated 247
with modification of As toxicity in the literature. In addition, we evaluated the cross-248
sectional relationships of blood Se with blood As and total urinary As (all measured at 249
baseline) in the subcohort. Factors such as well As level and water consumption that may 250
be related to As intake were additionally adjusted for in this analysis. 251
252
Results 253
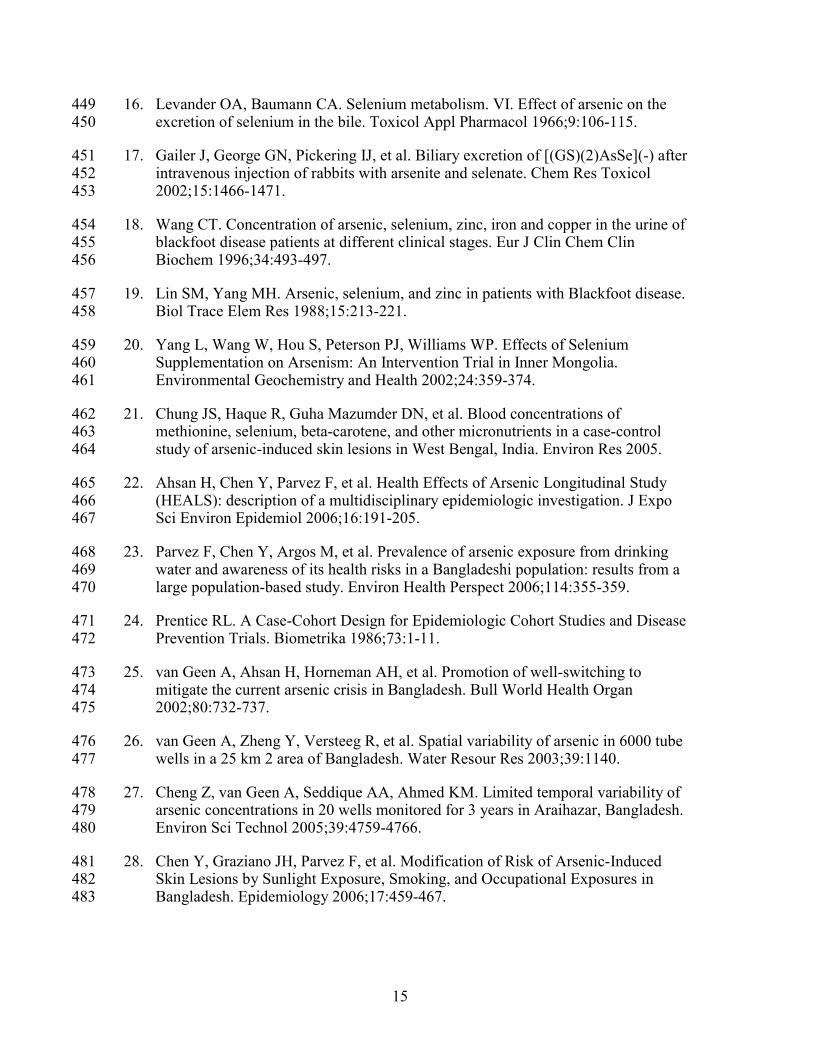
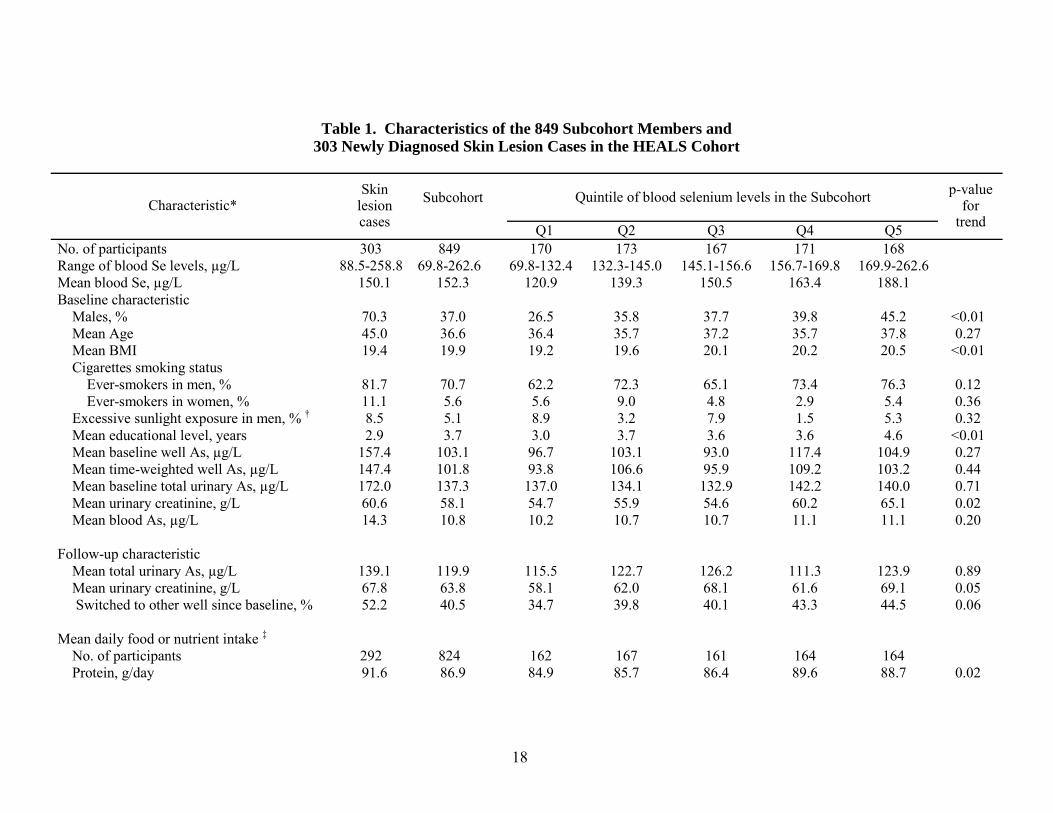
Cases were more likely to be male, older, less educated, and ever to have smoked 254
at baseline (Table 1). Total urinary As, well water As level, blood As level, and the time-255
weighted well As level measured at baseline were all higher in cases than in the 256
subcohort. Cases were more likely to have switched to another well water source since 257
baseline. Nevertheless, total urinary As measured two years later was higher in cases. 258
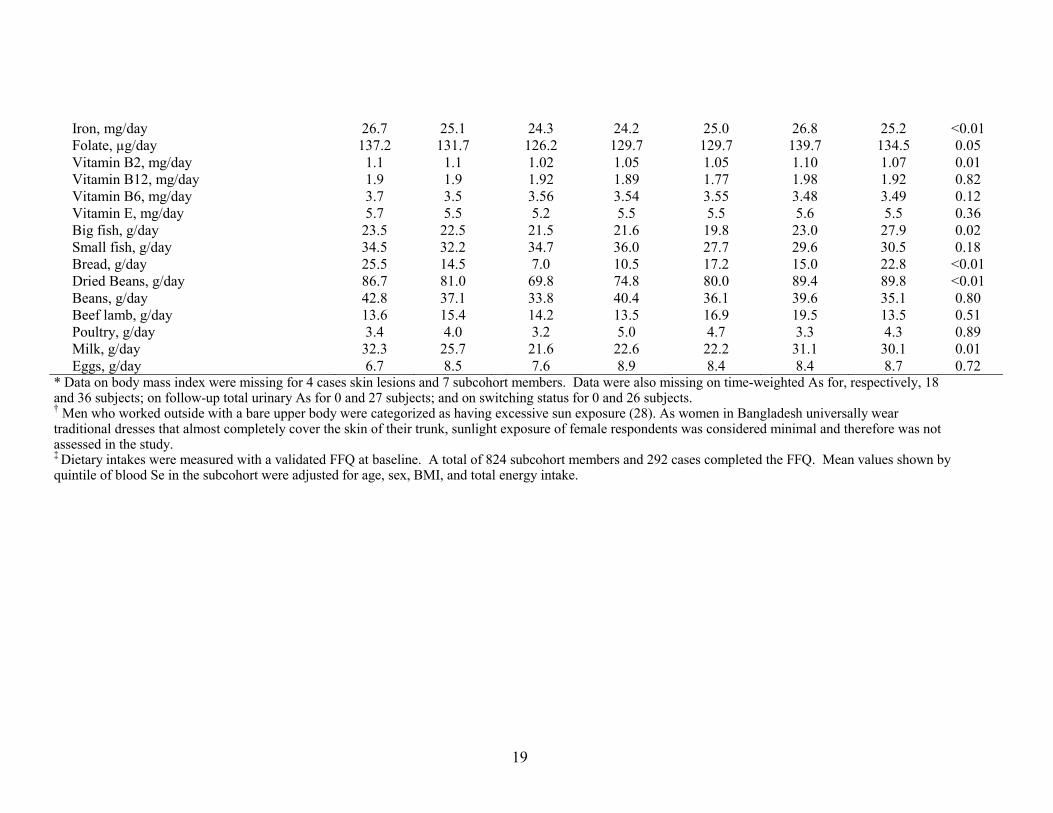
In the subcohort, the proportion of men was higher among participants with 259
higher levels of blood Se (p-trend <0.01) (Table 1). Average baseline BMI and 260
educational attainment were higher in higher quintiles of blood Se (p-trend <0.05). There 261
were no apparent associations of blood Se with age, cigarettes smoking status, and all of 262
9
the As exposure measures. The proportion of participants who switched to a different 263
well since baseline was greater among participants with higher levels of blood Se (p-264
trend = 0.06). Adjusted average intakes of large fresh water fish, bread, dried beans, and 265
milk were higher in participants with higher levels of blood Se. No significant 266
associations were observed between blood Se level and intakes of meats, small fish, eggs, 267
or any specific vegetables (data not shown). Average intakes of protein, iron, folate, and 268
Vitamin B2 were positively related to blood Se levels (p-trend ≤ 0.05); spearman 269
correlations of blood Se with these nutritional parameters were ≤ 0.12. 270
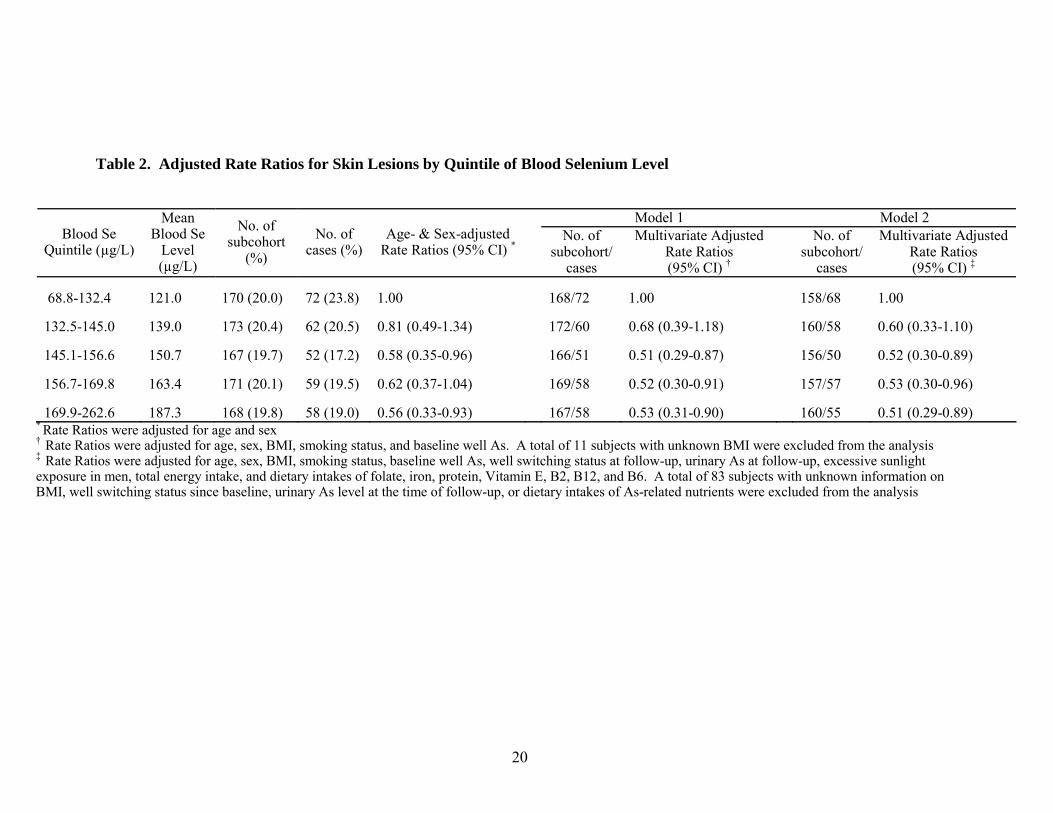
Blood Se level was inversely related to risk of premalignant skin lesions (Table 271
2). Comparing the higher four quintiles to the bottom quintile of blood Se, age- and sex-272
adjusted RRs ranged from 0.56 to 0.81. The inverse association remained apparent with 273
additional adjustments for BMI, cigarettes smoking status, and baseline well As level; 274
RRs were 0.51 (95% confidence interval (CI): 0.29, 0.87), 0.52 (95% CI: 0.30, 0.91), and 275
0.53 (95% CI: 0.30, 0.91) comparing the third, fourth, and fifth quintile to the bottom 276
quintile, respectively (model 1). Additional adjustments for well switching status, total 277
urinary As and urinary creatinine at the time of follow-up, total energy intake, excessive 278
sunlight exposure in men, and intakes of protein, folate, iron, Vitamins E, B2, B6, and 279
B12 did not change the estimates appreciably (model 2). 280
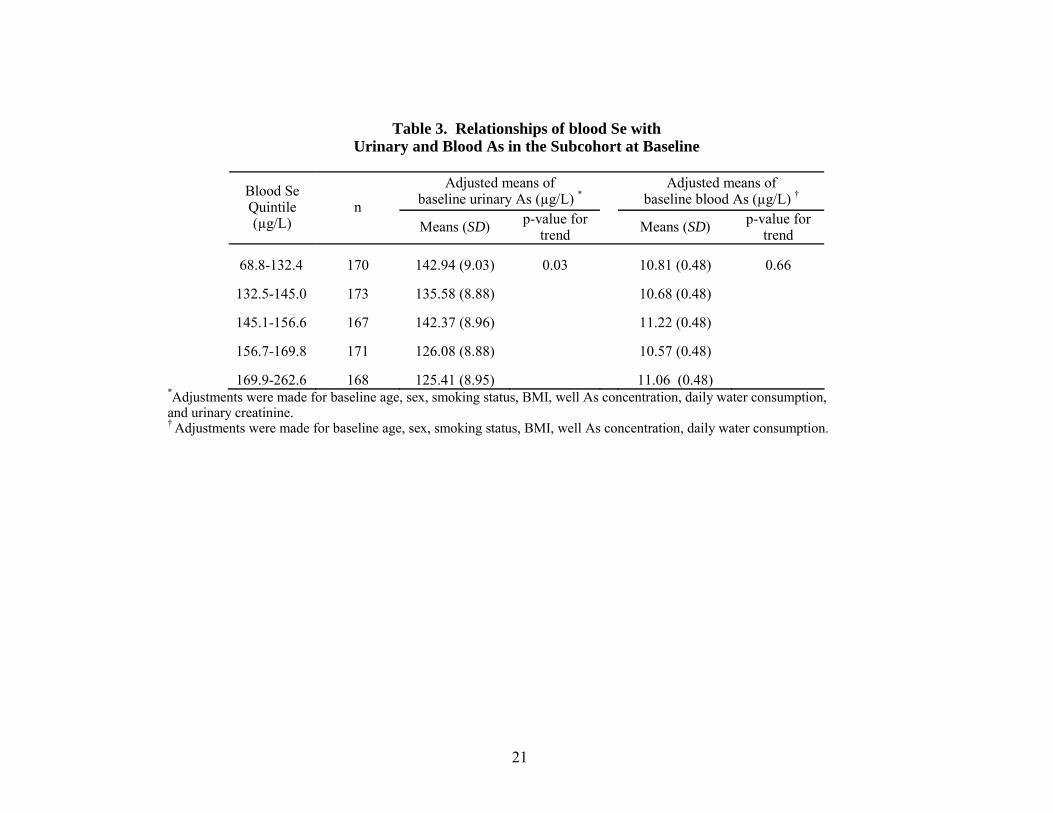
The cross-sectional relationship between baseline blood Se and baseline urinary 281
As in the subcohort is presented in Table 3. Partial spearman correlation controlling for 282
age, well As level, BMI, and urinary creatinine was -0.10 (p = 0.02) between blood Se 283
and urinary As and 0.07 (p = 0.05) between blood Se and blood As. Participants with 284
higher blood Se levels had lower urinary As levels, adjusting for urinary creatinine, age, 285
sex, BMI, smoking status, baseline well As concentration, and daily water consumption. 286
The inverse association was statistically significant in multiple linear regression (p for 287
trend = 0.03). On the other hand, no apparent association was observed between Se and 288
As concentrations in the blood. 289
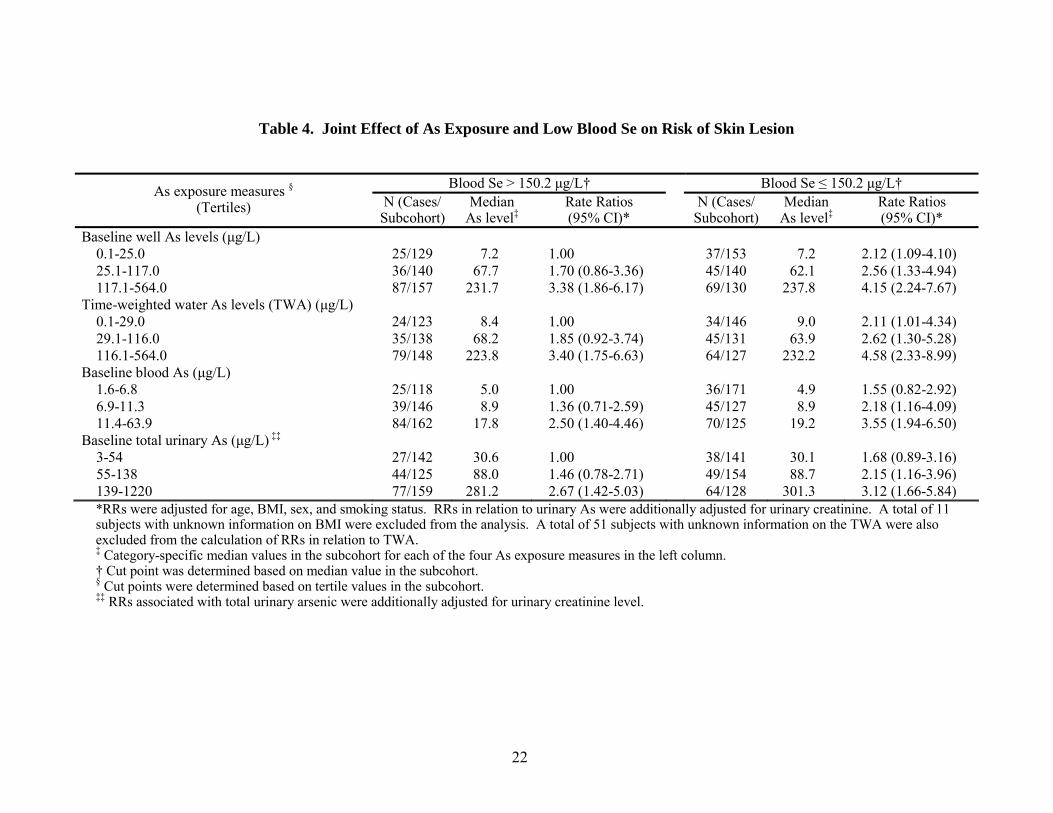
Low blood Se was associated with a greater risk for skin lesions at each level of As 290
exposure (Table 4). The increased risk associated with low blood Se appeared to be 291
additive to the risk related to higher levels of As exposure. The pattern of effect 292
estimates was consistent with all four As exposure measurements. Additional adjustment 293
for well switching status since baseline did not change the pattern of RRs. An RERI 294
10
estimate significantly greater or lower than zero (perfect additivity) indicates that the 295
joint effects are significantly greater or lesser than additivity, respectively. All the RERI 296
estimates were close to zero, ranging from -0.35 to 0.5 (data not shown). For instance, 297
the RERI for joint effects of low blood Se and well As 25.1-117.0 µg/L is -0.26 (2.56-298
1.70-2.12+1). Therefore, there is no evidence that the joint effect of As exposure and low 299
blood Se departs from additivity. 300
301
Discussion 302 To our knowledge, this is the first prospective study that evaluates the association 303
between Se levels and risk of As-related disease in a population exposed to As from 304
drinking water. Higher prediagnostic blood Se level was related to as much as a 50% 305
reduction in risk of As-related premalignant skin lesions. This estimate did not change 306
appreciably with adjustments for age, sex, BMI, smoking status, As exposure level, and 307
dietary intakes related to As toxicity, including dietary folate, iron, protein, Vitamin E, 308
and B Vitamins (37-39). The pattern of RRs suggests that the effects of As exposure and 309
Se deprivation on risk of skin lesions are additive. These findings are in line with the 310
hypothesis that dietary Se intakes may reduce the incidence of skin lesions among 311
populations with As exposure from drinking water. 312
Findings from previous studies were mostly inconclusive on the relationship 313
between Se intake and As toxicity. A case-control study in Taiwan found that patients 314
with blackfoot disease had lower blood Se levels than controls, while a similar case-315
control study found that blood Se was higher in patients with late-stage blackfoot disease 316
compared to that in controls (18, 19). In another case-control study in West Bengal, odds 317
ratios for As-related skin lesions did not differ by blood Se levels (21). It is unclear, 318
however, whether the blood Se levels observed in cases were a consequence or a 319
contributing factor to blackfoot disease or As-related skin lesions in these case-control 320
analyses. A placebo-controlled trial in Inner Mongolia found that Se supplementation 321
significantly improved skin lesions (20). However, the trial was neither randomized nor 322
double-blind, and the drop-out rates in both the placebo and the treatment groups were 323
high. A pilot randomized, placebo-controlled trial conducted by our group found that Se 324
supplementation slightly improved skin lesion status; however the sample size of the 325
study was small and the improvement was not significant (13). 326
11
Our findings are consistent with several observational studies that found a 327
protective association between plasma selenium level and the risk of nonmelanoma skin 328
cancer (41-43). A large randomized clinical trial in patients who previously had 329
nonmelanoma skin cancer, on the other hand, found that selenium supplementation 330
increased the risk of skin cancer (44). There are several possible explanations. First, 331
selenium supplementation may not offer benefits for secondary prevention of skin cancer 332
in an older population (median age 65) (44). Second, the observed inverse association 333
between blood Se and risk of skin lesions in the present analysis is likely due to both the 334
chemopreventive effect of Se and the interaction between Se and As; the latter is absent 335
in populations not exposed to As exposure. Third, it has been postulated that sub-clinical 336
health effects of Se deficiency may be manifest at the low-end of “adequate” Se intake 337
(45) and that physiological stressors may exert additional demand on Se-dependent 338
systems. Indeed, the negative effects of selenium supplementation for secondary 339
prevention of nonmelanoma skin cancer appear to be greater in those with high baseline 340
plasma selenium (44). We observed that the risk associated with any given level of As 341
exposure was consistently greater among persons with blood Se lower than the average 342
level. Using the equation suggested by Yang et al (46), we estimated the average Se 343
daily intake for participants with blood Se lower than the average level (150.2 µg/L) to be 344
61 µg/day, close to the low-end of the recommended daily intake (RDI) of Se (55 345
µg/day), which are established to maintain adequate levels of selenoenzymes. When the 346
level of As exposure was statistically held constant, the reduced RRs associated with the 347
higher three quintiles of blood Se were significant with similar magnitude, indicating that 348
the Se dose-response curve may have a threshold above which no additional benefit 349
occurs. Future As mitigation programs or randomized trials of Se supplementation may 350
consider this finding. It should be noted that Se toxicity, although rare in human 351
populations, has been observed at selenium intakes above 600 µg/day (47). 352
The primary interaction between Se and As is thought to be via a Se-As-353
glutathione conjugate formed in the liver and excreted into bile. In recent studies in 354
rabbits, Gailer et al identified the compound excreted into bile as a seleno-bis (S-355
glutathionyl) arsinium ion, [(GS)2AsSe]- (17, 48). Our observation of an inverse 356
association between blood Se level and urinary As is consistent with the hypothesis that 357
Se-induced biliary excretion may occur in human. The association of blood As and blood 358
12
Se, on the other hand, was not apparent. These findings require further investigation. 359
Other direct Se/As interactions exist. Berry et al reported that Se decreased As toxicity 360
via the formation of a selenide precipitate (As2Se) that is deposited into tissues (49). 361
Oxidative stress reducing effects of selenoenzymes including glutathione peroxidases 362
(GPx), iodothyronine deiodinases (ID) and thioredoxine reductases (TR) (50) may also 363
reduce As toxicity. In the mouse model, a significant reduction in the formation of 8-364
oxo-2'-deoxyguanosine, an oxidative DNA damage biomarker, was observed in 365
ultraviolet radiation (UVR) and As treated mice that were supplemented with Se, 366
compared with those treated with UVR or As alone (51). The initiation of UVR-induced 367
skin tumors has been shown to vary with the activity of GPx and TR (52). 368
The underlying source population represents those who gave both blood and urine 369
samples, who underwent the baseline clinical examination, and who did not have skin 370
lesions at baseline and thus had a lower level of As exposure. Donation of blood and 371
urine samples and consent to physical examination were weakly associated with a higher 372
educational attainment (22). While these differences do not affect the internal validity of 373
our findings, compared to the study population, the overall cohort may have a somewhat 374
higher As level and a lower blood Se level given the positive association between blood 375
Se level and educational attainment. The risk difference associated with Se intake thus 376
may be more significant in the overall cohort. Consistent with findings from another 377
study (53), we found that the average blood Se in Bangladeshi population (150 µg/L) was 378
not particularly lower than those reported from populations in developed countries (54), 379
ranging from 87-107 µg/L in Germany, 134-138 µg/L in England, and 166 to 200 µg/L in 380
non-seleniferous areas in the US. 381
Se levels measured in whole blood are considered as a useful measure for ranking 382
subjects for long-term Se intake (55). The calculation of TWA was based on self-383
reported use of wells. However, validity of self-reported well use history was good since 384
the correlation between arsenic concentration in the baseline well and baseline urinary 385
arsenic was 0.70 (22). In addition, the patterns of RRs for the joint effects of As 386
exposure and low blood Se were similar using multiple biologic measures of As 387
exposure, which further strengthen the findings. In a separate analysis, we have also 388
shown consistent dose–response relationships of the risk of skin lesions with TWA, 389
baseline blood As, and baseline urinary As, and we demonstrated that blood As is a good 390
13
biomarker of As exposure in this population (56). The three measures were highly 391
correlated with one another (pairwise spearman correlation = 0.8) (56). Dietary intakes 392
of other nutrients relevant to As toxicity were measured by FFQ, and therefore 393
measurement errors are expected. The fact that RRs for skin lesions in relation to blood 394
Se levels remained the same after controlling for dietary folate, iron, protein, Vitamin E, 395
and B Vitamins excludes the possibility of strong confounding effect due to these dietary 396
factors. Sharing of the wells in the study population was minimal; the 1121 subjects 397
included in the present analysis were users of 908 wells at baseline. Therefore, the 398
findings are not likely to have been affected by correlated As exposure among subjects. 399
After the completion of baseline interviews, participants with well As > 50 µg/L were 400
advised to change their drinking well, leading to the changes in As exposure during the 401
1.9 years period of time from baseline to the follow-up visit. However, the short-term 402
changes in As exposure are less relevant to the risk of skin lesions, compared to the 403
TWA, which is based on an average of 9 years of well use history. In addition, 404
adjustments for switching status and urinary As at the time of follow-up did not change 405
RR estimates for skin lesions in relation to blood Se. 406
In conclusion, our results are consistent with the notions that 1) higher dietary Se 407
intake may reduce the risk of As-related skin lesions, and 2) Se RDI may not be adequate 408
in the presence of physiological stressors such as chronic As exposure from drinking 409
water. Future studies should continue to evaluate the effect of Se in treating As-related 410
skin lesions and skin cancers, as well as the influence of Se on relationships between As 411
exposure and other As-related disorders. 412
413 414
14
References 415 416
1. Tseng WP. Blackfoot disease in Taiwan: a 30-year follow-up study. Angiology 417 1989;40:547-558. 418
2. Chen CJ, Kuo TL, Wu MM. Arsenic and cancers. Lancet 1988;1:414-415. 419
3. Chiou HY, Huang WI, Su CL, et al. Dose-response relationship between prevalence 420 of cerebrovascular disease and ingested inorganic arsenic. Stroke 1997;28:1717-421 1723. 422
4. The British Geological Survey. Groundwater studies for arsenic contamination in 423 Bangladesh-Phase 1 findings. Available: http://www.bgs.ac.uk/arsenic/ [accessed 424 March 3rd, 2006]. 425
5. Chen Y, Ahsan H. Cancer burden from arsenic in drinking water in Bangladesh. 426 Am J Public Health 2004;94:741-744. 427
6. Tseng WP, Chu HM, How SW, et al. Prevalence of skin cancer in an endemic area 428 of chronic arsenicism in Taiwan. J Natl Cancer Inst 1968;40:453-463. 429
7. Saha KC. Diagnosis of arsenicosis. J Environ Sci Health Part A Tox Hazard Subst 430 Environ Eng 2003;38:255-272. 431
8. Alain G, Tousignant J, Rozenfarb E. Chronic arsenic toxicity. Int J Dermatol 432 1993;32:899-901. 433
9. Centeno JA, Mullick FG, Martinez L, et al. Pathology related to chronic arsenic 434 exposure. Environ Health Perspect 2002;110 Suppl 5:883-886. 435
10. Neubauer O. Arsenical cancer; a review. Br J Cancer 1947;1:192-251. 436
11. Arguello RA, Conget DD, Tello EE. Cancer and. endemic arsenism in the Cordoba 437 Region. RevArgent Dermatol 1939;22:461-487. 438
12. Spallholz JE, Mallory BL, Rhaman MM. Environmental hypothesis: is poor dietary 439 selenium intake an underlying factor for arsenicosis and cancer in Bangladesh and 440 West Bengal, India? Sci Total Environ 2004;323:21-32. 441
13. Verret WJ, Chen Y, Ahmed A, et al. A randomized, double-blind placebo-442 controlled trial evaluating the effects of vitamin E and selenium on arsenic-induced 443 skin lesions in Bangladesh. J Occup Environ Med 2005;47:1026-1035. 444
14. Behne D, Kyriakopoulos A. Mammalian selenium-containing proteins. Annu Rev 445 Nutr 2001;21:453-473. 446
15. Shi H, Shi X, Liu KJ. Oxidative mechanism of arsenic toxicity and carcinogenesis. 447 Mol Cell Biochem 2004;255:67-78. 448
15
16. Levander OA, Baumann CA. Selenium metabolism. VI. Effect of arsenic on the 449 excretion of selenium in the bile. Toxicol Appl Pharmacol 1966;9:106-115. 450
17. Gailer J, George GN, Pickering IJ, et al. Biliary excretion of [(GS)(2)AsSe](-) after 451 intravenous injection of rabbits with arsenite and selenate. Chem Res Toxicol 452 2002;15:1466-1471. 453
18. Wang CT. Concentration of arsenic, selenium, zinc, iron and copper in the urine of 454 blackfoot disease patients at different clinical stages. Eur J Clin Chem Clin 455 Biochem 1996;34:493-497. 456
19. Lin SM, Yang MH. Arsenic, selenium, and zinc in patients with Blackfoot disease. 457 Biol Trace Elem Res 1988;15:213-221. 458
20. Yang L, Wang W, Hou S, Peterson PJ, Williams WP. Effects of Selenium 459 Supplementation on Arsenism: An Intervention Trial in Inner Mongolia. 460 Environmental Geochemistry and Health 2002;24:359-374. 461
21. Chung JS, Haque R, Guha Mazumder DN, et al. Blood concentrations of 462 methionine, selenium, beta-carotene, and other micronutrients in a case-control 463 study of arsenic-induced skin lesions in West Bengal, India. Environ Res 2005. 464
22. Ahsan H, Chen Y, Parvez F, et al. Health Effects of Arsenic Longitudinal Study 465 (HEALS): description of a multidisciplinary epidemiologic investigation. J Expo 466 Sci Environ Epidemiol 2006;16:191-205. 467
23. Parvez F, Chen Y, Argos M, et al. Prevalence of arsenic exposure from drinking 468 water and awareness of its health risks in a Bangladeshi population: results from a 469 large population-based study. Environ Health Perspect 2006;114:355-359. 470
24. Prentice RL. A Case-Cohort Design for Epidemiologic Cohort Studies and Disease 471 Prevention Trials. Biometrika 1986;73:1-11. 472
25. van Geen A, Ahsan H, Horneman AH, et al. Promotion of well-switching to 473 mitigate the current arsenic crisis in Bangladesh. Bull World Health Organ 474 2002;80:732-737. 475
26. van Geen A, Zheng Y, Versteeg R, et al. Spatial variability of arsenic in 6000 tube 476 wells in a 25 km 2 area of Bangladesh. Water Resour Res 2003;39:1140. 477
27. Cheng Z, van Geen A, Seddique AA, Ahmed KM. Limited temporal variability of 478 arsenic concentrations in 20 wells monitored for 3 years in Araihazar, Bangladesh. 479 Environ Sci Technol 2005;39:4759-4766. 480
28. Chen Y, Graziano JH, Parvez F, et al. Modification of Risk of Arsenic-Induced 481 Skin Lesions by Sunlight Exposure, Smoking, and Occupational Exposures in 482 Bangladesh. Epidemiology 2006;17:459-467. 483
16
29. Ahsan H, Chen Y, Parvez F, et al. Arsenic exposure from drinking water and risk of 484 premalignant skin lesions in Bangladesh: baseline results from the health effects of 485 arsenic longitudinal study. Am J Epidemiol 2006;163:1138-1148. 486
30. Nixon DE, Mussmann GV, Eckdahl SJ, Moyer TP. Total arsenic in urine: 487 palladium-persulfate vs nickel as a matrix modifier for graphite furnace atomic 488 absorption spectrophotometry. Clin Chem 1991;37:1575-1579. 489
31. Slot C. Plasma creatinine determination. A new and specific Jaffe reaction method. 490 Scand J Clin Lab Invest 1965;17:381-387. 491
32. Stroh A. Determination of Pb and Cd in Whole Blood Using Isotope Dilution ICP-492 MS. Atomic Spectroscopy 1993;37:1575-1579. 493
33. Chen Y, Ahsan H, Parvez F, Howe GR. Validity of a food-frequency questionnaire 494 for a large prospective cohort study in Bangladesh. Br J Nutr 2004;92:851-859. 495
34. U.S.Department of Agriculture ARS, Nutrient Data Laboratory Home Page. USDA 496 Nutrient Database for Standard Reference, Release 15. Available: 497 http://www.nal.usda.gov/fnic/foodcomp/Data/SR14/dnload/sr14dnld.html [accessed 498 June 3rd, 2006]. 499
35. Gopalan C, Rama Sastri BV, Balasubramanian SC: Nutritive value of indian foods. 500 Hyderabad, India, Indian Council of Medical Research, National Institute of 501 Nutrition, 1989. 502
36. Barlow WE, Ichikawa L, Rosner D, Izumi S. Analysis of case-cohort designs. J 503 Clin Epidemiol 1999;52:1165-1172. 504
37. Gamble MV, Liu X, Ahsan H, et al. Folate, Homocysteine, and Arsenic Metabolism 505 in Arsenic-Exposed Individuals in Bangladesh. E 2005;113:1683-1688. 506
38. Steinmaus C, Carrigan K, Kalman D, et al. Dietary intake and arsenic methylation 507 in a U.S. population. Environ Health Perspect 2005;113:1153-1159. 508
39. Mitra SR, Mazumder DN, Basu A, et al. Nutritional factors and susceptibility to 509 arsenic-caused skin lesions in West Bengal, India. Environ Health Perspect 510 2004;112:1104-1109. 511
40. Rothman KJ: Modern Epidemiology. Boston/Toronto, Little Brown, 1986. 512
41. Clark LC, Graham GF, Crounse RG, et al. Plasma selenium and skin neoplasms: a 513 case-control study. Nutr Cancer 1984;6:13-21. 514
42. Breslow RA, Alberg AJ, Helzlsouer KJ, et al. Serological precursors of cancer: 515 malignant melanoma, basal and squamous cell skin cancer, and prediagnostic levels 516 of retinol. Cancer Epidemiol Biomarkers Prev 1995;4:837-842. 517
43. Karagas MR, Greenberg ER, Nierenberg D, et al. Risk of squamous cell carcinoma 518 of the skin in relation to plasma selenium, alpha-tocopherol, beta-carotene, and 519
17
retinol: a nested case-control study. Cancer Epidemiol Biomarkers Prev 1997;6:25-520 29. 521
44. Duffield-Lillico AJ, Slate EH, Reid ME, et al. Selenium supplementation and 522 secondary prevention of nonmelanoma skin cancer in a randomized trial. J Natl 523 Cancer Inst 2003;95:1477-1481. 524
45. Rayman MP. The importance of selenium to human health. Lancet 2000;356:233-525 241. 526
46. Yang G, Zhou R, Yin S, et al. Studies of safe maximal daily dietary selenium intake 527 in a seleniferous area in China. I. Selenium intake and tissue selenium levels of the 528 inhabitants. J Trace Elem Electrolytes Health Dis 1989;3:77-87. 529
47. Yang GQ, Xia YM. Studies on human dietary requirements and safe range of 530 dietary intakes of selenium in China and their application in the prevention of 531 related endemic diseases. Biomed Environ Sci 1995;8:187-201. 532
48. Gailer J, George GN, Pickering IJ, et al. Structural basis of the antagonism between 533 inorganic mercury and selenium in mammals. Chem Res Toxicol 2000;13:1135-534 1142. 535
49. Berry JP, Galle P. Selenium-arsenic interaction in renal cells: role of lysosomes. 536 Electron microprobe study. J Submicrosc Cytol Pathol 1994;26:203-210. 537
50. Morton WE, Dunnette DA: Health Effects of Environmental Arsenic; in: Nriagu J 538 O (ed): Arsenic in the Environment, Part II: Human Health and Ecosystem Effects. 539 New York, John Wiley & Sons, Inc., 1994. 540
51. Uddin AN, Burns FJ, Rossman TG. Vitamin E and organoselenium prevent the 541 cocarcinogenic activity of arsenite with solar UVR in mouse skin. Carcinogenesis 542 2005;26:2179-2186. 543
52. Burke KE, Combs GF, Jr., Gross EG, Bhuyan KC, Abu-Libdeh H. The effects of 544 topical and oral L-selenomethionine on pigmentation and skin cancer induced by 545 ultraviolet irradiation. Nutr Cancer 1992;17:123-137. 546
53. Iyengar GV, Kawamura H, Parr RM, et al. Dietary intake of essential minor and 547 trace elements from Asian diets. Food Nutr Bull 2002;23:124-128. 548
54. Combs GF, Jr. Selenium in global food systems. Br J Nutr 2001;85:517-547. 549
55. Longnecker MP, Stram DO, Taylor PR, et al. Use of selenium concentration in 550 whole blood, serum, toenails, or urine as a surrogate measure of selenium intake. 551 Epidemiology 1996;7:384-390. 552
56. Hall M, Chen Y, Ahsan H, et al. Blood arsenic as a biomarker of arsenic exposure: 553 Results from a prospective study. Toxicology 2006;225:225-233. 554
555
18
Table 1. Characteristics of the 849 Subcohort Members and 303 Newly Diagnosed Skin Lesion Cases in the HEALS Cohort
Quintile of blood selenium levels in the Subcohort Characteristic* Skin
lesion cases
Subcohort
Q1 Q2 Q3 Q4 Q5
p-value for
trend
No. of participants 303 849 170 173 167 171 168 Range of blood Se levels, µg/L 88.5-258.8 69.8-262.6 69.8-132.4 132.3-145.0 145.1-156.6 156.7-169.8 169.9-262.6 Mean blood Se, µg/L 150.1 152.3 120.9 139.3 150.5 163.4 188.1 Baseline characteristic Males, % 70.3 37.0 26.5 35.8 37.7 39.8 45.2 <0.01 Mean Age 45.0 36.6 36.4 35.7 37.2 35.7 37.8 0.27 Mean BMI 19.4 19.9 19.2 19.6 20.1 20.2 20.5 <0.01 Cigarettes smoking status Ever-smokers in men, % 81.7 70.7 62.2 72.3 65.1 73.4 76.3 0.12 Ever-smokers in women, % 11.1 5.6 5.6 9.0 4.8 2.9 5.4 0.36 Excessive sunlight exposure in men, % † 8.5 5.1 8.9 3.2 7.9 1.5 5.3 0.32 Mean educational level, years 2.9 3.7 3.0 3.7 3.6 3.6 4.6 <0.01 Mean baseline well As, µg/L 157.4 103.1 96.7 103.1 93.0 117.4 104.9 0.27 Mean time-weighted well As, µg/L 147.4 101.8 93.8 106.6 95.9 109.2 103.2 0.44 Mean baseline total urinary As, µg/L 172.0 137.3 137.0 134.1 132.9 142.2 140.0 0.71 Mean urinary creatinine, g/L 60.6 58.1 54.7 55.9 54.6 60.2 65.1 0.02 Mean blood As, µg/L 14.3 10.8 10.2 10.7 10.7 11.1 11.1 0.20 Follow-up characteristic Mean total urinary As, µg/L 139.1 119.9 115.5 122.7 126.2 111.3 123.9 0.89 Mean urinary creatinine, g/L 67.8 63.8 58.1 62.0 68.1 61.6 69.1 0.05 Switched to other well since baseline, % 52.2 40.5 34.7 39.8 40.1 43.3 44.5 0.06 Mean daily food or nutrient intake ‡ No. of participants 292 824 162 167 161 164 164 Protein, g/day 91.6 86.9 84.9 85.7 86.4 89.6 88.7 0.02
19
Iron, mg/day 26.7 25.1 24.3 24.2 25.0 26.8 25.2 <0.01 Folate, µg/day 137.2 131.7 126.2 129.7 129.7 139.7 134.5 0.05 Vitamin B2, mg/day 1.1 1.1 1.02 1.05 1.05 1.10 1.07 0.01 Vitamin B12, mg/day 1.9 1.9 1.92 1.89 1.77 1.98 1.92 0.82 Vitamin B6, mg/day 3.7 3.5 3.56 3.54 3.55 3.48 3.49 0.12 Vitamin E, mg/day 5.7 5.5 5.2 5.5 5.5 5.6 5.5 0.36 Big fish, g/day 23.5 22.5 21.5 21.6 19.8 23.0 27.9 0.02 Small fish, g/day 34.5 32.2 34.7 36.0 27.7 29.6 30.5 0.18 Bread, g/day 25.5 14.5 7.0 10.5 17.2 15.0 22.8 <0.01 Dried Beans, g/day 86.7 81.0 69.8 74.8 80.0 89.4 89.8 <0.01 Beans, g/day 42.8 37.1 33.8 40.4 36.1 39.6 35.1 0.80 Beef lamb, g/day 13.6 15.4 14.2 13.5 16.9 19.5 13.5 0.51 Poultry, g/day 3.4 4.0 3.2 5.0 4.7 3.3 4.3 0.89 Milk, g/day 32.3 25.7 21.6 22.6 22.2 31.1 30.1 0.01 Eggs, g/day 6.7 8.5 7.6 8.9 8.4 8.4 8.7 0.72
* Data on body mass index were missing for 4 cases skin lesions and 7 subcohort members. Data were also missing on time-weighted As for, respectively, 18 and 36 subjects; on follow-up total urinary As for 0 and 27 subjects; and on switching status for 0 and 26 subjects. † Men who worked outside with a bare upper body were categorized as having excessive sun exposure (28). As women in Bangladesh universally wear traditional dresses that almost completely cover the skin of their trunk, sunlight exposure of female respondents was considered minimal and therefore was not assessed in the study. ‡ Dietary intakes were measured with a validated FFQ at baseline. A total of 824 subcohort members and 292 cases completed the FFQ. Mean values shown by quintile of blood Se in the subcohort were adjusted for age, sex, BMI, and total energy intake.
20
Table 2. Adjusted Rate Ratios for Skin Lesions by Quintile of Blood Selenium Level
Model 1 Model 2 Blood Se
Quintile (µg/L)
Mean Blood Se
Level (µg/L)
No. of subcohort
(%)
No. of cases (%)
Age- & Sex-adjusted Rate Ratios (95% CI) * No. of
subcohort/ cases
Multivariate Adjusted Rate Ratios (95% CI) †
No. of
subcohort/ cases
Multivariate Adjusted Rate Ratios (95% CI) ‡
68.8-132.4 121.0 170 (20.0) 72 (23.8) 1.00 168/72 1.00 158/68 1.00
132.5-145.0 139.0 173 (20.4) 62 (20.5) 0.81 (0.49-1.34) 172/60 0.68 (0.39-1.18) 160/58 0.60 (0.33-1.10)
145.1-156.6 150.7 167 (19.7) 52 (17.2) 0.58 (0.35-0.96) 166/51 0.51 (0.29-0.87) 156/50 0.52 (0.30-0.89)
156.7-169.8 163.4 171 (20.1) 59 (19.5) 0.62 (0.37-1.04) 169/58 0.52 (0.30-0.91) 157/57 0.53 (0.30-0.96)
169.9-262.6 187.3 168 (19.8) 58 (19.0) 0.56 (0.33-0.93) 167/58 0.53 (0.31-0.90) 160/55 0.51 (0.29-0.89) * Rate Ratios were adjusted for age and sex † Rate Ratios were adjusted for age, sex, BMI, smoking status, and baseline well As. A total of 11 subjects with unknown BMI were excluded from the analysis ‡ Rate Ratios were adjusted for age, sex, BMI, smoking status, baseline well As, well switching status at follow-up, urinary As at follow-up, excessive sunlight exposure in men, total energy intake, and dietary intakes of folate, iron, protein, Vitamin E, B2, B12, and B6. A total of 83 subjects with unknown information on BMI, well switching status since baseline, urinary As level at the time of follow-up, or dietary intakes of As-related nutrients were excluded from the analysis
21
Table 3. Relationships of blood Se with Urinary and Blood As in the Subcohort at Baseline
Adjusted means of
baseline urinary As (µg/L) * Adjusted means of
baseline blood As (µg/L) † Blood Se Quintile (µg/L)
n Means (SD) p-value for
trend
Means (SD) p-value for
trend
68.8-132.4 170 142.94 (9.03) 0.03 10.81 (0.48) 0.66
132.5-145.0 173 135.58 (8.88) 10.68 (0.48)
145.1-156.6 167 142.37 (8.96) 11.22 (0.48)
156.7-169.8 171 126.08 (8.88) 10.57 (0.48)
169.9-262.6 168 125.41 (8.95) 11.06 (0.48) *Adjustments were made for baseline age, sex, smoking status, BMI, well As concentration, daily water consumption, and urinary creatinine. † Adjustments were made for baseline age, sex, smoking status, BMI, well As concentration, daily water consumption.
22
Table 4. Joint Effect of As Exposure and Low Blood Se on Risk of Skin Lesion
Blood Se > 150.2 µg/L† Blood Se ≤ 150.2 µg/L† As exposure measures § (Tertiles) N (Cases/
Subcohort)Median
As level‡ Rate Ratios (95% CI)*
N (Cases/ Subcohort)
Median As level‡
Rate Ratios (95% CI)*
Baseline well As levels (µg/L) 0.1-25.0 25/129 7.2 1.00 37/153 7.2 2.12 (1.09-4.10) 25.1-117.0 36/140 67.7 1.70 (0.86-3.36) 45/140 62.1 2.56 (1.33-4.94) 117.1-564.0 87/157 231.7 3.38 (1.86-6.17) 69/130 237.8 4.15 (2.24-7.67) Time-weighted water As levels (TWA) (µg/L) 0.1-29.0 24/123 8.4 1.00 34/146 9.0 2.11 (1.01-4.34) 29.1-116.0 35/138 68.2 1.85 (0.92-3.74) 45/131 63.9 2.62 (1.30-5.28) 116.1-564.0 79/148 223.8 3.40 (1.75-6.63) 64/127 232.2 4.58 (2.33-8.99) Baseline blood As (µg/L) 1.6-6.8 25/118 5.0 1.00 36/171 4.9 1.55 (0.82-2.92) 6.9-11.3 39/146 8.9 1.36 (0.71-2.59) 45/127 8.9 2.18 (1.16-4.09) 11.4-63.9 84/162 17.8 2.50 (1.40-4.46) 70/125 19.2 3.55 (1.94-6.50) Baseline total urinary As (µg/L) ‡‡ 3-54 27/142 30.6 1.00 38/141 30.1 1.68 (0.89-3.16) 55-138 44/125 88.0 1.46 (0.78-2.71) 49/154 88.7 2.15 (1.16-3.96) 139-1220 77/159 281.2 2.67 (1.42-5.03) 64/128 301.3 3.12 (1.66-5.84)
*RRs were adjusted for age, BMI, sex, and smoking status. RRs in relation to urinary As were additionally adjusted for urinary creatinine. A total of 11 subjects with unknown information on BMI were excluded from the analysis. A total of 51 subjects with unknown information on the TWA were also excluded from the calculation of RRs in relation to TWA. ‡ Category-specific median values in the subcohort for each of the four As exposure measures in the left column. † Cut point was determined based on median value in the subcohort. § Cut points were determined based on tertile values in the subcohort. ‡‡ RRs associated with total urinary arsenic were additionally adjusted for urinary creatinine level.