a proposed new design method for bituminous surface treatments
TRANSCRIPT

A proposed new design method for bituminous surface treatments
Ahmet Sağlık1, a, Birol Demir1, Ahmet Gürkan Güngör2
1 Research and Development Department, General Directorate of Turkish Highways, Ankara, Turkey2 Inspection Board, General Directorate of Turkish Highways, Ankara, Turkey
Digital Object Identifier (DOI): dx.doi.org/10.14311/EE.2016.268
ABSTRACTBituminous Surface Treatment (BST) is single or double application of binder and chipping on prepared granular base orexisting chipping layer or old asphalt concrete for preventive purposes. In Turkey, BST is widely preferred because of relativelylower cost and faster construction than those of conventional asphalt concrete. There are a few BST design method in the worldand all are basically derived from first design method proposed by Hanson.UK design method has been used for about 50 years in Turkey. The long years experiences of BST applications has been revealedthe need for new design method since the existing design values significantly need to be modified in the field. This paper proposesa new design method, namely “KGM Design Method”, for single and double surface treatments considering laying season aswell as Average Least Dimension of Aggregate, climate, surface characteristics, aggregate and binder properties.
Keywords:Chip seals, Design of pavement, Interlayer (SAMI), Surface dressing
E&E Congress 2016 | 6th Eurasphalt & Eurobitume Congress | 1-3 June 2016 | Prague, Czech Republic
1. INTRODUCTION
Surface treatments formed by spreading the bituminous binder and aggregate material on the prepared road surface
one after the other and compacting has been the most widely used type of pavement in Turkey for reasons such as
economy and production rate.
Considering development of surface treatment design methods in the world, it is seen that the first design method
was developed by Hanson in 1934 in New Zealand. Then, Kearby method developed in 1953 and modified in the
later years was especially used in Texas, USA. United Kingdom (1963), McLeod (1969), New Zealand (2005) and
South Africa methods based on Hanson method have been developed in the later years. These methods are
essentially based on first Hanson method that has the concept that aggregate in a chip seal should be as one-sized
as possible and that embedment of the aggregate in the asphalt binder should occupy a specific percentage of the
aggregate dimension. How the aggregate dimension is determined and how the volume of asphalt binder is
calculated vary between methods but usually require measuring the gradation of the aggregate in order to obtain
the average least dimension (ALD) and the shape of the aggregate is considered important and is measured using
the Flakiness Index. The percent embedment is varied as a function of traffic for methods [13]. Hanson found that
for a surface treatment that has carried considerable traffic, the cover aggregate reaches its densest condition with
about 20% voids. If enough asphalt binder has been applied to more than fill this 20 per cent of void spaces, the
excess binder accumulates on the surface and causes flushing or bleeding. If too little binder is used, the cover
stone is torn by traffic because there is not enough binder to cement the aggregate firmly into place [17]. According
to this approach, raveling starts to appear if embedment falls below the rate of 30 % and exceeding 70% embedment
causes bleeding.
Surface treatment design based on the United Kingdom (UK) method has been used in Turkey for many years.
However, it has revealed the need to revise this method for the conditions of Turkey because of the fact that design
values do not represent the amount of aggregate and bitumen to be used, new developments related to the design
and the R & D activities. The proposed new design method here has been developed on the basis of design methods
in the literature, practical experience in Turkey and research studies carried out up to today. The following process
steps shall be followed in the new proposed design method:
1. Average Least Dimension of Aggregate (ALD) is found by using Flatness Index and Aggregate Average
Dimension.
2. “Daily Equivalent Standard Vehicle Per Lane (DESV)” is calculated for the route types on which the average
vehicle speed change (alignment, curves, ramps, intersections) and for each lane.
3. Basic binder application rate is determined with charts by using DESV and ALD values.
4. Design binder application rate is determined by using aggregate bitumen absorption, climate, surface texture
and surface roughness corrections together with modified bitumen correction factors. It is reported with the
temperature correction.
5. The amount of aggregate is determined in kg/m2 depending on the type of the surface treatment layer by using
ALD and bulk density values.
Flow chart related to finding the application rate of binder and aggregate in the New General Directorate Highways
Design Method is shown in Figure 1.
E&E Congress 2016 | 6th Eurasphalt & Eurobitume Congress | 1-3 June 2016 | Prague, Czech Republic

Figure 1: Flow chart of surface treatment design
2. DETERMINATION OF THE AMOUNT OF BITUMINOUS BINDER
Procedure steps to be followed for determining the amount of bituminous binder to be applied in the new surface
treatment design method are described below.
2.1. Determination of the Median Aggregate Size (M)
The first process in the design of surface treatment is to find the Median Aggregate Size. For this purpose, grain
size distribution of the aggregate is drawn on the sieve analysis graph. In this graph, the theoretical sieve size
through which the 50 % of the material passes is recorded as the Median Aggregate Size.
E&E Congress 2016 | 6th Eurasphalt & Eurobitume Congress | 1-3 June 2016 | Prague, Czech Republic

2.2. Determination of the Average Least Dimension (ALD)
The Average Least Dimension of Aggregate is one of the most important factors to determine both aggregate and
binder content in surface treatment design. Aggregates tent to settle on their flat surfaces on which they have
maximum stability with the impact of the traffic load after construction of surface treatment. In the position that
aggregate is stable the dimension perpendicular to the surface is called the least dimension of the aggregate. The
average of the least dimensions of the whole aggregate is called the Average Least Dimension (ALD).
ALD value is calculated by averaging the least dimensions perpendicular to the long edge of 100 aggregates
measured with caliper or by the following equation depending on the flatness index [18].
ALD = 𝑀
1,139285+0,011506 ×𝐹𝐼 (1)
Where;
ALD = Average Least Dimension, mm
M = Medium Aggregate Size, mm
FI = Flatness Index, %
2.3. Determination of Traffic Volume
Chippings settle into surface treatment by traffic impact both embedding and aligning parallel to their longest
dimension. The amount of the embedment varies depending on traffic volume, axle load and vehicle speed. In case
of more than one carriageway in the same direction, while embedment is more on the right lane on which the heavy
vehicle traffic is high and traffic flow speed is low, it is less on the left lane on which the fast and light vehicle
traffic is high. Therefore, it is recommended to determine the effects of vehicles of different weights and speed to
the surface treatment by converting into a standard 10-ton light truck vehicle and to carry out this process for each
lane separately in the new design method.
Table 1: Selection table for traffic factors.
Vehicle
Equivalency
Factor
(VEF)
Vehicle Speed Factor (h) Lane distribution Factor (η)
Express
Traffic1
Medium
or Slow
Traffic2
Very
Slow or
Stopped
Traffic3
Lanes in One Direction
Vehicle Type 1 2 3
Single
Lane
Left
Lane
Right
Lane
Left
Lane
Centre
Lane
Right
Lane
Trailer 6 1 2.0 3.0 1 0.10 0.90 0.05 0.15 0.80
Truck 3 1 1.8 2.6 1 0.15 0.85 0.05 0.25 0.70
Bus 2.5 1 1.6 2.2 1 0.20 0.80 0.10 0.40 0.50
Pick-up,
Minibus 0.5 1 1.3 1.5 1 0.80 0.20 0.30 0.60 0.10
Car 0.1 1 1.1 1.2 1 0.90 0.10 0.60 0.35 0.05
1. Average running speed > 80 km/h alignment 2. Average running speed = 40 – 80 km/h ramp descents, curbs and city crossings 3. Average running speed < 40 km/h ramp ascents, switchback curves, intersections
Daily equivalent standard vehicle traffic is calculated separately by the following equation for each lane and for
each section of the different speed category.
DESV = 𝐴𝐴𝐷𝑇 ×𝑉𝐸𝐹 ×ℎ × η
𝑖 (2)
Where;
DESV = Daily Equivalent Standard Vehicle Per Lane (Equivalent Vehicle/Lane/Days)
AADT = Annual Average Daily Traffic (Vehicle/Days)
h = Vehicle Speed Factor
η = Lane Distribution Factor
i = Number of Traffic Direction
E&E Congress 2016 | 6th Eurasphalt & Eurobitume Congress | 1-3 June 2016 | Prague, Czech Republic

2.4. Determination of the Basic Binder Application Rate
After determining average least dimension of aggregate and daily equivalent standard vehicle traffic per lane,
Basic Binder Application Rate (Bt) to be used in the surface treatment is found from the chart in Figure 2.
Figure 2: Chart for determining the Basic Binder Application Rate
2.5. Making Corrections 2.5.1. Aggregate Bitumen Absorption Correction (Δabs)
Aggregates with high bitumen absorption values increase the amount of binder to be used because of extra bitumen
absorbed. Correction related to bitumen absorption shall be made by the following equation.
∆𝑎𝑏𝑠= 0,005 × 𝐴𝑏𝑆𝑏 × 𝐴𝐿𝐷 (3)
Where;
Δabs = Bitumen absorption correction of the aggregate
𝐴𝑏𝑆𝑏 = Bitumen absorption of the aggregate
ALD = Average Least Dimension of the aggregate
E&E Congress 2016 | 6th Eurasphalt & Eurobitume Congress | 1-3 June 2016 | Prague, Czech Republic

2.5.2. Climate Correction (Δc)
Climate has a crucial importance for the performance of surface treatments. While there are more bleeding and
embedment problems due to the traffic effects in warm climates, there are more stripping and raveling problems
in cold and rainy climates. Therefore, climatic conditions must be taken into account while determining both class
and the amount of the bitumen to be used in construction of surface treatment.
While making climate correction, booklet “Bitumen Grade Selection Maps for Hot Bituminous Mixture Paved
Roads” (KGM, 2012) showing the highest and the lowest pavement temperature values is used. Climate correction
will be made for the road sector designed as surface treatment according to the basic performance grading (PG).
Correction factor resulting from climate shall be chosen from Table 2.
Table 2: Selection Table of Climate Correction.
Basic Bitumen Performance Grading (PG)* Climate Correction, Δc
L/m2
70-16 -0.10
64-16 -0.06
64-22 -0.03
64-28 0
58-16 0
58-22 0.03
58-28 0.06
52-28 0.10
* Bitumen performance grade just based on temperature data (without traffic and road corrections)
2.5.3. Correction for Surface Texture (Δst)
The surface texture of the pavement on which the surface treatment is to be constructed affects the amount of
binder to be used. While the amount of binder to be used has to be increased in coarse surfaces, it has to be
decreased in bled and flushed surfaces. Surface texture depth (macrotexture) can be used as roughness level of the
surface and “Standard Test Method for Measuring Pavement Macrotexture Depth Using a Volumetric Technique”
(ASTM E 965-96, 2006) is used to measure the macrotexture depth. The texture class of an existing surface in the
design of surface treatment might be determined depending on the macrotexture depth by the help of Table 3.
Table 3: Table for the selection of surface texture class.
On the other hand, grain size of the aggregate on the existing surface and maximum grain size of the chipping of
surface treatment to be constructed also may affect the amount of binder. When aggregate on the existing surface
becomes coarser, gaps between the aggregates increase. If the dimension of chipping of new surface treatment is
small, they might fill these gaps and if the aggregate size is greater than the gap size, need for the bitumen to be
used is increased for the reason that the gaps could not be filled. This case is taken into account in the design using
ratio of the maximum grain size of the chipping (D) to maximum grain size of existing surface aggregate (Do).
Surface texture correction (Δst) is determined by using the graph on Figure 3 according to texture depth or surface
texture class and D/Do ratio.
Surface Texture Class Texture Depth, mm
Very coarse >2.0
Coarse 1.5-2.0
Well Textured 1.0-1.5
Smooth 0.5-1.0
Flushed <0.5
E&E Congress 2016 | 6th Eurasphalt & Eurobitume Congress | 1-3 June 2016 | Prague, Czech Republic

Figure 3: Graph for Surface Texture Correction.
2.5.4. Correction for Surface Hardness (Δsh)
The hardness of the surface on which surface treatment is placed is another factor affecting the amount of
bituminous binder to be used in surface treatment. Aggregate is more prone to embedment into the soft surfaces,
which requires less bitumen since it increases asphalt bleeding.
The most important parameter affecting the hardness of the existing road surface is the type of pavement. The
softer the existing surface is, the more aggregate embedment takes place. Whilst rigid pavements have very hard
surface, bituminous pavements have a medium and primed or non-primed aggregate surfaces have low hardness
values. Especially the compaction level of base layer significantly effects hardness of the surface.
Besides, a seasonal condition in which the surface treatment is constructed also affects the surface hardness. While
bituminous treatments show hard characteristics in cold and frost seasons, they might show softer behaviors during
the hot seasons.
Figure 4: Graph for Surface Hardness Correction Factor.
E&E Congress 2016 | 6th Eurasphalt & Eurobitume Congress | 1-3 June 2016 | Prague, Czech Republic

Therefore, hardness of existing surface of the surface treatment has to be checked before the construction. Ball
penetration test is one of the most common experimental methods used to determine surface hardness. It is used
to measure the penetration resistance of the road surface by applying Marshall Hammer on a standard ball as a
single pulse.
On the other hand, the embedment of the aggregates varies depending on the amount of traffic. After determining
the hardness class of the road surface from Table 4, surface hardness correction is determined by using hardness
class and DESV from Figure 4.
Table 4: Selection table for hardness class of road surface.
Degrees
of Surface
Hardness
Surface
Hardness
Class
Surface Identification
Ball
Penetration
Value
1 Extremely
Hard Concrete Pavement or cement-treat granular base <0.5 mm
2 Very Hard Highly oxidized, hardened bituminous mixture pavement 0.5-1 mm
3 Hard Less aged bituminous mixture pavement, more aged surface
treatment 1-2 mm
4 Medium Bled bituminous mixture pavement, old surface treatment of
medium-hardness, cold recycling of bituminous pavements 2-3 mm
5 Soft Less smooth coated base layer, less bled surface treatment 3-4 mm
6 Very Soft Smooth coated base layer, medium-bled surface treatment 4-5 mm
7 Extremely
Soft Very smooth coated base layer, extremely-bled surface treatment >5 mm
Note: Surface hardness classification identification on table is given for average temperate seasonal conditions.
On asphalt surfaces one grade softer class for very hot weather conditions, and one grade harder class for
cold weather conditions is chosen.
2.5.5. Temperature Correction (ΔT)
The experience gained in the construction of surface treatments demonstrates that atmospheric weather condition
and air temperature at the time of application significantly affects the performance of the surface treatment.
Embedment of aggregate and bitumen-aggregate adhesion decrease when the weather is cold and windy due to
rapid cooling. More aggregates are embedded into the surface in hot weather than when it is in cold weather during
both application and compaction under traffic. Therefore, the application rate of the binder has to be increased in
applications where temperature is low and decreased in applications where temperature is high.
Turkish Road Technical Specification (KTŞ, 2013) allows the BST to be applied only when the air temperature in
the shade is between 15 ºC and 45 ºC. In this respect, the air temperature of 30 ºC has been accepted as ideal
reference BST application temperature, and 1 % of the deviation from 30 ºC is recommended as a temperature
correction in this method. Accordingly, temperature correction (ΔT) for air temperature T is determined by means
of following equation.
ΔT (L/m2) = (30−𝑇)
100 (4)
2.6. Determination of Design Amount of Binder
After determining basic binder application rate, aggregate bitumen absorption, climate, surface texture and surface
hardness together with modified bitumen factor (Fm), Design Binder Application Rate to be used (Bd) is determined
by means of following equation for double and single layered surface treatments.
E&E Congress 2016 | 6th Eurasphalt & Eurobitume Congress | 1-3 June 2016 | Prague, Czech Republic

For single layered surface treatments:
Bd = 𝐵𝑡 . 𝐹𝑚+ ∆𝑐+ ∆𝑎𝑏𝑠+ ∆𝑠𝑡+ ∆𝑠ℎ+ ∆𝑇
𝑅 (5)
For double layered surface treatments:
Double layered surface treatment here refers to second layer application of chipping immediately after first layer
before permitting the traffic. The method used for the single layered surface treatments is also used for the double
layered surface treatments. However, basic binder application rate has to be reduced by 15 % due to reduction in
voids in the first layer of the surface treatment. Second layer basic binder application rate is found same as that of
first layer, but without surface texture, surface hardness and climate corrections. Accordingly,
Bituminous binder required in the first layer:
B1 = 0,85 . 𝐵𝑡1 . 𝐹𝑚1+ ∆𝑐1+ ∆𝑎𝑏𝑠1+ ∆𝑠𝑡1+ ∆𝑠ℎ1
𝑅1 (6)
Bituminous binder required in the second layer:
B2 = 𝐵𝑡2 . 𝐹𝑚2+ ∆𝑎𝑏𝑠2
𝑅2 (7)
Where;
Bt = Basic binder content, L/m2
Fm = Modified bitumen factor
Δc = Climate Correction, L/m2
Δabs = Aggregate Bitumen Absorption Correction, L/m2
Δst = Correction for Surface Texture
Δsh = Correction for Surface Hardness
ΔT = Temperature Correction
R = Residual bitumen ratio (e.g. 0.6 for the bitumen that contain 60 % bitumen)
Fm given here is modified bitumen factor and selected from Table 5. Basic binder application rate is increased
when using modified binder in surface treatment.
Meanwhile, residual binder content has to be considered in design especially in case of bitumen emulsion or cut-
back bitumen. In this case Design Binder Application Rate is increased in the ratio of the residual binder content
(R) [3].
Table 5: Selection table for Modified Bitumen Factor
While designing binder application rate for each layer in double layered bituminous surface treatments, seasonal
weather condition has to be taken into consideration. In hot seasons 60%, in moderate seasons 50% and in cold
seasons 40% of the total binder of both layers is recommended to use in the first layer and the rest is in the second
layer. Accordingly, as “ks” is seasonal factor, binder content (Bd1,2 ) to be applied for each layer is determined by
using following equation:
𝐵𝑑1,2= 𝑘𝑠 . (𝐵1 + 𝐵2) (8)
Type of Surface Treatment Modified Bitumen Factor , Fm
Normal Bituminous Surface Treatments 1.0
Modified Bituminous Surface Treatments 1.1
Stress Absorbing Membrane Layer (SAM) 1.3
Stress Absorbing Membrane Interlayer (SAMI) 1.7
E&E Congress 2016 | 6th Eurasphalt & Eurobitume Congress | 1-3 June 2016 | Prague, Czech Republic
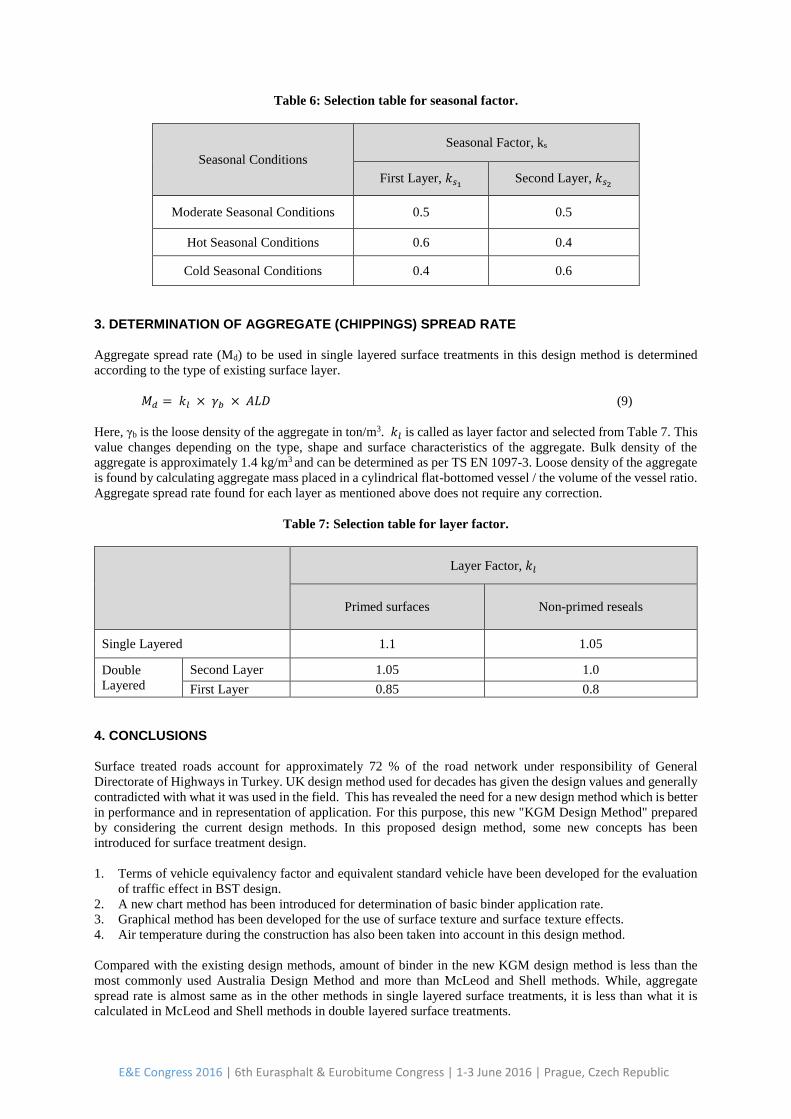
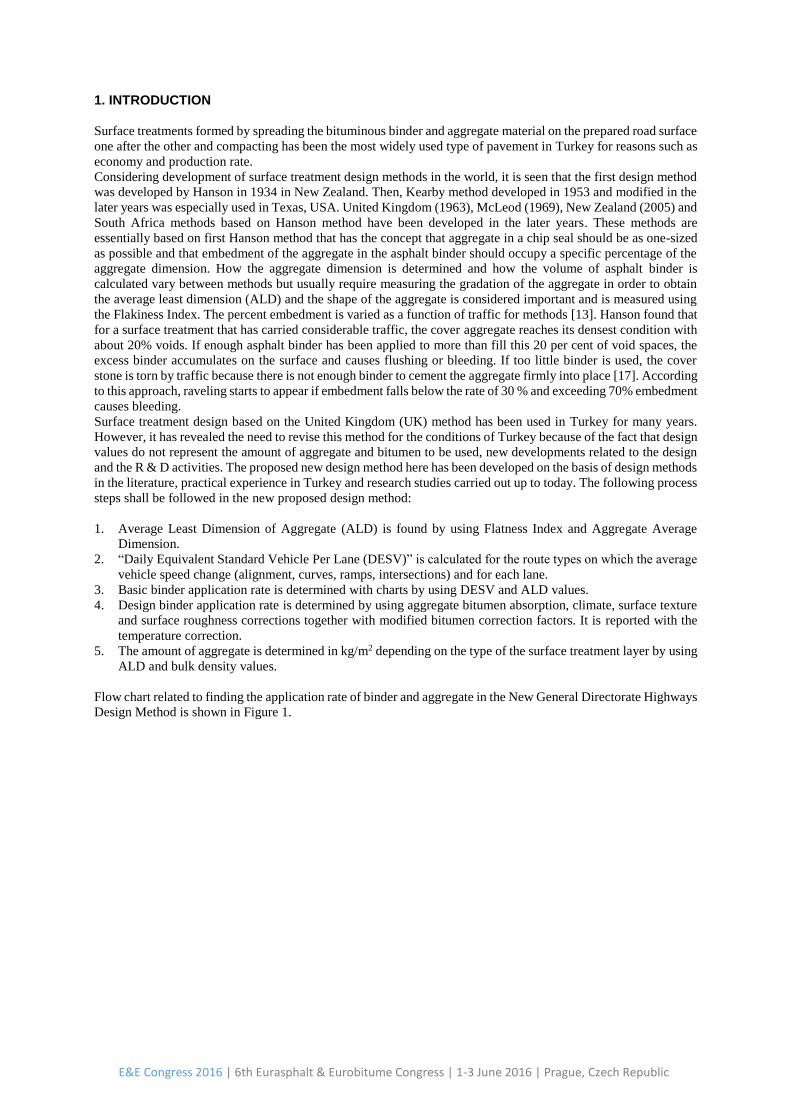
Table 6: Selection table for seasonal factor.
Seasonal Conditions
Seasonal Factor, ks
First Layer, 𝑘𝑠1 Second Layer, 𝑘𝑠2
Moderate Seasonal Conditions 0.5 0.5
Hot Seasonal Conditions 0.6 0.4
Cold Seasonal Conditions 0.4 0.6
3. DETERMINATION OF AGGREGATE (CHIPPINGS) SPREAD RATE
Aggregate spread rate (Md) to be used in single layered surface treatments in this design method is determined
according to the type of existing surface layer.
𝑀𝑑 = 𝑘𝑙 × 𝛾𝑏 × 𝐴𝐿𝐷 (9)
Here, γb is the loose density of the aggregate in ton/m3. 𝑘𝑙 is called as layer factor and selected from Table 7. This
value changes depending on the type, shape and surface characteristics of the aggregate. Bulk density of the
aggregate is approximately 1.4 kg/m3 and can be determined as per TS EN 1097-3. Loose density of the aggregate
is found by calculating aggregate mass placed in a cylindrical flat-bottomed vessel / the volume of the vessel ratio.
Aggregate spread rate found for each layer as mentioned above does not require any correction.
Table 7: Selection table for layer factor.
Layer Factor, 𝑘𝑙
Primed surfaces Non-primed reseals
Single Layered 1.1 1.05
Double
Layered
Second Layer 1.05 1.0
First Layer 0.85 0.8
4. CONCLUSIONS
Surface treated roads account for approximately 72 % of the road network under responsibility of General
Directorate of Highways in Turkey. UK design method used for decades has given the design values and generally
contradicted with what it was used in the field. This has revealed the need for a new design method which is better
in performance and in representation of application. For this purpose, this new "KGM Design Method" prepared
by considering the current design methods. In this proposed design method, some new concepts has been
introduced for surface treatment design.
1. Terms of vehicle equivalency factor and equivalent standard vehicle have been developed for the evaluation
of traffic effect in BST design.
2. A new chart method has been introduced for determination of basic binder application rate.
3. Graphical method has been developed for the use of surface texture and surface texture effects.
4. Air temperature during the construction has also been taken into account in this design method.
Compared with the existing design methods, amount of binder in the new KGM design method is less than the
most commonly used Australia Design Method and more than McLeod and Shell methods. While, aggregate
spread rate is almost same as in the other methods in single layered surface treatments, it is less than what it is
calculated in McLeod and Shell methods in double layered surface treatments.
E&E Congress 2016 | 6th Eurasphalt & Eurobitume Congress | 1-3 June 2016 | Prague, Czech Republic

REFERENCES
[1] ASTM D 4791-05, (2006), Standard Test Method for Flat Particles, Elongated Particles or Flat and Elongated
Particles in Coarse Aggregate, Vol.04.03.US: American Society for Testing and Materials, Annual Book of
ASTM Standards.
[2] ASTM E 965-96, (2006), Standard Test Method for Measuring Pavement Macrotexture Depth Using a
Volumetric Technique. American Society for Testing and Materials.
[3] Austroads, (2001), AP-T09/01 Austroads Provisional Sprayed Seal Design Sydney: Austroads.
[4] Austroads, (2006), AP-T68/06 Update of the Austroads Sprayed Seal Design Method, Sydney: Austroads.
[5] Caltrans, (2003),Maintenance Technical Advisory Guide (MTAG), Chapter5 Chip seals, Caltrans Division of
Maintenance, California
[6] Gransberg, D., & James, D. (2005). Chip Seal Best Practices, Transportation Research Board, Washington
D.C.,
[7] Hanson, M. F., (1934-35), Bituminous Surface Treatment of Rural Highways Preceedings. New Zealand
Society of Civil Engieers, Volume 21.
[8] KGM, (1993), Bitümlü Karışımlar Laboratuar El Kitabı, Teknik Araştırma Dairesi Başkanlığı, Ankara.
[9] KGM, (2007), Sathi Kaplamalı Yollar İçin Bitüm Sınıfı Seçim Haritaları, Araştırma ve Geliştirme Dairesi
Başkanlığı, Ankara.
[10] KGM, (2012), BSK Kaplamalı Yollar İçin Bitüm Sınıfı Seçim Haritaları, Araştırma ve Geliştirme Dairesi
Başkanlığı, Ankara.
[11] KGM, (2013), Karayolları Teknik Şartnamesi. Ankara.
[12] Lee, J., Kim, Y.,(2009),Performance-Based Uniformity Coefficient of Chip Seal Aggregate. Journal of the
Transportation Research Board , 53-60.
[13] NCHRP Report680,(2011),Manual for Emulsion-Based Chip Seals for Pavement Preservation, Transportation
Research Board, Washington, D.C.
[14] TNZ-P17, (2002),Notes for the Specification of Bituminous Reseals, Wellington, New Zealand: Transit New
Zealand.
[15] Transit New Zealand, (2005),Chipsealing in New Zealand, Wellington: New Zealand.
[16] TRH3, (2007),Design and Construction of Surfacing Seals, Pretoria, South Africa: South African National
Roads Agency.
[17] Shuler, S., Performance of Chip Seals Using Local and Minimally Processed Aggregates for Preservation of
Low Traffic Volume Roadways, Colorado Department of Transportation, Report No. CDOT-2013-7, 2013
[18] Wood, T.J., Janisch, D.W., Gaillard, F.S., Minnesota Seal Coat Handbook, Final Report, Revised Edition,
Minnesota Department of Transportation, 2006.
E&E Congress 2016 | 6th Eurasphalt & Eurobitume Congress | 1-3 June 2016 | Prague, Czech Republic