a profile of juvenile justice system activities and
TRANSCRIPT

A Profile of Juvenile Justice SystemActivities and Juvenile Delinquency Risk Factors in Knox County
120 S. Riverside Plaza, Suite 1016
Chicago, Illinois 60606
Tel: (312) 793-8550 Fax: (312) 793-8422
TDD: (312) 793-4170
www.icjia.state.il.us
Prepared by
The Research and Analysis Unit
Rod R. Blagojevich Governor
Candice M. Kane
Executive Director
March 2003

The map on the front page is based on an 11-category classification scheme that was adopted for this profile. This classification scheme is based on the 1993 Rural-Urban Continuum Codes. The U.S. Department of Agriculture’s Economic Research Service (ERS) developed the Rural-Urban Continuum Codes to measure and evaluate the economic and social diversity of counties and to provide classifications that are meaningful for developing public policies and programs (U.S. Department of Agriculture, 2000). The codes classify counties based on “population size, proximity to a metropolitan area, degree of urbanization, population of the largest city, commuting patterns, as well as primary economic activity and policy relevancy” (U.S. Department of Agriculture, 2000). Although the Rural-Urban Continuum Codes were primarily developed to classify rural areas, this scheme also distinguishes between urban counties. For a more in-depth discussion of why this classification scheme was used, please refer to the Method section of the Introduction.
Legend – Rural-Urban Continuum 1993
Cook County
Chicago and suburban Cook County
Central Counties, Metro Area>1 million
Fringe Counties, Metro Area>1 million
Counties in Metro Area 250,000 to 1 million
Counties in Metro Areas < 250,000 pop
Urban Pop>=20,000, Adjacent to Metro AUrban Pop>=20,000, Not Adjacent to Metro AUrban Pop 2,500 to 19,999, Adjacent to Metro AUrban Pop 2,500 to 19,999, Not Adjacent to Metro ACompletely Rural or Pop< 2,500, Adjacent to Metro ACompletely Rural or Pop<2,500, Not Adjacent to Metro
Metro Counties
Non-Metro Counties
This project was supported by Grant # 98-JN-FX-0112 (S-2), awarded to the Illinois Criminal Justice Information Authority by the Bureau of Justice Assistance, Office of Justice Programs, and U.S. Department of Justice through the Justice Research and Statistics Association. The Assistant Attorney General, Office of Justice Programs, coordinates the activities of the following programs, offices, and bureaus: Bureau of Justice Assistance, Bureau of Justice Statistics, National Institute of Justice, Office of Juvenile Justice and Delinquency Prevention, and the Office for Victims of Crime. Points of view or opinions contained within this document are those of the authors and do not necessarily represent the official position or policies of the U.S. Department of Justice.
Illinois Criminal Justice Information Authority
120 S. Riverside Plaza, Suite 1016 Chicago, Illinois 60606-3997
Telephone (312) 793-8550 Telefax (312) 793-8422
World Wide Website http://www.icjia.state.il.us

The Illinois Criminal Justice Information Authority's Web-based clearinghouse of criminal justice data
available at: www.icjia.state.il.us
ACKNOWLEDGMENTS The information presented in this profile has been provided to the Authority by a number of state and federal agencies. The Authority’s Research and Analysis Unit is grateful for the assistance provided by the following organizations:
Administrative Office of the Illinois Courts Illinois Department of Children and Family Services
Illinois Department of Corrections Illinois Department of Human Services
Illinois Department of Human Services’ Office of Alcoholism and Substance Abuse Illinois Department of Public Health Illinois Juvenile Justice Commission
Illinois State Board of Education Illinois State Police
U.S. Department of Commerce, Bureau of the Census The U.S. Department of Agriculture’s Economic Research Service
The following Research and Analysis Unit staff developed this document:
Sharyn Adams Megan Alderden Robert Bauer Kimberly Burke Alissa Clark Chris Devitt Jennifer Hiselman David Katz Tim Lavery Eileen McDermott Christine Martin Ernst Melchior Mark Myrent Erica Morrow Tom Nichol David Olson Adriana Perez Gerard Ramker Michelle Repp Phillip Stevenson

CONTENTS Section Page Number
EXECUTIVE SUMMARY .....................................................................................................................................i INTRODUCTION ..................................................................................................................................................1 I. KNOX COUNTY..............................................................................................................................................6 II. JUVENILE JUSTICE SYSTEM.......................................................................................................................8
A. Delinquency Petitions and Adjudications................................................................................................10 B. Juvenile Transfers to Adult Court............................................................................................................14 C. Juvenile Probation ...................................................................................................................................14 D. Juvenile Detention ...................................................................................................................................19 E. Juvenile Admissions to Illinois Youth Centers........................................................................................23 F. Disproportionate Minority Representation Index.....................................................................................26 G. Conclusion...............................................................................................................................................30
III. JUVENILE RISK FACTORS........................................................................................................................32
A. Risk Factors in Illinois ............................................................................................................................36 B. Risk Factors in Knox County ..................................................................................................................38
1. Individual Factors .............................................................................................................................38 2. Social Factors ...................................................................................................................................39 3. School Factors ..................................................................................................................................52 4. Environmental Factors......................................................................................................................60 5. Other Risk Factors ............................................................................................................................73
C. Conclusion...............................................................................................................................................75 IV. COMMUNITY-BASED PROGRAMS........................................................................................................79 V. REFERENCES..............................................................................................................................................83 APPENDIX A: County Urban-Rural Designations .............................................................................................84 APPENDIX B: Juvenile Justice System and Risk Factor Rates, 2000 ................................................................88 APPENDIX C: Identifying Significant Changes or Differences Between Numbers...........................................96 APPENDIX D: Measures That Were Correlated and Correlations Between Juvenile Risk Factors ...................99

LIST OF FIGURES Figure Page Number Figure 1. Flowchart of the Juvenile Justice System Process.................................................................................9 Figure 2. Delinquency Petition Filing Rates, 1990-2000....................................................................................11 Figure 3. Delinquency Adjudication Rates, 1990-2000......................................................................................12 Figure 4. Percent of Delinquency Petitions Filed and Adjudicated Delinquent, 1990-2000 ..............................13 Figure 5. Informal Probation Supervision Rates, 1990-2000 .............................................................................15 Figure 6. Continued Under Supervision Rates, 1990-2000 ................................................................................16 Figure 7. Annual Active Juvenile Probation Caseload Rates, 1990-2000 ..........................................................17 Figure 8. Demographic, Offense, and Probation Outcome Characteristics, 2001 ..............................................18 Figure 9. Total Admission Rates to Temporary Detention Centers, 1992-2000.................................................20 Figure 10. Percent of Detention Center Admissions Accounted for by Pre-adjudicatory Admissions,
1992-2000...........................................................................................................................................21 Figure 11. Total Admissions to Juvenile Detention Centers by Race, 1998-2000 ..............................................22 Figure 12. Admissions to Juvenile Detention Centers by Offense Type, 1990-2000..........................................23 Figure 13. Juvenile Admission Rates to IDOC, SFY 1993– SFY 2000 ..............................................................24 Figure 14. Representation Index for Detention Center Admissions, 1998-2000 .................................................28 Figure 15. Juvenile Representation Index for Illinois Youth Center Admissions, 1993-2001 ............................29 Figure 16. Drug Treatment Rates for Females with Children, 1995-2001 ..........................................................41 Figure 17. Rates of Inmates with Children, SFY 1991 – SFY 2001....................................................................42 Figure 18. Rates of Orders of Protection that Protect Minors, 1993-2000 ..........................................................44 Figure 19. Reported Child Abuse and Neglect Rates, SFY 1990 – SFY 2000....................................................46 Figure 20. Percent of Child Abuse and Neglect Cases that were Indicated, SFY 1990 – SFY 2000 ..................47 Figure 21. Reported Child Sexual Abuse Rates, SFY 1990 – SFY 2000 ............................................................48 Figure 22. Percent of Child Sexual Abuse Cases that were Indicated, SFY 1990 – SFY 2000...........................49 Figure 23. Divorce and Annulment Rates, 1990-2000 ........................................................................................50 Figure 24. Truancy Rates, 1990/1991 – 2000/2001.............................................................................................54 Figure 25. Percent of Truants in Knox County that were Chronic Truants, 1990/1991 – 2000/2001 .................55 Figure 26. Suspension Rates, 1990/1991 – 2000/2001 ........................................................................................56 Figure 27. Percent of Suspended Students in Knox County who were Suspended More than Once,
1990/1991 – 2000/2001 .....................................................................................................................57 Figure 28. Expulsion Rates, 1990/1991 – 2000/2001 ..........................................................................................58 Figure 29. High School Dropout Rates, 1990/1991 – 2000/2001........................................................................59 Figure 30. Unemployment Rates, 1990-2000 ......................................................................................................62 Figure 31. Family Public Assistance Rates (AFDC and TANF), SFY 1990 – SFY 2000...................................64 Figure 32. Total Drug Arrest Rates, 1990-2000 ..................................................................................................66 Figure 33. Percent of Drug Arrests accounted for by Violations of the Controlled Substances Act,
1990-2000..........................................................................................................................................67 Figure 34. Total Violent Index Offense Rates, 1990-2000..................................................................................69 Figure 35. Knox County Violent Index Offense Rates by Offense Type, 1990-2000.........................................70 Figure 36. Percent of the Population accounted for by Minorities, 1990-1999 ...................................................71 Figure 37. Birth Rates for Females Ages 10 to 17 years, 1993-2000 ..................................................................73 Figure 38. Adolescent Drug and Alcohol Treatment Admission Rates, 1994-2001............................................74 Figure 39. Percent of Services Provided to Adolescent Clients Living in Knox County by Primary
Substance Abused, 1994-2001...........................................................................................................75
LIST OF TABLES Table Page Number Table 1. Knox County Comparison Groups..........................................................................................................4 Table 2. Populations Used to Calculate Rates ......................................................................................................4 Table 3. Racial and Ethnic Characteristics of Knox County Residents in 1990 and 2000 ...................................7 Table 4. Juvenile Justice System Data Examined.................................................................................................8 Table 5. Delinquency Petition Filing Rates: Overall Findings ...........................................................................11 Table 6. Delinquency Adjudication Rates: Overall Findings .............................................................................12 Table 7. Percent of Delinquency Petitions Filed and Adjudicated Delinquent: Overall Findings......................13 Table 8. Informal Probation Supervision Rates: Overall Findings .....................................................................15 Table 9. Continued Under Supervision Rates: Overall Findings........................................................................16 Table 10. Annual Active Juvenile Probation Caseload Rates: Overall Findings.................................................17 Table 11. Total Admission rates to Temporary Detention Centers: Overall Findings ........................................20 Table 12. Percent of Detention Center Admissions Accounted for by Pre-adjudicatory Admissions:
Overall Findings .................................................................................................................................21 Table 13. Juvenile Admission Rates to IDOC: Overall Findings ........................................................................24 Table 14. Characteristics of Juveniles Admitted to Illinois Youth Centers, SFY 1993-2001 .............................25 Table 15. Overall Differences and Similarities between Knox County and Bordering Counties,
Similar Counties, and Statewide for each Data Point Examined........................................................31 Table 16. Overall Changes in Knox County for each Juvenile Justice System Data Point .................................31 Table 17. Juvenile Delinquency Risk Factor Data that were Examined..............................................................35 Table 18. Correlation between Juvenile Delinquency Risk Factors and Juvenile Justice System Data
for all Illinois Counties .......................................................................................................................37 Table 19. Emergency Room Admission Rates for Attempted and Completed Suicides, Minors Ages
0 to 17 Years.......................................................................................................................................39 Table 20. Emergency Room Admission Rates for Attempted and Completed Suicides: Overall
Findings ..............................................................................................................................................39 Table 21. Total Drug Treatment Rates for Females with Children: Overall Findings.........................................41 Table 22. Rates of Inmates with Children: Overall Findings...............................................................................42 Table 23. Order of Protection Rates: Overall Findings........................................................................................44 Table 24. Reported Domestic Offense Rates, 1997-2000....................................................................................45 Table 25. Reported Domestic Offense Rates: Overall Findings ..........................................................................45 Table 26. Reported Child Abuse and Neglect Rates: Overall Findings...............................................................47 Table 27. Percent of Child Abuse and Neglect Cases that were Indicated: Overall Findings .............................48 Table 28. Reported Child Sexual Abuse Rates: Overall Findings .......................................................................49 Table 29. Percent of Child Sexual Abuse Cases that were Indicated: Overall Findings .....................................50 Table 30. Divorce and Annulment Rates: Overall Findings ................................................................................51 Table 31. Total Net Domestic Migration, July 1, 1990 to July 1, 1999...............................................................52 Table 32. Percent of Students who Met or Exceeded ISAT or PSAE Standards.................................................53 Table 33. Truancy Rates: Overall Findings .........................................................................................................54 Table 34. Suspension Rates: Overall Findings ....................................................................................................56 Table 35. Expulsion Rates: Overall Findings ......................................................................................................58 Table 36. High School Dropout Rates: Overall Findings ....................................................................................59 Table 37. Estimated Percent of Persons Living in Poverty, 1993, 1995, 1997, and 1998 ...................................61 Table 38. Estimated Percent of Persons Under 18 Living in Poverty, 1993, 1995, 1997, and 1998 ...................61 Table 39. Unemployment Rates: Overall Findings..............................................................................................63 Table 40. Estimated Median Household Income, 1993, 1995, 1997, and 1998 ..................................................63 Table 41. Family Public Assistance Rates: Overall Findings ..............................................................................65 Table 42. Total Drug Arrest Rates: Overall Findings ..........................................................................................66 Table 43. Percent of Drug Arrests accounted for by Violations of the Controlled Substances Act:
Overall Findings...................................................................................................................................67 Table 44. Drug Submission Rates, 1998-2001 ....................................................................................................68

LIST OF TABLES (continued) Table Page Number Table 45. Total Violent Index Offense Rates: Overall Findings .........................................................................70 Table 46. Percent of the Population Accounted for by Minorities: Overall Findings .........................................72 Table 47. Birth Rates by Females Ages 10 to 17 years: Overall Findings ..........................................................73 Table 48. Adolescent Drug and Alcohol Treatment Admission Rates: Overall Findings ...................................74 Table 49. Overall Differences and Similarities between Knox County and the Bordering Counties,
Similar Counties and Statewide for each Risk Factor Examined........................................................77 Table 50. Overall Changes in Knox County for each Risk Factor Examined .....................................................78

i
EXECUTIVE SUMMARY In recent years, there has been growing concern regarding juvenile crime and the desire to develop preventive strategies to reduce juvenile delinquency. This profile contains information about the characteristics of Knox County residents and juvenile justice system activities, juvenile delinquency risk factors, and community-based programs that serve youth living in the county. This profile includes a section on risk factors based on recent research about juvenile delinquency in an effort to help county officials identify ways to prevent juvenile crime in their jurisdictions. Using this Profile The purpose of this profile is to assist county practitioners, policymakers, and community members in learning, discussing, and making decisions about their county’s juvenile justice system and the youth living in their communities. The profile consists of four main sections. The first section, Knox County, provides a description of the county’s population. The second section, Juvenile Justice System, provides an in-depth description of Knox County’s juvenile justice system activities. The third section, Juvenile Risk Factors, examines risk factors that have been linked to juvenile delinquency. The fourth section, Community-Based Programs, provides a description of programs available in Knox County. Overall conclusions are available at the end of the Juvenile Justice System and Juvenile Risk Factor sections. The conclusions are based on those findings that were identified by Authority staff as being the most important issues that emerged from our analyses. Although this summary was developed to provide readers with a short overview, juvenile justice councils or professionals wishing to use the information provided below to make decisions about their county’s juvenile justice system or youth are strongly encouraged to review the full report, as it contains additional information and analyses for the data points presented below. When reviewing the overall findings presented below, readers should consider the following questions. • What are some explanations for the findings (e.g., increases, decreases, no changes) presented in this
report?
Although some patterns or trends were identified (see the conclusions at the end of the Juvenile Justice System and Juvenile Risk Factors sections), Authority staff were unable to provide decisive reasons why these patterns or trends exist because we are not intimately involved in the day-to-day operations of the juvenile justice system or work directly with youth living in Knox County. Several factors, including departmental policies and procedures or the ways in which the data were collected, may account for why specific patterns or trends emerged from our analyses. Juvenile justice practitioners, service providers, and community members should consider the findings presented in this document in light of what they know about and have experienced in their communities.
• What other factors influence youth involvement with the juvenile justice system?
Most of the data presented in this report are limited to juvenile justice system activities and juvenile risk factors in Knox County. Although the risk factor section was included to help juvenile justice councils and practitioners identify ways to prevent juvenile crime, it is important to note that experiencing risk factors does not necessarily mean a youth will become involved in the juvenile justice system. Other factors, such as protective factors—factors found to “protect” youth from engaging in delinquent activities—or departmental policies and other system factors unique to Knox County may influence the trends presented in this report. Thus, it is important that the patterns and trends identified in this document are supplemented with additional data on factors that could potentially influence youth’s involvement in the system.

ii
• Given the information presented in this profile, what are the most pressing issues in Knox County and how should those issues be addressed?
Identifying the most important issues in your county is difficult. To best determine which issues should be addressed in your county, it is important to collect and examine information not only regarding the needs and issues facing the juvenile justice system and youth in Knox County, but also what programs currently exist, what programs are effective, and what policies have been implemented that might have impacted the trends identified. Although this profile contains a vast amount of information, this profile is not a comprehensive overview of all the issues that youth or the juvenile justice system face in Knox County. It is important that juvenile justice council members and practitioners consider collecting additional data before making any decisions about which issues to address first. In fact, this profile should be only considered the first step in identifying possible issues facing the juvenile justice system or youth in Knox County.
• What additional data are available that can provide important information about the juvenile justice system
or youth residing in Knox County?
The data presented in this profile represent those that were available to the Authority staff and believed important. Juvenile justice councils and practitioners utilizing this document should consider collecting additional and more detailed, individual-level data to aid the interpretation of the analyses presented below. This may entail contacting local agencies to determine what additional types of juvenile justice system, juvenile risk factor, or protective factor data are available.
Method The analyses conducted for the full report were used to (1) examine trends in Knox County; (2) examine trends in bordering counties, similar counties, and the state as a whole; and (3) compare Knox County to bordering counties, similar counties, and the state as a whole. In addition to these three types of analyses, more in-depth examinations by gender, race, ethnicity, and offense types were conducted when individual-level data were available. In many instances, the data examined are presented in figures. Although figures are a useful tool, it is possible for figures to visually display changes or differences that seem large, but are actually less important than they appear. Conversely, it is also possible for figures to visually display changes or differences that appear small, but are actually important. To circumvent relying exclusively on the visual inspection of figures or on simple numbers such as percent change from one year to the next, a statistical process was adopted to provide researchers with the ability to identify if changes across time or the differences between Knox County and the other groups examined were significant. Caution should be also taken when interpreting trends that are identified as having no significant change between the time periods analyzed. One assumption readers often make is that no significant change means that the trend or pattern is not important. This assumption could cause readers to overlook important trends and patterns. Knox County This section describes the demographic characteristics and trends in Knox County. In 2000, the population density in Knox County was 78 persons per square mile. When compared to the other 101 Illinois counties, Knox County ranked 31st in population density in 2000. When examining only those persons at-risk for involvement in the juvenile justice system (i.e., juveniles ages 5 to 16 years), it was found from 1990 to 2000 the juvenile population in Knox County decreased 10 percent. In 2000, juveniles ages 5 to 16 years accounted for 15 percent of Knox County’s total population.
iii
Racial comparisons between 1990 and 2000 data could not be made due to differences in the way the U.S. Census Bureau collected data in 2000. Of the total non-Hispanic population in Knox County in 1990, 94 percent identified themselves as white, while 5 percent identified themselves as black. Those identifying themselves as being Hispanic constituted 3 percent of the total population in Knox County in 1990. Of the total non-Hispanic population in Knox County in 2000, 92 percent identified themselves as only white and 6 percent identified themselves as only black. Additionally, 3 percent identified themselves as being Hispanic. Juvenile Justice System The Juvenile Justice System section focuses on various system activities including: juvenile delinquency petitions; delinquency adjudications; active, end-of-year probation caseloads; transfers to adult court; temporary detention admissions; and admissions to the Illinois Department of Corrections’ (IDOC) Illinois Youth Centers (IYC).1 Additionally, this section includes a description of the over or under representation of white and minority youth admitted to juvenile temporary detention centers and Illinois Youth Centers in Knox County. Important Note: Authority researchers were unable to obtain data for several decision points in the Knox County juvenile justice system. One critical decision point researchers were unable to examine was juvenile arrests. This decision point is important to understanding how the juvenile justice system works because it is the entrance point into the juvenile justice system for most youth. Under the Illinois Uniform Crime Reporting (I-UCR) program, all law enforcement agencies in the state are required to report monthly offense and arrest data to the Illinois State Police (ISP). Although in the past ISP collected more detailed offense and arrest information, since 1993, ISP has collected only aggregate-level offense and arrest data from law enforcement agencies across the state. These aggregate totals combine offense and arrest data across sex, race, ethnicity, and age. The collection of offense and arrest data at the aggregate-level prevents researchers from examining juvenile offenders (offenders 16 years or younger). Below are figures for those decisions points in the Knox County juvenile justice system for which data were available.
1 The Juvenile Justice Reform Act of 1998 changed some of the language of the juvenile justice system (Public Act 90-590; 750 ILCS 405/5-105). Specifically, “taken into custody” is now “arrested,” “adjudication hearing” is a “trial,” and “dispositional hearing” is now a “sentencing hearing.” This report reflects these language changes with the exception of the term adjudication. The term “adjudication” is used in this report to reflect those youth who have been petitioned to court and found delinquent (guilty). This term is used because we felt it was the best word to describe juveniles found delinquent and it is a common word used juvenile justice practitioners.

iv
Figure S.1 Delinquency Petition and Adjudication Rates for Knox County
Figure S.2 Continued Under Supervision and Annual Active Juvenile Probation
Caseload Rates for Knox County
A delinquency petition is a formal filing in juvenile court for a delinquent offense. Delinquency adjudications are instances when there has been a trial, or a hearing to determine whether allegations in a delinquency petition are true beyond a reasonable doubt, and a minor has been found delinquent by a judge. According to AOIC, delinquency adjudications exclude plea agreements and dispositions resulting from other types of hearings. There was no significant difference between the Knox County delinquency petition rate in 1990 and the rate in 2000, although there were fluctuations throughout the decade. Overall, from 1990 to 2000, Knox County delinquency petition rates were lower than rates in bordering counties, similar counties, and statewide. There was no significant difference between the Knox County delinquency adjudication rate in 1990 and 2000. Overall, from 1990 to 2000, there were no significant differences between Knox County delinquency adjudication rates and rates in bordering counties, similar counties, and statewide.
Rate per 100,000 persons ages 10 to16 years. Source: Administrative Office of the Illinois Courts; U.S. Census Bureau.
Juveniles whose cases were continued under supervision have had their cases petitioned to court, but have not been adjudicated delinquent (found guilty). Juveniles placed on juvenile probation have been adjudicated delinquent. Continued under supervision rates in Knox County remained low throughout the time period examined, and did not significantly change from 1990 to 2000. Continued under supervision rates in Knox County were significantly lower than the rates in bordering counties, similar counties, and statewide. Although Knox County probation caseload rates appeared to increase, the increase was not significant. Overall, from 1990 to 2000, Knox County probation caseload rates did not significantly differ from rates in bordering counties, similar counties, and statewide.
Rate per 100,000 persons ages 10 to16 years. Source: Administrative Office of the Illinois Courts; U.S. Census Bureau.
0
200
400
600
800
1,000
1,200
1,400
1,600
1,800
1990 1991 1992 1993 1994 1995 1996 1997 1998 1999 2000
Petition Rate
Adjudication Rate
0
250
500
750
1,000
1,250
1,500
1990 1991 1992 1993 1994 1995 1996 1997 1998 1999 2000
Continued UnderSupervision Rate
Annual Probation Caseload Rate
v
Figure S.3
Total Admission Rate to Temporary Detention Centers for Knox County
Figure S.4 Admission Rates to the Illinois Department of Corrections’ (IDOC) Illinois Youth Centers
for Knox County
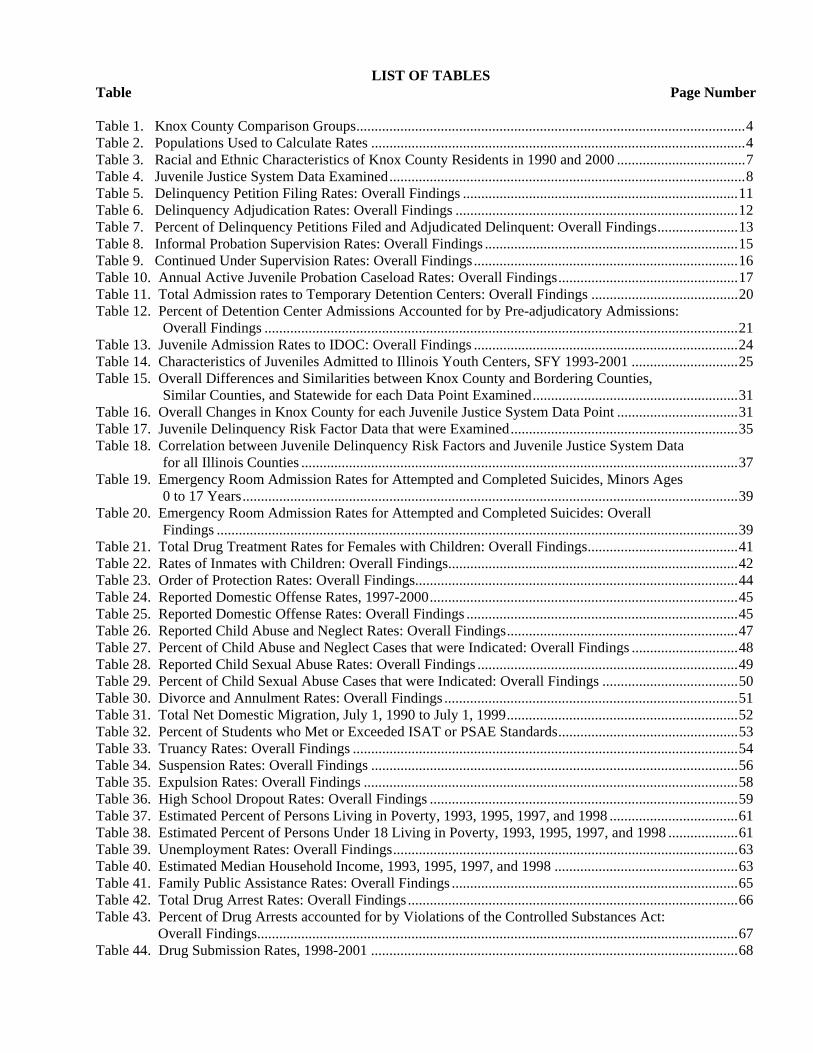
The Illinois Department of Corrections (IDOC) provides long-term placement for juvenile offenders found guilty. Juveniles may be also sent to IDOC for psychological evaluations. The 1990 Knox County admission rate to Illinois Department of Corrections’ (IDOC) Illinois Youth Centers did not significantly differ from the 2000 rate. There was fluctuation in Knox County admission rates during the time period examined. The Knox County admission rate to IDOC did not significantly differ from rates in similar counties, bordering counties, and statewide. A large proportion of juveniles admitted to the IDOC’s Illinois Youth Centers from Knox County were male and white. A majority were admitted for property offenses (65 percent).
Rate per 100,000 persons age 13 to16 years. Source: Illinois Department of Corrections; U.S. Census Bureau.
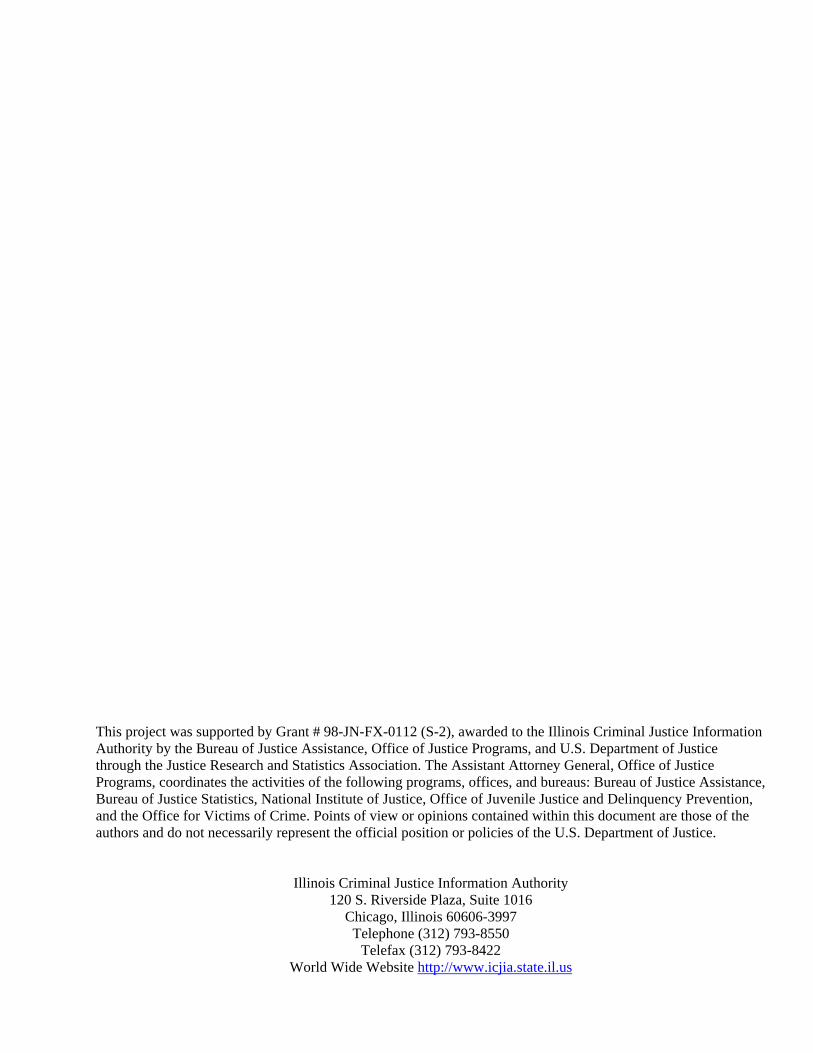
Juvenile detention is used as temporary placement for juvenile offenders either prior to (pre-adjudicatory) or following sentencing (post-adjudicatory). From 1992 to 2000, the total admission rate to temporary detention centers for Knox County increased significantly. Knox County detention center admission rates were significantly higher than rates in similar counties, bordering counties, and statewide. Differences found between Knox County detention center admission rates and rates in other groups examined may be due to the fact that Knox County has a juvenile detention center, while a majority of the counties in the other groups examined do not. This is important because research has found having a detention center is significantly correlated with an increase in detention rates (Smith, 1998). A majority of Knox County admissions to detention centers from 1992 to 2000 were pre-adjudicatory admissions (60 percent).
Rate per 100,000 persons ages 10 to16 years. Source: Administrative Office of the Illinois Courts; U.S. Census Bureau.
0
500
1,000
1,500
2,000
2,500
3,000
3,500
4,000
1992 1993 1994 1995 1996 1997 1998 1999 2000
0
50
100
150
200
250
300
350
400
450
1993 1994 1995 1996 1997 1998 1999 2000

vi
Figure S.5
Representation Index for Detention Center Admissions, 1998-2000
Important Trends or Patterns: Juvenile Justice System
• From 1990 to 2000, Knox County delinquency petition filing rates tended to be lower than the other groups examined (similar counties, bordering counties, and statewide).
• From 1990 to 2000, Knox County detention admission rates tended to be higher than the other groups examined
(similar counties, bordering counties, and statewide). In addition, from approximately 1995 to 2000, relative to bordering counties or statewide, there was a tendency for a larger percentage of juvenile detention admissions in Knox County to occur post-adjudicatory. Both of these results may have occurred because Knox County has a juvenile detention center, while a majority of the counties in the other groups examined do not. Research has found that having a detention center is significantly correlated with an increase in detention rates (Smith, 1998).
• Across most of the decision points examined, Knox County did not have any notable changes over time. However,
there was an increase in detention admission rates from 1992 to 2000. • Of the juveniles admitted into juvenile detention centers from Knox County, the largest percentages were admitted
for warrant or court violations, or for property offenses. • African Americans accounted for 20 percent of juveniles admitted to juvenile detention centers (pre-adjudicatory
and post-adjudicatory) from Knox County, and 18 percent of juveniles admitted to Illinois Youth Centers. These percentages exceed the percentage of African-Americans in the general Knox County juvenile population. On the other hand, white Knox County juveniles were under represented among those in detention and Illinois Youth Centers compared to their representation in the general juvenile population.
• The quality and consistency of the data available at most of the decision points in the juvenile justice process
inhibits our ability to draw strong conclusions. There are no data on the actual number of juveniles arrested in Knox County. Moreover, most of the data presented above could not be broken down by race and ethnicity, gender, and age.
Figure S.5 shows the representation index (RI) for youth admitted to temporary detention centers from Knox County. The RI is used to help researchers determine if racial or ethnic groups are over or underrepresented at particular points in the juvenile justice process as compared to their representation in the general population. RIs between 0.90 and 1.09 are interpreted as “nearly proportional,” and anything outside of that range is interpreted as under or overrepresentation. Among juveniles placed in detention (pre-adjudicatory or post-adjudicatory), White juveniles were underrepresented, while African American and Hispanic juveniles were over-represented as compared to their representation in the general population. Although not shown in Figure S.5, a similar pattern of results emerged for representation among those admitted to IDOC Illinois Youth Centers. White juveniles were under-represented and African-American juveniles were over-represented (RI’s were not calculated for Hispanics).
Source: Illinois Department of Human Services, Juvenile Monitoring Information System.
0.00
0.50
1.00
1.50
2.00
2.50
3.00
3.50
4.00
4.50
5.00
Pre-Adjudicatory Post-Adjudicatory Total Detentions
White African-American Hispanic

vii
Juvenile Risk Factors The Juvenile Risk Factor section includes an examination of four types of risk factors: individual risk factors, social risk factors, school risk factors, and environmental risk factors. Trend and comparison analyses were conducted for each of the risk factors examined. Individual Risk Factors
Individual risk factors are personal traits or qualities that may be related to juvenile delinquency, including various types of mental and physical health problems. Only one individual risk factor was examined for this profile: emergency room admissions for completed or attempted suicides. From 1998 to 2000, there were 15 suicides attempted or completed by minors ages 17 years and younger in Knox County.2 Overall, the suicide rate in Knox County did not significantly differ from rates in bordering counties, similar counties, and statewide. Social Risk Factors Social risk factors are factors present in minors’ immediate social environments that may be related to juvenile delinquency. The data points described below measure five distinct social risk factors, each of which pertain to family relationships: (1) parental criminality, (2) family or home conflict, (3) prior abuse, (4) separation of family, and (5) family mobility.
Figure S.6 Drug Treatment Rates for Females with Children for Knox County
2 It is important to note that although the Illinois Department of Public Health (IDPH) reported that compliance with the reporting mandate has been high, the totals for 1998 may be low, as it took hospitals a period of time after the March 10 startup date to understand the violent injury-coding scheme provided to them by IDPH and to develop a system for collecting the data.
One indirect measure of parental criminality examined in this profile is drug treatment rates for females with children. 2001 Knox County drug treatment rates for females with children were significantly higher than rates in 1995. This appeared to be the result of an increase from 2000 to 2001. Overall, there were no significant differences between Knox County drug treatment rates for females with children and rates in similar counties, bordering counties, and statewide.
Rate per 100,000 females ages 13 to 70 years. Source: Illinois Department of Human Services, Office of Alcohol and Substance Abuse; U.S. Census Bureau.
0
50
100
150
200
250
300
350
1995 1996 1997 1998 1999 2000 2001

viii
Figure S.7
Rates of Inmates with Children for Knox County
Figure S.8 Order of Protection Rate for Knox County
Another indirect measure of parental criminality examined in this profile is the rate of prison inmates with children. From 1991 to 2001, there was no significant change in the rate of inmates with children from Knox County. However, there was an appreciable drop in rates from 1995 to 1997. Knox County inmate with children rates were comparable to rates in bordering counties and similar counties, but significantly lower than statewide rates. Although the effects of having any parent in prison can be difficult for children, the impact of females being incarcerated may be even more distressing for children because females are often the primary caregivers of their children. From 1991 to 2001, women with children accounted for 53 percent of women committed to IDOC from Knox County.
Rate per 100,000 persons 17 years and older. Source: Illinois Department of Corrections; U.S. Census Bureau.
One indirect measure of family or home conflict examined in this profile is the Order of Protection rate. Orders of Protection are court orders that are intended to protect those seeking the order from family or other household members (e.g., a spouse from his or her abuser). Orders of Protection can also be used to protect children. From 1993 to 2000, the Order of Protection rate in Knox County significantly decreased. Overall, the Knox County Order of Protection rates were significantly higher than rates in similar counties and statewide during the time period examined. However, in 1999 and 2000, there were no significant differences between Knox County rates and rates in similar counties and statewide. It is unknown, however, if differences between Knox County Order of Protection rates and rates experienced by the other groups examined are due to actual differences in the number of Orders of Protection issued, reporting compliance, or some other factor.
Rate per 100,000 persons ages 18 years and older. Source: Illinois State Police Department; U.S. Census Bureau.
0
20
40
60
80
100
120
140
1991 1992 1993 1994 1995 1996 1997 1998 1999 2000 2001
0
100
200
300
400
500
600
1993 1994 1995 1996 1997 1998 1999 2000

ix
Another indirect measure of family or home conflict examined in this profile was the reported domestic offense rate. The Knox County reported domestic offense rates were significantly lower than rates in bordering counties, similar counties, and statewide (Table not shown). Differences in reported domestic offenses may reflect either changes in the reporting practices of law enforcement agencies (although mandated by law to report these data, to date, no systematic examination of compliance with this requirement has been conducted) or changes in the actual number of reported domestic offenses.
Figure S.9 Reported Child Abuse and Neglect and Child Sexual Abuse Rates for Knox County
Figure S.10 Divorce and Annulment Rate for Knox County
The divorce and annulment rate was used to indirectly measure family separation. There was no significant difference between the 1990 Knox County divorce and annulment rate and the 2000 rate, although this was likely the result of a significant increase from 1999 to 2000, after several years of decrease. There were no significant differences between Knox County divorce and annulment rates and rates in bordering and similar counties. However, the Knox County rates were significantly higher than statewide rates.
Rates per 100,000 persons in the total population. Source: Illinois Department of Public Health; U.S. Census Bureau.
Two measures of family or home conflict examined in this profile are the child abuse and neglect and child sexual abuse rates. From 1990 to 2000, the Knox County reported child abuse and neglect rate increased significantly. Knox County reported child abuse and neglect rates were higher than rates in bordering counties and statewide. The Knox County reported child sexual abuse rate did not significantly change from 1990 to 2000. Knox County reported child sexual abuse rates did not significantly differ from bordering county and similar county rates, but were higher than statewide rates. In Knox County, the percentage of reported child abuse and neglect cases and reported child sexual abuse cases that were indicated as abuse did not significantly change from 1990 to 2000 (figure not shown).
Rates per 100,000 persons ages 0 to 17 years. Source: Illinois Department of Children and Family Services; U.S. Census Bureau.
0
1000
2000
3000
4000
5000
6000
7000
1990 1991 1992 1993 1994 1995 1996 1997 1998 1999 2000
Child Abuse and Neglect Rate
Child Sexual Abuse Rate
0
100
200
300
400
500
600
700
1990 1991 1992 1993 1994 1995 1996 1997 1998 1999 2000

x
This profile examines one data point that indirectly measures family mobility: net domestic migration. Based on these data it was found that in Knox County, there was out-migration across the 1990s. This suggests that there are few minors in Knox County who may be in need of increased support while they acclimate to a new community (Table not shown). School Risk Factors School risk factors are factors related to minors’ academic performances and their commitment to school. This profile includes information on five data points measuring school risk factors. These data points measure two distinct types of school risk factors: (1) academic achievement and (2) school commitment. The Illinois Standards Achievement Test (ISAT) scores were used to measure academic achievement in Knox County. Based on these data it was found that Knox County students appear to be meeting or exceeding reading and mathematic standards more often than students statewide, but that Knox County and statewide writing standards were approximately equal. There did not appear to be any consistent pattern of similarities or differences between test scores of Knox County students and test scores of students in bordering and similar counties.3
Figure S.11 Truancy and Suspension Rates for Knox County
3 Caution should be taken when interpreting these findings because it is unclear what constitutes a large enough disparity in percents to draw strong conclusions.
Two measures of school commitment examined in this profile were the truancy and suspension rates. From the 1990/1991 to 2000/2001 academic years, there was a significant increase in the Knox County truancy rate. Overall, Knox County truancy rates were significantly lower than rates in bordering counties. Differences between Knox County rates and similar county and statewide rates were not straightforward, largely because of fluctuations in Knox County rates. Of the total number of truants in Knox County from 1990.91 to 2000/01, a notable percentage of students (24 percent or 2,563 students) persistently missed school. From the 1990/1991 to 2000/2001 academic years, there was no significant difference in the Knox County suspension rate. Knox County suspension rates was significantly lower than rates in bordering counties, and there was no significant difference between Knox County rates and rates in similar conties and statewide.
Rates per 100,000 student population. Source: Illinois State Board of Education.
0
2,000
4,000
6,000
8,000
10,000
12,000
14,000
16,000
18,000
90/91 91/92 92/93 93/94 94/95 95/96 96/97 97/98 98/99 99/00 00/01
Truancy Rate
Suspension Rate

xi
Figure S.12
Expulsion Rate for Knox County
Figure S.13 High School Dropout Rate for Knox County
Another measure of school commitment examined in this profile was the expulsion rate. From the 1990/1991 to 2000/2001 academic years, there was, overall, no significant difference in the expulsion rate in Knox County. However, there were steady, non-significant increases from 1990/91 to 19997/98, followed by a large decrease from 1997/98 compared to 1999/00. Knox County expulsion rates did not significantly differ from the rates in similar counties and statewide. Knox County expulsion rates were significantly lower than rates in bordering counties.
Rate per 100,000 student population. Source: Illinois State Board of Education.
Another measure of school commitment examined in this profile was the high school dropout rate. From the 1990/1991 to 2000/2001 academic years, there was no significant difference in the high school dropout rate in Knox County. Knox County high school dropout rates did not significantly differ from rates in bordering counties, similar counties, and statewide.
Rate per 100,000 student population. Source: Illinois State Board of Education.
0
50
100
150
200
250
300
350
400
450
500
90/91 91/92 92/93 93/94 94/95 95/96 96/97 97/98 98/99 99/00 00/01
0
1,000
2,000
3,000
4,000
5,000
6,000
7,000
90/91 91/92 92/93 93/94 94/95 95/96 96/97 97/98 98/99 99/00 00/01

xii
Environmental Risk Factors Environmental risk factors are factors related to the broad social environment in which minors reside. Ten data points measuring environmental risk factors were described in this profile. Eight of these data points measure three distinct types of environmental risk factors: (1) community poverty, (2) drug availability, and (3) exposure to violence. In addition, because race/ethnicity and births to female adolescents can be linked with other environmental risk factors, these data points were included as environmental risk factors. Three measures of community poverty examined in this profile are the percentage of persons living in poverty, the percentage of minors living in poverty, and the median household income. Based on these data it was found that:
• Approximately 13 percent of the persons living in Knox County were living in poverty, which was much lower than the percentage statewide. For each year examined, there were no significant differences between the percentage of persons living in poverty in Knox County and percentages in the individual bordering and similar counties, and statewide.
• Approximately 19 percent of persons under 18 in Knox County were living in poverty. For each year
examined, there were no significant differences between the estimated percentage of persons under 18 years of age living in poverty in Knox County and the percentages in the individual bordering and similar counties, and statewide.
• The estimated median household incomes for most of the counties examined did not significantly differ
from the Knox County estimated median household income (a few exceptions were noted).
Figure S.14 Unemployment Rate for Knox County
Rate per 100,000 persons eligible for labor. Source: Illinois Department of Employment Security; U.S. Census Bureau.
Another measure of community poverty examined in this profile was the unemployment rate. The unemployment rate reflects the number of individuals unemployed divided by the number of persons eligible for labor. Individuals not interesting in working or who want to work, but are discouraged, or face barriers to entering the labor force are considered ineligible for labor. From 1990 to 2000, there was a significant decrease in the unemployment rate in Knox County. Knox County unemployment rates did not significantly differ from bordering county rates or statewide rates, but were significantly lower than similar county rates.
0
1,000
2,000
3,000
4,000
5,000
6,000
7,000
8,000
1990 1991 1992 1993 1994 1995 1996 1997 1998 1999 2000
xiii
Figure S.15
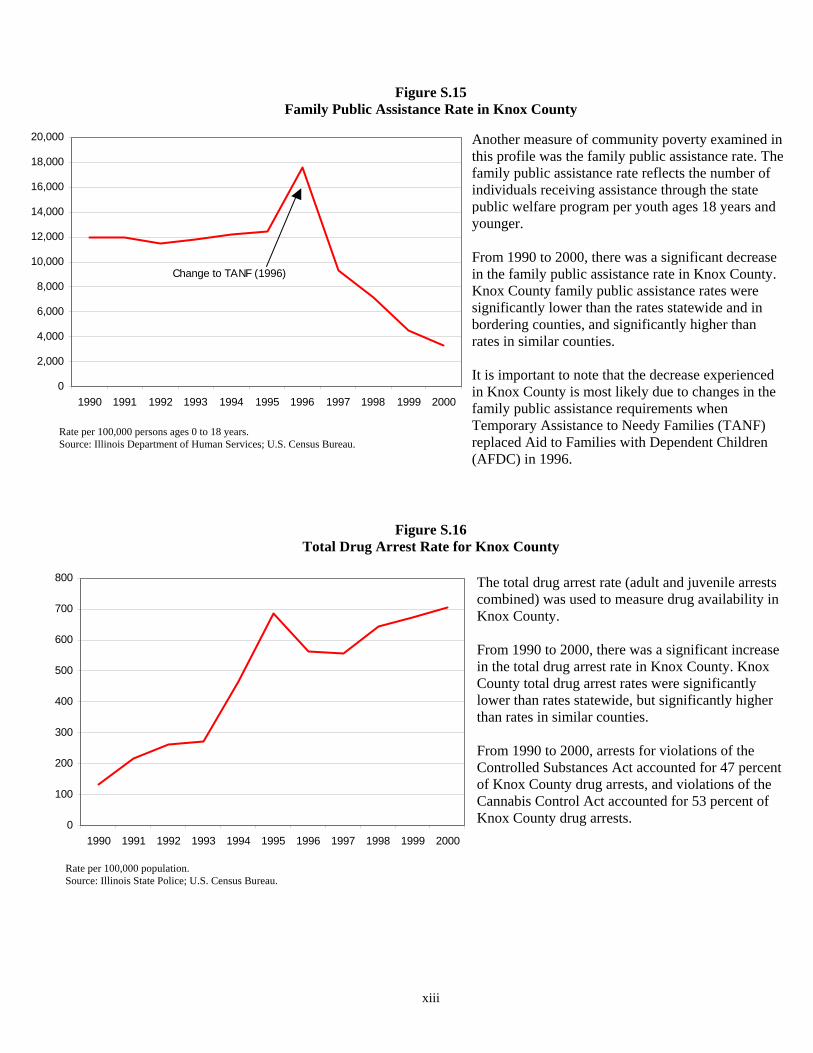
Family Public Assistance Rate in Knox County
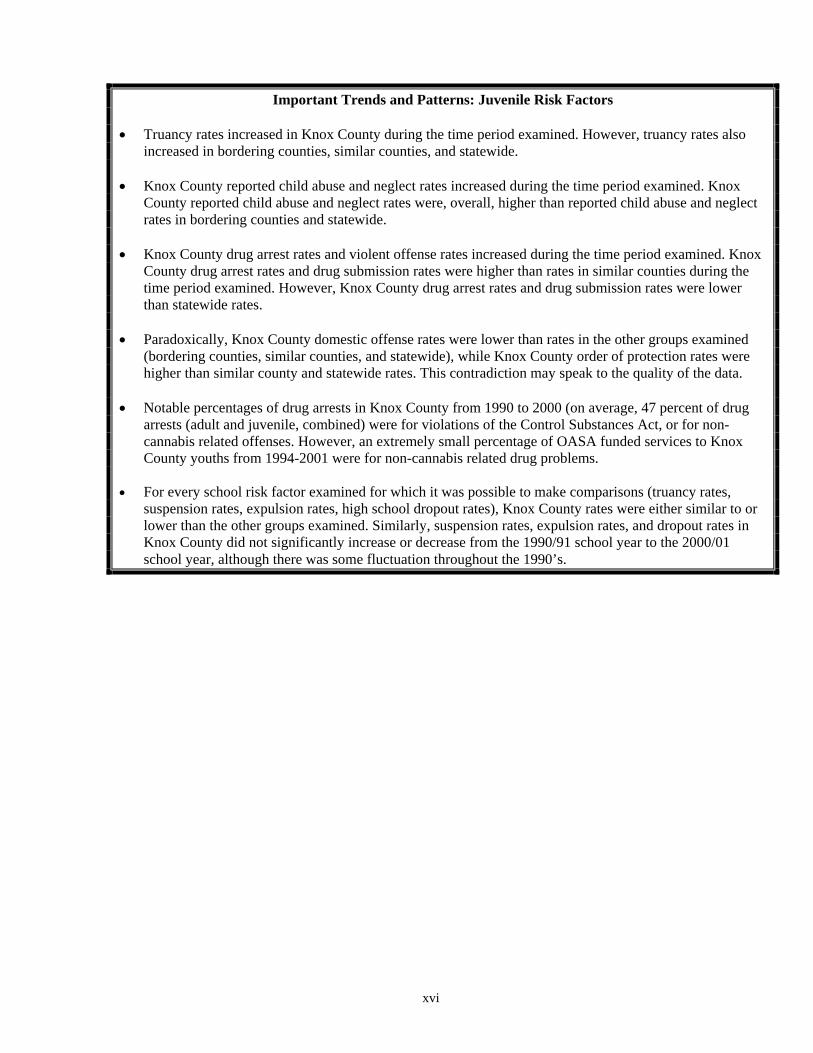
Figure S.16 Total Drug Arrest Rate for Knox County
Rate per 100,000 persons ages 0 to 18 years. Source: Illinois Department of Human Services; U.S. Census Bureau.
Another measure of community poverty examined in this profile was the family public assistance rate. The family public assistance rate reflects the number of individuals receiving assistance through the state public welfare program per youth ages 18 years and younger. From 1990 to 2000, there was a significant decrease in the family public assistance rate in Knox County. Knox County family public assistance rates were significantly lower than the rates statewide and in bordering counties, and significantly higher than rates in similar counties. It is important to note that the decrease experienced in Knox County is most likely due to changes in the family public assistance requirements when Temporary Assistance to Needy Families (TANF) replaced Aid to Families with Dependent Children (AFDC) in 1996.
The total drug arrest rate (adult and juvenile arrests combined) was used to measure drug availability in Knox County. From 1990 to 2000, there was a significant increase in the total drug arrest rate in Knox County. Knox County total drug arrest rates were significantly lower than rates statewide, but significantly higher than rates in similar counties. From 1990 to 2000, arrests for violations of the Controlled Substances Act accounted for 47 percent of Knox County drug arrests, and violations of the Cannabis Control Act accounted for 53 percent of Knox County drug arrests.
Rate per 100,000 population. Source: Illinois State Police; U.S. Census Bureau.
0
2,000
4,000
6,000
8,000
10,000
12,000
14,000
16,000
18,000
20,000
1990 1991 1992 1993 1994 1995 1996 1997 1998 1999 2000
Change to TANF (1996)
0
100
200
300
400
500
600
700
800
1990 1991 1992 1993 1994 1995 1996 1997 1998 1999 2000

xiv
Figure S.17
Total Reported Violent Index Offense Rate for Knox County
Figure S.18 Percentage of the Population in Knox County that is Accounted for by Minorities
The total violent index offense rate (adult and juvenile offenses combined) was used to measure community violence in Knox County. From 1990 to 2000, there was a significant increase in the total violent index offense rate in Knox County. However, the Knox County total violent index offense rate was significantly lower than the rate in similar counties, bordering counties, and statewide. Aggravated assaults accounted for a majority of violent index offenses in Knox County from 1990 to 2000 (66 percent). The increase in the Knox County total violent index offense rate was primarily the byproduct of an increase in the aggravated assault rate. The Knox County aggravated assault rate significantly increased from 1990 to 2000, while 1990 and 2000 Knox County robbery and criminal sexual assault rates were not significantly different.
Rate per 100,000 population. Source: Illinois State Police; U.S. Census Bureau.
Race/ethnicity was also examined as an environmental factor. Readers should note that although there is evidence indicating that race/ethnicity is related to juvenile delinquency, this evidence tends to suggest this relationship may be due to the high correlation between race/ethnicity and other environmental factors (socio-economic factors, poverty). For instance, areas with high concentrations of poverty also tend to have high concentrations of minorities. From 1990 to 1999, there was an increase in the percentage of the population accounted for by minorities in Knox County. The Knox County percentage of the population accounted for by minorities was higher than the percentage in similar counties and bordering counties, but lower than the percentages statewide.
Source: U.S. Census Bureau.
0
50
100
150
200
250
300
350
400
1990 1991 1992 1993 1994 1995 1996 1997 1998 1999 2000
0%
2%
4%
6%
8%
10%
12%
1990 1991 1992 1993 1994 1995 1996 1997 1998 1999

xv
Figure S.19
Knox County Birth Rate by Females Ages 10 to 17 Years
Figure S.20 Adolescent Drug and Alcohol Treatment Admission Rate for Knox County
The birth rate by females ages 10 to 17 years was also examined as an environmental issue because it was correlated with a number of environmental factors described in this profile. Despite a numeric decrease in the Knox County birth rate by females ages 10 to 17 years from 1993 to 2000, this decrease was not large enough to be considered statistically significant. Therefore, there was no significant change in the birth rate by females ages 10 to 17 years in Knox County. Knox County birth rates by females ages 10 to 17 years were not significantly different from rates in bordering counties, similar counties, and statewide.
Rate per 100,000 females ages 10 to 17 years. Source: Illinois Department of Public Health; U.S. Census Bureau.
The adolescent drug and alcohol treatment admission rate was examined as a separate risk factor. There was no significant difference between the 1994 Knox County drug and alcohol treatment admission rate and the 2001 rate, although from 1994 to 1997 there were steady non-significant increases and from 1997 to 2000 there were steady non-significant decreases. Knox County adolescent drug and alcohol treatment admission rates did not significantly differ from rates in bordering counties, similar counties, and statewide. In Knox County, 63 percent of adolescent substance abuse treatment services were provided to youth who identified cannabis as the primary substance abused. Thirty-five percent of adolescent substance abuse treatment services were provided to youth who identified alcohol as the primary substance abuse. It is unknown how many adolescents were receiving treatment for abusing multiple substances.
Rate per 100,000 persons ages 10 to 16 years. Source: Illinois Department of Human Services; Office of Alcohol and Substance Abuse; U.S. Census Bureau.
0
200
400
600
800
1,000
1,200
1,400
1,600
1993 1994 1995 1996 1997 1998 1999 2000
0
100
200
300
400
500
600
700
800
900
1,000
1994 1995 1996 1997 1998 1999 2000 2001
xvi
Important Trends and Patterns: Juvenile Risk Factors
• Truancy rates increased in Knox County during the time period examined. However, truancy rates also increased in bordering counties, similar counties, and statewide.
• Knox County reported child abuse and neglect rates increased during the time period examined. Knox
County reported child abuse and neglect rates were, overall, higher than reported child abuse and neglect rates in bordering counties and statewide.
• Knox County drug arrest rates and violent offense rates increased during the time period examined. Knox
County drug arrest rates and drug submission rates were higher than rates in similar counties during the time period examined. However, Knox County drug arrest rates and drug submission rates were lower than statewide rates.
• Paradoxically, Knox County domestic offense rates were lower than rates in the other groups examined
(bordering counties, similar counties, and statewide), while Knox County order of protection rates were higher than similar county and statewide rates. This contradiction may speak to the quality of the data.
• Notable percentages of drug arrests in Knox County from 1990 to 2000 (on average, 47 percent of drug
arrests (adult and juvenile, combined) were for violations of the Control Substances Act, or for non-cannabis related offenses. However, an extremely small percentage of OASA funded services to Knox County youths from 1994-2001 were for non-cannabis related drug problems.
• For every school risk factor examined for which it was possible to make comparisons (truancy rates,
suspension rates, expulsion rates, high school dropout rates), Knox County rates were either similar to or lower than the other groups examined. Similarly, suspension rates, expulsion rates, and dropout rates in Knox County did not significantly increase or decrease from the 1990/91 school year to the 2000/01 school year, although there was some fluctuation throughout the 1990’s.
1
INTRODUCTION
The Illinois Criminal Justice Information Authority is a state agency created in 1983 to promote community safety by providing public policymakers, criminal justice professionals, and others with information, tools, and technology needed to improve the quality of criminal justice in Illinois. The Authority provides a systemwide forum for identifying critical problems in criminal justice, developing coordinated and cost-effective strategies, and implementing and evaluating solutions to those problems. The specific powers and duties of the Authority are delineated in the Illinois Criminal Justice Information Act (Illinois Compiled Statutes, Ch. 20, Sec. 393/7). Two of the Authority’s responsibilities are serving as a clearinghouse for research and information on criminal and juvenile justice and undertaking research studies to improve the administration of justice. Since 1989, the Authority’s Research and Analysis Unit has received funds under the federal Anti-Drug Abuse Act of 1988 to document the extent and nature of drug and violent crime in Illinois and the justice systems’ responses to these offenses. To place this information into the hands of Illinois’ criminal and juvenile justice practitioners, the Authority created county profiles to highlight justice system activities. Historically, these profiles focused on both the criminal and juvenile justice systems. However, with the growing concern surrounding juvenile crime and the desire to develop preventative strategies to combat juvenile delinquency, the Authority elected to create juvenile justice profiles that would provide more in-depth analyses of juvenile justice trends and the youth residing in each of the 102 counties in Illinois. Using this Profile The purpose of this profile is to assist juvenile justice professionals, policy makers, and community members in learning, discussing, and making decisions about their county’s juvenile justice system and the youth living in their communities. It is also hoped that this profile will aid juvenile justice councils in creating county-level juvenile justice plans.4 Unlike previous versions produced by the Authority that focused primarily on justice system activities, this profile includes a section on risk factors that are linked to juvenile delinquency. Risk factors are aspects of juveniles’ environments that impact the likelihood of youth committing delinquent offenses. By including a description of risk factors, it is hoped this profile will help county officials identify ways to prevent juvenile crime. This profile consists of four main sections. The first section, Knox County, provides a description of the county’s population size and the demographic characteristics. The second section, Juvenile Justice System, provides an in-depth description of Knox County’s juvenile justice system activities. This section includes analyses of delinquency petitions, delinquency adjudications, juvenile transfers to adult court, probation caseloads, admissions to temporary detention centers, and admissions to the Illinois Department of Corrections’ Illinois Youth Centers.5 This section also includes analyses regarding disproportionate minority representation in Knox County for those decision points in which race data were available. The third section, Juvenile Risk Factors, examines risk factors that have been linked to juvenile delinquency. This section includes an overview of research on juvenile risk factors, the data available for each risk factor identified in the research, and the trends in the risk factors examined. The fourth section, Community-Based Programs, provides a description of programs available in Knox County as identified through a statewide survey of service providers and an Internet search for programs located in Knox County.
4 The Juvenile Justice Reform Act of 1998 included a section encouraging the creation of juvenile justice councils (Public Act 90-590; 705 ILCS 405/6-12). Juvenile justice councils are collaborative bodies composed of juvenile justice professionals, community members, service providers, and other relevant individuals. The duties of the juvenile justice council include the development of a prevention-based plan to address juvenile crime. 5 The Juvenile Justice Reform Act of 1998 changed some of the language of the juvenile justice system (Public Act 90-590; 750 ILCS 405/5-105). Specifically, “taken into custody” is now “arrested,” a “adjudication hearing” is a “trial,” and a “dispositional hearing” is now a “sentencing hearing.” This report reflects these language changes with the exception of the term adjudication. The term “adjudication” is used in this report to reflect those youth who have been petitioned to court and found delinquent (guilty). This term is used because we felt it was the best word to describe juveniles found delinquent and it is a common word used by juvenile justice practitioners.
2
When reviewing this profile, readers should consider the questions listed below. These questions were developed to help readers critically examine the data and conclusions presented in this report. • What are some explanations for the findings (e.g., increases, decreases, no changes) presented in this
report? For the data points examined below, researchers attempted to identify specific patterns and trends in Knox County. Overall conclusions based on the data presented in both the Juvenile Justice System and Juvenile Risk Factor sections are available at the end of each section. These conclusions are based on an examination across multiple data points. By examining multiple data points together, researchers are able to make stronger conclusions about the patterns or trends in Knox County. For instance, if most of the drug arrests are for cannabis, most of drug submissions to state crime laboratories are tested and identified as cannabis, and most youth enter drug treatment for cannabis abuse, then one could conclude that cannabis use may be an important issue to address. It is important to note that although we were able to identify some patterns or trends, we were unable to provide decisive reasons why these patterns or trends exist because we are not intimately involved in the day-to-day operations of the juvenile justice system or work directly with youth living in Knox County. Several factors, including departmental policies and procedures or the ways in which the data were collected, may account for why specific patterns or trends emerged from our analyses. Although multiple indicators examined together can provide a rough indication of patterns and trends in juvenile delinquency, the juvenile justice system’s efforts, and risk factors associated with juvenile delinquency, the context in which these factors exist is important. In other words, the analyses provided in this document should be considered in light of what juvenile justice practitioners, service providers, and community members know about and have experienced in their communities. • What other factors influence youth involvement with the juvenile justice system? Most of the data presented in this report are limited to juvenile justice system activities and juvenile risk factors in Knox County. Although the risk factor section was included to help juvenile justice councils and practitioners identify ways to prevent juvenile crime, experiencing risk factors does not necessarily mean a youth will become involved in the juvenile justice system. In fact, researchers have found no single risk factor that causes serious or violent offending (Office of Juvenile Justice and Delinquency, 1995). Rather, researchers have found experiencing several risk factors in combination can produce high levels of offending (Office of Juvenile Justice and Delinquency, 1995). Additionally, many youth who come into contact with the juvenile justice system never fully penetrate the system (i.e., are placed on probation or in a correctional facility) or become serious, chronic, or violent offenders. In fact, researchers have found only a small percentage (most studies have found between 5 to 7 percent) of the youth studied were chronic or serious offenders (Office of Juvenile Justice and Delinquency, 1995). There may be several reasons why youth who experience risk factors do not become involved in the juvenile justice system. One explanation may be that these youth also experience protective factors that actually “protect” them from engaging in crime. Researchers examining protective factors and juvenile delinquency have found the presence of multiple protective factors can have a considerable impact on reducing delinquency (Office of Juvenile Justice and Delinquency, 1995). Thus, understanding the influence of protective factors is an important component to addressing juvenile delinquency. Unfortunately, this profile focuses primarily on risk factors because Authority staff were unable to obtain data on protective factors. When reviewing this profile, it is important to keep in mind that youth in Knox County may also experience several protective factors. Juvenile justice council members and juvenile practitioners should consider collecting data on protective factors to obtain a more complete picture of the needs of youth residing in Knox County. Departmental policies and other system factors may also impact which youth become involved with the juvenile justice system. For instance, counties having an extensive number of treatment options may have more resources to divert youth from formal involvement in the juvenile justice system, while counties with fewer resources may be forced to place similar youth on formal probation, in a residential facility, or in a correctional institution.

3
Therefore, it is important for juvenile justice councils and practitioners to understand what, how, and why departmental policies and other system factors influence the trends presented in this report. • Given the information presented in this profile, what are the most pressing issues in Knox County and how
should those issues be addressed? Identifying the most important issues in your county is difficult. To best determine which issues should be addressed in your county, it is important to collect and examine information not only regarding the needs and issues facing the juvenile justice system and youth in Knox County, but also what programs currently exist to address these needs and issues, what programs are effective, and what policies have been implemented that have impacted the trends identified. This profile was intended to provide readers with a vast amount of information on demographic characteristics of Knox County residents, juvenile justice system activities, juvenile risk factors, and community-based youth programs. To help readers interpret the data presented, the Juvenile Justice System and the Juvenile Risk Factor sections include overall conclusions based on an examination of multiple data points in combination. Authority staff also attempted to collect information on community-based programs serving youth in Knox County. However, the information in this profile is not comprehensive. Before addressing any of the issues identified in this profile it is important to consider collecting additional data. In fact, this profile should be considered the first step to identifying possible issues facing the juvenile justice system or youth in Knox County. • What additional data are available that can provide important information about the juvenile justice system
or youth residing in Knox County? The data presented in this profile represent those available to the Authority staff and believed important. This profile should not be considered a comprehensive summary of all data available on juvenile delinquency and youth in Knox County. Authority researchers were unable to obtain data for several decision points in the Knox County juvenile justice system. One critical decision point researchers were unable to examine was juvenile arrests. This decision point is important to understanding how the juvenile justice system works because it is the entrance point into the juvenile justice system for most youth. Additionally, most data examined in this profile were only available at the aggregate-level. That is, the data were not collected in a manner that would allow an examination of the characteristics of specific juvenile offenders or youth. For example, the Administrative Office of the Illinois Courts (AOIC) collects data on the number of juveniles whose delinquency cases have been petitioned to court. These data can be used to determine if juvenile delinquency cases filed in court have increased or decreased over time. However, these data do not allow one to examine changes in the types of juveniles whose cases have been filed in court, potentially masking important trends. For example, without detailed information on gender, we are unable to determine if more girls are referred to court today than in the past, and at what points in the system these changes have occurred. Juvenile justice councils and practitioners utilizing this document should consider collecting additional and more detailed, individual level data to aid the interpretation of the analyses presented below. This may entail contacting local agencies to determine what additional types of juvenile justice system, juvenile risk factor, or protective factor data are available. Method There are three main analyses presented in this profile. First, analyses were conducted to examine trends in Knox County. Second, analyses were conducted to examine trends in bordering counties, similar counties, and the state as a whole. Third, analyses were conducted that compared Knox County to bordering counties, similar counties, and the state as a whole. Knox County is compared to bordering counties to show readers how Knox County compares to other counties in the same geographical area. Table 1 lists counties bordering Knox County. In the following sections, the term

4
“bordering counties” is used to reflect trends and figures for the bordering counties combined. Knox County is also compared to “similar” counties to show readers how Knox County compares to other counties that are similar in population, degree of urbanization, commuting patterns, and economic activities. Table 1 lists those counties with the same classification as Knox County. In the sections that follow, the term “similar counties” is used to reflect trends and figures for those counties that are similar to Knox County. Appendix A contains a more detailed description of how counties were classified as being similar, why this classification scheme was used (as this scheme is different than that used in the past), and lists each county with their corresponding classification code. Finally, counties were compared to the state as a whole. In the sections that follow, the term “statewide” is used to reflect trends and figures for the state as a whole.
Table 1 Knox County Comparison Groups
Bordering Counties Similar Counties
Fulton, Henry, Mercer, Peoria, Stark, Warren
LaSalle, Morgan, Stephenson, Vermilion, Whiteside
Unless otherwise noted, rates per 100,000 persons in the applicable population were calculated when examining trends in Knox County and the other groups examined and when comparing Knox County to bordering counties, similar counties, and to the state as a whole.6 When data were unavailable across a sufficient number of years (i.e., 5 or more years) trends were not examined; however, comparisons between Knox County and the other groups were still conducted. Table 2 lists the data point examined and the corresponding populations used to calculate the rates. Appendix B contains the rates and the corresponding ranking for every data point examined in this profile for every county in Illinois.
Table 2
Populations Used to Calculate Rates
Rates Populations Used for Calculations* Delinquency Petition Filing Rates 10 through 16 years Delinquency Adjudication Rates 10 through 16 years Informal Probation Supervision Rates 10 through 16 years Continued Under Supervision Rates 10 through 16 years Annual Active Juvenile Probation Caseload 10 through 16 years Total Admission Rates to Temporary Detention Centers 10 through 16 years Juvenile Admission Rates to IDOC 13 through 16 years ER Admission Rates for Attempted and Completed Suicides 0 through 17 years Drug Treatment Rates for Females with Children Females 13 through 70 years Rates of Inmates with Children 17 years and Older Rates of Orders of Protection that Protect Minors 18 years and Older Reported Domestic Offense Rates ICJIA Population Estimates Reported Child Abuse and Neglect Rates 0 through 17 years Reported Child Sexual Abuse Rates 0 through 17years Divorce and Annulment Rates Total County Population Truancy Rates School Enrollment (K-12) Suspension Rates School Enrollment (K-12) Expulsion Rates School Enrollment (K-12) High School Dropout Rates School Enrollment (9-12)
6 Rates were calculated in the following manner: Rate=Total Number multiplied by 100,000 and divided by the Total Population.

5
Table 2 Populations Used to Calculate Rates
(Continued)
Rates Populations Used for Calculations* Unemployment Rates Persons Eligible for Employment Family Public Assistance Rates 0 through 18 years Total Drug Arrest Rates ICJIA Population Estimates Drug Submission Rates ICJIA Population Estimates Total Reported Violent Index Offense Rates ICJIA Population Estimates Violent Offense Rates in Knox County by Offense Type ICJIA Population Estimates Birth Rates by Females Ages 10 to17 years Females 10 through 17 years Adolescent Drug and Alcohol Treatment Rates 10 through 16 years
*The populations used are based on U.S. Census Bureau estimates. In instances when data were available across a sufficient number of years, the sections below include figures that show trend lines for Knox County and the other groups examined. Although figures are a useful tool, it is possible for figures to visually display changes or differences that seem large, but are actually less important than they appear. Conversely, it is also possible for figures to visually display changes or differences that appear small, but are actually important. To circumvent relying exclusively on visual inspection of figures or on simple numbers such as percent change from one year to the next, a statistical process was adopted. The statistical process relies heavily on statistics called confidence intervals, or upper and lower bounds. Appendix C explains what confidence intervals are and how they were used to examine trends. In every instance when the statistical process utilizing confidence intervals was adopted, the results reported are based entirely on the conclusions indicated by the statistical process. Instances when the statistical process was not adopted are noted in the applicable sections. Caution should be taken when interpreting trends that are identified as having no significant change between the time periods analyzed. One assumption readers often make is that no significant change means that the trend or pattern is not important. However, this assumption could cause readers to overlook important trends and patterns. For example, if Knox County’s truancy rate is higher than the truancy rates of all other groups examined and the truancy rate in Knox County has not changed during the time periods examined, then this may be an important issue to study more closely. With a few exceptions, summary tables of the overall findings based on the statistical procedures described above follow the figures or tables presenting the data analyzed. These tables present the overall changes during the time period examined for Knox County, bordering counties, similar counties, and statewide and significant differences or similarities between bordering counties, similar counties, and statewide numbers, rates, or percentages and the numbers, rates, and percentages in Knox County. In some instances, a conclusive determination of similarity or difference could not be made when comparing the numbers, rates, or percentages in bordering counties, similar counties, and statewide to the numbers, rates, or percentages in Knox County. In such instances, dashes (--) were placed in the table and a description of the comparison follows the table under the heading “Note.” In some instances, there is also additional information provided under the heading “Note” about the trends examined that is important to consider when reviewing the findings presented in the table. In addition to the analyses mentioned above, when individual-level data were available more in-depth examinations were conducted. These may include examinations by gender, race, ethnicity, and offense types. Sections in which individual-level data were available are noted.

6
I. KNOX COUNTY
To better understand the information discussed in this profile and to place the data presented in this study into context, the following description of Knox County was prepared. This section provides readers with an overview of the general population characteristics of Knox County, relevant changes in the juvenile population at risk for involvement in the juvenile justice system (youth ages 5 to 16 years), and the racial and ethnic characteristics of Knox County residents. Knox County is located in west central Illinois and encompasses a 716 square mile area. The county is about 915 miles west of Chicago, the state’s largest city, and 120 miles northwest of Springfield, the state’s capital city. The population density in 1990 was 79 persons per square mile. By 2000, the number of persons per square mile had decreased 1 percent to 78 persons per square mile. When compared to the other 101 Illinois counties, Knox County ranked 25th in total population and 31st in population density in 2000. From 1990 to 2000, the population in Knox County decreased 1 percent, from 56,393 to 55,836. In 2000, 75 percent of individuals living in Knox County lived in urban areas, compared to 72 percent in 1990. Age When examining only those persons at-risk for involvement in the juvenile justice system (i.e., juveniles ages 5 to 16 years), it was found from 1990 to 2000 the juvenile population in Knox County decreased 10 percent, from 9,305 to 8,397. In 1990, the number of youth ages 5 to 16 accounted for 17 percent and in 2000, they accounted for 15 percent of Knox County’s total population. Race/Ethnicity Due to differences in the way the U.S. Census Bureau collected data in 2000, racial comparisons between 1990 and 2000 data could not be made. In 1990, individuals completing the census were required to select only one race (e.g., white, black, Asian). In 2000, individuals who completed the census were able to identify themselves as being up to seven different racial groups. For instance, an individual could indicate being white, black, and Native American in 2000, but in 1990 they could only select one of those races. In 1990 and 2000, individuals were also allowed to indicate whether they were Hispanic or non-Hispanic. Table 3 shows census data by race and ethnicity for 1990 and 2000. Of the total non-Hispanic population in Knox County in 1990, 94 percent identified themselves as white, while 5 percent identified themselves as black. Less than 1 percent identified themselves as another minority race. Those identifying themselves as being Hispanic constituted 3 percent of the total population in Knox County in 1990. Of those, 49 percent identified themselves as some other race and Hispanic, while 47 percent identified themselves as white-Hispanic. Those who identified themselves as black-Hispanic constituted 4 percent of the Hispanic population, and less than 1 percent identified themselves as either American Indian/Alaskan Native and Hispanic or Asian/Pacific Islander and Hispanic. Of the total non-Hispanic population in Knox County in 2000, 92 percent identified themselves as only white and 6 percent as only black. Other racial groups comprised another 1 percent of the non-Hispanic population, as did those who selected two or more races (e.g., white and black; black, Asian, and American Indian). Those identifying themselves as being Hispanic in 2000 constituted 3 percent of the total population. Of those, 44 percent identified themselves as an “other” race and Hispanic and 43 percent identified themselves as white-Hispanic. Additionally, 9 percent identified themselves as being two or more races and Hispanic, while 2 percent identified themselves as black-Hispanic, 1 percent as American Indian/Alaskan Native and Hispanic and less than percent as Asian-Hispanic.

7
Table 3 Racial and Ethnic Characteristics of Knox County Residents in 1990 and 2000
Race Ethnicity
1990
Non-Hispanic N=54,977
Hispanic N=1,416
Total N=56,393
White 94.1% 47.2% 92.9% Black 5.1% 4.0% 5.1% American Indian/Alaskan Native 0.1% 0.2% 0.2% Asian/Pacific Islander 0.6% 0.1% 0.6% Other Race 0.1% 48.5% 1.3% Total 100.0% 100.0% 100.0%
2000
Non-Hispanic N=53,940
Hispanic N=1,896
Total N=55,836
White 91.5% 43.2% 89.9% Black 6.4% 2.1% 6.3% Asian 0.2% 1.2% 0.2% American Indian/Alaskan Native 0.7% 0.1% 0.7% Hawaiian Native/ Other Pacific Islander <0.1% 0% <0.1% Other 0.1% 44.3% 1.6% 2 or more Races 1.1% 9.1% 1.4% Total 100.0% 100.0% 100.0%
Source: U.S. Census Bureau. May not equal 100% due to rounding.
8
II. JUVENILE JUSTICE SYSTEM
Similar to most juvenile justice systems across the United States, the “juvenile justice system” in Illinois is comprised of various agencies that deal with minors. These organizations often operate as a loose network of agencies at the state, county, and municipal level. These agencies include: • Law enforcement agencies, such as municipal police departments, county sheriffs, and the Illinois State
Police; • Juvenile and criminal court service agencies (e.g. juvenile probation departments); • Judges, state’s attorneys, public defenders, and private attorneys; • The Illinois Department of Corrections; • Locally operated temporary detention centers; • The Illinois Department of Children and Family Services and child welfare service agencies; • Private social service organizations that provide crisis intervention, foster care, residential placement,
counseling, and other services; • Schools; and, • Neighborhood-based organizations and coalitions. Each entity has different responsibilities within the juvenile justice system and come into contact with juveniles at different stages in the justice process. The flowchart presented in Figure 1 provides a general sketch of the different decision points of the juvenile justice system. Because juvenile justice in Illinois is administered at the local and county level, the decision points illustrated in Figure 1 may look different across the many juvenile justice systems in Illinois. For instance, some counties may have several types of diversionary programs available for youth who have delinquency petitions filed in court, whereas other counties may have few resources available to divert youth. These differences may impact how juvenile justice professionals address delinquency in their counties. Those boxes that are shaded represent points in the system in which data were available for Knox County. This section will highlight juvenile justice system activities in Knox County, bordering counties, similar counties, and for the state as a whole. Table 4 lists the data examined in this section of the profile, the data source, and the years the data were available. Data points that are highlighted in bold represent data in which more detailed, individual-level information are available. Data points not printed in bold represent data collected at the aggregate-level. For data points in which individual-level data are available, more in-depth analyses were conducted to examine the characteristics of juvenile offenders.
Table 4 Juvenile Justice System Data Examined
Data Source Years
Juvenile delinquency petitions Administrative Office of the Illinois Courts 1990-2000 Juvenile delinquency adjudications Administrative Office of the Illinois Courts 1990-2000 Juvenile probation caseloads Administrative Office of the Illinois Courts 1990-2000 Juvenile transfers to adult court Administrative Office of the Illinois Courts 1990-1999 Juvenile detention admissions Administrative Office of the Illinois Courts 1992-2000 Juvenile detention admissions Illinois Department of Human Services 1998-2000 Juvenile admissions to IDOC Illinois Department of Corrections (IDOC) 1993-2000

9
Figure 1 Flowchart of the Juvenile Justice System Process
Begin adult process at preliminary hearing.Source: Illinois Criminal Justice Information Authority, Trends and Issues 1997.
Station Adjustment
Policy Custody
Incident
Automatic Transfer
Juvenile Intake Screening
Delinquency Petition
Discretionary Transfer
Detention
Informal Adjustment
Informal Supervision
24 months supervision
Adjudicated Delinquent
Sentencing Hearing
Treatment
DCFS
Alternative Placement
Probation
Informal Supervision
Institutional Custody
Field Services Supervision
Community
Adult Court
Adult Court
10
As indicated in Table 4 and Figure 1, Authority researchers were unable to obtain data for several decision points in the Knox County juvenile justice system. One critical decision point researchers were unable to examine was juvenile arrests. This decision point is important to understanding how the juvenile justice system works because it is the entrance point into the juvenile justice system for most youth. Under the Illinois Uniform Crime Reporting (I-UCR) program, all law enforcement agencies in the state are required to report monthly offense and arrest data to the Illinois State Police (ISP). Although in the past ISP collected more detailed offense and arrest information, since 1993, ISP has collected only aggregate-level offense and arrest data from law enforcement agencies across the state. These aggregate totals combine offense and arrest data across sex, race, ethnicity, and age. The collection of offense and arrest data at the aggregate-level prevents researchers from examining offender characteristics, including offenders’ ages. To compensate for the lack of information about offenders arrested in Illinois Authority staff, with the cooperation of local agencies, collected separate adult and juvenile arrest data for the years 1996 to 1999 from a representative sample of law enforcement agencies across the state (see ICJIA, 1997). These arrest estimates include arrests for violent index crimes (murder, criminal sexual assault, robbery, and aggravated assault), property index offenses (burglary, theft, motor vehicle theft, and arson), unlawful use of a weapon (UUW), and specific drug offenses (possession of cannabis, manufacture/delivery of cannabis, possession of controlled substances, and manufacture/delivery of controlled substances). Additionally, offender characteristics, such as sex, age group, race, and the arrest outcomes (station adjusted or referred to court) were collected. Unfortunately, analyses of arrest data for Knox County could not be conducted due to the sampling strategy employed. Juvenile justice council members or juvenile justice practitioners are encouraged to identify and collect offense and arrests data. Delinquency Petitions and Adjudications7
Juveniles who are arrested, but not issued station adjustments, are referred to the county state’s attorney or the county probation department for screening, where many options are available. One option is to file a delinquency petition in juvenile court. Once a delinquency petition is filed, many different types of hearings ensue. These include hearings to set conditions minors must comply with while waiting for a trial or sentence and detention hearings to determine if a minor should be held in secure detention. In some instances when a delinquency petition is filed, the minor is diverted from the court system, and instead, is required to attend a program intended to address the issues that resulted the minor’s criminal behavior. In other instances, the case is resolved through a trial, or a hearing to determine whether allegations in a delinquency petition are true beyond a reasonable doubt. In yet other instances, the minor avoids a trial by pleading guilty to the offense.
The Administrative Office of the Illinois Courts (AOIC) asks each probation department in Illinois to submit aggregate county-level juvenile justice system data to them. The data includes the number of juveniles whose delinquency cases are petitioned to juvenile court and the number of juveniles who are adjudicated delinquent. When asking counties to submit data to them, AOIC provides definitions of what each data element constitutes. According to AOIC, a delinquency adjudication is a case which has been resolved through a trial, and the judge has found the minor guilty. The AOIC definition does not include plea agreements or court-based diversions. Thus, AOIC does not intend for counties to include plea agreements or court-based diversions in the delinquency adjudication totals that are submitted to them. From 1990 to 2000, AOIC reported that 688 delinquency petitions were filed in Knox County. Figure 2 shows the delinquency petition filing rate for Knox County and the other comparison groups. Table 5 presents the overall
7 The Juvenile Justice Reform Act of 1998 changed some of the language of the juvenile justice system (Public Act 90-590; 750 ILCS 405/5-105). Specifically, “taken into custody” is now “arrested,” a “adjudication hearing” is a “trial,” and a “dispositional hearing” is now a “sentencing hearing.” This report reflects these language changes with the exception of the term adjudication. The term “adjudication” is used in this report to reflect those youth who have been petitioned to court and found delinquent (guilty). This term is used because we felt it was the best word to describe juveniles found delinquent and it is a common word used by juvenile justice practitioners.

11
findings after examining the changes in the delinquency petitions filing rates for Knox County and the other groups examined using the statistical procedures mentioned in the introduction section of this profile and described in greater detail in Appendix C. Table 5 also shows how the rates in bordering counties, similar counties, and statewide compared to the rates in Knox County.
Figure 2
Table 5 Delinquency Petition Filing Rates: Overall Findings
Change from 1990 to 2000
Significant Increase No Significant Change Significant Decrease Knox County X Bordering Counties X Similar Counties X Statewide X
Compared to Knox County
Significantly Higher Similar Significantly Lower Bordering Counties X Similar Counties X Statewide X
From 1990 to 2000, 551 juvenile cases were adjudicated delinquent in Knox County. Figure 3 shows delinquency adjudication rates for Knox County and the other groups examined. Table 6 presents the overall findings after examining the changes in the delinquency adjudication rates for Knox County and the other groups examined. Table 6 also shows how the rates in bordering counties, similar counties, and statewide compared to the rates in Knox County.
Source: Administrative Office of the Illinois Courts; U.S. Census Bureau.
Delinquency Petition Filing Rates, 1990-2000
0
500
1,000
1,500
2,000
2,500
3,000
3,500
4,000
1990 1991 1992 1993 1994 1995 1996 1997 1998 1999 2000
Calendar Year
Rat
e pe
r 100
,000
per
sons
ages
10-
16 y
ears
Knox County Bordering Counties Similar Counties Statewide

12
Figure 3
Table 6
Delinquency Adjudication Rates: Overall Findings
Change from 1990 to 2000 Significant Increase No Significant Change Significant Decrease Knox County X Bordering Counties X Similar Counties X Statewide X
Compared to Knox County
Significantly Higher Similar Significantly Lower Bordering Counties X Similar Counties X Statewide X
Another way to analyze delinquency adjudications is to examine the number of delinquency petitions that result in adjudications. It is important to remember, however, that there are many different reasons why cases do not result in adjudication. As mentioned earlier, some juveniles whose cases have been petitioned to court are diverted after petitions are filed. In Knox County, 80 percent of the delinquent petitions filed resulted in adjudication from 1990 to 2000. Figure 4 shows the percent of delinquency petitions filed that were adjudicated delinquent for Knox County, similar counties, bordering counties, and statewide. Table 7 presents the overall findings after examining the changes in the percent of delinquency petitions filed that were adjudicated delinquent in Knox County and the other groups examined. Table 7 also shows how the percentages in bordering counties, similar counties, and statewide compared to the percentages in Knox County.
Source: Administrative Office of the Illinois Courts; U.S. Census Bureau.
Delinquency Adjudication Rates, 1990-2000
0
200
400
600
800
1,000
1,200
1,400
1,600
1,800
2,000
1990 1991 1992 1993 1994 1995 1996 1997 1998 1999 2000Calendar Year
Rat
e pe
r 100
,000
per
sons
ages
10-
16 y
ears
Knox County Bordering Counties Similar Counties Statewide

13
Figure 4
Table 7 Percent of Delinquency Petitions Filed and Adjudicated Delinquent:
Overall Findings
Change from 1990 to 2000 Significant Increase No Significant Change Significant Decrease Knox County X Bordering Counties X Similar Counties X Statewide X
Compared to Knox County
Significantly Higher Similar Significantly Lower Bordering Counties X Similar Counties X Statewide X
Source: Administrative Office of the Illinois Courts.
Percent of Delinquency Petitions Filedand Adjudicated Delinquent, 1990-2000
0%
20%
40%
60%
80%
100%
120%
1990 1991 1992 1993 1994 1995 1996 1997 1998 1999 2000Calendar Year
Per
cent
Knox County Bordering Counties Similar Counties Statewide
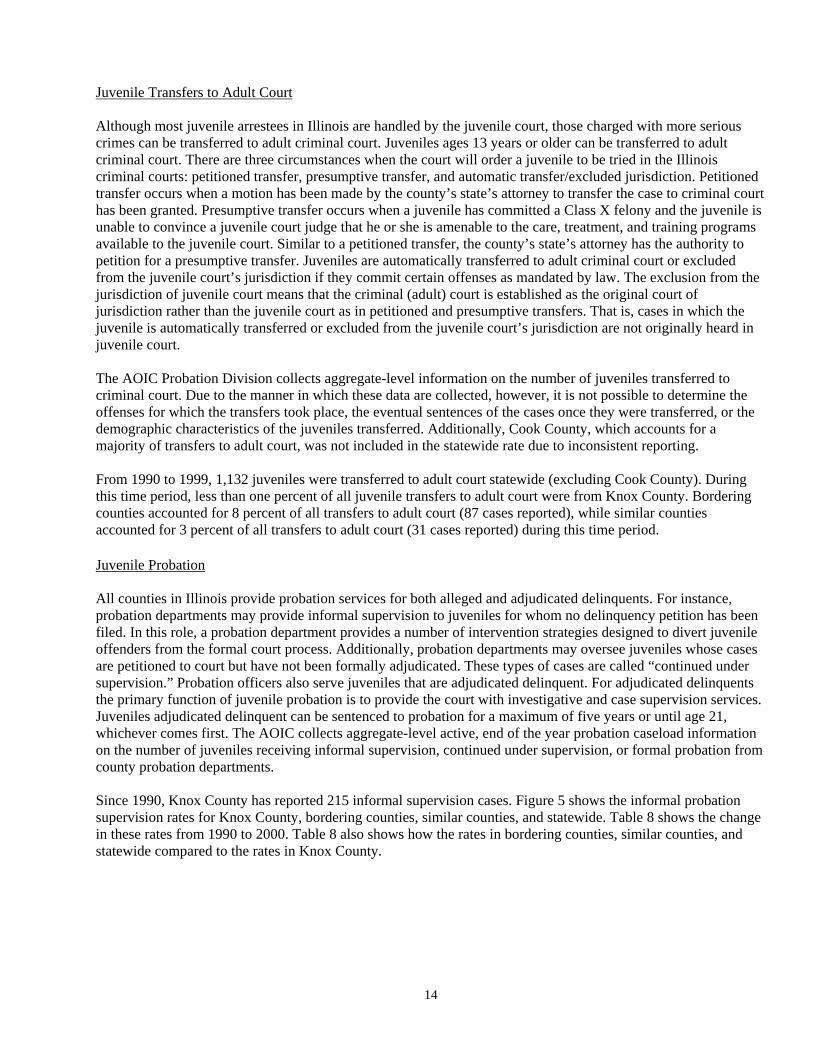
14
Juvenile Transfers to Adult Court Although most juvenile arrestees in Illinois are handled by the juvenile court, those charged with more serious crimes can be transferred to adult criminal court. Juveniles ages 13 years or older can be transferred to adult criminal court. There are three circumstances when the court will order a juvenile to be tried in the Illinois criminal courts: petitioned transfer, presumptive transfer, and automatic transfer/excluded jurisdiction. Petitioned transfer occurs when a motion has been made by the county’s state’s attorney to transfer the case to criminal court has been granted. Presumptive transfer occurs when a juvenile has committed a Class X felony and the juvenile is unable to convince a juvenile court judge that he or she is amenable to the care, treatment, and training programs available to the juvenile court. Similar to a petitioned transfer, the county’s state’s attorney has the authority to petition for a presumptive transfer. Juveniles are automatically transferred to adult criminal court or excluded from the juvenile court’s jurisdiction if they commit certain offenses as mandated by law. The exclusion from the jurisdiction of juvenile court means that the criminal (adult) court is established as the original court of jurisdiction rather than the juvenile court as in petitioned and presumptive transfers. That is, cases in which the juvenile is automatically transferred or excluded from the juvenile court’s jurisdiction are not originally heard in juvenile court. The AOIC Probation Division collects aggregate-level information on the number of juveniles transferred to criminal court. Due to the manner in which these data are collected, however, it is not possible to determine the offenses for which the transfers took place, the eventual sentences of the cases once they were transferred, or the demographic characteristics of the juveniles transferred. Additionally, Cook County, which accounts for a majority of transfers to adult court, was not included in the statewide rate due to inconsistent reporting. From 1990 to 1999, 1,132 juveniles were transferred to adult court statewide (excluding Cook County). During this time period, less than one percent of all juvenile transfers to adult court were from Knox County. Bordering counties accounted for 8 percent of all transfers to adult court (87 cases reported), while similar counties accounted for 3 percent of all transfers to adult court (31 cases reported) during this time period. Juvenile Probation All counties in Illinois provide probation services for both alleged and adjudicated delinquents. For instance, probation departments may provide informal supervision to juveniles for whom no delinquency petition has been filed. In this role, a probation department provides a number of intervention strategies designed to divert juvenile offenders from the formal court process. Additionally, probation departments may oversee juveniles whose cases are petitioned to court but have not been formally adjudicated. These types of cases are called “continued under supervision.” Probation officers also serve juveniles that are adjudicated delinquent. For adjudicated delinquents the primary function of juvenile probation is to provide the court with investigative and case supervision services. Juveniles adjudicated delinquent can be sentenced to probation for a maximum of five years or until age 21, whichever comes first. The AOIC collects aggregate-level active, end of the year probation caseload information on the number of juveniles receiving informal supervision, continued under supervision, or formal probation from county probation departments. Since 1990, Knox County has reported 215 informal supervision cases. Figure 5 shows the informal probation supervision rates for Knox County, bordering counties, similar counties, and statewide. Table 8 shows the change in these rates from 1990 to 2000. Table 8 also shows how the rates in bordering counties, similar counties, and statewide compared to the rates in Knox County.
15
Figure 5
Table 8 Informal Probation Supervision Rates: Overall Findings
Change from 1990 to 2000
Significant Increase No Significant Change Significant Decrease Knox County X Bordering Counties X Similar Counties X Statewide X
Compared to Knox County
Significantly Higher Similar Significantly Lower Bordering Counties X Similar Counties X Statewide X
As noted above, cases can also be continued under supervision. From 1990 to 2000, 29 juvenile cases were continued under supervision in Knox County. Figure 6 shows the continued under supervision rates for Knox County, bordering counties, similar counties, and statewide. Table 9 presents the overall findings after examining the changes in the continued under supervision rates for Knox County and the other groups examined. Table 9 also shows how the rates in bordering counties, similar counties, and statewide compared to the rates in Knox County.
Source: Administrative Office of the Illinois Courts; U.S. Census Bureau.
Informal Probation Supervision Rates, 1990-2000
0
100
200
300
400
500
600
700
1990 1991 1992 1993 1994 1995 1996 1997 1998 1999 2000
Calendar Year
Rat
e pe
r 100
,000
per
sons
age
s 10
-16
year
s
Knox County Bordering Counties Similar Counties Statewide

16
Figure 6
Table 9 Continued Under Supervision Rates: Overall Findings
Change from 1990 to 2000
Significant Increase No Significant Change Significant Decrease Knox County X Bordering Counties X Similar Counties X Statewidea X
Compared to Knox County
Significantly Higher Similar Significantly Lower Bordering Counties X Similar Counties X Statewide X
As noted above, juveniles adjudicated delinquent can also be sentenced to probation. From 1990 to 2000, the Knox County probation department reported that 632 juveniles were on their annual active caseload. Figure 7 shows the annual active probation caseload rate for Knox County and the other groups examined. Table 10 presents the overall findings after examining the changes in the annual active probation caseload rates for Knox County and the other groups examined. Table 10 also shows how the rates in bordering counties, similar counties, and statewide compared to the rates in Knox County.
Source: Administrative Office of the Illinois Courts; U.S. Census Bureau.
Continued Under Supervision Rates, 1990-2000
0
100
200
300
400
500
600
700
800
900
1990 1991 1992 1993 1994 1995 1996 1997 1998 1999 2000Calendar Year
Rat
e pe
r 100
,000
per
sons
ages
10-
16 y
ears
Knox County Bordering Counties Similar Counties Statewide

17
Figure 7
Table 10 Annual Active Juvenile Probation Caseload Rates: Overall Findings
Change from 1990 to 2000
Significant Increase No Significant Change Significant Decrease Knox County X Bordering Counties X Similar Counties X Statewide X
Compared to Knox County
Significantly Higher Similar Significantly Lower Bordering Counties X Similar Counties X Statewide X
Characteristics of Juveniles Exiting Probation Although detailed case-level data for juvenile probationers were not available historically through statewide data reporting mechanisms, since the late-1990s, county probation departments in Illinois have been reporting some probationer-level information to AOIC for juveniles discharged from probation, including their demographic, offense, and case outcome characteristics. These data include juveniles discharged from informal probation supervision, continued under supervision, and regular probation.
Source: Administrative Office of the Illinois Courts; U.S. Census Bureau.
Annual Active Juvenile Probation Caseload Rates, 1990-2000
0
500
1,000
1,500
2,000
1990 1991 1992 1993 1994 1995 1996 1997 1998 1999 2000Calendar Year
Rat
e pe
r 100
,000
per
sons
age
s 10
-16
year
s
Knox County Bordering Counties Similar Counties Statewide

18
Below is a description of the general characteristics of the 153 juveniles discharged from probation in Knox County during 2001, and how they compare to juvenile probationers in similar and bordering counties.8 A comparison between the characteristics of probationers exiting probation in Knox County and statewide could not be conducted. Moreover, the statistical approach was not adopted for this section. During 2001, the average age of discharged juvenile probationers in Knox County was 15.3 years, which was similar to the average age in bordering and similar counties. Across all of the groups examined, males accounted for the largest percentage of juveniles exiting probation in 2001. Additionally, whites accounted for most juveniles discharged from probation in Knox County, bordering counties, and similar counties, although to varying degrees. Figure 8
Fifty percent of probationers from Knox County were placed on probation for property offenses, while 25 percent were placed on probation for violent offenses, 11 percent for drug-related offenses, 5 percent for status offenses, and 8 percent for all other offenses. As Figure 8 indicates, approximately equal percentages of probationers in bordering counties, similar counties, and Knox County were on probation for property offenses. In terms of case outcomes, 47 percent of juvenile probationers in Knox County successfully completed their sentence. As Figure 8 indicates, the percentage of cases that were discharged successfully was somewhat lower in Knox County than in bordering counties and similar counties. Fifty-one percent of juveniles exiting probation from Knox County had been rearrested while on probation. This was notably higher than percentages for bordering counties and similar counties.
8 The numbers for bordering counties exclude probationers from Mercer County and Stark County because no juvenile case termination summaries were submitted to AOIC for 2001. Additionally, the numbers for similar counties exclude Morgan County also because no cases were reported.
Source: Administrative Office of the Illinois Courts.
Demographic, Offense, and Probation Outcome Characteristics, 2001
0%
20%
40%
60%
80%
100%
RegularProbation
Male White PropertyOffenses
SatisfactoryTermination
Rearrested
Perc
ent
Knox County Bordering Counties Similar Counties

19
Juvenile Detention After a juvenile is arrested and the decision has been made to refer the juvenile to court, authorities must determine if temporary detention is necessary. If the decision to securely (e.g., place the minor in a secure facility such as a temporary juvenile detention center) or non-securely (e.g., place the minor on home confinement) detain the juvenile is made, a detention hearing must be held within 40 hours of detention. Once there is probable cause to believe that the minor is delinquent, detention authorization can be based on any of the following reasons: (1) secure custody is of immediate and urgent necessity for the minor’s protection or the protection of another person or his or her property; (2) the minor is likely to flee the jurisdiction of the court; or (3) the minor was arrested under a warrant. Only juveniles 10 years of age or older can be held in a juvenile detention center. Most admissions to temporary juvenile detention centers are for juveniles who have been accused of committing delinquent acts. Detainment of juveniles who have been accused of delinquent acts, but have not yet had an adjudicatory hearing, are considered pre-adjudicatory admissions. Juvenile detention centers can also be used for short periods of detention that are part of a sentence following a finding of delinquency. Juveniles sentenced to juvenile detention following adjudication are considered post-adjudicatory admissions. Juveniles adjudicated delinquent can be ordered to serve up to 30 days in a county juvenile detention center, which includes time served prior to sentencing; those ordered to longer periods of incarceration are committed to the Illinois Department of Corrections’ Illinois Youth Centers. Data collected by the Administrative Office of the Illinois Courts’ Probation Division were used to examine admissions to Illinois’ temporary detention centers for the years 1992 to 2000. As with delinquency petition filing and adjudication data, only aggregate detention admissions data have been collected by AOIC. In other words, the data only indicate total juvenile admissions and cannot be separated by age, gender, race, or offense. However, more specific and detailed data on juveniles admitted to temporary detention centers is available for more recent years from the Juvenile Monitoring Information System (JMIS). JMIS data are maintained by the Illinois Department of Human Services, and contain individual-level data reported by each of the 16 county juvenile temporary detention centers. Although the system has existed since the early 1980s, complete and accurate data are available only for the years 1998 to 2000. Although these data do not allow long-term trend analyses, the data can be used to examine the age, race, gender, and offense type of juveniles admitted to detention centers from 1998 to 2000. It is important to note that Knox County has its own detention center. This is important to remember because research has found that having a detention center is significantly correlated with an increase in detention rates (Smith, 1998). Based on data reported to AOIC, it was found that there were 1,428 reported commitments to temporary detention centers by Knox County from 1992 to 2000. These numbers include admissions for pre- and post-adjudicatory detention. Figure 9 shows the total admission rate (pre-and post-adjudicatory admissions) for Knox County and the other counties examined. Table 11 presents the overall findings after examining the changes in the total detention admission rates for Knox County and the other groups examined. Table 11 also shows how the rates in bordering counties, similar counties, and statewide compared to the rates in Knox County.

20
Figure 9
Table 11 Total Admission Rates to Temporary Detention Centers: Overall Findingsa
Change from 1992 to 2000
Significant Increase No Significant Change Significant Decrease Knox County X Bordering Counties X Similar Counties X Statewidea X
Compared to Knox County
Significantly Higher Similar Significantly Lower Bordering Counties X Similar Counties X Statewide X
a: Total admissions include pre- and post-adjudicatory admissions. Throughout the time period analyzed, admissions for pre-adjudicatory detention accounted for most admissions for every group examined. Pre-adjudicatory admissions accounted for 60 percent of all juvenile detention admissions from 1992 to 2000 in Knox County. Figure 10 shows the percentage of admissions accounted for by pre-adjudicatory admission from 1992 to 2000. Table 12 presents the overall findings after examining the changes in the percent of admissions accounted for by pre-adjudicatory admissions for Knox County and the other groups examined. Table 12 also shows how the percentages in bordering counties, similar counties, and statewide compared to the percentages in Knox County.
a. Total admissions include pre- and post-adjudicatory admissions. Source: Administrative Office of the Illinois Courts; U.S. Census Bureau.
Total Admission Rates to Temporary Detention Centers, 1992-2000a
0
500
1,000
1,500
2,000
2,500
3,000
3,500
4,000
1992 1993 1994 1995 1996 1997 1998 1999 2000Calendar Year
Rat
e pe
r 100
,000
per
sons
ages
10-
16 y
ears
Knox County Bordering Counties Similar Counties Statewide

21
Figure 10
Table 12 Percent of Detention Center Admissions Accounted for by Pre-adjudicatory Admissions: Overall Findings
Change from 1992 to 2000
Significant Increase No Significant Change Significant Decrease Knox County X Bordering Counties X Similar Counties X Statewide X
Compared to Knox County
Significantly Higher Similar Significantly Lower Bordering Counties X Similar Counties X Statewide X Characteristics of Juveniles Admitted to Temporary Detention Centers Based on data available through the Juvenile Monitoring Information System (JMIS), secured detention was used in 485 instances in Knox County from 1998 to 2000.9 In those instances when secured detention was used, 79.4 percent of those youth detained were male. Males accounted for a high percentage of juveniles detained by similar counties (74.6 percent), bordering counties (82.7 percent), and statewide (81.5 percent). When the data were examined by race it was found that 70.5 percent of those detained by Knox County were white, 19.6 percent were African-American, 5.4 percent were Hispanic, and 4.5 percent were classified as another racial group (Figure 11). 9 These numbers may overestimate the number of individual youth confined in secure detention facilities because one youth can be detained several times over a one year period.
Source: Administrative Office of the Illinois Courts.
Percent of Detention Center Admissions Accounted for by Pre-adjudicatory Admissions, 1992-2000
0%
20%
40%
60%
80%
100%
1992 1993 1994 1995 1996 1997 1998 1999 2000Calendar Year
Per
cent
Knox County Bordering Counties Similar Counties Statewide
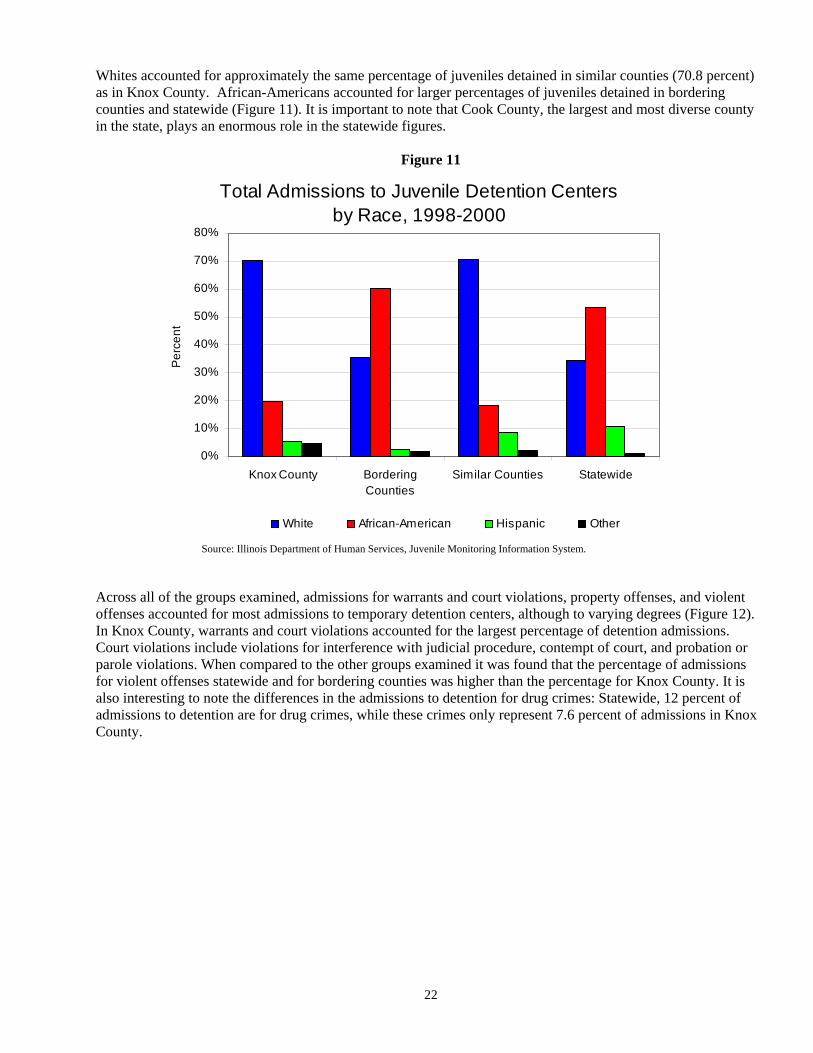
22
Whites accounted for approximately the same percentage of juveniles detained in similar counties (70.8 percent) as in Knox County. African-Americans accounted for larger percentages of juveniles detained in bordering counties and statewide (Figure 11). It is important to note that Cook County, the largest and most diverse county in the state, plays an enormous role in the statewide figures.
Figure 11 Across all of the groups examined, admissions for warrants and court violations, property offenses, and violent offenses accounted for most admissions to temporary detention centers, although to varying degrees (Figure 12). In Knox County, warrants and court violations accounted for the largest percentage of detention admissions. Court violations include violations for interference with judicial procedure, contempt of court, and probation or parole violations. When compared to the other groups examined it was found that the percentage of admissions for violent offenses statewide and for bordering counties was higher than the percentage for Knox County. It is also interesting to note the differences in the admissions to detention for drug crimes: Statewide, 12 percent of admissions to detention are for drug crimes, while these crimes only represent 7.6 percent of admissions in Knox County.
Source: Illinois Department of Human Services, Juvenile Monitoring Information System.
Total Admissions to Juvenile Detention Centers by Race, 1998-2000
0%
10%
20%
30%
40%
50%
60%
70%
80%
Knox County BorderingCounties
Similar Counties Statewide
Per
cent
White African-American Hispanic Other

23
Figure 12
Juvenile Admissions to Illinois Youth Centers Unlike county-level secure juvenile detention that is relatively short-term, the Illinois Department of Corrections’ (IDOC) Illinois Youth Centers provides long-term custody for youths’ ages 13 to 21 years. Juveniles committed to IDOC are detained in one of eight Illinois Youth Centers (IYC) located throughout Illinois. Adjudicated juveniles can be committed to the IDOC for several different reasons, including delinquency commitments and court psychological evaluations. Delinquent commitments are those juveniles who were adjudicated delinquent and sentenced to the IDOC. A delinquent commitment is not a determinate sentence, but an indeterminate sentence that is assessed during the youth’s stay at an IYC. Juveniles sent to the IDOC as a delinquent commitment represent the largest proportion of juveniles committed to the IDOC (IDOC, 2000b). Adjudicated delinquents can also be sent to the IDOC for court evaluations. Court evaluations are used to assess the needs of delinquent juveniles. Based on the court evaluation a juvenile can be released or returned to the IDOC to serve an indeterminate term in an IYC (IDOC, 2000b). The IDOC collects and maintains data on the numbers and types of juveniles committed to the IDOC. From 1993 to 2000, 76 juveniles from Knox County were committed to IDOC as new court admissions. This number reflects only those juveniles with new sentences to IDOC and does not include juveniles that returned to IDOC as parole violators. Figure 13 shows the juvenile admission rates to IDOC for Knox County and the other groups examined. Table 13 presents the overall findings after examining the changes in the juvenile admissions rates to IDOC for Knox County and the other groups examined. Table 13 also shows how the rates in bordering counties, similar counties, and statewide compared to the rates in Knox County.
Source: Illinois Department of Human Services, Juvenile Monitoring Information System.
Admissions to Juvenile Detention Centers by Offense Type, 1998-2000
0%
10%
20%
30%
40%
50%
60%
Knox County BorderingCounties
Similar Counties Statewide
Per
cent
Warrant/Court Violation Property ViolentOther Status Offense Drug Weapon

24
Figure 13
Table 13
Juvenile Admission Rates to IDOC: Overall Findings
Change from SFY 1993 to SFY 2000
Significant Increase No Significant Change Significant Decrease Knox County X Bordering Counties X Similar Counties X Statewide X
Compared to Knox County
Significantly Higher Similar Significantly Lower Bordering Counties X Similar Counties X Statewide X Note:
• Although the Knox County juvenile admission rate to IDOC increased numerically from SFY 1993 to SFY 2000, this increase was not statistically significant.
Characteristics of Juveniles Admitted to the IDOC Illinois Youth Centers IDOC also collects more detailed information about juveniles entering correctional facilities. Table 14 shows the characteristics of juveniles admitted to the IYCs from 1993 to 2001 for Knox County and the other groups examined.
Source: Illinois Department of Corrections; U.S. Census Bureau.
Juvenile Admissions Rates to IDOC, SFY 1993 - SFY 2000
0
100
200
300400
500
600
700
800
1993 1994 1995 1996 1997 1998 1999 2000
State Fiscal Year
Rat
e pe
r 100
,000
per
sons
ag
es 1
3-16
yea
rs
Knox County Bordering Counties Similar Counties Statewide

25
Table 14 Characteristics of Juveniles Admitted to Illinois Youth Centers, SFY 1993-2001
Characteristic Percent/ Years
Knox (n = 82) Sex Male 76% Female 24% Race/Ethnicity White 73% African American 18% Hispanic 7% Other 1% Age Mean 16.0 years Median 16.1 years Offense Person 20% Property 65% Drug 1% Sex 7% Other 2% Missing 5%
Bordering Counties (n = 844) Sex Male 90% Female 10% Race/Ethnicity White 37% African American 62% Hispanic 1% Other <1% Age Mean 15. 7 years Median 15.7 years Offense Person 33% Property 53% Drug 6% Sex 6% Other 3% Missing 1%
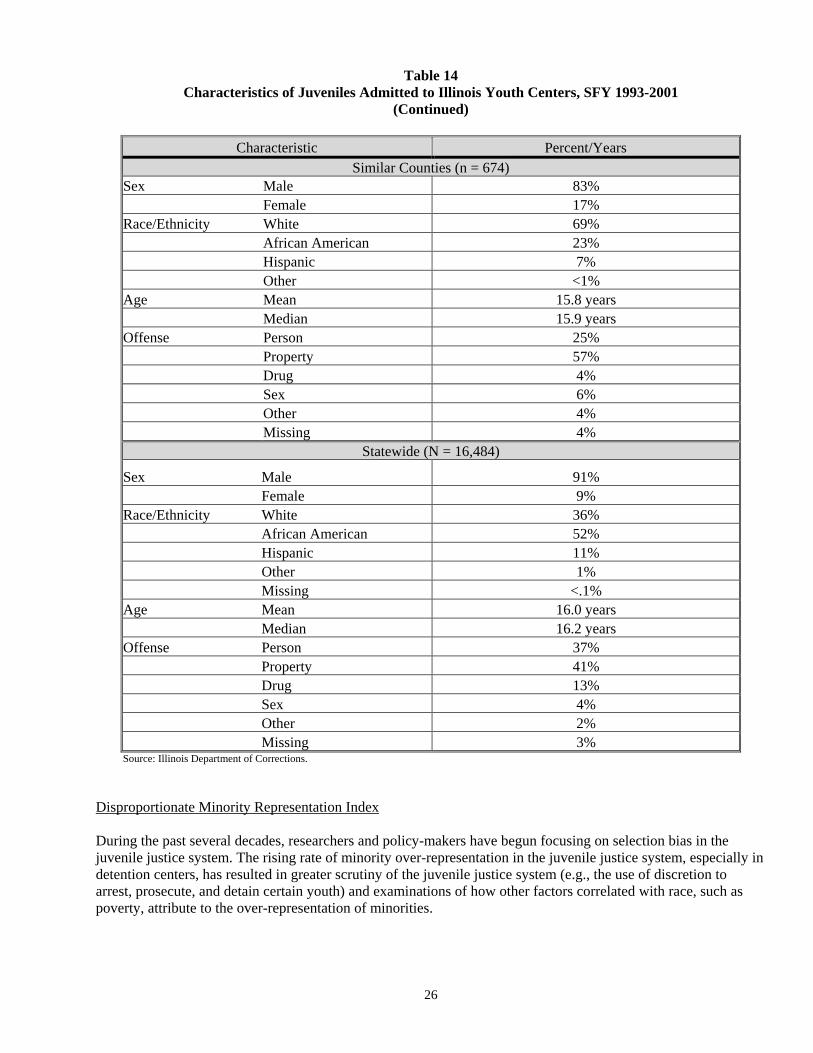
26
Table 14 Characteristics of Juveniles Admitted to Illinois Youth Centers, SFY 1993-2001
(Continued)
Characteristic Percent/Years Similar Counties (n = 674)
Sex Male 83% Female 17% Race/Ethnicity White 69% African American 23% Hispanic 7% Other <1% Age Mean 15.8 years Median 15.9 years Offense Person 25% Property 57% Drug 4% Sex 6% Other 4% Missing 4%
Statewide (N = 16,484)
Sex Male 91% Female 9% Race/Ethnicity White 36% African American 52% Hispanic 11% Other 1% Missing <.1% Age Mean 16.0 years Median 16.2 years Offense Person 37% Property 41% Drug 13% Sex 4% Other 2% Missing 3% Source: Illinois Department of Corrections.
Disproportionate Minority Representation Index During the past several decades, researchers and policy-makers have begun focusing on selection bias in the juvenile justice system. The rising rate of minority over-representation in the juvenile justice system, especially in detention centers, has resulted in greater scrutiny of the juvenile justice system (e.g., the use of discretion to arrest, prosecute, and detain certain youth) and examinations of how other factors correlated with race, such as poverty, attribute to the over-representation of minorities.

27
To address growing concerns regarding the over-representation of minorities in the juvenile justice system, the federal Juvenile Justice and Delinquency Prevention Act was amended in 1988 to require each state participating in formula grant programs, administered by the U.S. Department of Justice, Office of Juvenile Justice and Delinquency Prevention (OJJDP), to assess the extent of over-representation of minority juveniles confined within all secure facilities. In 1992, Congress expanded the mandate regarding disproportionate minority confinement and required states that have an over-representation of minorities in the juvenile justice system in proportion to minorities in the general population to develop and implement plans to reduce disproportionate minority confinement (Howell, 1998). In assessing minority representation, a number of issues with respect to the interpretation of what constitutes over-representation need to be discussed. According to OJJDP, over-representation occurs when the proportion of juveniles at a particular point in the juvenile justice process is larger than their representation in the general juvenile population. To determine whether a particular minority group was over-represented at each stage of the juvenile justice process compared to their representation in the juvenile population, a Representation Index (RI) was calculated using the following formula: Representation Index (RI) = Percent of a Racial or Ethnic Group at Juvenile Justice Decision Point Percent of the Group in Juvenile Population The interpretation of the RI value is as follows:
RI < 1: Representation within the specific juvenile justice component is equal to or less than the group’s representation in the total juvenile population;
RI > 1: Representation within the specific juvenile justice component is larger than the group’s
representation in the total juvenile population; RI > 2: Representation within the specific juvenile justice component is more than twice the group’s
representation in the juvenile population; and, RI > 3: Representation within the specific juvenile justice component is more than three times the group’s
representation in the juvenile population. For the purpose of this report, RIs between 0.90 and 1.09 should be interpreted as “nearly proportional,” and anything outside of that range should be interpreted as under or overrepresentation. In addition to assessing representation in the juvenile justice system relative to representation among the juvenile population, representation can be examined at specific points in the juvenile justice process relative to their representation at the previous point in the process. To determine whether a particular group was over represented at a particular decision point in the juvenile justice process compared to their representation at the previous decision point, a Disparity Index (DI) was calculated using the following formula:
Disparity Index (DI) = Percent of a Racial or Ethnic Group At Decision Point Percent of the Group At Prior Decision Point The interpretation of values for the Disparity Index is the same as that for the Representation Index. The DI, however, could not be calculated for any decision point because individual level data for prior stages in the juvenile justice system are needed to calculate this index. This formula was modified for each decision point in the juvenile justice process to take into account representation at the previous decision point. By determining representation at each point relative to representation at the prior decision point, specific points in the juvenile justice process can be identified as contributing to overrepresentation in the system.
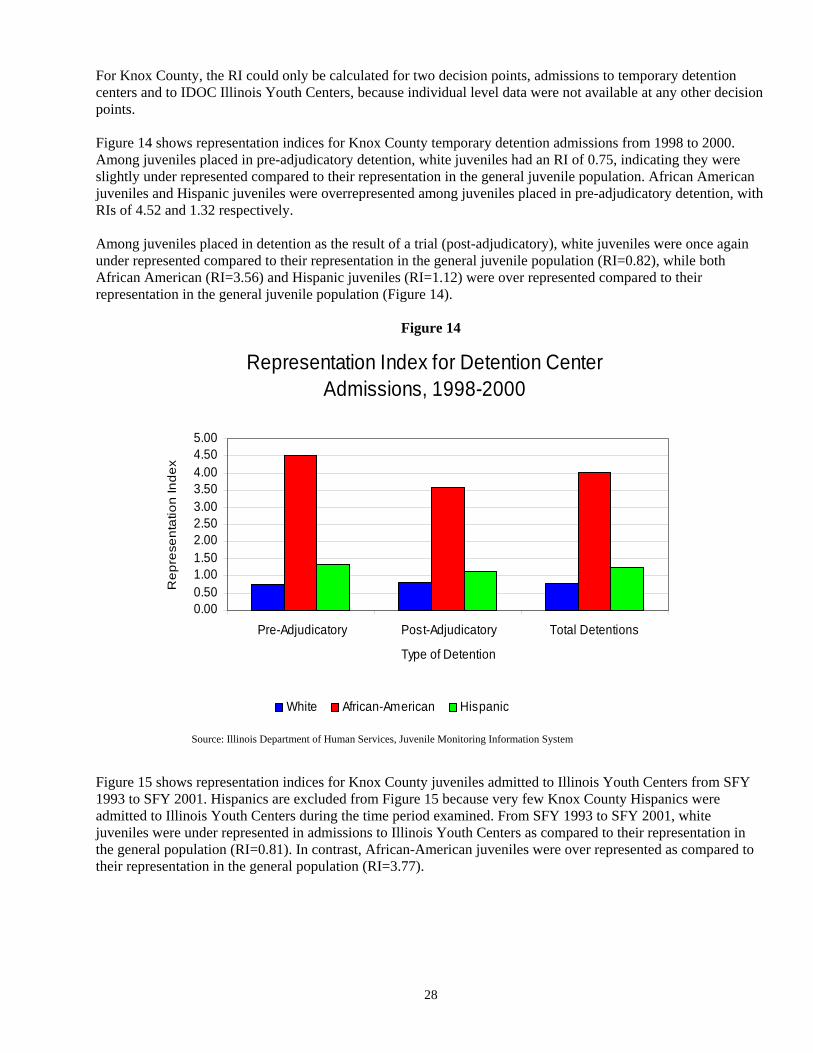
28
For Knox County, the RI could only be calculated for two decision points, admissions to temporary detention centers and to IDOC Illinois Youth Centers, because individual level data were not available at any other decision points. Figure 14 shows representation indices for Knox County temporary detention admissions from 1998 to 2000. Among juveniles placed in pre-adjudicatory detention, white juveniles had an RI of 0.75, indicating they were slightly under represented compared to their representation in the general juvenile population. African American juveniles and Hispanic juveniles were overrepresented among juveniles placed in pre-adjudicatory detention, with RIs of 4.52 and 1.32 respectively. Among juveniles placed in detention as the result of a trial (post-adjudicatory), white juveniles were once again under represented compared to their representation in the general juvenile population (RI=0.82), while both African American (RI=3.56) and Hispanic juveniles (RI=1.12) were over represented compared to their representation in the general juvenile population (Figure 14).
Figure 14
Figure 15 shows representation indices for Knox County juveniles admitted to Illinois Youth Centers from SFY 1993 to SFY 2001. Hispanics are excluded from Figure 15 because very few Knox County Hispanics were admitted to Illinois Youth Centers during the time period examined. From SFY 1993 to SFY 2001, white juveniles were under represented in admissions to Illinois Youth Centers as compared to their representation in the general population (RI=0.81). In contrast, African-American juveniles were over represented as compared to their representation in the general population (RI=3.77).
Source: Illinois Department of Human Services, Juvenile Monitoring Information System
Representation Index for Detention Center Admissions, 1998-2000
0.000.501.001.502.002.503.003.504.004.505.00
Pre-Adjudicatory Post-Adjudicatory Total Detentions
Type of Detention
Rep
rese
ntat
ion
Inde
x
White African-American Hispanic

29
Figure 15 Although data for Knox County were not available at other decision points in the juvenile justice system, the Authority has conducted more extensive examinations of disproportionate minority representation in other counties. Based on a study of 26 counties in Illinois it was found that in almost all of the counties examined, African American juveniles were over-represented at every point in the juvenile justice system relative to their representation in the juvenile population. The stage of the juvenile justice process where African American representation increased the most was between their representation in the juvenile population and representation among those taken into police custody. Additionally, the extent and degree of over-representation among Hispanics at points in the juvenile justice system was not as large as that experienced by African American juveniles; however, in those counties with the largest Hispanic juvenile populations, over-representation was evident across most components of the juvenile justice system (ICJIA, 1996). More recently, the Authority undertook a comprehensive disproportionate minority representation study examining the 16 decision points in Cook County’s juvenile justice system. The findings of this study were similar to those of previous studies conducted by the Authority: most disparity for both African American and Hispanic juveniles occurred at the front-end of the system (arrests), though there was a small degree of disparity between decision points later in the process. Unlike previous reports, this report also examined risk factors correlated with delinquency for each racial group. The results indicated that minorities also made up the greatest percentage of juveniles affected by the risk factors.
Source: Illinois Department of Corrections.
Juvenile Representation Index for Illinois Youth Center Admissions, 1993-2001
0.00
0.50
1.00
1.50
2.00
2.50
3.00
3.50
4.00
White African-American
Rep
rese
ntat
ion
Inde
x

30
Conclusions This section highlights some of the more noteworthy patterns found across all of the juvenile justice decision points examined. To identify these patterns, two different tables were developed to aid interpretation. Table 15 shows the overall differences and similarities between Knox County and the other groups examined for each data point discussed in the sections above. Table 16 shows the overall changes in Knox County for each data point. For Table 15, the rates for Knox County were compared to the rates of the other groups examined for most of the data points analyzed. The terms “higher,” “similar,” and “lower” were used to indicate when the rates of the other groups examined were higher, similar, or lower than the rates in Knox County. There were several instances, however, when it was not possible to conclude that the rates for the other groups examined were clearly higher, similar or lower than the rates in Knox County. In such instances, the symbol “- -” was placed in the table to indicate that no clear determination of higher, similar, or lower could be made. Additionally, comparisons could not be made for transfers to adult court due to the lack of available data or due to data limitations. Table 16 shows the overall changes in Knox County for each data point examined. To determine if there was a significant increase or decrease or if no significant change occurred, the rates for the first year examined were compared to the rates of the last year examined (e.g., 1990 and 2000). The same statistical procedure mentioned above was then used to determine if there was a significant difference between the rates of the first year (e.g., 1990) and the rates of the second year (e.g., 2000). Comparisons between the first year rates and the second year rates could not be made for arrests, informal supervision, probation outcomes, and transfers to adult court. Below are some of the patterns found:
• From 1990 to 2000, Knox County delinquency petition filing rates tended to be lower than the other groups examined (similar counties, bordering counties, and statewide).
• From 1990 to 2000, Knox County detention admission rates tended to be higher than the other groups
examined (similar counties, bordering counties, and statewide). In addition, from approximately 1995 to 2000, relative to bordering counties or statewide, there was a tendency for a larger percentage of juvenile detention admissions in Knox County to occur post-adjudicatory. Both of these results may have occurred because Knox County has a juvenile detention center, while a majority of the counties in the other groups examined do not. Research has found that having a detention center is significantly correlated with an increase in detention rates (Smith, 1998).
• Across most of the decision points examined, Knox County did not have any notable changes over time.
However, there was an increase in detention admission rates from 1992 to 2000.
• Of the juveniles admitted into juvenile detention centers from Knox County, the largest percentages were admitted for warrant or court violations, or for property offenses.
• African Americans accounted for 20 percent of juveniles admitted to juvenile detention centers (pre-
adjudicatory and post-adjudicatory) from Knox County, and 18 percent of juveniles admitted to Illinois Youth Centers. These percentages exceed the percentage of African-Americans in the general Knox County juvenile population. On the other hand, white Knox County juveniles were under represented among those in detention and Illinois Youth Centers compared to their representation in the general juvenile population.
• The quality and consistency of the data available at most of the decision points in the juvenile justice
process inhibits our ability to draw strong conclusions. There are no data on the actual number of juveniles arrested in Knox County. Moreover, most of the data presented above could not be broken down by race and ethnicity, gender, and age.

31
Table 15 Overall Differences and Similarities between Knox County and Bordering Counties, Similar Counties, and
Statewide for each Data Point Examined
Justice System Data Point
Bordering Counties
Similar Counties Statewide
Delinquency Petitions Higher Higher Higher Delinquency Adjudications Similar Similar Similar Informal Supervision Similar Similar Lower Continued Under Supervision Higher Higher Higher Probation Caseloads Similar Similar Similar Detention Admissions Lower Lower Lower IDOC Juvenile Admissions Similar Similar Similar
Table 16 Overall Changes in Knox County for each Juvenile Justice System Data Point
Justice System Data Point
Increase No Change Decrease
Delinquency Petitions X Delinquency Adjudications X Informal Supervision X Continued Under Supervision X Probation Caseloads X Detention Admissions X IDOC Juvenile Admissions X
32
III. JUVENILE RISK FACTORS Any serious attempt to address juvenile delinquency at the local or county level may be aided by an understanding of risk factors. Risk factors are aspects of juveniles’ environments that impact the likelihood of their committing delinquent acts. The purpose of this section is to identify risk factors that may need to be addressed in Knox County. This section is divided into three parts. The section begins with a general review of empirical research examining juvenile delinquency risk factors. We relied heavily on the efforts of the Office of Juvenile Justice and Delinquency Prevention’s (OJJDP) Study Group on Serious and Violent Juvenile Offenders (Loeber & Farrington, 1998) for this review.10 The next part describes results of statistical analyses demonstrating relationships between juvenile delinquency risk factors and juvenile justice system data for Illinois as a whole. The final part describes juvenile delinquency risk factors in Knox County and, for each of the risk factors, compares Knox County to bordering and similar counties and to the state as a whole. Similar to the Juvenile Justice System section, the trend analyses and comparisons made were based on the statistical methods outlined in the introduction of this profile and described in Appendix C. Types of Risk Factors Research examining juvenile delinquency risk factors has focused on distinct types of risk factors, four of which include the following: (1) individual risk factors, (2) social risk factors, (3) school risk factors, and (4) environmental risk factors. Below is a description of each of these four types of risk factors. These risk factors were used to help us select which data to analyze and how to group data points together in a logical manner. Individual risk factors are individual traits or qualities that may be related to juvenile delinquency, including various types of mental and physical health problems. Studies examining the effects of individual risk factors on juvenile delinquency have found aggressive behaviors, anti-social attitudes or beliefs, hyperactivity, impulsiveness, attention deficits, and risk taking behaviors are strongly linked to juvenile delinquency. Several studies have also found evidence linking medical or physical conditions impacting development, general problem behavior (e.g., temper tantrums), and negative internalizing behaviors (e.g., nervousness, worrying, anxiety) to juvenile delinquency. IQ, low resting heart rate, depression, substance abuse, and obsessive-compulsive behavior have also been identified as potential risk factors, although further research is still needed before strong conclusions can be made about the relationship between these variables and juvenile delinquency. Social risk factors are factors present in minors’ immediate social environments that may be related to juvenile delinquency. Research examining social risk factors has typically examined two types of social relationships: family relationships and peer relationships. There is strong evidence suggesting poor parent-child relationships (e.g., poor parental discipline style, lack of parental involvement), and relationships with anti-social peers or peers who engage in criminality, are related to juvenile delinquency. Lipsey and Derzon contributed a chapter to the study group’s book in which they completed a statistical review of longitudinal research examining juvenile delinquency risk factors. They found that there was a tendency for certain family-related risk factors (i.e., antisocial parents or parent criminality) to be more predictive of serious and violent juvenile delinquency for 6-11
10 The Office of Juvenile Justice and Delinquency Prevention brought together a study group of 22 juvenile justice system researchers to review and synthesize research on juvenile delinquency risk factors. One byproduct of this collaboration is the book referenced above. Because the book was published relatively recently (1998), was written by well-established juvenile justice researchers, and synthesized a large amount of research, we opted to rely on the study group’s book in this section. It should be noted that the book focuses exclusively on risk factors for serious and violent juvenile offenders. Nonetheless, it is our intent that this section be applicable to those who are interested in learning about risk factors for less serious and status offenders as well. Research has indicated that: (1) a small number of chronic juvenile offenders commit over half of all juvenile crime, (2) there is a relationship between chronic offending and serious and violent offending, (3) serious and violent offenders are likely to have committed less serious or status offenses prior to committing serious and violent offenses, and (4) once a minor has committed a serious or violent offense, he or she is still greatly at risk to commit less serious or status offenses. Based on all this, it appeared to us that the risk factors described in the study group’s book are applicable to all juvenile offenders.
33
year olds than for 12-14 year olds. Peer-related social risk factors (e.g., antisocial peers or peer criminality) were more predictive of serious and violent juvenile delinquency for 12-14 year olds. This suggests that, for younger juveniles, the family is a stronger predictor of juvenile delinquency, while peer relationships become stronger predictors of delinquency as minors grow older. Research has also found anti-social parents or parental criminality, family and/or marital conflict, separation from family (e.g., broken homes due to divorce), and sibling delinquency may be related to juvenile delinquency. In addition, abusive parents, low family bonding, high family stress, weak social ties (e.g., unpopularity with peers, low levels of social activity), and high family residential mobility may be linked to juvenile delinquency, although more research is still needed before strong conclusions regarding these potential risk factors can be made. School risk factors are factors related to minors’ academic performances and their commitment to school. Research on predictors of serious and violent juvenile delinquency has found truancy, dropping out of school, and poor academic performance are related to juvenile delinquency. Some evidence also suggests school delinquency, occupational expectations, and school transitions (e.g., attending more than one school per year) are also related to juvenile delinquency. Environmental risk factors are factors related to the broad social environment in which minors reside. Studies examining the impact of environmental factors on juvenile delinquency have found some evidence to suggest communities with high levels of poverty are disorganized, have low levels of neighborhood attachment, and tend to have high levels of juvenile delinquency. Research has also found some evidence that juvenile delinquency may be related to drug availability in the community, high levels of adult criminality in the community, exposure to violence, and exposure to racial prejudice. Risk Factors Examined This section uses available data to describe risk factors in Knox County and in Illinois as a whole. Table 17 lists the data examined in this section of the profile, the risk factors the data reflects, the data source, and the years the data were available. Table 17 also shows the strength of the relationship between each risk factor and juvenile delinquency based on research described and reviewed in Loeber and Farrington (1998). Risk factors for which there is strong evidence linking the risk factor to juvenile delinquency are printed in bold, while risk factors for which there is moderate evidence linking the risk factor to juvenile delinquency are printed in italics. For data listed in Table 17 that are not italicized or listed in bold, there is little evidence linking the data to juvenile delinquency, although the data may still be relevant (i.e., more research examining the factor is needed). The Authority has no data available on several factors that the review above noted are strongly related to juvenile delinquency. These include: aggressive behavior, anti-social attitudes or beliefs, hyperactivity, impulsiveness, attention deficits, risk taking behaviors, parent/child relations, and peer relations. Counties may be interested in obtaining their own data on these risk factors. Table 17 also includes three types of data that were not mentioned in the brief review above because they do not fit neatly into one of the four risk factor categories. First, there is strong evidence indicating that illicit substance use is related to juvenile delinquency. Thus, data pertaining to adolescent substance use is also examined in this section. Second, there is evidence indicating that race/ethnicity is related to juvenile delinquency, although this relationship is due to a strong correlation between race/ethnicity and other environmental factors (e.g., socio-economic factors, poverty). For instance, areas with high concentrations of poverty also tend to have high concentrations of minorities. Thus, data pertaining to race/ethnicity is described in this section as an environmental factor. Finally, this section examines births to females ages 10 to 17 years. Births to young females may be related to a number of risk factors such as poor academic performance (young mothers likely have less time to devote to school, may not be allowed to attend school while pregnant, etc.), engaging in risky behavior (unprotected sex), or live in communities with high levels of poverty. Correlations between births to females ages 10 to 17 years and the other data described in this section (the results of these correlations will be described below) revealed that births to females ages 10 to 17 years tended to be related to environmental risk factors. Thus, births to females ages 10 to 17 years will be described in this section as an environmental risk factor.

34
Table 17 Juvenile Delinquency Risk Factor Data that were Examined
Data Risk factor
the data reflectsa
Source
Years Individual-level Variable Emergency room admissions for suicide (minors ages 0 to 17) Depression Illinois Dept. of Public Health 1998-2000
Social Variables Mothers admitted to drug treatment Parental criminality Office of Alcoholism and Substance Abuseb 1995-2001 Inmates committed to IDOC that reported having children Parental criminality Illinois Dept. of Corrections 1991-2001 Orders of protection (for orders that protect minors) Family or home conflict Illinois State Police 1993-2000 Reported domestic offenses Family or home conflict Illinois State Police 1996-2000 Reported and indicated child abuse and neglect (minors ages 0 to 17) Prior abuse Ill. Dept. of Children and Family Services 1990-2000 Reported and indicated child sexual abuse (minors ages 0 to 17) Prior abuse Ill. Dept. of Children and Family Services 1990-2000 Divorces and annulments Separation of family Illinois Dept. of Public Health 1990-2000 Net domestic migration Family mobility U.S. Census Bureau 1990-1999 School Variables Illinois Standards Achievement Test (ISAT) scores, grades 3, 5, 8, 10 Academic achievement Illinois State Board of Education 96/97-00/01 Truant students, grades K-12 School commitment Illinois State Board of Education 90/91-00/01 Suspensions, grades K-12 School commitment Illinois State Board of Education 90/91-00/01 Expulsions, grades K-12 School commitment Illinois State Board of Education 90/91-00/01 High school dropouts, grades 9 to 12 School commitment Illinois State Board of Education 90/91-00/01 Environmental Variables Estimated number of persons living in poverty Community poverty U.S. Census Bureau 93,95,97,98 Estimated number of minors living in poverty (minors ages 0 to 17) Community poverty U.S. Census Bureau 93,95,97,98 Unemployment per eligible labor force Community poverty Illinois Dept. of Employment Security 1990-2000 Estimated median household income Community poverty U.S. Census Bureau 93,95,97,98 Minors in families receiving public assistance (minors ages 0 to 18) Community poverty Illinois Dept. of Human Services 1990-2000 Reported number of drug arrests Drug availability Illinois State Police 1990-2000 Number of drug submissions to Illinois State Police labs Drug availability Illinois State Police 1998-2001 Number of reported violent offenses Exposure to violence Illinois State Police 1990-2000 Total number of minority residents Racial composition U.S. Census Bureau 1990-1999 Births to females ages 10 to 17 years Risk taking behavior Illinois Dept. of Public Health 1993-2000 Other Variables Drug and alcohol treatment admissions (minors ages 0 to 17) Adolescent substance use Office of Alcoholism and Substance Abuse 1994-2001
a: Bold text indicates that there is strong evidence linking the risk factor to juvenile delinquency. Italicized text indicates that there is moderate evidence linking the risk factor to juvenile delinquency. Standard text indicates that there is little evidence linking the risk factor to juvenile delinquency, but it still may be a viable risk factor. b: The Office of Alcohol and Substance Abuse is a department within the Illinois Department of Human Services.

35
Risk Factors in Illinois This section will describe relationships between the juvenile delinquency risk factors listed in Table 17, as well as the relationships between the juvenile delinquency risk factors and four of the juvenile justice system data points described above (juvenile delinquency petitions, delinquent adjudications, post-adjudicatory juvenile detention admissions, and active, end-of-year juvenile probation caseloads), for Illinois as a whole. Because the data were only available at the aggregate level, it was not possible to calculate correlations for specific counties. The state-level results are presented at the beginning of each section prior to presenting data for Knox County as a reminder of how each factor was related to the four juvenile justice system data points at the statewide level. Correlations were calculated between each of the juvenile delinquency risk factors and between the risk factors and the four juvenile justice system data points across all of Illinois’ 102 counties.11 The correlations between the risk factors provide an indication of the extent to which problems or issues facing juvenile justice systems in Illinois tend to occur together. The correlations between the risk factors and the juvenile justice system data elements provide an indication of the extent to which the risk factors are related to juvenile justice system involvement. However, these correlations cannot be used to infer that the risk factors cause involvement in the juvenile justice system. Correlations Between Juvenile Delinquency Risk Factors
For this part of the section and the next part of the section, the data listed in Table 17 were converted to rates per 100,000 persons in the applicable population. Rates enable one to make comparisons across counties with very different populations.12 For various reasons, the correlations calculated in this section did not use all of the data listed in Table 17. Appendix D lists the exact risk factor and juvenile justice system measures for which rates and then correlation coefficients were calculated. Appendix D also includes a correlation matrix, or a table that shows correlations between each of the risk factors. The correlation coefficients in the matrix provide a general, albeit imperfect, indication of the extent to which juvenile risk factors co-occur in Illinois. A large number of the correlation coefficients in Appendix D are statistically significant in an intuitive direction (several correlation coefficients were significant in the opposite direction than one would expect; see Footnote 11 for a description of the direction of correlation coefficients), suggesting that juvenile risk factors do not occur in isolation in Illinois.13 Counties with higher levels of a particular risk factor tend to have higher levels of other risk factors as well. For some of the risk factors in Appendix D, this may have been expected. For example, one may expect that risk factors of the same type (family, school, etc.) would be correlated. In many instances, this was the case. However, there were also many statistically significant relationships between risk factors of different types. Appendix D shows that there were statistically significant relationships between various social, school, and environmental risk factors. 11 Pearson’s correlation coefficients were calculated. The coefficient measures positive and negative linear relationships. Positive linear relationships (indicated by Pearson’s coefficients ranging from 0 to 1, with 1 representing a perfect positive linear relationship and zero representing no relationship between the two measures) occur when two measures consistently increase and decrease together. Negative linear relationships (indicated by Pearson’s coefficients ranging from 0 to –1, with –1 indicating a perfect negative linear relationship and zero representing no relationship between the two measures) occur when there is a consistent relationship such that one measure increases as the other decreases (and vice versa). Because the Pearson’s correlation coefficient is weakened when there are outlying or extreme scores on the measure, a number of juvenile risk factors and juvenile justice system data elements were altered to reduce the influence of extreme scores. In practice, this required using the square root or the log of the measure to calculate the Pearson’s correlation coefficient. 12 Rates require the use of population numbers. At the time this report was being written, 2000 census data were not available by age. Thus, for each rate that was calculated using 2000 and 2001 data, 1999 population estimates were used to calculate the rates. 13 Statistical significance means that the correlation coefficient was large enough to be able to make the statement that a linear relationship exists between the two risk factors. A threshold is used to determine statistical significance. Some correlation coefficients that are statistically significant barely exceed the threshold, while others exceed the threshold by a great deal.

36
Correlations Between Risk Factors and Juvenile Justice System Data Table 18 shows correlation coefficients describing relationships between juvenile delinquency risk factors and juvenile justice system data. Correlation coefficients, listed in bold in Table 18, are statistically significant in a logical direction (several correlation coefficients were statistically significant in the opposite direction than one would expect; Footnotes 11 and 13 define directions of correlation coefficients and statistical significance). The statistically significant correlations are moderately strong, ranging from .21 to .40. This moderation is expected, given that the measures are broad county-level indicators. Delinquency adjudications were only significantly correlated with one juvenile risk factor. With the exception of delinquency adjudications, Table 18 reveals several interesting patterns whereby groups of qualitatively similar juvenile risk factors are all correlated with particular juvenile justice system data elements. Some notable patterns of results for social, school, and environmental risk factors are described below.
Table 18
Correlation between Juvenile Delinquency Risk Factors and Juvenile Justice System Data for all Illinois Counties
Juvenile Justice System Data
Juvenile Delinquency Risk Factor
Delinquency
Filings
Delinquency
Adjudications
Post-adjudicatory
Detention
Probation Caseloads
Individual Risk Factor Suicide Admissions -.26 .11 .27a -.04
Social Risk Factors Drug/Alcohol Admissions--Mothers .25 .16 .09 .21 Inmates with Children .09 .19 .29 .35 Orders of Protection .11 .15 .20 .31 Reported Domestic Offenses -.06 .04 .40 .17 Indicated Abuse and Neglect .10 .07 .30 .29 Indicated Sexual Abuse .23 .00 .07 .26 Divorce and Annulments .34 .10 -.06 .11 Domestic Migration -.20 -.15 -.18 -.22
School Risk Factors Standardized Test Scores .26 .24 -.09 .17 Truancy .02 .08 .18 .21 Suspensions .01 .17 .29 .19 Expulsions -.04 .08 .08 .17 High School Dropouts .03 .11 .27 .25
Environmental Risk Factors Minors Living in Poverty .30 .20 -.05 .21 Unemployment .26 .01 -.19 -.01 Median Household Income -.37 -.14 -.21 -.12 Public Assistance .11 .13 .11 .17 Drug Arrests -.04 -.02 .22 .13 Drug Submissions -.01 .13 .23 .27 Violent Offenses .04 .09 .29 .20 Minority Residents -.06 .16 .39 .14 Teenage Births .21 .24 .13 .34
Other Risk Factor Drug/Alcohol Admissions--Minors .38 .17 -.03 .25
a. Correlations in bold are statistically significant.

37
Social Risk Factors
• Each of the social risk factors was significantly correlated with at least one juvenile justice system data element.
• Juvenile delinquency risk factors measuring family conflict (domestic offense incidents, orders of
protection) and prior abuse (indicated cases of child abuse and neglect) all measure, more generally, violence in the home. Each of these risk factors was significantly correlated with post-adjudicatory detentions.
School Risk Factors
• Although the research presented by Loeber and Farrington (1998) has shown that school risk factors tend to be strongly related to juvenile delinquency, most of the correlations between school risk factors and juvenile justice system data were not significant.
• The correlations revealed some evidence suggesting that school risk factors measuring school
commitment (truancy, suspensions, and high school dropouts) are related to post-adjudicatory detentions and the active end-of-year juvenile probation caseload.
Community Risk Factors
• Three measures of community poverty (minors living in poverty, unemployment, and median household income) were all significantly correlated with delinquency filings.
• Births to females ages 10 to 17 years were significantly correlated with three of the four juvenile justice
system data elements (delinquency filings, adjudications and probation caseload).
• Community crime risk factors measuring drug availability and exposure to violence (drug arrests, drug submissions, violent offenses) tend to be significantly correlated to post-adjudicatory detentions and active end of year probation caseload. This may suggest that minors living in communities in which drug and violent crimes are more prevalent are more likely to commit crimes serious enough to warrant detention or probation.
Risk Factors in Knox County
This part of the risk factor section describes the juvenile delinquency risk factors listed in Table 17 for Knox County and then, for each of the Table 17 risk factors, compares Knox County to bordering counties, similar counties, and Illinois as a whole. The purpose of this part of the risk factor section is to identify juvenile delinquency risk factors that may need to be addressed in Knox County. Similar to the juvenile justice system section, this section relies heavily on the statistical procedures to calculate confidence intervals that allows us to make more confident conclusions about the changes experienced over time and the differences between the rates or percentages in Knox County and those in bordering and similar counties and the state as a whole. See Appendix C for a more detailed review of the statistical analyses used. Individual Risk Factors
As indicated in Table 17, only one individual risk factor will be described in the profile: emergency room admissions for completed or attempted suicides. Suicide data may provide an indirect indication of the extent to which depression is a problem in the community. Table 17 shows that there is little evidence linking depression to juvenile delinquency, yet it still may be a risk factor. In fact, studies examining depression in juveniles have found a link between depression in youth and juvenile delinquency, but too few studies have been conducted to infer that there is a moderate or strong relationship between depression and juvenile delinquency. Table 18 shows that,

38
at the county level in Illinois, emergency room admissions for suicide were significantly related to post-adjudicatory detention.
Effective March 1998, the Illinois General Assembly mandated all hospitals with emergency departments to report victims of violent injury to the Illinois Department of Public Health (IDPH). In turn, IDPH was mandated to compile all the information they obtained in the Illinois Violent Injury Registry. The purpose of the registry is to provide accurate information that can be used for various purposes, including assessing the impact of violent injuries on the healthcare system. Although IDPH reported that compliance with the mandate has been high, the totals for 1998 may be low, as it took hospitals a period of time after the March 10 startup date to understand the violent injury-coding scheme provided to them by IDPH and to develop a system for collecting the data.
The Illinois Violent Injury Registry includes data for suicides attempted and successfully committed by various means. As an indirect measure of depression, data on emergency room admissions for both suicide attempts and completed suicides were examined for minors ages 0 to 17 years. Across all Illinois counties, from 1998 to 2000, there were 1,250 reported emergency room admissions for suicides for minors ages 0 to 17 years. From 1998 to 2000, there were 15 suicides attempted or completed by minors ages 0 to17 years in Knox County. Table 19 shows the attempted and completed suicide rates for minors ages 0 to 17 years for Knox County, bordering counties, similar counties, and statewide. Table 20 shows how the rates in bordering counties, similar counties, and statewide compared to the rates in Knox County when the statistical procedure was applied.
Table 19
Emergency Room Admission Rates for Attempted and Completed Suicides, Minors Ages 0 to 17 Years
Region
1998
1999
2000 Knox 53.64 46.61 15.54 Bordering 28.13 19.72 18.49 Similar 12.63 8.13 19.75 Statewide 10.28 13.48 15.53
Source: Illinois Department of Public Health; U.S. Census Bureau.
Table 20 Emergency Room Admission Rates for Attempted and Completed Suicides:
Overall Findings
Compared to Knox County Significantly Higher Similar Significantly Lower Bordering Counties X Similar Counties X Statewide X Social Risk Factors
Table 17 shows that seven data points measuring social risk factors will be described in this section. The seven data points measure five distinct social risk factors, each of which pertain to family relationships: (1) parental criminality, (2) family or home conflict, (3) prior abuse, (4) separation of family, and (5) family mobility.

39
Parental Criminality
As Table 17 indicates, there is a moderate amount of evidence from past research linking parental criminality to juvenile delinquency. The profile examines two types of data that may indirectly measure parental criminality: (1) drug treatment rates for females with children and (2) individuals that are incarcerated in the Illinois Department of Corrections (IDOC) who reported having children at the time of incarceration. Table 18 shows that, at the county level in Illinois, drug treatment rates for females with children were significantly correlated with delinquency petitions and probation caseload and the rate of inmates with children were significantly related to post-adjudicatory detention and probation caseload.
The Office of Alcoholism and Substance Abuse (OASA), a department overseen by the Illinois Department of Human Services (DHS), collects information from OASA-funded substance abuse treatment providers on the clients they serve. Substance abuse treatment providers are required to report to OASA using the Department’s Automated Reporting and Tracking System (DARTS). This system collects a vast amount of information about their clients, including the clients’ ages, race, sex, primary substance abused, treatment provided, and length of treatment. Programs that are Medicaid certified to deliver substance abuse treatment also report service information through DARTS. These data are collected to aid reimbursements to treatment providers, help OASA during their statewide planning process, and assist the federal government in determining the substance abuse problem across the nation. The DARTS program has been fully operational since 1994.
The data collected by OASA were used to examine parental drug treatment rates, an indirect measure of parental criminality. The DARTS system includes data indicating whether the client receiving services is a woman with a child. DARTS data for 1994 were excluded because it was the first year the data were collected and an examination of the data revealed inconsistencies. The data examined does not exclusively include women who have committed a crime. Rather, it includes women receiving treatment for alcohol and illicit drug use. The data examined was limited to instances when DARTS data indicated that the woman was between 13 and 70 years of age. The rates described in this sub-section will underestimate the rate of parental drug or alcohol abusers, as the rates exclude men and are limited to individuals receiving treatments included in the DARTS system. Data on males with children who were receiving treatment were not available.
Since 1995, approximately 310 females in Knox County ages 13 to 70 with children have received some type of services through OASA or through a Medicaid-funded program.14 Figure 16 shows drug treatment rates for females with children in Knox County and the other groups examined. Table 21 presents the overall findings after examining the changes in the drug treatment rates for females with children for Knox County and the other groups examined. Table 21 also shows how the rates in bordering counties, similar counties, and statewide compared to the rates in Knox County.
14 This number may overestimate the actual number of clients because we were unable to exclude those clients who received services during two consecutive years. For instance, a woman may receive services in 1995 and 1996 for the same episode.

40
Figure 16
Table 21 Drug Treatment Rates for Females with Children: Overall Findings
Change from 1995 to 2001
Significant Increase No Significant Change Significant Decrease Knox County X Bordering Counties X Similar Counties X Statewide X
Compared to Knox County
Significantly Higher Similar Significantly Lower Bordering Counties X Similar Counties X Statewide X
The Illinois Department of Corrections (IDOC) collects information on individuals committed to IDOC. Inmates are asked to complete a self-report intake questionnaire, which includes a question asking whether or not they have children. Answers to this question were used as a measure of parental criminality. It is important to note that inmates are not asked whether or not they are caring for children at the time they are committed. In addition, the information on inmates with children described is based on the county in which the committing offense occurred. The trend analyses describing inmates with children include data from state fiscal year (SFY) 1991 to SFY 2001.
Source: Illinois Department of Human Services, Office of Alcoholism and Substance Abuse.; U.S. Census Bureau.
Drug Treatment Rates for Females with Children,1995-2001
0
50
100
150
200
250
300
350
400
1995 1996 1997 1998 1999 2000 2001Calendar Year
Rat
e pe
r 100
,000
fem
ales
ag
es 1
3 to
70
Knox County Bordering Counties Similar Counties Statewide

41
Of the 715 inmates committed to IDOC from Knox County during the time period examined, 53 percent reported that they had children. Figure 17 shows rates of inmates with children for Knox County and the other groups examined. Table 22 presents the overall findings after examining the changes in rates of inmates with children for Knox County and the other groups examined. Table 22 also shows how the rates in bordering counties, similar counties, and statewide compared to the rates in Knox County.
Figure 17
Table 22 Rates of Inmates with Children: Overall Findings
Change from SFY 1991 to SFY 2001
Significant Increase No Significant Change Significant Decrease Knox County X Bordering Counties X Similar Counties X Statewide X
Compared to Knox County
Significantly Higher Similar Significantly Lower Bordering Counties X Similar Counties X Statewide X
Source: Illinois Department of Corrections; U.S. Census Bureau.
Rates of Inmates with Children, SFY 1991 - SFY 2001
0
20
40
60
80
100
120
140
160
180
1991 1992 1993 1994 1995 1996 1997 1998 1999 2000 2001State Fiscal Year
Rat
e pe
r 100
,000
per
sons
age
s 17
and
old
er
Knox County Bordering Counties Similar Counties Statewide
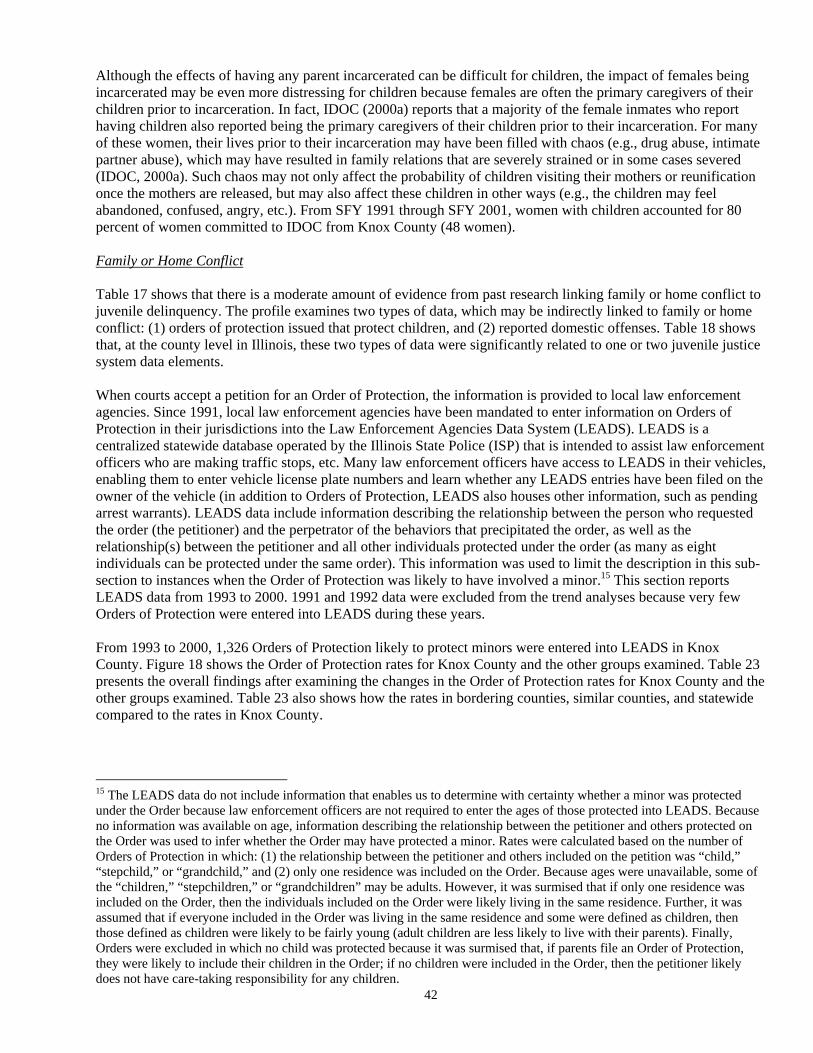
42
Although the effects of having any parent incarcerated can be difficult for children, the impact of females being incarcerated may be even more distressing for children because females are often the primary caregivers of their children prior to incarceration. In fact, IDOC (2000a) reports that a majority of the female inmates who report having children also reported being the primary caregivers of their children prior to their incarceration. For many of these women, their lives prior to their incarceration may have been filled with chaos (e.g., drug abuse, intimate partner abuse), which may have resulted in family relations that are severely strained or in some cases severed (IDOC, 2000a). Such chaos may not only affect the probability of children visiting their mothers or reunification once the mothers are released, but may also affect these children in other ways (e.g., the children may feel abandoned, confused, angry, etc.). From SFY 1991 through SFY 2001, women with children accounted for 80 percent of women committed to IDOC from Knox County (48 women).
Family or Home Conflict Table 17 shows that there is a moderate amount of evidence from past research linking family or home conflict to juvenile delinquency. The profile examines two types of data, which may be indirectly linked to family or home conflict: (1) orders of protection issued that protect children, and (2) reported domestic offenses. Table 18 shows that, at the county level in Illinois, these two types of data were significantly related to one or two juvenile justice system data elements.
When courts accept a petition for an Order of Protection, the information is provided to local law enforcement agencies. Since 1991, local law enforcement agencies have been mandated to enter information on Orders of Protection in their jurisdictions into the Law Enforcement Agencies Data System (LEADS). LEADS is a centralized statewide database operated by the Illinois State Police (ISP) that is intended to assist law enforcement officers who are making traffic stops, etc. Many law enforcement officers have access to LEADS in their vehicles, enabling them to enter vehicle license plate numbers and learn whether any LEADS entries have been filed on the owner of the vehicle (in addition to Orders of Protection, LEADS also houses other information, such as pending arrest warrants). LEADS data include information describing the relationship between the person who requested the order (the petitioner) and the perpetrator of the behaviors that precipitated the order, as well as the relationship(s) between the petitioner and all other individuals protected under the order (as many as eight individuals can be protected under the same order). This information was used to limit the description in this sub-section to instances when the Order of Protection was likely to have involved a minor.15 This section reports LEADS data from 1993 to 2000. 1991 and 1992 data were excluded from the trend analyses because very few Orders of Protection were entered into LEADS during these years.
From 1993 to 2000, 1,326 Orders of Protection likely to protect minors were entered into LEADS in Knox County. Figure 18 shows the Order of Protection rates for Knox County and the other groups examined. Table 23 presents the overall findings after examining the changes in the Order of Protection rates for Knox County and the other groups examined. Table 23 also shows how the rates in bordering counties, similar counties, and statewide compared to the rates in Knox County.
15 The LEADS data do not include information that enables us to determine with certainty whether a minor was protected under the Order because law enforcement officers are not required to enter the ages of those protected into LEADS. Because no information was available on age, information describing the relationship between the petitioner and others protected on the Order was used to infer whether the Order may have protected a minor. Rates were calculated based on the number of Orders of Protection in which: (1) the relationship between the petitioner and others included on the petition was “child,” “stepchild,” or “grandchild,” and (2) only one residence was included on the Order. Because ages were unavailable, some of the “children,” “stepchildren,” or “grandchildren” may be adults. However, it was surmised that if only one residence was included on the Order, then the individuals included on the Order were likely living in the same residence. Further, it was assumed that if everyone included in the Order was living in the same residence and some were defined as children, then those defined as children were likely to be fairly young (adult children are less likely to live with their parents). Finally, Orders were excluded in which no child was protected because it was surmised that, if parents file an Order of Protection, they were likely to include their children in the Order; if no children were included in the Order, then the petitioner likely does not have care-taking responsibility for any children.

43
Figure 18
Table 23
Order of Protection Rates: Overall Findings
Change from 1993 to 2000 Significant Increase No Significant Change Significant Decrease Knox County X Bordering Counties X Similar Counties X Statewide X
Compared to Knox County
Significantly Higher Similar Significantly Lower Bordering Counties -- -- -- Similar Counties X Statewide X Note:
The differences or similarities between the orders of protection rate for Knox County and the rate in bordering counties is not straightforward. In general, the orders of protection rates in bordering counties were comparable to or significantly higher than the rate in Knox County.
Since April 1996, data on reported domestic offenses have been submitted by local law enforcement agencies to the Illinois State Police (ISP) as part of the supplemental Uniform Crime Reports program. These data reflect the number of instances in which law enforcement officers respond to a call regarding a domestic disturbance, irrespective of whether the law enforcement officers who respond to the call make an arrest. Incidents classified as domestic offenses include any offense that occurs between family members, household members, or intimate partners (e.g., boyfriends/girlfriends, spouses, etc.). It is mandatory for law enforcement agencies to submit
Source: Illinois State Police; U.S. Census Bureau.
Rate of Orders of Protection that Protect Minors,1993-2000
0
100
200
300
400
500
600
1993 1994 1995 1996 1997 1998 1999 2000
Calendar Year
Rat
es p
er 1
00,0
00 p
erso
ns
ages
18
and
olde
r
Knox County Bordering Counties Similar Counties Statewide
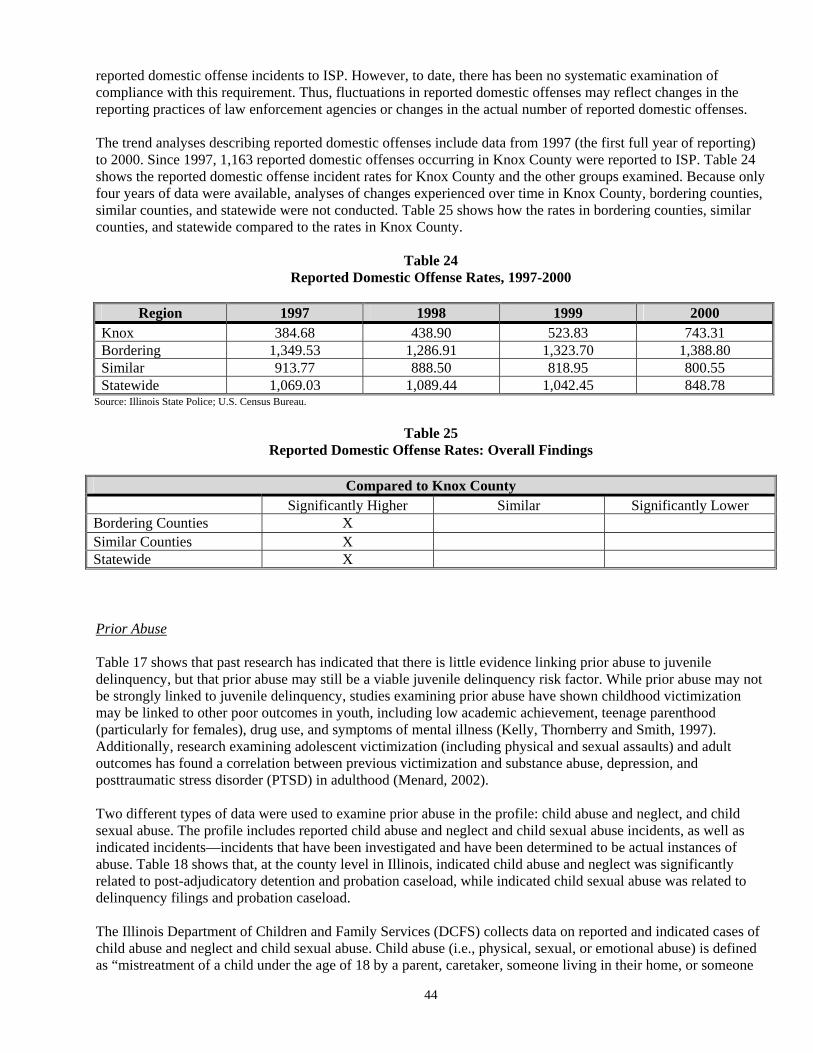
44
reported domestic offense incidents to ISP. However, to date, there has been no systematic examination of compliance with this requirement. Thus, fluctuations in reported domestic offenses may reflect changes in the reporting practices of law enforcement agencies or changes in the actual number of reported domestic offenses.
The trend analyses describing reported domestic offenses include data from 1997 (the first full year of reporting) to 2000. Since 1997, 1,163 reported domestic offenses occurring in Knox County were reported to ISP. Table 24 shows the reported domestic offense incident rates for Knox County and the other groups examined. Because only four years of data were available, analyses of changes experienced over time in Knox County, bordering counties, similar counties, and statewide were not conducted. Table 25 shows how the rates in bordering counties, similar counties, and statewide compared to the rates in Knox County.
Table 24 Reported Domestic Offense Rates, 1997-2000
Region 1997 1998 1999 2000
Knox 384.68 438.90 523.83 743.31 Bordering 1,349.53 1,286.91 1,323.70 1,388.80 Similar 913.77 888.50 818.95 800.55 Statewide 1,069.03 1,089.44 1,042.45 848.78
Source: Illinois State Police; U.S. Census Bureau.
Table 25 Reported Domestic Offense Rates: Overall Findings
Compared to Knox County
Significantly Higher Similar Significantly Lower Bordering Counties X Similar Counties X Statewide X Prior Abuse
Table 17 shows that past research has indicated that there is little evidence linking prior abuse to juvenile delinquency, but that prior abuse may still be a viable juvenile delinquency risk factor. While prior abuse may not be strongly linked to juvenile delinquency, studies examining prior abuse have shown childhood victimization may be linked to other poor outcomes in youth, including low academic achievement, teenage parenthood (particularly for females), drug use, and symptoms of mental illness (Kelly, Thornberry and Smith, 1997). Additionally, research examining adolescent victimization (including physical and sexual assaults) and adult outcomes has found a correlation between previous victimization and substance abuse, depression, and posttraumatic stress disorder (PTSD) in adulthood (Menard, 2002).
Two different types of data were used to examine prior abuse in the profile: child abuse and neglect, and child sexual abuse. The profile includes reported child abuse and neglect and child sexual abuse incidents, as well as indicated incidents—incidents that have been investigated and have been determined to be actual instances of abuse. Table 18 shows that, at the county level in Illinois, indicated child abuse and neglect was significantly related to post-adjudicatory detention and probation caseload, while indicated child sexual abuse was related to delinquency filings and probation caseload.
The Illinois Department of Children and Family Services (DCFS) collects data on reported and indicated cases of child abuse and neglect and child sexual abuse. Child abuse (i.e., physical, sexual, or emotional abuse) is defined as “mistreatment of a child under the age of 18 by a parent, caretaker, someone living in their home, or someone

45
who works with or is around children.”16 The mistreatment must cause injury or place the child at risk for physical injury. Neglect occurs when a parent or guardian fails to provide adequate shelter, food, or other needs of the child. Additionally, in Illinois, several types of professionals are mandated to report child abuse and neglect to DCFS. These include, but are not limited to, medical, school, and criminal and juvenile justice professionals.
From SFY 1990 to SFY 2000, 8,310 cases of child abuse and neglect in Knox County were reported to DCFS. Figure 19 shows child abuse and neglect rates for Knox County and the other groups examined. Table 26 presents the overall findings after examining the changes in the reported child abuse and neglect rates for Knox County and the other groups examined. Table 26 also shows how the rates in bordering counties, similar counties, and statewide compared to the rates in Knox County.
Figure 19
16 See the Department of Children and Family Services’ website at: www.state.il.us/dcfs/cp_child.shtml for a complete description of child abuse and neglect, the list of individuals who are required to report cases of child abuse and neglect, and additional information.
Source: Illinois Department of Children and Family Services; U.S. Census Bureau.
Reported Child Abuse and Neglect Rates, SFY 1990 - SFY 2000
0
1,000
2,000
3,000
4,000
5,000
6,000
7,000
1990 1991 1992 1993 1994 1995 1996 1997 1998 1999 2000
State Fiscal Year
Rat
es p
er 1
00,0
00 p
erso
ns
ages
0 to
17
Knox County Bordering Counties Similar Counties Statewide

46
Table 26 Reported Child Abuse and Neglect Rates: Overall Findings
Change from SFY 1990 to SFY 2000
Significant Increase No Significant Change Significant Decrease Knox County X Bordering Counties X Similar Counties X Statewide X
Compared to Knox County
Significantly Higher Similar Significantly Lower Bordering Counties X Similar Counties X Statewide X Note:
• Although the reported child abuse and neglect rate in bordering counties was significantly lower than the rate in Knox County from SFY 1996 to SFY 2000, prior to SFY 1996, the rates were comparable.
From SFY 1990 to SFY 2000, 46 percent of all reported cases of child abuse and neglect in Knox County were indicated as abuse or neglect (3,789 cases were indicated out of 8,310 cases reported). Figure 20 shows the percent of child abuse and neglect cases that were indicated in Knox County and the other groups examined. Table 27 presents the overall findings after examining the changes in the percent of child abuse and neglect cases that were indicated for Knox County and the other groups examined. Table 27 also shows how the percentages in bordering counties, similar counties, and statewide compared to the percentages in Knox County.
Figure 20
Source: Illinois Department of Children and Family Services; U.S. Census Bureau.
Percent of Child Abuse and Neglect Cases that were Indicated, SFY 1990 - SFY 2000
0%
10%
20%
30%
40%
50%
60%
1990 1991 1992 1993 1994 1995 1996 1997 1998 1999 2000
State Fiscal Year
Per
cent
Knox County Bordering Counties Similar Counties Statewide

47
Table 27 Percent of Child Abuse and Neglect Cases that were Indicated: Overall Findings
Change from SFY 1990 to SFY 2000
Significant Increase No Significant Change Significant Decrease Knox County X Bordering Counties X Similar Counties X Statewide X
Compared to Knox County
Significantly Higher Similar Significantly Lower Bordering Counties X Similar Counties X Statewide X Since SFY 1990, 764 cases of child sexual abuse in Knox County have been reported to DCFS. Figure 21 shows reported child sexual abuse rates for Knox County and the other groups examined. Table 28 presents the overall findings after examining the changes in the reported child sexual abuse rates for Knox County and the other groups examined. Table 28 also shows how the rates in bordering counties, similar counties, and statewide compared to the rates in Knox County.
Figure 21
Source: Illinois Department of Children and Family Services; U.S. Census Bureau.
Reported Child Sexual Abuse Rates, SFY 1990 - SFY 2000
0
100
200
300
400
500
600
700
800
900
1990 1991 1992 1993 1994 1995 1996 1997 1998 1999 2000
State Fiscal Year
Rat
es p
er 1
00,0
00 p
erso
ns
ages
0 to
17
Knox County Bordering Counties Similar Counties Statewide
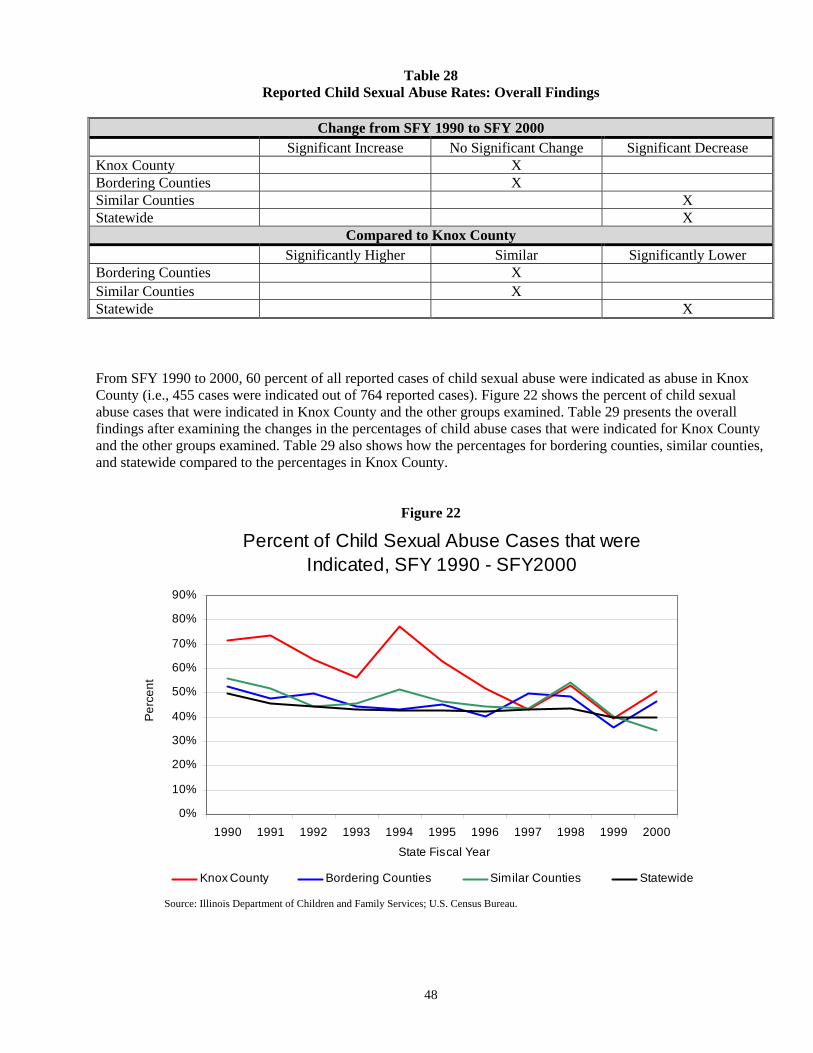
48
Table 28 Reported Child Sexual Abuse Rates: Overall Findings
Change from SFY 1990 to SFY 2000
Significant Increase No Significant Change Significant Decrease Knox County X Bordering Counties X Similar Counties X Statewide X
Compared to Knox County
Significantly Higher Similar Significantly Lower Bordering Counties X Similar Counties X Statewide X From SFY 1990 to 2000, 60 percent of all reported cases of child sexual abuse were indicated as abuse in Knox County (i.e., 455 cases were indicated out of 764 reported cases). Figure 22 shows the percent of child sexual abuse cases that were indicated in Knox County and the other groups examined. Table 29 presents the overall findings after examining the changes in the percentages of child abuse cases that were indicated for Knox County and the other groups examined. Table 29 also shows how the percentages for bordering counties, similar counties, and statewide compared to the percentages in Knox County.
Figure 22
Source: Illinois Department of Children and Family Services; U.S. Census Bureau.
Percent of Child Sexual Abuse Cases that were Indicated, SFY 1990 - SFY2000
0%
10%
20%
30%
40%
50%
60%
70%
80%
90%
1990 1991 1992 1993 1994 1995 1996 1997 1998 1999 2000
State Fiscal Year
Per
cent
Knox County Bordering Counties Similar Counties Statewide
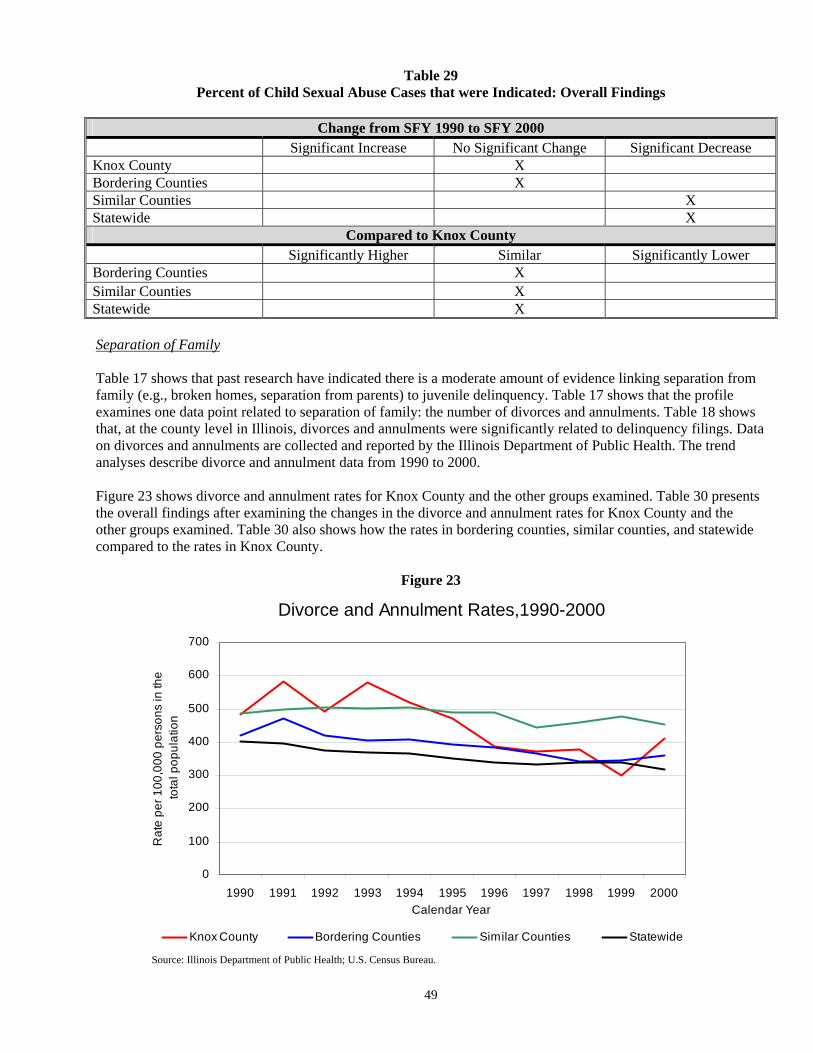
49
Table 29 Percent of Child Sexual Abuse Cases that were Indicated: Overall Findings
Change from SFY 1990 to SFY 2000
Significant Increase No Significant Change Significant Decrease Knox County X Bordering Counties X Similar Counties X Statewide X
Compared to Knox County
Significantly Higher Similar Significantly Lower Bordering Counties X Similar Counties X Statewide X
Separation of Family Table 17 shows that past research have indicated there is a moderate amount of evidence linking separation from family (e.g., broken homes, separation from parents) to juvenile delinquency. Table 17 shows that the profile examines one data point related to separation of family: the number of divorces and annulments. Table 18 shows that, at the county level in Illinois, divorces and annulments were significantly related to delinquency filings. Data on divorces and annulments are collected and reported by the Illinois Department of Public Health. The trend analyses describe divorce and annulment data from 1990 to 2000.
Figure 23 shows divorce and annulment rates for Knox County and the other groups examined. Table 30 presents the overall findings after examining the changes in the divorce and annulment rates for Knox County and the other groups examined. Table 30 also shows how the rates in bordering counties, similar counties, and statewide compared to the rates in Knox County.
Figure 23
Source: Illinois Department of Public Health; U.S. Census Bureau.
Divorce and Annulment Rates,1990-2000
0
100
200
300
400
500
600
700
1990 1991 1992 1993 1994 1995 1996 1997 1998 1999 2000Calendar Year
Rat
e pe
r 100
,000
per
sons
in th
e to
tal p
opul
atio
n
Knox County Bordering Counties Similar Counties Statewide

50
Table 30 Divorce and Annulment Rates: Overall Findings
Change from 1990 to 2000
Significant Increase No Significant Change Significant Decrease Knox County X Bordering Counties X Similar Counties X Statewide X
Compared to Knox County
Significantly Higher Similar Significantly Lower Bordering Counties X Similar Counties X Statewide X Family Mobility Table 17 shows that past research has indicated that there is little evidence linking family mobility to juvenile delinquency, but that family mobility may still be a viable juvenile delinquency risk factor. More research may be needed to determine whether family mobility is a viable juvenile delinquency risk factor. Table 17 shows that the profile examines one data point that indirectly measures family mobility: net domestic migration. Table 18 shows that, at the county level in Illinois, net domestic migration was significantly related to delinquency filings and probation caseload. The U.S. Census Bureau collects and reports data on net domestic migration from July 1 of one year to June 30 of the subsequent year. This section describes data reported by the U.S. Census Bureau on total net domestic migration from July 1, 1990 to July 1, 1999. Any link between family mobility and juvenile delinquency would likely exist as a result of minors being thrust into new environments and, perhaps, feeling isolated or not being involved in the community. The U.S. Census Bureau, however, does not report migration patterns specifically for minors, and therefore, the data reported in this section are the total net migration for the general population. Thus, it is perhaps surprising that two of the correlation coefficients in Table 18 were significant.
Table 31 shows total net domestic migration from July 1, 1990 to July 1, 1999 for Knox County and for each of the other groups examined. Table 31 shows that there was a great deal of disparity in the migration patterns in the bordering and similar counties. For this reason, we opted not to examine the average net migration for the bordering and similar counties.17 Nor was the statistical process adopted for the total net domestic migration data.
Table 31 shows that, in Knox County, there was out-migration across the 1990s. An examination of data for each individual year in the 1990s indicated that there was small, yet consistent, out-migration in Knox County. Table 31 also shows that out-migration in Knox County is moderate compared to several counties in the other groups examined.
17 It was also not possible to calculate rates, as the net migration data ran from the middle of one year to the middle of the next year, while available population data ran from the beginning to the end of each calendar year. This created a contradiction in time periods for the two primary elements necessary to calculate rates.

51
Table 31 Total Net Domestic Migration, July 1, 1990 to July 1, 1999
County Domestic Migration Knox -958
Bordering Counties Fulton 1,109 Henry 350 Mercer 318 Peoria -11,559 Stark -176
Warren -239 Similar Counties
LaSalle 1,899 Morgan -1,450
Stephenson -644 Vermilion -6,403 Whiteside -2,476
Statewide -560,003
Source: U.S. Census Bureau School Risk Factors
Table 17 shows that five data points measuring school risk factors will be described in this section. These data points measure two distinct types of school risk factors: (1) academic achievement and (2) school commitment. Academic Achievement
Table 17 shows that past research has indicated that there is strong evidence linking academic achievement levels to juvenile delinquency. Table 17 shows that the profile examines one type of data that measures academic achievement: Illinois Standards Achievement Test (ISAT) scores. Despite the strong evidence linking academic achievement to juvenile delinquency, Table 18 shows that, at the county level in Illinois, ISAT scores were not significantly related to any of the juvenile justice system data elements.
Since the 1998/1999 academic year, the ISAT has been administered annually to grade school students (3rd and 5th grade students) and middle school students (8th grade students). The ISAT was also administered on a voluntary basis to high school students (10th grade students) in academic years 1998/1999 and 1999/2000. The Illinois State Board of Education (ISBE) reported that, in the 1999/2000 academic year, nearly one third of high schools did not administer the ISAT to their students. For the 2000/2001 academic year, ISBE required high school students (11th graders) to take a new standardized test: the Prairie State Achievement Examination (PSAE). When describing results for the 2000/2001 academic year, data pertaining to the PSAE are used as a substitute for ISAT data for high school students.
The ISAT is a standardized test that, for 3rd, 5th, and 8th graders, measures various dimensions of reading (e.g., comprehension, vocabulary), writing (e.g., grammar, composition), and mathematics (e.g., arithmetic, algebra). Public school students in every county in Illinois take the test. The ISBE reported that, in academic year 1999/2000, approximately 800,000 students in Illinois’ public schools took the ISAT. The PSAE is a standardized test that measures English, mathematics, reading, science and science reasoning, writing, and social science. The test includes both an ACT assessment (developed by American College Testing, Inc.) and test components developed by the ISBE.

52
This section reports the percent of students who met or exceeded ISAT and PSAE standards for reading, writing, and mathematics, established by the ISBE, for academic years 1998/1999, 1999/2000, and 2000/2001. The statistical process was not adopted for analyses of these data. Table 32 shows the percent of students who met or exceeded Illinois State Board of Education standards on the ISAT or PSAE for academic years 1998/1999, 1999/2000, and 2000/2001. The percents in Table 32 were averaged across grades 3, 5, 8 and 10 for academic years 1998/1999 and 1999/2000 and across grades 3, 5, 8 and 11 (with percentages based on the PSAE for 11th graders) for academic year 2000/2001.18
The percentages in Table 32 suggest that Knox County students appear to be meeting or exceeding reading and mathematics standards more often than students statewide, but that Knox County and statewide writing standards are approximately equal. There did not appear to be any consistent pattern of similarities or differences between test scores of Knox County students and test scores of students in bordering and similar counties.19
Table 32 Percent of Students Who Met or Exceeded ISAT or PSAE Standards
Test
Region Academic
Year Reading Writing Mathematics 1998/1999 70.2 62.6 60.0 1999/2000 66.4 65.8 65.1
Knox
2000/2001 64.9 61.1 66.4 1998/1999 66.9 61.0 57.1 1999/2000 66.5 62.1 58.5
Bordering
2000/2001 62.4 56.8 62.9 1998/1999 69.9 63.9 57.2 1999/2000 69.4 65.4 60.1
Similar
2000/2001 62.3 59.2 61.9 1998/1999 64.3 62.5 54.1 1999/2000 64.3 65.2 57.2
Statewide
2000/2001 59.3 60.1 58.6 Source: Illinois State Board of Education.
School Commitment
Table 17 shows that past research have indicated there is strong evidence linking school commitment (i.e., involvement in school) to juvenile delinquency. This profile examines four data points that measure school commitment: (1) truant students (grades kindergarten through 12), (2) suspensions (grades kindergarten through 12), (3) expulsions (grades kindergarten through 12), and (4) high school dropouts (grades 9 through 12). Despite the strong evidence linking school commitment to juvenile delinquency, a majority of the county-level relationships in Table 18 were not significant. ISBE collects and reports information on the four data points that measure school commitment.
Students are considered truant if they are required to attend school but are absent without valid cause for one or more days during the 180 day academic year. Between the 1990/1991 and 2000/2001 academic years, an average of 8,690 students attended public school in Knox County. Students who were identified as being truant accounted for approximately 11 percent of all the students attending public school in Knox County during this time period. Figure 24 shows truancy rates in Knox County and the other groups examined. Table 33 presents the overall findings after examining the changes in the truancy rates for Knox County and the other groups examined. Table
18 Average ISAT scores were available from ISBE for individual schools. To calculate county level percentages, weighted means were calculated that take into account the number of students enrolled in each school within a county. 19 Caution should be taken when interpreting these results because it is unclear what constitutes a large enough disparity in percents to make these claims.
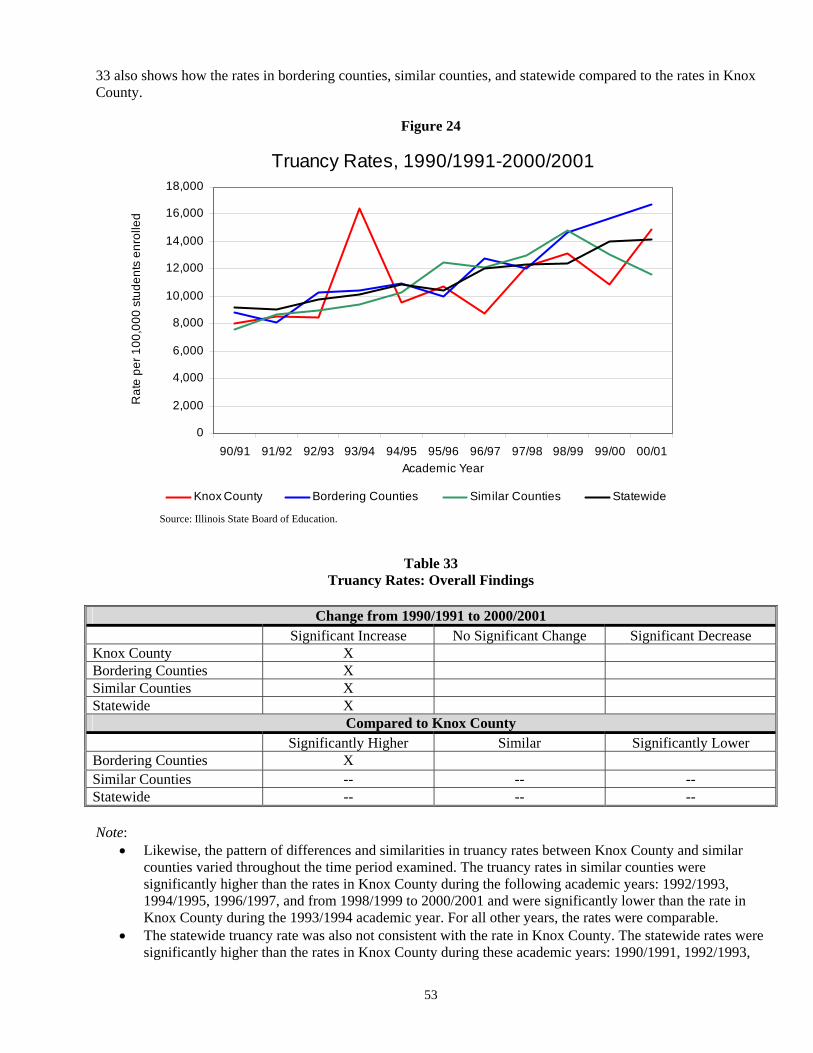
53
33 also shows how the rates in bordering counties, similar counties, and statewide compared to the rates in Knox County.
Figure 24
Table 33 Truancy Rates: Overall Findings
Change from 1990/1991 to 2000/2001
Significant Increase No Significant Change Significant Decrease Knox County X Bordering Counties X Similar Counties X Statewide X
Compared to Knox County
Significantly Higher Similar Significantly Lower Bordering Counties X Similar Counties -- -- -- Statewide -- -- -- Note:
• Likewise, the pattern of differences and similarities in truancy rates between Knox County and similar counties varied throughout the time period examined. The truancy rates in similar counties were significantly higher than the rates in Knox County during the following academic years: 1992/1993, 1994/1995, 1996/1997, and from 1998/1999 to 2000/2001 and were significantly lower than the rate in Knox County during the 1993/1994 academic year. For all other years, the rates were comparable.
• The statewide truancy rate was also not consistent with the rate in Knox County. The statewide rates were significantly higher than the rates in Knox County during these academic years: 1990/1991, 1992/1993,
Source: Illinois State Board of Education.
Truancy Rates, 1990/1991-2000/2001
0
2,000
4,000
6,000
8,000
10,000
12,000
14,000
16,000
18,000
90/91 91/92 92/93 93/94 94/95 95/96 96/97 97/98 98/99 99/00 00/01Academic Year
Rat
e pe
r 100
,000
stu
dent
s en
rolle
d
Knox County Bordering Counties Similar Counties Statewide

54
1994/1995, 1996/1997, and 1999/2000 and the statewide rate were significantly lower than the rate in Knox County during the 1993/1994 academic year. For all other years, the rates were comparable.
ISBE distinguishes between truancy and chronic truancy. Chronic truants are students who are required to attend school but are absent without valid cause for 18 or more of the previous 180 school days. Thus, a truant student need only have at least one unexcused absence, while a chronic truant must have 18 unexcused absences. Of the total number of truants in Knox County from the 1990/1991 to 2000/2001 school years, 24.4 percent were chronic truants (2,563 students). Because chronic truancy is extremely serious (e.g., youth who are chronically truant may perform more poorly in school than students who consistently attend school), it is important to note the change in the percentage of truants who were chronically truant during the time period examined. Figure 25 shows the percent of truants in Knox County who were chronically truant. The trend decreased significantly, from 35 percent of all truants being chronic truants in the 1990/1991 academic year to 15 percent in the 2000/2001 academic year.
Figure 25
ISBE also collects and reports information on students suspended. Suspensions may result from many different types of student behaviors (e.g., fighting, acting out, etc.) and they typically last a specified number of days, after which the suspended students are allowed to return to school.
From the 1990/1991 to the 2000/2001 academic years, approximately 6 percent of the student population in Knox County had been suspended at least once (6,087 students).20 Figure 26 shows suspension rates in Knox County and the other groups examined. Table 34 presents the overall findings after examining the changes in the suspension rates for Knox County and the other groups examined. Table 34 also shows how the rates in bordering counties, similar counties, and statewide compared to the rates in Knox County.
20 The suspension data reflects students that were suspended at least once during the school year. Students that were suspended more than once during the school year are only counted once.
Source: Illinois State Board of Education.
Percent of Truants in Knox County that were Chronic Truants, 1990/1991-2000/2001
0%
5%
10%
15%
20%
25%
30%
35%
40%
45%
90/91 91/92 92/93 93/94 94/95 95/96 96/97 97/98 98/99 99/00 00/01
Academic Year
Per
cent
age
of C
hron
ic T
ruan
ts
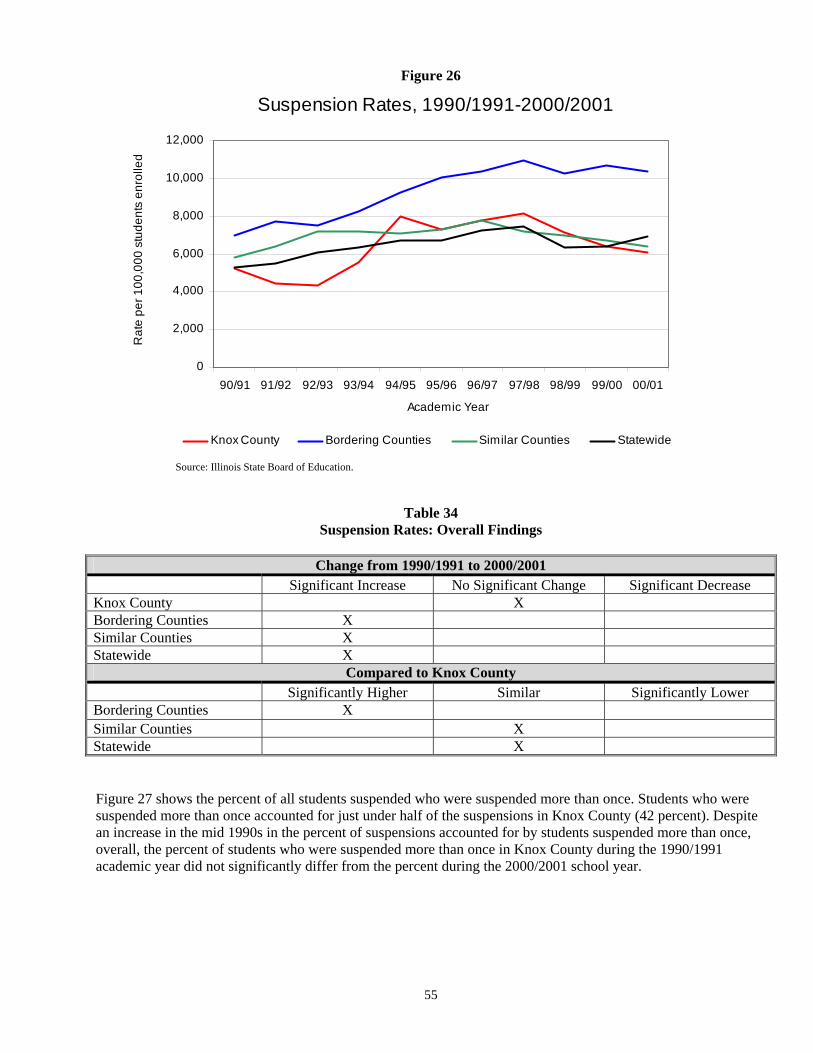
55
Figure 26
Table 34 Suspension Rates: Overall Findings
Change from 1990/1991 to 2000/2001
Significant Increase No Significant Change Significant Decrease Knox County X Bordering Counties X Similar Counties X Statewide X
Compared to Knox County
Significantly Higher Similar Significantly Lower Bordering Counties X Similar Counties X Statewide X Figure 27 shows the percent of all students suspended who were suspended more than once. Students who were suspended more than once accounted for just under half of the suspensions in Knox County (42 percent). Despite an increase in the mid 1990s in the percent of suspensions accounted for by students suspended more than once, overall, the percent of students who were suspended more than once in Knox County during the 1990/1991 academic year did not significantly differ from the percent during the 2000/2001 school year.
Source: Illinois State Board of Education.
Suspension Rates, 1990/1991-2000/2001
0
2,000
4,000
6,000
8,000
10,000
12,000
90/91 91/92 92/93 93/94 94/95 95/96 96/97 97/98 98/99 99/00 00/01
Academic Year
Rat
e pe
r 100
,000
stu
dent
s en
rolle
d
Knox County Bordering Counties Similar Counties Statewide

56
Figure 27
Students who are expelled are not allowed to return to school for a lengthy period of time following the expulsion. During the expulsion period, students are offered alternative education. However, parents may also choose to transfer expelled students to private schools or home schooling during the expulsion period.
From the 1990/1991 to 2000/2001 academic years, 170 students were expelled in Knox County. Figure 28 shows expulsion rates for Knox County and the other groups examined. Table 35 presents the overall findings after examining the changes in the expulsion rates for Knox County and the other groups examined. Table 35 also shows how the rates in bordering counties, similar counties, and statewide compared to the rates in Knox County.
Source: Illinois State Board of Education.
Percent of Suspended Students in Knox County who were Suspended More than Once,
1990/1991-2000/2001
0%
10%
20%
30%
40%
50%
60%
90/91 91/92 92/93 93/94 94/95 95/96 96/97 97/98 98/99 99/00 00/01
Academic Year
Per
cent

57
Figure 28
Table 35 Expulsion Rates: Overall Findings
Change from 1990/1991 to 2000/2001
Significant Increase No Significant Change Significant Decrease Knox County X Bordering Counties X Similar Counties X Statewide X
Compared to Knox County
Significantly Higher Similar Significantly Lower Bordering Counties X Similar Counties X Statewide X
The Illinois State Board of Education defines dropouts as “students in grades 9 through 12 whose names have been removed from the district-housed roster for any reason other than death, extended illness, graduation/completion of a program of studies, transfer to another public/private school, or expulsion.” Between the 1990/1991 and 2000/2001 academic years, 1,543 students dropped out of school in Knox County. Figure 29 shows the high school dropout rates for Knox County and the other groups examined. Table 36 presents the overall findings after examining the changes in the high school dropout rates for Knox County and the other groups examined. Table 36 also shows how the rates in bordering counties, similar counties, and statewide compared to the rates in Knox County.
Source: Illinois State Board of Education.
Expulsion Rates, 1990/1991-2000/2001
0
100
200
300
400
500
600
700
800
90/91 91/92 92/93 93/94 94/95 95/96 96/97 97/98 98/99 99/00 00/01
Academic Year
Rat
e pe
r 100
,000
stu
dent
s en
rolle
d
Knox County Bordering Counties Similar Counties Statewide

58
Figure 29
Table 36 High School Dropout Rates: Overall Findings
Change from 1990/1991 to 2000/2001
Significant Increase No Significant Change Significant Decrease Knox County X Bordering Counties X Similar Counties X Statewide X
Compared to Knox County
Significantly Higher Similar Significantly Lower Bordering Counties X Similar Counties X Statewide X
Source: Illinois State Board of Education.
High School Dropout Rates, 1990/1991-2000/2001
0
1,000
2,000
3,000
4,000
5,000
6,000
7,000
8,000
90/91 91/92 92/93 93/94 94/95 95/96 96/97 97/98 98/99 99/00 00/01
Academic Year
Rat
e pe
r 100
,000
stu
dent
s en
rolle
d
Knox County Bordering Counties Similar Counties Statewide
59
Environmental Risk Factors
Table 17 shows ten data points measuring environmental risk factors that will be described in this section. Eight of these data points measure three distinct types of environmental risk factors: (1) community poverty, (2) drug availability, and (3) exposure to violence. In addition, because race/ethnicity and births to female adolescents can be linked with other environmental risk factors, these data points will be described in this part of the profile. Community Poverty Table 17 shows past research has indicated there is a moderate amount of evidence linking community poverty to juvenile delinquency. Research has also found areas with high concentrations of poverty experience high levels of other indicators related to juvenile delinquency, such as poor physical health, low-birth weight, teenage pregnancy, unemployment, and child abuse and neglect (Sampson, 1998). This profile examines five data points measuring community poverty: (1) the number of persons living in poverty, (2) the number of minors living in poverty, (3) unemployment rates, (4) estimated median household income, and (5) the number of individuals receiving public assistance. Table 18 shows that correlation coefficients were calculated between four of these community poverty measures (the number of persons living in poverty was excluded) and juvenile justice system data points. At the county level in Illinois, the number of minors living in poverty was correlated with delinquency filings and probation caseload, unemployment was correlated to delinquency filings, and median household income was correlated to delinquency filings and post-adjudicatory detention. Public assistance was not significantly correlated with any of the justice system data elements. The U.S. Census Bureau collects data on family income, which is used to calculate estimates of poverty in the U.S. The official poverty definition only considers cash income before taxes when calculating a family’s poverty status; it does not include other sources of income, such as capital gains and other non-cash benefits (e.g., public housing and food stamps). To calculate the estimated number of individuals living in poverty, the U.S. Census Bureau first creates poverty thresholds based on the size of the family and the number of related children under the age of 18 living in the home. If a family does not exceed the poverty threshold, that family is considered poor, or in poverty. The U.S. Census Bureau used these thresholds to estimate the number of persons and the number of minors living in poverty for 1993, 1995, 1997, and 1998. Because the data were limited to these years and the data are estimates, the statistical procedures used for the other data points examined (see the description of the method used in the Introduction) were not adopted for the poverty data. Instead, confidence intervals calculated by the U.S. Census Bureau were used to determine if statistical differences existed between Knox County, the statewide percents, and the percent for each of the individual bordering and similar counties. Percentages across counties bordering and similar to Knox County were not combined because these data are based on estimates of persons living in poverty.
Table 37 shows the estimated percent of persons living in poverty for Knox County and the other groups examined. Across the years for which the U.S. Census Bureau made estimates, approximately 13 percent of the persons living in Knox County were living in poverty. There were no significant differences between the percent of persons living in poverty in individual bordering and similar counties and the percents in Knox County. Nor were there significant differences between Knox County percents and statewide percents. Table 38 shows the estimated percent of persons under 18 living in poverty for Knox County and the other groups examined. Across the years for which the U.S. Census Bureau made estimates, approximately 19 percent of persons under 18 in Knox County were living in poverty. Across all years that the U.S. Census Bureau made estimates, there were no significant differences between the percent of persons living in poverty in Knox County the percent statewide. Additionally, for each year examined there were no significant differences between the estimated percent of persons under 18 living in poverty in Knox County and the percents in any of the individual bordering and similar counties.
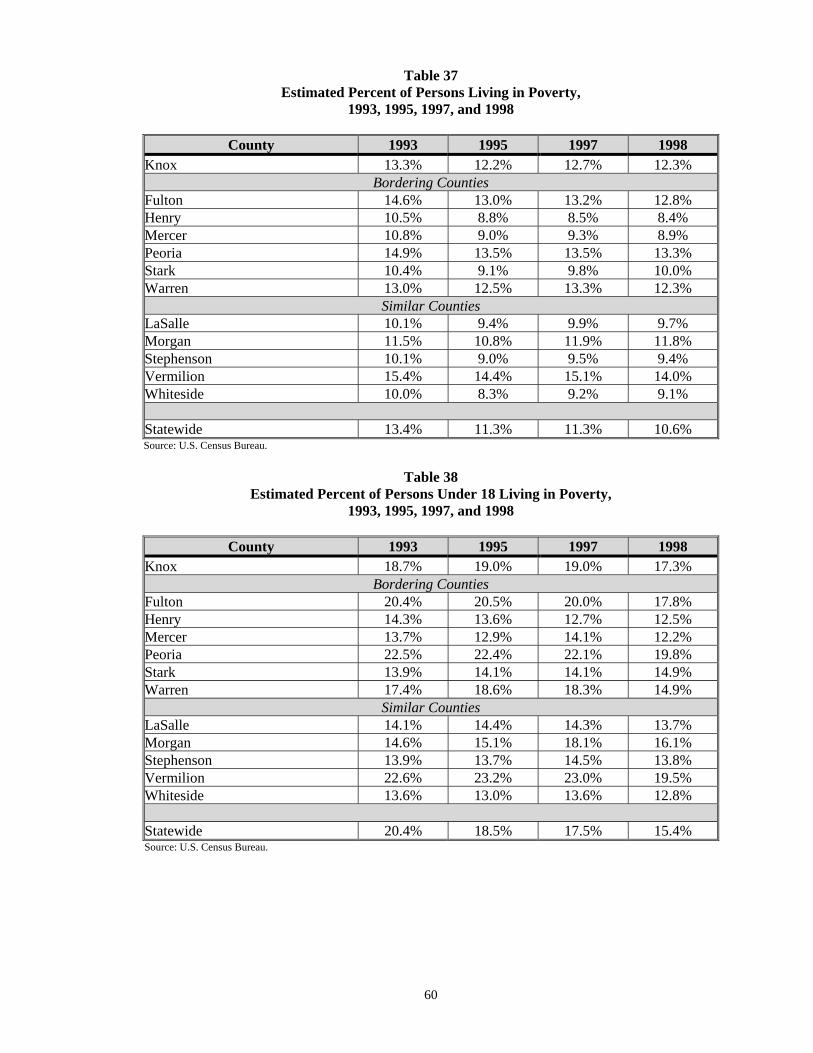
60
Table 37 Estimated Percent of Persons Living in Poverty,
1993, 1995, 1997, and 1998
County 1993 1995 1997 1998 Knox 13.3% 12.2% 12.7% 12.3%
Bordering Counties Fulton 14.6% 13.0% 13.2% 12.8% Henry 10.5% 8.8% 8.5% 8.4% Mercer 10.8% 9.0% 9.3% 8.9% Peoria 14.9% 13.5% 13.5% 13.3% Stark 10.4% 9.1% 9.8% 10.0% Warren 13.0% 12.5% 13.3% 12.3%
Similar Counties LaSalle 10.1% 9.4% 9.9% 9.7% Morgan 11.5% 10.8% 11.9% 11.8% Stephenson 10.1% 9.0% 9.5% 9.4% Vermilion 15.4% 14.4% 15.1% 14.0% Whiteside 10.0% 8.3% 9.2% 9.1%
Statewide 13.4% 11.3% 11.3% 10.6% Source: U.S. Census Bureau.
Table 38
Estimated Percent of Persons Under 18 Living in Poverty, 1993, 1995, 1997, and 1998
County 1993 1995 1997 1998
Knox 18.7% 19.0% 19.0% 17.3% Bordering Counties
Fulton 20.4% 20.5% 20.0% 17.8% Henry 14.3% 13.6% 12.7% 12.5% Mercer 13.7% 12.9% 14.1% 12.2% Peoria 22.5% 22.4% 22.1% 19.8% Stark 13.9% 14.1% 14.1% 14.9% Warren 17.4% 18.6% 18.3% 14.9%
Similar Counties LaSalle 14.1% 14.4% 14.3% 13.7% Morgan 14.6% 15.1% 18.1% 16.1% Stephenson 13.9% 13.7% 14.5% 13.8% Vermilion 22.6% 23.2% 23.0% 19.5% Whiteside 13.6% 13.0% 13.6% 12.8%
Statewide 20.4% 18.5% 17.5% 15.4% Source: U.S. Census Bureau.

61
The Illinois Department of Employment Security (IDES) collects data on unemployment in Illinois. IDES uses the following criteria to determine who is employed, who is unemployed, and who is considered “out of the labor force.”
Employed persons include individuals who:
(1) worked at least one hour for pay or profit, (2) were temporarily away from work due to reasons such as labor disputes, vacation, or illness, or (3) worked at least 15 unpaid hours in a family business.
Unemployed persons include individuals who:
(1) have lost their jobs involuntarily; (2) have quit their jobs; (3) have entered the labor market for the first time or re-entered the labor market after a period of absence; or (4) have been laid off but are expected to be recalled.
Individuals who are considered “not in the labor force” include:
(1) individuals who are not interested in working (e.g., students, homemakers, retirees); or (2) individuals who want to work, but who are either discouraged or face barriers to entering the labor force
(e.g., child care, transportation) (Reinhold, 1998).
To calculate the unemployment rate, the number of individuals unemployed is divided by the number of persons eligible for labor (employed individuals + unemployed individuals; individuals not in the labor force are considered ineligible).
Figure 30 shows unemployment rates for Knox County and the other groups examined. Table 39 presents the overall findings after examining the changes in the unemployment rates for Knox County and the other groups examined. Table 39 also shows how the rates in bordering counties, similar counties, and statewide compared to the rates in Knox County.
Figure 30
Source: Illinois Department of Employment Securities.
Unemployment Rates, 1990-2000
0
1,000
2,000
3,000
4,000
5,000
6,000
7,000
8,000
9,000
10,000
1990 1991 1992 1993 1994 1995 1996 1997 1998 1999 2000
Calendar Year
Rat
e pe
r 100
,000
per
sons
el
igib
le fo
r lab
or
Knox County Bordering Counties Similar Counties Statewide

62
Table 39 Unemployment Rates: Overall Findings
Change from 1990 to 2000
Significant Increase No Significant Change Significant Decrease Knox County X Bordering Counties X Similar Counties X Statewide X
Compared to Knox County
Significantly Higher Similar Significantly Lower Bordering Counties X Similar Counties X Statewide X The U.S. Census Bureau collects information on household incomes. This information is then used to calculate estimated median household incomes for states and counties across the United States. The U.S. Census Bureau estimated median household incomes for 1993, 1995, 1997, and 1998. Because the data were limited to these years, the statistical process was not adopted for the median household income data. Instead, confidence intervals calculated by the U.S. Census Bureau were used to determine if statistical differences existed between Knox County, the median household income statewide, and the median household incomes for each of the bordering and similar counties.
Table 40 Estimated Median Household Income, 1993, 1995, 1997, and 1998
County 1993 1995 1997 1998
Knox $28,688 $30,938 $33,536 $34,382 Bordering Counties
Fulton $25,727 $28,204 $30,723 $32,316 Henry $31,095 $34,947 $38,644 $39,730 Mercer $31,321 $34,007 $38,584 $40,244 Peoria $32,487 $36,596 $39,579 $40,569 Stark $29,369 $31,795 $35,747 $36,423 Warren $27,453 $28,810 $31,412 $32,636
Similar Counties LaSalle $31,479 $34,649 $37,439 $38,933 Morgan $30,959 $32,962 $36,018 $36,838 Stephenson $32,591 $35,250 $38,935 $41,247 Vermilion $27,851 $29,542 $31,903 $33,216 Whiteside $31,339 $33,807 $37,453 $38,789
Statewide $33,592 $38,078 $41,179 $43,141
Source: U.S. Census Bureau
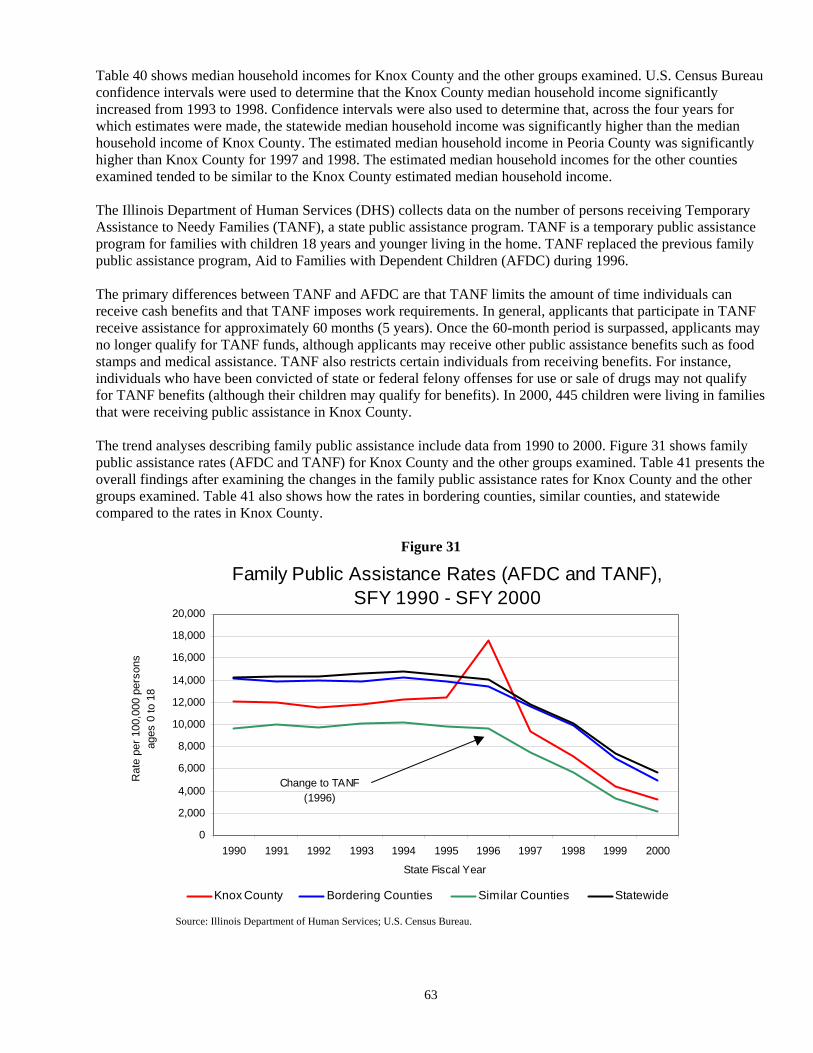
63
Table 40 shows median household incomes for Knox County and the other groups examined. U.S. Census Bureau confidence intervals were used to determine that the Knox County median household income significantly increased from 1993 to 1998. Confidence intervals were also used to determine that, across the four years for which estimates were made, the statewide median household income was significantly higher than the median household income of Knox County. The estimated median household income in Peoria County was significantly higher than Knox County for 1997 and 1998. The estimated median household incomes for the other counties examined tended to be similar to the Knox County estimated median household income. The Illinois Department of Human Services (DHS) collects data on the number of persons receiving Temporary Assistance to Needy Families (TANF), a state public assistance program. TANF is a temporary public assistance program for families with children 18 years and younger living in the home. TANF replaced the previous family public assistance program, Aid to Families with Dependent Children (AFDC) during 1996. The primary differences between TANF and AFDC are that TANF limits the amount of time individuals can receive cash benefits and that TANF imposes work requirements. In general, applicants that participate in TANF receive assistance for approximately 60 months (5 years). Once the 60-month period is surpassed, applicants may no longer qualify for TANF funds, although applicants may receive other public assistance benefits such as food stamps and medical assistance. TANF also restricts certain individuals from receiving benefits. For instance, individuals who have been convicted of state or federal felony offenses for use or sale of drugs may not qualify for TANF benefits (although their children may qualify for benefits). In 2000, 445 children were living in families that were receiving public assistance in Knox County. The trend analyses describing family public assistance include data from 1990 to 2000. Figure 31 shows family public assistance rates (AFDC and TANF) for Knox County and the other groups examined. Table 41 presents the overall findings after examining the changes in the family public assistance rates for Knox County and the other groups examined. Table 41 also shows how the rates in bordering counties, similar counties, and statewide compared to the rates in Knox County.
Figure 31
Source: Illinois Department of Human Services; U.S. Census Bureau.
Family Public Assistance Rates (AFDC and TANF), SFY 1990 - SFY 2000
0
2,000
4,000
6,000
8,000
10,000
12,000
14,000
16,000
18,000
20,000
1990 1991 1992 1993 1994 1995 1996 1997 1998 1999 2000
State Fiscal Year
Rat
e pe
r 100
,000
per
sons
ages
0 to
18
Knox County Bordering Counties Similar Counties Statewide
Change to TANF(1996)

64
Table 41 Family Public Assistance Rates: Overall Findings
Change from 1990 to 2000
Significant Increase No Significant Change Significant Decrease Knox County X Bordering Counties X Similar Counties X Statewide X
Compared to Knox County
Significantly Higher Similar Significantly Lower Bordering Counties X Similar Counties X Statewide X Drug Availability
Table 17 shows that past research have indicated that there is a moderate amount of evidence linking drug availability to juvenile delinquency. The profile examines two data points that indirectly measure drug availability in neighborhoods: reported drug arrests to the Illinois State Police (ISP) and drug submissions to the Illinois State Police Crime Labs. Table 18 shows that, at the county level in Illinois, these two measures were significantly correlated with post-adjudicatory detentions and with end-of-year active probation caseloads. This may suggest that minors living in communities in which drug crimes are more prevalent are more likely to commit crimes serious enough to warrant detention or probation.
Law enforcement agencies across the state report aggregate drug arrest numbers to ISP as part of the Illinois Uniform Crime Reporting (I-UCR) program. The data submitted to ISP represents the number of persons arrested for violations of Illinois’ drug laws, including violations of the Cannabis Control Act, Controlled Substances Act, Hypodermic Syringes and Needles Act, and Drug Paraphernalia Control Act. A majority of the drug arrests in Illinois are for violations of either the Cannabis Control Act (720 ILCS 550), which prohibits the possession, sale and cultivation of marijuana, or the Controlled Substances Act (720 ILCS 570), which prohibits the possession, sale, distribution or manufacture of all other illegal drugs, such as cocaine and opiates. Arrests for violations of the Hypodermic Syringes and Needles Act (720 ILCS 630), which prohibits the possession or sale of hypodermic instruments, and the Drug Paraphernalia Control Act (720 ILCS 600), which prohibits the possession, sale or delivery of drug paraphernalia, are more infrequent.
The trend analyses describing drug arrests include data from 1990 to 2000. Figure 32 shows the total drug arrest rate (which includes arrests for violations of all four drug laws) for Knox County and the other groups examined. Table 42 presents the overall findings after examining the changes in the total drug arrest rates for Knox County and the other groups examined. Table 42 also shows how the rates in bordering counties, similar counties, and statewide compared to the rates in Knox County.

65
Figure 32
Table 42 Total Drug Arrest Rates: Overall Findings
Change from 1990 to 2000
Significant Increase No Significant Change Significant Decrease Knox County X Bordering Counties X Similar Counties X Statewide X
Compared to Knox County
Significantly Higher Similar Significantly Lower Bordering Counties -- -- -- Similar Counties X Statewide X Note:
• The differences or similarities between the total drug arrest rate for Knox County and the rate in bordering counties was not straightforward. In general, the total drug arrest rates in bordering counties were comparable to or significantly lower than the rate in Knox County.
Rates were calculated using ICJIA population estimates. Source: Illinois State Police; U.S. Census Bureau.
Total Drug Arrest Rates,1990-2000
0
100
200
300
400
500
600
700
800
900
1,000
1990 1991 1992 1993 1994 1995 1996 1997 1998 1999 2000
Calendar Year
Rat
e pe
r 100
,000
per
sons
Knox County Bordering Counties Similar Counties Statewide

66
Most drug arrests are made for violations of either the Cannabis Control Act or the Controlled Substances Act. Between 1990 and 2000, violations of the Controlled Substances Act accounted for almost half of drug arrests in Knox County (47 percent). Figure 33 shows the percent of Cannabis Control Act and Controlled Substance Act violations, combined, accounted for by Controlled Substance Act violations. Table 43 presents the overall findings after examining the changes in the percent of arrests accounted for by violations of the Controlled Substances Act for Knox County and the other groups examined. Table 43 also shows how the percentages in bordering counties, similar counties, and statewide compared to the percentages in Knox County.
Figure 33
Table 43
Percent of Drug Arrests accounted for by Violations of the Controlled Substances Act: Overall Findings
Change from 1990 to 2000
Significant Increase No Significant Change Significant Decrease Knox County X Bordering Counties X Similar Counties X Statewide X
Compared to Knox County
Significantly Higher Similar Significantly Lower Bordering Counties X Similar Counties X Statewide X
a. This graph reflects the percent of arrests for violations of the Controlled Substances Act out of the total number of arrests made for violations of the Controlled Substances Act and Cannabis Control Act, combined. Source: Illinois State Police; U.S. Census Bureau.
Percent of Drug Arrests Accounted for by Violations of the Controlled Substances Act, 1990-2000a
0%
10%
20%
30%
40%
50%
60%
70%
80%
1990 1991 1992 1993 1994 1995 1996 1997 1998 1999 2000Calendar Year
Per
cent
Con
trolle
d S
ubst
ance
s
Knox County Bordering Counties Similar Counties Statewide
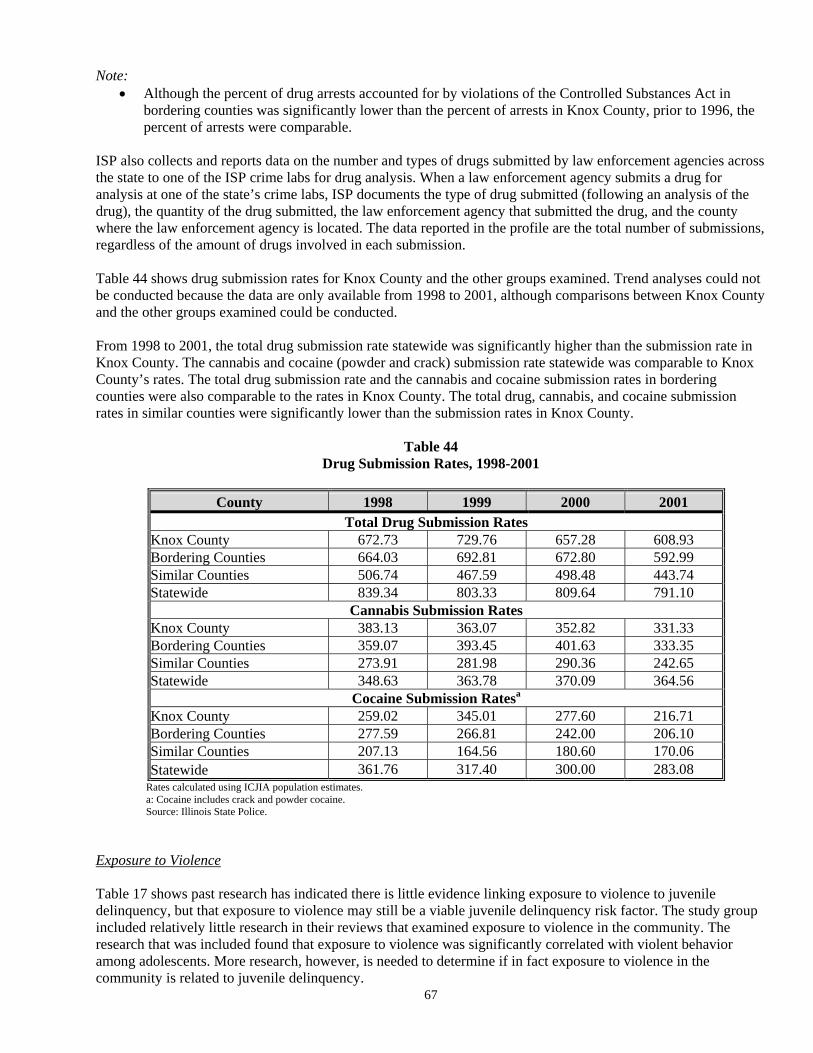
67
Note: • Although the percent of drug arrests accounted for by violations of the Controlled Substances Act in
bordering counties was significantly lower than the percent of arrests in Knox County, prior to 1996, the percent of arrests were comparable.
ISP also collects and reports data on the number and types of drugs submitted by law enforcement agencies across the state to one of the ISP crime labs for drug analysis. When a law enforcement agency submits a drug for analysis at one of the state’s crime labs, ISP documents the type of drug submitted (following an analysis of the drug), the quantity of the drug submitted, the law enforcement agency that submitted the drug, and the county where the law enforcement agency is located. The data reported in the profile are the total number of submissions, regardless of the amount of drugs involved in each submission.
Table 44 shows drug submission rates for Knox County and the other groups examined. Trend analyses could not be conducted because the data are only available from 1998 to 2001, although comparisons between Knox County and the other groups examined could be conducted. From 1998 to 2001, the total drug submission rate statewide was significantly higher than the submission rate in Knox County. The cannabis and cocaine (powder and crack) submission rate statewide was comparable to Knox County’s rates. The total drug submission rate and the cannabis and cocaine submission rates in bordering counties were also comparable to the rates in Knox County. The total drug, cannabis, and cocaine submission rates in similar counties were significantly lower than the submission rates in Knox County.
Table 44 Drug Submission Rates, 1998-2001
County 1998 1999 2000 2001
Total Drug Submission Rates Knox County 672.73 729.76 657.28 608.93 Bordering Counties 664.03 692.81 672.80 592.99 Similar Counties 506.74 467.59 498.48 443.74 Statewide 839.34 803.33 809.64 791.10
Cannabis Submission Rates Knox County 383.13 363.07 352.82 331.33 Bordering Counties 359.07 393.45 401.63 333.35 Similar Counties 273.91 281.98 290.36 242.65 Statewide 348.63 363.78 370.09 364.56
Cocaine Submission Ratesa
Knox County 259.02 345.01 277.60 216.71 Bordering Counties 277.59 266.81 242.00 206.10 Similar Counties 207.13 164.56 180.60 170.06 Statewide 361.76 317.40 300.00 283.08
Rates calculated using ICJIA population estimates. a: Cocaine includes crack and powder cocaine. Source: Illinois State Police.
Exposure to Violence
Table 17 shows past research has indicated there is little evidence linking exposure to violence to juvenile delinquency, but that exposure to violence may still be a viable juvenile delinquency risk factor. The study group included relatively little research in their reviews that examined exposure to violence in the community. The research that was included found that exposure to violence was significantly correlated with violent behavior among adolescents. More research, however, is needed to determine if in fact exposure to violence in the community is related to juvenile delinquency.
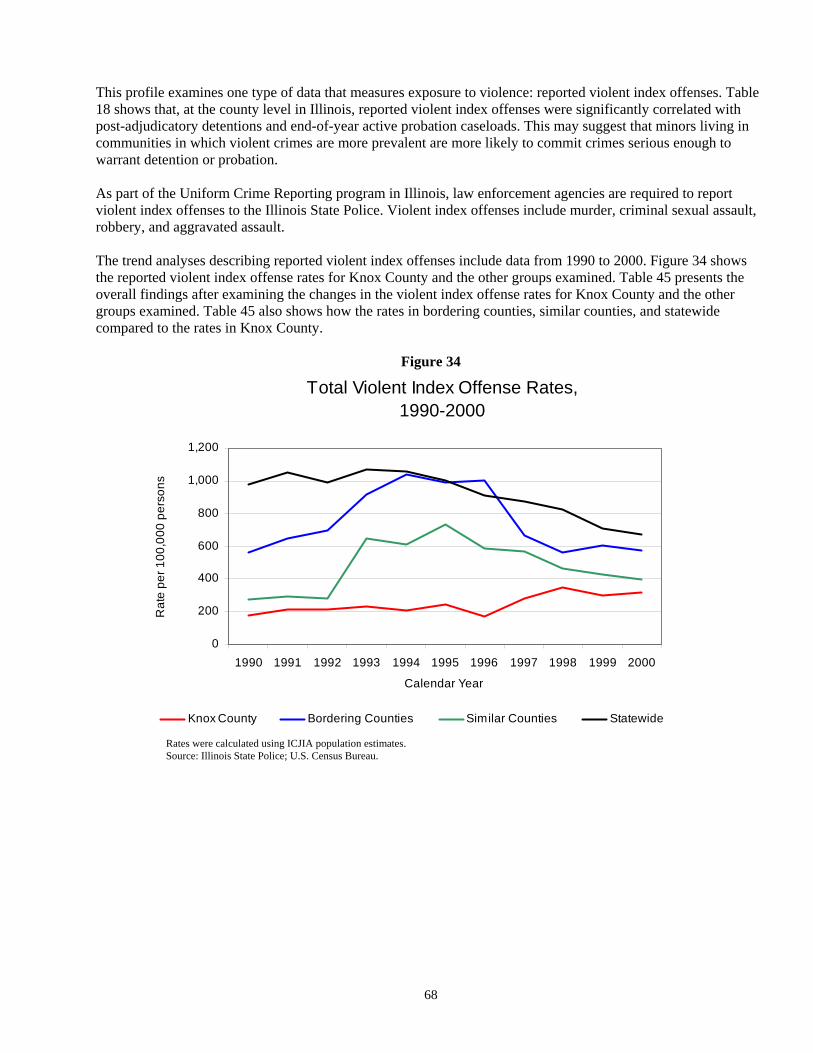
68
This profile examines one type of data that measures exposure to violence: reported violent index offenses. Table 18 shows that, at the county level in Illinois, reported violent index offenses were significantly correlated with post-adjudicatory detentions and end-of-year active probation caseloads. This may suggest that minors living in communities in which violent crimes are more prevalent are more likely to commit crimes serious enough to warrant detention or probation.
As part of the Uniform Crime Reporting program in Illinois, law enforcement agencies are required to report violent index offenses to the Illinois State Police. Violent index offenses include murder, criminal sexual assault, robbery, and aggravated assault.
The trend analyses describing reported violent index offenses include data from 1990 to 2000. Figure 34 shows the reported violent index offense rates for Knox County and the other groups examined. Table 45 presents the overall findings after examining the changes in the violent index offense rates for Knox County and the other groups examined. Table 45 also shows how the rates in bordering counties, similar counties, and statewide compared to the rates in Knox County.
Figure 34
Rates were calculated using ICJIA population estimates. Source: Illinois State Police; U.S. Census Bureau.
Total Violent Index Offense Rates, 1990-2000
0
200
400
600
800
1,000
1,200
1990 1991 1992 1993 1994 1995 1996 1997 1998 1999 2000
Calendar Year
Rat
e pe
r 100
,000
per
sons
Knox County Bordering Counties Similar Counties Statewide
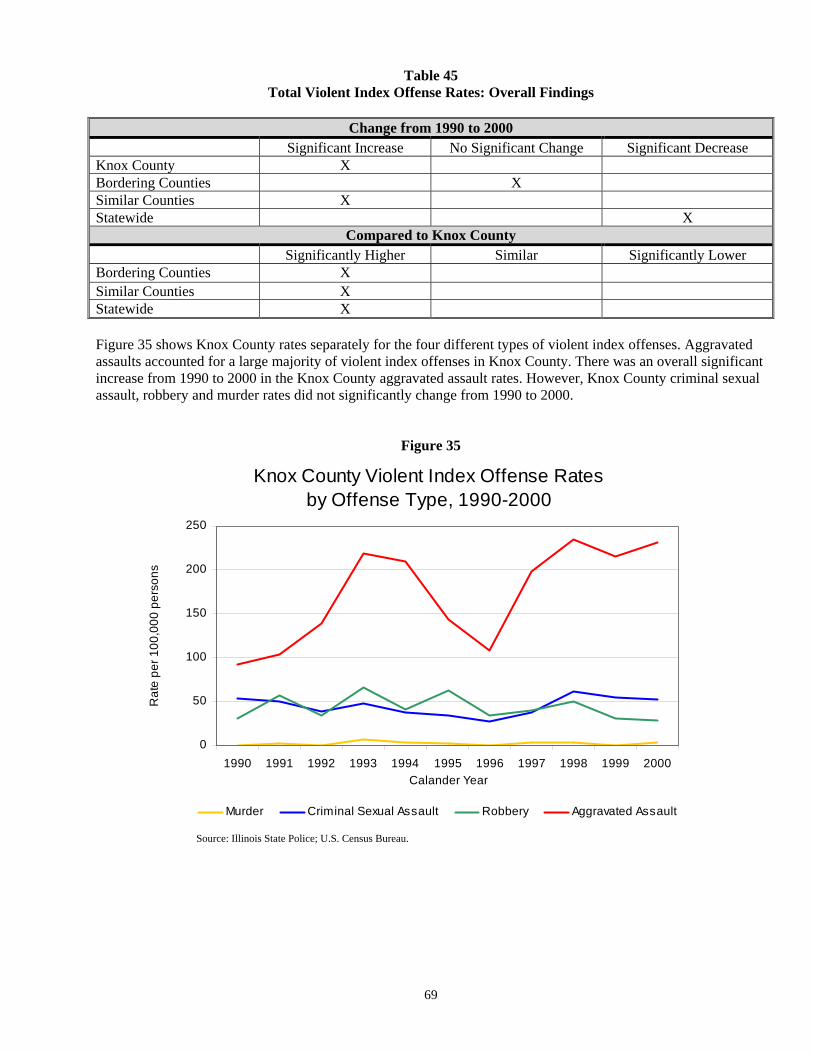
69
Table 45 Total Violent Index Offense Rates: Overall Findings
Change from 1990 to 2000
Significant Increase No Significant Change Significant Decrease Knox County X Bordering Counties X Similar Counties X Statewide X
Compared to Knox County
Significantly Higher Similar Significantly Lower Bordering Counties X Similar Counties X Statewide X Figure 35 shows Knox County rates separately for the four different types of violent index offenses. Aggravated assaults accounted for a large majority of violent index offenses in Knox County. There was an overall significant increase from 1990 to 2000 in the Knox County aggravated assault rates. However, Knox County criminal sexual assault, robbery and murder rates did not significantly change from 1990 to 2000.
Figure 35
Source: Illinois State Police; U.S. Census Bureau.
Knox County Violent Index Offense Rates by Offense Type, 1990-2000
0
50
100
150
200
250
1990 1991 1992 1993 1994 1995 1996 1997 1998 1999 2000Calander Year
Rat
e pe
r 100
,000
per
sons
Murder Criminal Sexual Assault Robbery Aggravated Assault

70
Racial Composition
Although there is evidence indicating that race/ethnicity is related to juvenile delinquency, this evidence tends to suggest this relationship may be due to the high correlation between race/ethnicity and other environmental factors (socio-economic factors, poverty). For instance, areas with high concentrations of poverty also tend to have high concentrations of minorities. Thus, as Table 17 indicates, race/ethnicity is described in the profile as an environmental factor. Table 18 shows, at the county level in Illinois, racial composition is significantly correlated with post-adjudicatory detentions.
The U.S. Census Bureau collects, calculates, and reports data on race and ethnicity for every county in Illinois and statewide. The U.S. Census Bureau estimates populations in various racial and ethnic groups.
The trend analyses describing racial composition include data from 1990 to 1999. Figure 36 shows the percent of the population that is accounted for by minorities in Knox County and the other groups examined. Table 46 presents the overall findings after examining the changes in the percentages of the population that is accounted for by minorities for Knox County and the other groups examined. Table 46 also shows how the percentages in bordering counties, similar counties, and statewide compared to the percentages in Knox County.
Figure 36
Source: U.S. Census Bureau.
Percent of the Population Accounted for by Minorities, 1990-1999
0%
5%
10%
15%
20%
25%
30%
35%
1990 1991 1992 1993 1994 1995 1996 1997 1998 1999
Calendar Year
Per
cent
Min
ority
Knox County Bordering Counties Similar Counties Statewide

71
Table 46 Percent of the Population Accounted for by Minorities: Overall Findings
Change from 1990 to 1999
Significant Increase No Significant Change Significant Decrease Knox County X Bordering Counties X Similar Counties X Statewide X
Compared to Knox County
Significantly Higher Similar Significantly Lower Bordering Counties X Similar Counties X Statewide X
Female Youth Pregnancy
Although the study group did not examine the relationship between births by females ages 10 to 17 years and juvenile delinquency, births by females ages 10 to 17 years are included in the profile because it may be a type of data that is related to other risk factors. As noted in Appendix D, births to females ages 10 to 17 years was correlated with a number of environmental factors. Research has also found that females who have children during adolescence may experience other negative outcomes, including financial difficulties and social and other health-related problems (Maynard and Garry, 1997). Table 18 shows that births by females ages 10 to 17 years were significantly correlated with three of the four juvenile justice system data elements (delinquency filings, delinquency adjudications, and probation caseloads). Pregnancy may place females going through the juvenile justice system at an even greater disadvantage than their counterparts because they exhibit behavior that may be considered deviant in the eyes of juvenile justice practitioners (e.g., early sexual behavior). Although teen birth is generally described in terms of the pregnant females, studies on teenage fatherhood have found that fathering children may be correlated with subsequent delinquency (Thornberry, Wei, Stouthamer-Loeber and Van Dyke, 2000). While this section only discusses births by minors in terms of female parenthood (data were not available on teen fatherhood), parenthood may also impact male teenagers. The Illinois Department of Public Health (IDPH) collects data on the number of births by females ages 10 to 17 years. The trend analyses describing births by females ages 10 to 17 years include data from 1993 to 2000. From 1993 to 2000, 248 females ages 10 to 17 years gave birth in Knox County. Figure 37 shows birth rates by females ages 10 to 17 years for Knox County and the other groups examined. Table 47 presents the overall findings after examining the changes in the birth rates by females ages 10 to 17 years for Knox County and the other groups examined. Table 47 also shows how the rates in bordering counties, similar counties, and statewide compared to the rates in Knox County.
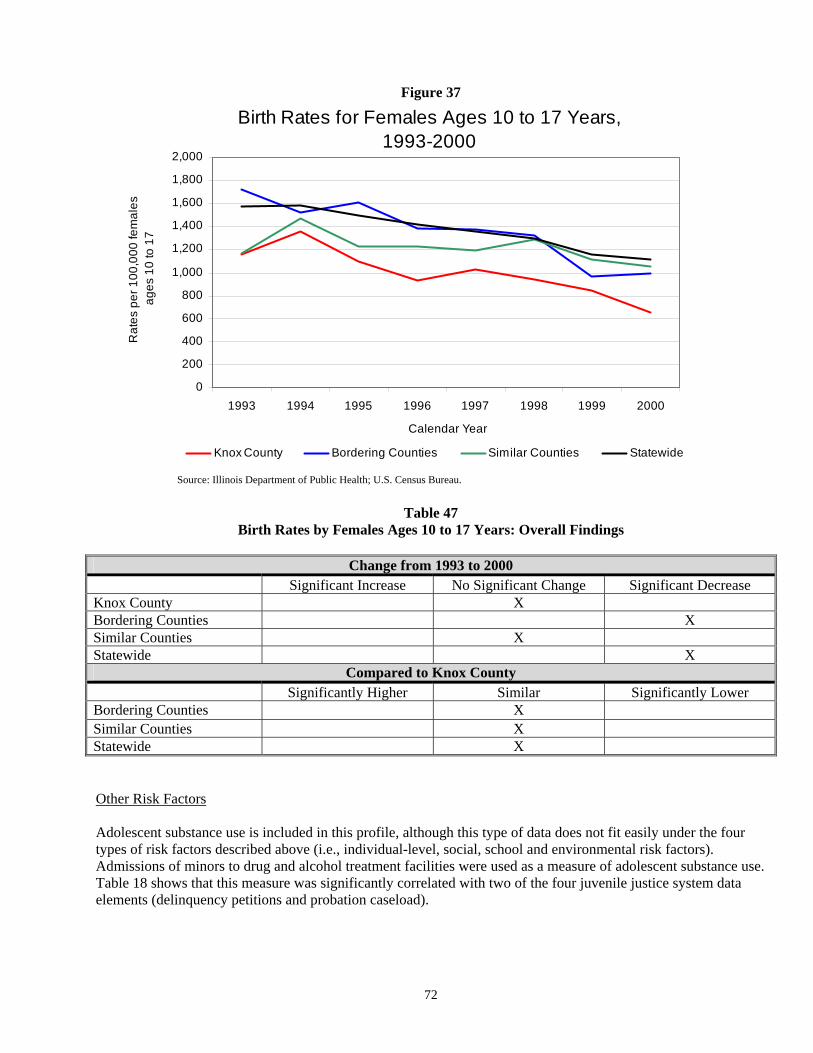
72
Figure 37
Table 47
Birth Rates by Females Ages 10 to 17 Years: Overall Findings
Change from 1993 to 2000 Significant Increase No Significant Change Significant Decrease Knox County X Bordering Counties X Similar Counties X Statewide X
Compared to Knox County
Significantly Higher Similar Significantly Lower Bordering Counties X Similar Counties X Statewide X Other Risk Factors
Adolescent substance use is included in this profile, although this type of data does not fit easily under the four types of risk factors described above (i.e., individual-level, social, school and environmental risk factors). Admissions of minors to drug and alcohol treatment facilities were used as a measure of adolescent substance use. Table 18 shows that this measure was significantly correlated with two of the four juvenile justice system data elements (delinquency petitions and probation caseload).
Source: Illinois Department of Public Health; U.S. Census Bureau.
Birth Rates for Females Ages 10 to 17 Years,1993-2000
0
200
400
600
800
1,000
1,200
1,400
1,600
1,800
2,000
1993 1994 1995 1996 1997 1998 1999 2000
Calendar Year
Rat
es p
er 1
00,0
00 fe
mal
es
ages
10
to 1
7
Knox County Bordering Counties Similar Counties Statewide

73
The Office of Alcoholism and Substance Abuse (OASA), a department overseen by the Illinois Department of Human Services (DHS), collects information from OASA-funded substance abuse treatment providers on the clients they serve, using the Department’s Automated Reporting and Tracking System (DARTS). DARTS data were used to examine adolescent substance use.
The trend analyses describing admissions of minors to drug and alcohol treatment facilities include data from 1994 to 2001. The rates pertain to minors ages 10 to 16 years and, in addition to including admissions to OASA-funded facilities for drug and alcohol treatment, also include admissions for nicotine use. Figure 38 shows the adolescent drug treatment admission rates for Knox County and the other groups examined. Table 48 presents the overall findings after examining the changes in the adolescent drug treatment admission rates for Knox County and the other groups examined. Table 48 also shows how the rates in bordering counties, similar counties, and statewide compared to the rates in Knox County.
Figure 38
Table 48
Adolescent Drug and Alcohol Treatment Admission Rates: Overall Findings
Change from 1994 to 2001 Significant Increase No Significant Change Significant Decrease Knox County X Bordering Counties X Similar Counties X Statewide X
Compared to Knox County
Significantly Higher Similar Significantly Lower Bordering Counties X Similar Counties X Statewide X
Source: Illinois Department of Human Services, Office of Alcohol and Substance Abuse; U.S. Census Bureau.
Adolescent Drug and Alcohol Treatment Admission Rates, 1994-2001
0
100
200
300
400
500
600
700
800
900
1,000
1994 1995 1996 1997 1998 1999 2000 2001Calendar Year
Rat
e pe
r 100
,000
per
sons
age
s10
to 1
6
Knox County Bordering Counties Similar Counties Statewide

74
From 1994 to 2001, 309 treatment services were provided to 267 adolescent clients in Knox County. Figure 39 shows the percent of Knox County services from 1994 to 2001 to minors ages 10 to 16 years for alcohol, marijuana, and other types of drugs. Other primary substances of abuse include, but are not limited to, nicotine, heroin, cocaine, PCP, inhalants, methamphetamine, barbiturates, and hallucinogens. Figure 39 shows the primary substance of abuse precipitating the service, although individuals may be admitted and receive treatment for more than one type of substance.
Approximately 98 percent of all the treatment services provided to Knox County minors ages 10 to 16 years were for marijuana or alcohol. Services provided to clients who received treatment for other primary substances abused accounted for another 2 percent of all services from 1994 to 2001.
Figure 39
Conclusion This section highlights some of the more noteworthy patterns found across all of the risk factors examined. To identify these patterns, two different tables were developed to aid interpretation. Table 49 shows the overall differences and similarities between Knox County and the other groups examined for each risk factor analyzed. Table 50 shows the overall changes in Knox County for each risk factor. For Table 49, the rates for Knox County were compared to the rates of the other groups examined for most of the risk factors analyzed. However, for four variables (domestic migration, persons living in poverty, minors living in poverty, and median household income) comparisons were based on either raw numbers (domestic migration and median household income) or percentages (persons living in poverty and minors living in poverty). There were several instances, however, when it was not possible to conclude that the rates for the other groups examined were clearly higher, similar or lower than the rates in Knox County. In such instances, the symbol “- -” was placed in the table to indicate that no clear determination of higher, similar, or lower could be made.
Source: Illinois Department of Human Services, Office of Alcohol and Substance Abuse.
Percent of Services Provided to Adolescent Clients Living in Knox County
by Primary Substance Abused, 1994-2001
Marijuana63%
Other2%
Alcohol35%

75
Table 50 shows the overall changes in Knox County for each risk factor examined. To determine if there was a significant increase or decrease or if no significant change occurred, the rates for the first year examined were compared to the rates of the last year examined (e.g., 1990 and 2000). The same statistical procedure mentioned above was then used to determine if there was a significant difference between the rates of the first year (e.g., 1990) and the rates of the second year (e.g., 2000). In several instances, however, it could not be determined if there were significant differences between the years examined. The variables for which changes could not be determined include suicide admissions, standardized test scores, domestic offenses, and drug submissions. Below are some of the patterns found:
• For every school risk factor examined for which it was possible to make comparisons (truancy rates,
suspension rates, expulsion rates, high school dropout rates), Knox County rates were either similar to or lower than the other groups examined. Similarly, suspension rates, expulsion rates, and dropout rates in Knox County did not significantly increase or decrease from the 1990/91 school year to the 2000/01 school year, although there was some fluctuation throughout the 1990’s.
• Truancy rates increased in Knox County during the time period examined. However, truancy rates also
increased in bordering counties, similar counties, and statewide.
• Knox County reported child abuse and neglect rates increased during the time period examined. Knox County reported child abuse and neglect rates were, overall, higher than reported child abuse and neglect rates in bordering counties and statewide.
• Knox County drug arrest rates and violent offense rates increased during the time period examined. Knox
County drug arrest rates and drug submission rates were higher than rates in similar counties during the time period examined. However, Knox County drug arrest rates and drug submission rates were lower than statewide rates.
• Paradoxically, Knox County domestic offense rates were lower than rates in the other groups examined
(bordering counties, similar counties, and statewide), while Knox County order of protection rates were higher than similar county and statewide rates. This contradiction may speak to the quality of the data.
• Notable percentages of drug arrests in Knox County from 1990 to 2000 (on average, 47 percent of drug
arrests (adult and juvenile, combined) were for violations of the Control Substances Act, or for non-cannabis related offenses. However, an extremely small percentage of OASA funded services to Knox County youths from 1994-2001 were for non-cannabis related drug problems.

76
Table 49 Overall Differences and Similarities between Knox County and the Bordering Counties, Similar Counties
and Statewide for each Risk Factor Examined
Risk Factor
Bordering Counties
Similar Counties Statewide
Individual Risk Factor Suicide Admissions Similar Similar Similar
Social Risk Factors Drug/Alcohol Treatment—Mothers Similar Similar Similar Inmates with Children Similar Similar Higher Orders of Protection -- Lower Lower Domestic Offense Higher Higher Higher Child Abuse and Neglect Lower Similar Lower Child Sexual Abuse Similar Similar Lower Divorce and Annulments Similar Similar Lower Domestic Migrationa -- -- --
School Risk Factors Standardized Test Scores -- -- -- Truancy Higher -- -- Suspensions Higher Similar Similar Expulsions Higher Similar Similar High School Dropouts Similar Similar Similar
Environmental Risk Factors Persons Living in Poverty Similar Similar Similar Minors Living in Poverty Similar Similar Similar Unemployment Similar Higher Similar Median Household Income Similar Similar Higher Public Assistance Higher Lower Higher Drug Arrests -- Lower Higher Drug Submissions Similar Lower Higher Violent Offenses Higher Higher Higher Minority Residents Lower Lower Higher Births to Females Ages 10 to 17 years Similar Similar Similar
Other Risk Factor Adolescent Drug/Alcohol Treatment Similar Similar Similar
a: The term higher is used to indicate in-migration or less out-migration as compared to Knox County, while the term lower is used to indicate more out-migration as compared to Knox County.

77
Table 50 Overall Changes in Knox County for each Risk Factor Examined
Risk Factor Increase No Change Decrease
Individual Risk Factor Suicide Admissions* -- -- --
Social Risk Factors Drug/Alcohol Treatment—Mothers X Inmates with Children X Orders of Protection X Domestic Offense -- -- -- Child Abuse and Neglect X Child Sexual Abuse X Divorce and Annulments X Domestic Migration X
School Risk Factors Standardized Test Scores* -- -- -- Truancy X Suspensions X Expulsions X High School Dropouts X
Environmental Risk Factors Persons Living in Poverty X Minors Living in Poverty X Unemployment X Median Household Income X Public Assistance X Drug Arrests X Drug Submissions* -- -- -- Violent Offenses X Minority Residents X Births to Females Ages 10 to 17 years X
Other Risk Factor Adolescent Drug/Alcohol Treatment X
* Changes across years were not examined because these data were only available for less than five years.

78
IV. COMMUNITY-BASED PROGRAMS
The following section is a list of service programs serving youth in Knox County. This list is based on surveys of community-based service providers and an Internet search for programs that serve youth in Knox County or are located in Knox County. This list is not exhaustive. Each entry below provides the program name, contact information, counties served, and program description where available. The information provided below is not intended as an endorsement of the programs. Name of Program: Big Brothers Big Sisters of Knox County Contact Information: 309-344-2552 Counties served by program: Knox Program Description/Programs Available: Provides one-to-one mentoring for at-risk children, ages five to fourteen, who reside in single parent homes in Knox County. Name of Program: Bridgeway Contact Information: 2323 Windish Drive Galesburg, IL 61401-9780 309-344-2323 Counties served by program: Knox Program Description/Programs Available: The Youth Services Program is a twenty-four hour crisis intervention and follow-up service to youth and families in conflict over runaway behavior. Name of Program: Camp Kidz Contact Information: 309-344-2600 Counties served by program: Knox Program Description/Programs Available: An eight week summer day camp organized for all area children with disabilities, ages five through twenty-one.
79
Name of Program: Carver Community Action Center Contact Information: 235 East Main Street Galesburg, IL 61401-4708 309-342-0158 Counties served by program: Knox Program Description/Programs Available: The Summer Food and Recreation Program serves youth ages 4 – 17. Programs include swimming, skating, bowling, fishing and a variety of other recreational events and field trips. The Tutoring Program utilizes volunteers who provide individualized tutoring in all subject areas for Knox County students. The Social Recreational Program provides social and recreational activities for the youth of Knox County. Name of Program: Headstart Contact Information: 309-734-3151 Counties served by program: Knox Program Description/Programs Available: Comprehensive, family focused child development programs including education, health, nutrition, mental health, social and disabilities services. Name of Program: Initiative for Girls Contact Information: 309-343-6162 Counties served by program: Knox Program Description/Programs Available: Weekly program designed for youth ages eleven to seventeen, which promotes health, safety, leadership development and peer education. Name of Program: Knox County Area Project Contact Information: 3053 Grand Avenue Galesburg, IL 61401-6617 309-343-4127 Counties served by program: Knox Program Description/Programs Available: Youth activities and programs providing water safety lessons, gardening projects and tutoring services. Includes a program that teaches children rules and procedures about being alone at home.

80
Name of Program: Lutheran Social Services of Illinois Contact Information: 427 East Fremont Street, Suite B Galesburg, IL 61401 309-343-6362 Counties served by program: Knox Program Description/Programs Available: General counseling services: youth services; foster care services; school-based services; mental health services; substance abuse services; foster care services; prisoner and family ministry; child and adolescent residential services. Name of Program: Mississippi Valley Girl Scouts Contact Information: 154 East Simmons Street Galesburg, IL 61401-4607 309-345-0100 Counties served by program: Knox Program Description/Programs Available: Scouting program designed to promote self-esteem, personal growth along with building character and skills for success. Name of Program: Regional Office of Education #26-Hancock/McDonough Contact Information: 130 South Lafayette, Suite 200 Macomb, IL 61455 309-837-4821 Counties served by program: Hancock, McDonough, Cass, Brown, Schuyler, Warren, Henderson, Mercer, Fulton, Knox Program Description/Programs Available: Truancy prevention/intervention, homeless services, educational programs, vocational programs, professional development, education to careers, tech prep, teacher certification, tobacco prevention programs. Name of Program: Safe Harbor Family Crisis Center Contact Information: 1188 West Main Street Galesburg, IL 61401-3465 309-343-7233 Counties served by program: Knox Program Description/Programs Available: Free, confidential services to survivors of family violence and their children. Services include a 24-hour crisis line, court advocacy, individual and group support and referral.

81
Name of Program: T.A.S.C. (Treatment Alternatives for Safe Communities)
Contact Information: 2100 18th Avenue, Suite 5 Rock Island, IL 61201 309-788-0816 Counties served by program: Fulton, Hancock, Henderson, Henry, Knox, McDonough, Mercer, Rock Island, Warren, Whiteside Program Description/Programs Available: TASC has developed a number of intervention and education programs targeted specifically to juveniles in the justice system. These programs are designed for youth who are involved in delinquent activity and who are also abusing drugs or alcohol. Programs include Juvenile Court Services Juvenile, Court Drug Program, State's Attorney's Drug Abuse Program, Evening Reporting Center, On the Books (OTB), which is a program that addresses the behavior of youth who are arrested for possession but do not appear to have substance abuse issues, and the Youth Enrichment Services (YES) Program. Name of Program: Warren Achievement Center Contact Information: 1220 East 2nd Avenue Monmouth, IL 61462-2404 309-734-3131 Counties served by program: Knox Program Description/Programs Available: Early Intervention Program for children ages birth through two years and their families. Free learning enhancement check-ups and testing.
82
V. REFERENCES
Howell, J. (1998). NCCD’s survey of juvenile detention and correctional facilities. Crime and Delinquency, 44 (1), 102-110. Illinois Criminal Justice Information Authority (1996). Assessment of minority representation in 26 Illinois county juvenile justice systems. Chicago, IL: State of Illinois.
Illinois Department of Corrections (2000a). 2000 Five Year Plan for Female Inmates. Springfield, IL: State of Illinois.
Illinois Department of Corrections (2000b). Statistical Summary of the Juvenile Division: FY 95 – FY 99. Springfield, IL: State of Illinois.
Kelly, B., Thornberry, T. & Smith, C. (1997). In the wake of childhood maltreatment. Juvenile Justice Bulletin. (NCJ Publication No. 165257). Washington, D.C.: U.S. Government Printing Office.
Loeber, R. & Farrington, D. (Eds.) (1998). Serious and violent juvenile offenders: Risk factors and successful interventions. Thousand Oaks, CA: Sage Publications.
Maynard, R. & Garry, E. (1997). Adolescent motherhood: Implications for the juvenile justice system. Office of Juvenile Justice and Delinquency Prevention Fact Sheet # 50. Washington, D.C.: U.S. Government Printing Office.
Menard, S. (2002). Short and long-term consequences of adolescent victimization. Youth Research Bulletin. (NCJ Publication No. 191210). Washington, D.C.: U.S. Government Printing Office.
Office of Juvenile Justice and Delinquency Prevention. (1995). Guide for implementing the
comprehensive strategy for serious, violent, and chronic juvenile offenders. (NCJ Publication No. 153681). Washington, D.C.: U.S. Government Printing Office.
Sampson, R. (1998). What “community” supplies. In R. F. Ferguson & W. T. Dickens (Eds.). Urban Problems and Community Development. Washington, D.C.: Brookings Institute Press.
Smith, N. (1998). Measurements and determinants of juvenile detention use in Illinois. Unpublished master’s thesis, Loyola University Chicago, Chicago, IL.
Thornberry, T., Wei, E., Stouthamer-Loeber, & Van Dyke, J. (2000). Teenaged fatherhood and delinquent behavior. Juvenile Justice Bulletin. (NCJ Publication No. 178899). Washington, D.C.: U.S. Government Printing Office.
U.S.Census Bureau (2001). Poverty in the United States:2000. Current Population Reports (Series P60-
214). Washington, D.C.: U.S. Government Printing Office.
U.S. Department of Agriculture (2000). Measuring rurality: What is rural? [On-Line]. Available: http://www.ers.usda.gov/briefing/rurality/WhatisRural/.
83
APPENDIX A County Urban-Rural Designations
In the past, the Authority has compared counties based on their designations as collar, urban, or rural counties. Cook County has traditionally been designated as its own category because of its population size. Collar counties include the five counties (McHenry, Lake, DuPage, Kane, and Will) surrounding Cook County. Urban counties are those counties that lie within a Metropolitan Statistical Area (MSA). The U.S. Census Bureau defines a MSA as an area that has a city of at least 50,000 residents or if it includes an urbanized area of at least 50,000 people within a metropolitan area that has a population of at least 100,000 persons. Counties included in the MSA may also have strong economic or social ties to other counties in the MSA. Although by definition Cook County and collar counties are considered urban counties, the Authority has historically viewed Cook County and collar counties separately from other urban counties. In all, there are 22 urban counties in Illinois (excluding Cook and collar counties). Rural counties are those counties that are not part of a MSA. There are a total of 74 rural counties in Illinois. For this profile, however, the Authority used a different classification scheme to determine “similar” counties. The new classification method was used because it is believed not all urban or rural counties are the same. For instance, as stated by the U.S. Department of Agriculture (2000), some rural counties have very small populations and still depend on farming, mining or other rural industries; these counties may face declining job opportunities and population loss as farms and mines shut down. Other rural counties have much larger populations and are experiencing rapid influxes of population; these counties may struggle to develop additional schools, housing, and roads and to provide additional public services (U.S. Department of Agriculture, 2000). Given such differences, counties, despite similar urban or rural county designations, may face distinct challenges when dealing with and providing services to juvenile offenders. Counties were compared using an 11-category classification scheme. This classification scheme is based on the 1993 Rural-Urban Continuum Codes. The U.S. Department of Agriculture’s Economic Research Service (ERS) developed the Rural-Urban Continuum Codes to measure and evaluate the economic and social diversity of counties and to provide classifications that are meaningful for developing public policies and programs (U.S. Department of Agriculture, 2000). The codes classify counties based on “population size, proximity to a metropolitan area, degree of urbanization, population of the largest city, commuting patterns, as well as primary economic activity and policy relevancy” (U.S. Department of Agriculture, 2000). A more detailed description of ERS’s Rural-Urban Continuum Codes can be found at http://www.ers.usda.gov/briefing/rurality/RuralUrbCon/. Although the Rural-Urban Continuum Codes were primarily developed to classify rural areas, this scheme also distinguishes between urban counties. The Rural-Urban Continuum Codes are listed in the Legend on the inside cover (the Legend corresponds to the map on the front page of the profile). Table A.1 lists each county with their corresponding Rural-Urban Continuum Code and designation based on the collar, urban and rural continuum used in previous profiles (see above). Although the ERS’s Rural-Urban Continuum Codes use a 10-category classification scheme, because Cook County is unique in population size it was designated its own category. This resulted in an 11-category classification scheme.

84
Table A.1 Urban-Rural Continuum and Traditional Classification for Illinois’ 102 Counties
County Urban-Rural Continuum Traditional
Classification ADAMS nonmetro - urban pop 20,000 or more, not adjacent to metro Rural ALEXANDER nonmetro - urban pop 2,500 to 19,999 - not adjacent to metro Rural BOND nonmetro - urban pop 2,500 to 19,999 - adjacent to metro Rural BOONE metro - 250,000 to 1 million pop Urban BROWN nonmetro - <2,500 urban, not adjacent to metro Rural BUREAU nonmetro - urban pop 2,500 to 19,999 - not adjacent to metro Rural CALHOUN nonmetro - <2500 urban, adjacent to metro Rural CARROLL nonmetro - urban pop 2,500 to 19,999 - not adjacent to metro Rural CASS nonmetro - urban pop 2,500 to 19,999 - adjacent to metro Rural CHAMPAIGN metro - less than 250,000 pop Urban CHRISTIAN nonmetro - urban pop 2,500 to 19,999 - adjacent to metro Rural CLARK nonmetro - urban pop 2,500 to 19,999 - adjacent to metro Rural CLAY nonmetro - urban pop 2,500 to 19,999 - not adjacent to metro Rural CLINTON metro - fringe county or 1 million or more Urban COLES nonmetro - urban pop 20,000 or more, not adjacent to metro Rural COOKa metro - central county 1 million or more Cook CRAWFORD nonmetro - urban pop 2,500 to 19,999 - not adjacent to metro Rural CUMBERLAND nonmetro - <2500 urban, not adjacent to metro Rural DEKALB metro - fringe county or 1 million or more Urban DEWITT nonmetro - urban pop 2,500 to 19,999 - adjacent to metro Rural DOUGLAS nonmetro - urban pop 2,500 to 19,999 - adjacent to metro Rural DUPAGE metro - central county 1 million or more Collar EDGAR nonmetro - urban pop 2,500 to 19,999 - adjacent to metro Rural EDWARDS nonmetro - <2500 urban, not adjacent to metro Rural EFFINGHAM nonmetro - urban pop 2,500 to 19,999 - not adjacent to metro Rural FAYETTE nonmetro - urban pop 2,500 to 19,999 - adjacent to metro Rural FORD nonmetro - urban pop 2,500 to 19,999 - adjacent to metro Rural FRANKLIN nonmetro - urban pop 2,500 to 19,999 - not adjacent to metro Rural FULTON nonmetro - urban pop 2,500 to 19,999 - adjacent to metro Rural GALLATIN nonmetro - <2,500 urban, adjacent to metro Rural GREENE nonmetro - urban pop 2,500 to 19,999 - adjacent to metro Rural GRUNDY metro - fringe county or 1 million or more Urban HAMILTON nonmetro - urban pop 2,500 to 19,999 - not adjacent to metro Rural HANCOCK nonmetro - urban pop 2,500 to 19,999 - not adjacent to metro Rural HARDIN nonmetro - <2,500 urban, not adjacent to metro Rural HENDERSON nonmetro - <2,500 urban, not adjacent to metro Rural HENRY metro - 250,000 to 1 million pop Urban IROQUOIS nonmetro - urban pop 2,500 to 19,999 - adjacent to metro Rural JACKSON nonmetro - urban pop 20,000 or more, not adjacent to metro Rural JASPER nonmetro - urban pop 2,500 to 19,999 - not adjacent to metro Rural JEFFERSON nonmetro - urban pop 2,500 to 19,999 - not adjacent to metro Rural JERSEY metro - fringe county or 1 million or more Urban JODAVIESS nonmetro - urban pop 2,500 to 19,999 - adjacent to metro Rural

85
County Urban-Rural Continuum Traditional Classification
JOHNSON nonmetro - <2,500 urban, not adjacent to metro Rural KANE metro – central county 1 million or more Collar KANKAKEE metro - less than 250,000 pop Urban KENDALL metro - fringe county or 1 million or more Urban KNOX nonmetro - urban pop 20,000 or more - adjacent to metro Rural LAKE metro – central county 1 million or more Collar LASALLE nonmetro - urban pop 20,000 or more - adjacent to metro Rural LAWRENCE nonmetro - urban pop 2,500 to 19,999 - not adjacent to metro Rural LEE nonmetro - urban pop 2,500 to 19,999 - not adjacent to metro Rural LIVINGSTON nonmetro - urban pop 2,500 to 19,999 - adjacent to metro Rural LOGAN nonmetro - urban pop 2,500 to 19,999 - adjacent to metro Rural MCDONOUGH nonmetro - urban pop 20,000 or more, not adjacent to metro Rural MCHENRY metro - central county 1 million or more Collar MCLEAN metro - less than 250,000 pop Urban MACON metro - less than 250,000 pop Urban MACOUPIN nonmetro - urban pop 2,500 to 19,999 - adjacent to metro Rural MADISON metro - central county 1 million or more Urban MARION nonmetro - urban pop 2,500 to 19,999 - not adjacent to metro Rural MARSHALL nonmetro - urban pop 2,500 to 19,999 - adjacent to metro Rural MASON nonmetro - urban pop 2,500 to 19,999 - adjacent to metro Rural MASSAC nonmetro - urban pop 2,500 to 19,999 - not adjacent to metro Rural MENARD metro - less than 250,000 pop Urban MERCER nonmetro - urban pop 2,500 to 19,999 - adjacent to metro Rural MONROE metro - fringe county or 1 million or more Urban MONTGOMERY nonmetro - urban pop 2,500 to 19,999 - adjacent to metro Rural MORGAN nonmetro - urban pop 20,000 or more - adjacent to metro Rural MOULTRIE nonmetro - urban pop 2,500 to 19,999 - adjacent to metro Rural OGLE metro - 250,000 to 1 million pop Urban PEORIA metro - 250,000 to 1 million pop Urban PERRY nonmetro - urban pop 2,500 to 19,999 - not adjacent to metro Rural PIATT nonmetro - urban pop 2,500 to 19,999 - adjacent to metro Rural PIKE nonmetro - urban pop 2,500 to 19,999 - not adjacent to metro Rural POPE nonmetro - <2,500 urban, not adjacent to metro Rural PULASKI nonmetro - <2,500 urban, not adjacent to metro Rural PUTNAM nonmetro - <2,500 urban, not adjacent to metro Rural RANDOLPH nonmetro - urban pop 2,500 to 19,999 - adjacent to metro Rural RICHLAND nonmetro - urban pop 2,500 to 19,999 - not adjacent to metro Rural ROCK ISLAND metro - 250,000 to 1 million pop Urban ST CLAIR metro - central county 1 million or more Urban SALINE nonmetro - urban pop 2,500 to 19,999 - not adjacent to metro Rural SANGAMON metro - less than 250,000 pop Urban SCHUYLER nonmetro - urban pop 2,500 to 19,999 - not adjacent to metro Rural SCOTT nonmetro - <2,500 urban, not adjacent to metro Rural SHELBY nonmetro - urban pop 2,500 to 19,999 - adjacent to metro Rural STARK nonmetro - <2,500 urban, adjacent to metro Rural STEPHENSON nonmetro - urban pop 20,000 or more - adjacent to metro Rural
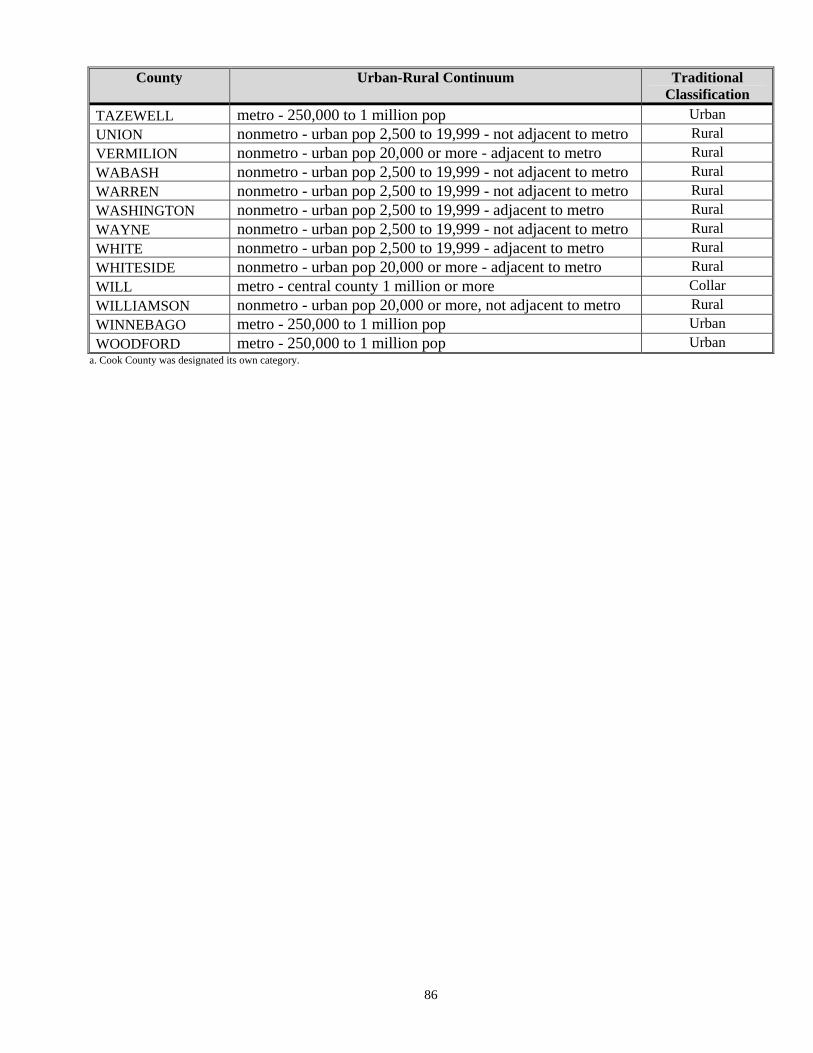
86
County Urban-Rural Continuum Traditional Classification
TAZEWELL metro - 250,000 to 1 million pop Urban UNION nonmetro - urban pop 2,500 to 19,999 - not adjacent to metro Rural VERMILION nonmetro - urban pop 20,000 or more - adjacent to metro Rural WABASH nonmetro - urban pop 2,500 to 19,999 - not adjacent to metro Rural WARREN nonmetro - urban pop 2,500 to 19,999 - not adjacent to metro Rural WASHINGTON nonmetro - urban pop 2,500 to 19,999 - adjacent to metro Rural WAYNE nonmetro - urban pop 2,500 to 19,999 - not adjacent to metro Rural WHITE nonmetro - urban pop 2,500 to 19,999 - adjacent to metro Rural WHITESIDE nonmetro - urban pop 20,000 or more - adjacent to metro Rural WILL metro - central county 1 million or more Collar WILLIAMSON nonmetro - urban pop 20,000 or more, not adjacent to metro Rural WINNEBAGO metro - 250,000 to 1 million pop Urban WOODFORD metro - 250,000 to 1 million pop Urban
a. Cook County was designated its own category.

87
APPENDIX B Juvenile Justice System and Risk Factor Rates, 2000
Juvenile Justice System Rates
Delinquency Petitions
Delinquency Adjudications
Informal Supervision
Continued Under
Supervision
Juvenile Probation Caseloads
Juvenile Detention
Admissions Admissions
to IDOC County Rate (Rank) Rate (Rank) Rate (Rank) Rate (Rank) Rate (Rank) Rate (Rank) Rate (Rank)
Adams 1,617 (68) 941 (36) 323 (40) 132 (59) 1,147 (43) 3,793 (5) 520 (25) Alexander 2,678 (32) 2,031 (8) 185 (50) 462 (37) 1,200 (37) 739 (56) 790 (10) Bond 2,724 (29) 1,238 (22) 248 (47) 929 (20) 929 (52) 1,115 (36) 940 (7) Boone 1,542 (74) 2,232 (6) 345 (38) 46 (73) 1,933 (13) 1,358 (28) 597 (21) Brown 1,613 (69) 1,254 (20) 0 0 717 (74) 179 (92) 324 (44) Bureau 2,596 (36) 514 (69) 26 (64) 1,414 (6) 771 (70) 1,671 (23) 532 (23) Calhoun 3,854 (9) 642 (62) 0 (67) 2,784 (1) 642 (79) 428 (80) 727 (13) Carroll 2,011 (55) 1,034 (31) 920 (10) 977 (15) 1,552 (23) 920 (48) 492 (29) Cass 5,337 (1) 4,986 (1) 0 0 1,194 (39) 211 (90) 367 (39) Champaign 1,133 (85) 780 (50) 345 (39) 90 (68) 893 (55) 3,872 (3) 689 (14) Christian 2,406 (43) 962 (35) 0 255 (49) 3,000 (2) 198 (91) 392 (36) Clark 3,380 (16) 1,750 (12) 0 785 (22) 1,750 (17) 0 756 (11) Clay 397 (102) 661 (61) 595 (17) 397 (42) 661 (76) 0 348 (42) Clinton 1,495 (75) 490 (71) 180 (52) 747 (24) 541 (86) 490 (74) 92 (82) Coles 2,775 (28) 0 532 (23) 0 1,480 (26) 1,295 (29) 291 (47) Cook 2,041 (54) 842 (43) 133 (57) 1,119 (12) 971 (48) 1,288 (30) 243 (54) Crawford 4,897 (4) 1,910 (10) 0 979 (14) 2,644 (6) 392 (81) 171 (66) Cumberland 3,893 (8) 0 0 0 649 (78) 649 (61) 421 (35) DeKalb 2,220 (49) 534 (67) 0 1,405 (7) 379 (96) 2,122 (15) 150 (70) DeWitt 1,973 (57) 929 (37) 116 (58) 0 1,335 (30) 1,219 (33) 212 (59) Douglas 1,304 (80) 495 (70) 405 (34) 360 (43) 764 (72) 315 (85) 0 DuPage 1,014 (89) 313 (78) 1 (65) 8 (78) 611 (82) 968 (45) 74 (90) Edgar 3,372 (18) 0 0 0 2,309 (10) 878 (49) 1,200 (4) Edwards 4,735 (5) 975 (34) 279 (42) 975 (16) 1,114 (45) 139 (96) 1,282 (2) Effingham 1,307 (79) 0 0 0 915 (53) 261 (88) 284 (49) Fayette 4,094 (7) 801 (46) 223 (48) 89 (69) 2,003 (12) 490 (75) 77 (87) Ford 2,556 (40) 0 262 (46) 0 1,900 (14) 655 (60) 474 (31) Franklin 1,699 (64) 260 (82) 1,038 (7) 71 (71) 849 (59) 613 (64) 197 (63) Fulton 2,415 (42) 195 (87) 488 (28) 951 (18) 586 (83) 854 (50) 0 Gallatin 1,084 (87) 310 (79) 0 155 (56) 1,858 (15) 155 (95) 259 (51) Greene 702 (97) 0 0 117 (63) 58 (101) 58 (99) 0 Grundy 2,051 (53) 739 (55) 262 (45) 620 (27) 787 (69) 835 (52) 84 (84) Hamilton 906 (94) 0 0 0 906 (54) 453 (76) 193 (64) Hancock 1,672 (65) 792 (47) 1,012 (9) 264 (48) 616 (81) 924 (47) 78 (86) Hardin 3,719 (12) 207 (86) 0 413 (39) 620 (80) 0 0 Henderson 543 (100) 761 (53) 435 (31) 0 1,196 (38) 435 (79) 0 Henry 802 (96) 563 (66) 0 136 (58) 853 (58) 767 (55) 90 (83) Iroquois 2,653 (35) 1,006 (33) 1,067 (6) 213 (55) 1,433 (28) 945 (46) 736 (12) Jackson 1,580 (72) 1,151 (24) 497 (26) 1,128 (11) 767 (71) 609 (66) 120 (77) Jasper 3,288 (21) 722 (56) 1,123 (4) 1,363 (8) 1,123 (44) 160 (94) 143 (71) Jefferson 2,588 (39) 0 0 0 1,172 (40) 3,857 (4) 515 (26) Jersey 1,916 (60) 522 (68) 348 (37) 1,654 (3) 827 (62) 609 (65) 77 (88) JoDaviess 965 (92) 0 746 (13) 0 175 (100) 263 (87) 74 (89) Johnson 2,589 (38) 1,250 (21) 804 (12) 0 1,161 (42) 804 (54) 155 (69) Kane 1,919 (59) 484 (72) 98 (60) 242 (53) 1,082 (47) 1,437 (27) 110 (79) Kankakee 2,664 (34) 1,345 (18) 660 (14) 248 (51) 1,842 (16) 1,602 (25) 578 (22) Kendall 2,158 (51) 578 (65) 0 516 (30) 797 (68) 1,094 (38) 82 (85) Knox 1,585 (71) 1,142 (25) 369 (35) 37 (75) 1,308 (31) 3,114 (7) 254 (52) Lake 1,378 (76) 759 (54) 0 98 (67) 929 (51) 1,149 (35) 231 (55) LaSalle 1,982 (56) 786 (48) 143 (56) 464 (36) 661 (77) 2,179 (11) 427 (33)

88
Delinquency Petitions
Delinquency Adjudications
Informal Supervision
Continued Under
Supervision
Juvenile Probation Caseloads
Juvenile Detention
Admissions Admissions
to IDOC County Rate (Rank) Rate (Rank) Rate (Rank) Rate (Rank) Rate (Rank) Rate (Rank) Rate (Rank)
Lawrence 2,210 (50) 1,072 (28) 1,072 (5) 938 (19) 871 (57) 134 (97) 0 Lee 4,699 (6) 783 (49) 270 (44) 1,566 (5) 1,728 (19) 1,863 (16) 385 (38) Livingston 3,807 (11) 2,329 (5) 851 (11) 250 (50) 2,655 (4) 1,703 (20) 299 (46) Logan 2,595 (37) 1,742 (13) 0 498 (32) 1,635 (22) 2,169 (13) 126 (74) McDonough 1,273 (82) 694 (60) 1,388 (2) 501 (31) 424 (95) 733 (57) 133 (73) McHenry 954 (93) 451 (73) 433 (32) 318 (45) 518 (88) 555 (72) 186 (65) McLean 1,114 (86) 773 (52) 99 (59) 53 (72) 1,683 (20) 1,501 (26) 884 (8) Macon 2,702 (31) 1,469 (17) 92 (61) 571 (29) 1,544 (24) 4,280 (2) 599 (20) Macoupin 1,558 (73) 600 (64) 1,220 (3) 1,351 (9) 826 (63) 600 (67) 228 (56) Madison 3,122 (25) 612 (63) 589 (19) 1,755 (2) 566 (85) 2,669 (9) 170 (67) Marion 3,134 (24) 22 (90) 493 (27) 45 (74) 2,910 (3) 2,149 (14) 513 (27) Marshall 2,296 (47) 215 (84) 359 (36) 646 (26) 430 (93) 574 (71) 0 Mason 1,797 (62) 817 (45) 654 (15) 0 817 (66) 381 (82) 464 (32) Massac 2,722 (30) 886 (41) 506 (25) 759 (23) 1,203 (36) 443 (78) 645 (17) Menard 1,234 (83) 891 (40) 0 411 (40) 960 (50) 617 (63) 120 (75) Mercer 2,077 (52) 1,114 (26) 0 405 (41) 1,165 (41) 1,216 (34) 0 Monroe 1,172 (84) 426 (74) 0 462 (38) 533 (87) 249 (89) 0 Montgomery 1,017 (88) 699 (59) 445 (29) 476 (35) 1,207 (35) 1,112 (37) 222 (58) Morgan 1,000 (90) 706 (58) 1,029 (8) 29 (76) 823 (64) 970 (44) 357 (40) Moultrie 2,285 (48) 1,174 (23) 185 (49) 247 (52) 1,421 (29) 1,791 (17) 421 (34) Ogle 1,832 (61) 0 53 (63) 0 (93) 1,210 (34) 1,690 (21) 249 (53) Peoria 3,332 (20) 1,962 (9) 439 (30) 328 (44) 2,343 (9) 3,459 (6) 496 (28) Perry 1,373 (77) 215 (85) 0 987 (13) 472 (92) 1,030 (43) 522 (24) Piatt 514 (101) 171 (88) 571 (22) 114 (64) 343 (98) 171 (93) 100 (80) Pike 2,677 (33) 892 (39) 0 0 2,510 (7) 446 (77) 688 (15) Pope 3,632 (14) 0 0 0 427 (94) 641 (62) 352 (41) Pulaski 5,208 (2) 2,083 (7) 0 0 2,431 (8) 1,620 (24) 642 (18) Putnam 3,172 (23) 2,671 (3) 1,503 (1) 1,169 (10) 835 (61) 668 (59) 855 (9) Randolph 1,288 (81) 1,024 (32) 0 29 (77) 819 (65) 263 (86) 157 (68) Richland 3,365 (19) 236 (83) 0 118 (62) 885 (56) 590 (70) 209 (60) Rock Island 994 (91) 874 (42) 420 (33) 107 (66) 814 (67) 1,067 (41) 475 (30) St. Clair 2,311 (46) 828 (44) 0 703 (25) 679 (75) 2,802 (8) 330 (43) Saline 3,099 (26) 709 (57) 523 (24) 485 (34) 485 (89) 1,680 (22) 0 Sangamon 637 (99) 390 (75) 184 (51) 111 (65) 374 (97) 1,722 (19) 299 (45) Schuyler 2,881 (27) 1,681 (14) 0 0 720 (73) 600 (68) 0 Scott 2,451 (41) 0 163 (53) 0 0 327 (84) 0 Shelby 647 (98) 324 (76) 0 81 (70) 485 (90) 81 (98) 141 (72) Stark 1,946 (58) 3,293 (2) 150 (55) 299 (46) 1,497 (25) 599 (69) 1,023 (6) Stephenson 3,812 (10) 287 (81) 574 (21) 123 (61) 1,640 (21) 1,742 (18) 1,220 (3) Tazewell 1,636 (66) 778 (51) 596 (16) 487 (33) 1,229 (33) 1,069 (40) 201 (62) Union 2,366 (45) 901 (38) 56 (62) 0 845 (60) 1,239 (32) 96 (81) Vermilion 2,402 (44) 1,280 (19) 0 281 (47) 1,089 (46) 853 (51) 273 (50) Wabash 3,701 (13) 1,057 (30) 0 1,586 (4) 1,737 (18) 378 (83) 1,075 (5) Warren 3,414 (15) 1,583 (15) 594 (18) 594 (28) 1,435 (27) 2,177 (12) 612 (19) Washington 3,253 (22) 2,530 (4) 0 0 964 (49) 1,265 (31) 1,292 (1) Wayne 3,372 (17) 291 (80) 0 872 (21) 581 (84) 814 (53) 201 (61) White 4,910 (3) 1,873 (11) 0 969 (17) 2,649 (5) 2,261 (10) 226 (57) Whiteside 1,592 (70) 1,061 (29) 0 152 (57) 1,304 (32) 1,092 (39) 387 (37) Will 889 (95) 315 (77) 162 (54) 226 (54) 474 (91) 1,051 (42) 120 (76) Williamson 1,326 (78) 1,110 (27) 580 (20) 0 282 (99) 679 (58) 115 (78) Winnebago 1,618 (67) 1,514 (16) 271 (43) 130 (60) 3,077 (1) 5,222 (1) 658 (16) Woodford 1,766 (63) 93 (89) 302 (41) 0 2,068 (11) 534 (73) 285 (48) Statewide 1,874 774 190 653 1,011 1,468 275

89
Risk Factor Rates Emergency
Room Admissionsa
Drug Tx for Females with
Children Inmates with
Children
Orders of Protections with Minors
Domestic Offenses
Reported Child Abuse and Neglect
Reported Child Sexual
Abuse County Rate (Rank) Rate (Rank) Rate (Rank) Rate (Rank) Rate (Rank) Rate (Rank) Rate (Rank)
Adams 58 (5) 42 (92) 207 (3) 231 (65) 934 (16) 4,878 (20) 392 (52) Alexander 0 323 (10) 124 (18) 0 532 (37) 5,035 (17) 704 (7) Bond 0 282 (14) 52 (66) 315 (37) 34 (90) 4,035 (36) 625 (10) Boone 27 (15) 106 (66) 14 (97) 296 (46) 500 (39) 2,368 (86) 341 (65) Brown 0 0 71 (52) 234 (64) 0 4,026 (39) 73 (102) Bureau 0 114 (64) 26 (84) 107 (91) 425 (48) 2,163 (89) 323 (73) Calhoun 0 0 0 162 (84) 0 4,034 (37) 258 (82) Carroll 0 154 (45) 39 (69) 167 (83) 672 (25) 3,949 (42) 751 (5) Cass 29 (10) 216 (25) 149 (10) 254 (61) 153 (79) 3,723 (50) 322 (74) Champaign 11 (42) 183 (38) 134 (15) 210 (71) 1,949 (5) 4,281 (33) 356 (61) Christian 0 24 (99) 105 (28) 587 (9) 311 (60) 3,591 (55) 403 (51) Clark 0 242 (22) 94 (36) 177 (79) 123 (83) 3,665 (53) 244 (86) Clay 0 121 (59) 202 (4) 543 (13) 172 (78) 3,881 (45) 468 (36) Clinton 11 (41) 109 (65) 89 (39) 171 (81) 234 (71) 1,872 (97) 340 (66) Coles 0 336 (9) 93 (37) 287 (49) 568 (33) 5,167 (11) 504 (28) Cook 11 (39) 292 (12) 162 (9) 274 (55) 1,209 (10) 2,803 (79) 224 (90) Crawford 0 185 (35) 25 (87) 433 (19) 1,281 (9) 3,552 (58) 548 (18) Cumberland 0 105 (68) 24 (88) 300 (44) 258 (68) 3,476 (59) 451 (44) DeKalb 37 (8) 78 (83) 30 (77) 146 (87) 779 (19) 2,983 (73) 215 (92) DeWitt 0 172 (41) 126 (16) 532 (14) 6 (94) 5,343 (8) 492 (30) Douglas 0 130 (54) 75 (51) 153 (86) 336 (55) 2,935 (75) 344 (64) DuPage 24 (19) 36 (97) 27 (82) 110 (90) 276 (66) 1,055 (102) 102 (101) Edgar 20 (24) 248 (21) 148 (12) 384 (26) 2,147 (2) 3,869 (46) 544 (19) Edwards 0 168 (42) 189 (6) 288 (47) 0 3,108 (69) 538 (20) Effingham 20 (25) 228 (24) 87 (42) 615 (8) 546 (35) 2,574 (84) 258 (80) Fayette 0 70 (85) 77 (49) 296 (45) 1,151 (11) 3,120 (67) 511 (27) Ford 28 (13) 125 (56) 19 (93) 259 (58) 253 (70) 3,102 (70) 194 (94) Franklin 20 (22) 229 (23) 19 (92) 572 (11) 302 (62) 5,988 (3) 623 (11) Fulton 11 (40) 153 (46) 30 (80) 241 (62) 306 (61) 4,273 (34) 468 (37) Gallatin 0 376 (7) 39 (70) 0 31 (91) 5,951 (5) 453 (42) Greene 0 75 (84) 59 (59) 173 (80) 312 (59) 4,345 (32) 386 (54) Grundy 10 (45) 92 (74) 25 (86) 301 (41) 757 (21) 1,934 (95) 155 (96) Hamilton 0 134 (52) 30 (78) 0 0 4,350 (31) 621 (12) Hancock 0 41 (94) 38 (71) 300 (43) 184 (77) 3,348 (61) 244 (85) Hardin 0 118 (61) 52 (65) 0 0 3,720 (51) 531 (23) Henderson 0 0 31 (76) 654 (6) 0 1,471 (99) 552 (17) Henry 29 (11) 122 (58) 64 (57) 213 (69) 496 (40) 3,041 (71) 370 (58) Iroquois 13 (35) 83 (79) 4 (98) 353 (34) 99 (87) 3,014 (72) 289 (78) Jackson 67 (4) 183 (37) 51 (67) 92 (94) 315 (58) 5,380 (7) 411 (50) Jasper 0 84 (78) 91 (38) 185 (78) 109 (85) 2,584 (83) 331 (69) Jefferson 20 (26) 292 (13) 182 (7) 269 (57) 267 (67) 4,564 (25) 610 (13) Jersey 0 156 (44) 68 (55) 442 (18) 651 (26) 3,135 (66) 366 (59) JoDaviess 0 94 (73) 24 (89) 130 (89) 283 (65) 2,425 (85) 202 (93) Johnson 0 104 (69) 98 (33) 191 (75) 0 3,455 (60) 384 (55) Kane 17 (28) 88 (76) 48 (68) 288 (48) 434 (47) 2,134 (91) 224 (91) Kankakee 68 (3) 216 (26) 59 (60) 375 (29) 698 (23) 3,568 (56) 488 (31) Kendall 19 (27) 61 (87) 67 (56) 254 (59) 578 (31) 1,379 (101) 151 (97) Knox 16 (30) 213 (27) 69 (54) 219 (68) 740 (22) 5,982 (4) 583 (15) Lake 15 (31) 185 (34) 52 (64) 277 (54) 437 (46) 1,917 (96) 228 (89) LaSalle 43 (7) 118 (60) 55 (62) 301 (42) 451 (43) 4,622 (23) 442 (46) Lawrence 0 151 (47) 179 (8) 460 (17) 634 (27) 4,417 (28) 469 (35) Lee 0 249 (20) 22 (90) 225 (66) 394 (51) 3,766 (48) 362 (60)

90
Emergency Room
Admissionsa
Drug Tx for Females with
Children Inmates with
Children
Orders of Protections with Minors
Domestic Offenses
Reported Child Abuse and Neglect
Reported Child Sexual
Abuse County Rate (Rank) Rate (Rank) Rate (Rank) Rate (Rank) Rate (Rank) Rate (Rank) Rate (Rank)
Livingston 0 176 (40) 56 (61) 68 (96) 963 (15) 6,309 (2) 729 (6) Logan 0 124 (57) 148 (11) 280 (51) 2,758 (1) 4,473 (26) 631 (8) McDonough 0 106 (67) 89 (40) 209 (72) 346 (54) 3,284 (62) 465 (38) McHenry 24 (17) 62 (86) 18 (95) 197 (73) 222 (73) 2,129 (92) 135 (98) McLean 26 (16) 161 (43) 112 (24) 142 (88) 348 (53) 4,619 (24) 339 (68) Macon 28 (12) 255 (19) 453 (1) 947 (2) 1,944 (6) 4,375 (30) 320 (76) Macoupin 8 (47) 58 (88) 86 (43) 193 (74) 424 (49) 3,944 (43) 521 (25) Madison 15 (32) 191 (33) 125 (17) 328 (35) 1,412 (8) 4,386 (29) 383 (57) Marion 0 445 (2) 242 (2) 254 (60) 230 (72) 6,551 (1) 801 (2) Marshall 0 45 (91) 0 389 (25) 364 (52) 3,115 (68) 249 (84) Mason 0 51 (89) 71 (53) 369 (31) 574 (32) 3,939 (44) 484 (32) Massac 0 212 (28) 84 (44) 282 (50) 798 (18) 4,899 (19) 511 (26) Menard 0 88 (77) 53 (63) 423 (20) 256 (69) 2,977 (74) 315 (77) Mercer 0 48 (90) 30 (79) 277 (53) 189 (76) 2,170 (88) 451 (43) Monroe 28 (14) 41 (93) 64 (58) 189 (76) 148 (80) 1,384 (100) 180 (95) Montgomery 51 (6) 197 (32) 138 (14) 238 (63) 476 (41) 3,793 (47) 461 (39) Morgan 12 (38) 275 (15) 114 (23) 168 (82) 634 (28) 5,335 (9) 444 (45) Moultrie 0 79 (82) 101 (29) 383 (27) 301 (63) 2,796 (80) 388 (53) Ogle 14 (33) 116 (62) 19 (94) 303 (40) 615 (29) 2,931 (76) 329 (71) Peoria 21 (20) 197 (31) 97 (34) 666 (5) 2,077 (3) 5,152 (13) 458 (41) Perry 0 82 (80) 111 (26) 101 (92) 147 (81) 4,442 (27) 384 (56) Piatt 0 100 (70) 31 (74) 410 (21) 403 (50) 2,334 (87) 238 (88) Pike 0 34 (98) 83 (45) 410 (22) 86 (88) 3,565 (57) 536 (22) Pope 0 380 (6) 26 (85) 0 544 (36) 3,197 (64) 888 (1) Pulaski 0 434 (3) 76 (50) 1,357 (1) 449 (44) 5,172 (10) 792 (3) Putnam 0 147 (49) 0 160 (85) 16 (92) 2,079 (93) 537 (21) Randolph 12 (36) 133 (53) 112 (25) 279 (52) 145 (82) 3,656 (54) 480 (34) Richland 0 258 (18) 95 (35) 793 (4) 316 (57) 5,127 (14) 606 (14) Rock Island 35 (9) 148 (48) 80 (46) 365 (32) 1,060 (12) 5,118 (15) 429 (47) St. Clair 20 (23) 262 (17) 138 (13) 306 (39) 555 (34) 3,766 (49) 351 (63) Saline 0 207 (29) 119 (19) 649 (7) 1,522 (7) 5,153 (12) 458 (40) Sangamon 10 (43) 94 (71) 114 (21) 96 (93) 1,060 (13) 5,007 (18) 355 (62) Schuyler 107 (2) 115 (63) 35 (72) 568 (12) 320 (56) 5,048 (16) 322 (75) Scott 136 (1) 206 (30) 0 0 0 2,716 (82) 339 (67) Shelby 0 270 (16) 100 (31) 365 (33) 205 (75) 2,851 (78) 276 (79) Stark 0 94 (72) 21 (91) 212 (70) 521 (38) 2,735 (81) 573 (16) Stephenson 16 (29) 144 (50) 100 (30) 374 (30) 2,005 (4) 4,034 (38) 241 (87) Tazewell 12 (37) 82 (81) 27 (83) 473 (16) 912 (17) 2,898 (77) 256 (83) Union 24 (18) 140 (51) 107 (27) 320 (36) 104 (86) 3,714 (52) 494 (29) Vermilion 5 (49) 346 (8) 77 (48) 271 (56) 773 (20) 5,848 (6) 415 (49) Wabash 0 408 (4) 116 (20) 504 (15) 116 (84) 4,143 (35) 628 (9) Warren 0 179 (39) 28 (81) 382 (28) 689 (24) 4,009 (41) 480 (33) Washington 0 39 (96) 114 (22) 80 (95) 13 (93) 2,066 (94) 124 (100) Wayne 0 467 (1) 199 (5) 390 (24) 443 (45) 3,179 (65) 530 (24) White 0 129 (55) 99 (32) 890 (3) 286 (64) 3,232 (63) 329 (72) Whiteside 6 (48) 184 (36) 87 (41) 308 (38) 605 (30) 4,026 (40) 329 (70) Will 13 (34) 91 (75) 34 (73) 223 (67) 452 (42) 1,735 (98) 134 (99) Williamson 20 (21) 299 (11) 31 (75) 188 (77) 1,044 (14) 4,798 (21) 784 (4) Winnebago 9 (46) 405 (5) 79 (47) 586 (10) 55 (89) 4,695 (22) 417 (48) Woodford 10 (44) 40 (95) 15 (96) 408 (23) 211 (74) 2,162 (90) 258 (81) Statewide 16 213 112 281 876 2,985 270
a: 52 counties had no emergency room admissions for suicide attempts or completions in 2000.
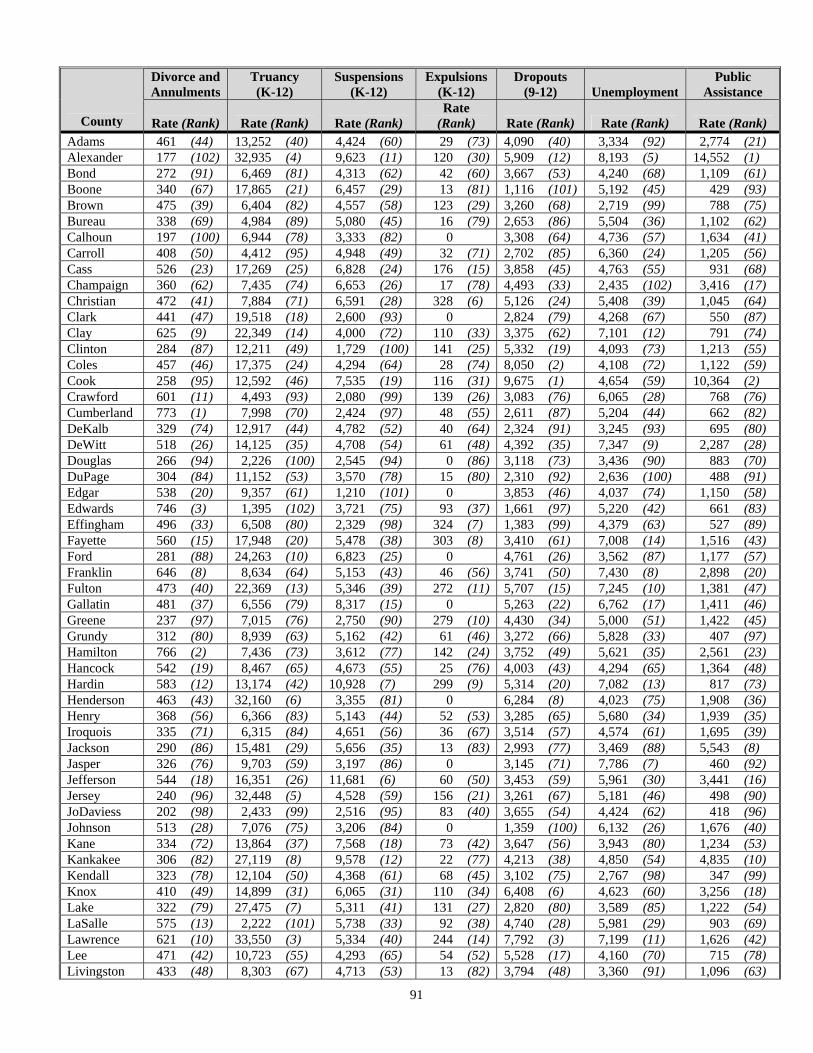
91
Divorce and Annulments
Truancy (K-12)
Suspensions (K-12)
Expulsions (K-12)
Dropouts (9-12) Unemployment
Public Assistance
County Rate (Rank) Rate (Rank) Rate (Rank) Rate
(Rank) Rate (Rank) Rate (Rank) Rate (Rank) Adams 461 (44) 13,252 (40) 4,424 (60) 29 (73) 4,090 (40) 3,334 (92) 2,774 (21) Alexander 177 (102) 32,935 (4) 9,623 (11) 120 (30) 5,909 (12) 8,193 (5) 14,552 (1) Bond 272 (91) 6,469 (81) 4,313 (62) 42 (60) 3,667 (53) 4,240 (68) 1,109 (61) Boone 340 (67) 17,865 (21) 6,457 (29) 13 (81) 1,116 (101) 5,192 (45) 429 (93) Brown 475 (39) 6,404 (82) 4,557 (58) 123 (29) 3,260 (68) 2,719 (99) 788 (75) Bureau 338 (69) 4,984 (89) 5,080 (45) 16 (79) 2,653 (86) 5,504 (36) 1,102 (62) Calhoun 197 (100) 6,944 (78) 3,333 (82) 0 3,308 (64) 4,736 (57) 1,634 (41) Carroll 408 (50) 4,412 (95) 4,948 (49) 32 (71) 2,702 (85) 6,360 (24) 1,205 (56) Cass 526 (23) 17,269 (25) 6,828 (24) 176 (15) 3,858 (45) 4,763 (55) 931 (68) Champaign 360 (62) 7,435 (74) 6,653 (26) 17 (78) 4,493 (33) 2,435 (102) 3,416 (17) Christian 472 (41) 7,884 (71) 6,591 (28) 328 (6) 5,126 (24) 5,408 (39) 1,045 (64) Clark 441 (47) 19,518 (18) 2,600 (93) 0 2,824 (79) 4,268 (67) 550 (87) Clay 625 (9) 22,349 (14) 4,000 (72) 110 (33) 3,375 (62) 7,101 (12) 791 (74) Clinton 284 (87) 12,211 (49) 1,729 (100) 141 (25) 5,332 (19) 4,093 (73) 1,213 (55) Coles 457 (46) 17,375 (24) 4,294 (64) 28 (74) 8,050 (2) 4,108 (72) 1,122 (59) Cook 258 (95) 12,592 (46) 7,535 (19) 116 (31) 9,675 (1) 4,654 (59) 10,364 (2) Crawford 601 (11) 4,493 (93) 2,080 (99) 139 (26) 3,083 (76) 6,065 (28) 768 (76) Cumberland 773 (1) 7,998 (70) 2,424 (97) 48 (55) 2,611 (87) 5,204 (44) 662 (82) DeKalb 329 (74) 12,917 (44) 4,782 (52) 40 (64) 2,324 (91) 3,245 (93) 695 (80) DeWitt 518 (26) 14,125 (35) 4,708 (54) 61 (48) 4,392 (35) 7,347 (9) 2,287 (28) Douglas 266 (94) 2,226 (100) 2,545 (94) 0 (86) 3,118 (73) 3,436 (90) 883 (70) DuPage 304 (84) 11,152 (53) 3,570 (78) 15 (80) 2,310 (92) 2,636 (100) 488 (91) Edgar 538 (20) 9,357 (61) 1,210 (101) 0 3,853 (46) 4,037 (74) 1,150 (58) Edwards 746 (3) 1,395 (102) 3,721 (75) 93 (37) 1,661 (97) 5,220 (42) 661 (83) Effingham 496 (33) 6,508 (80) 2,329 (98) 324 (7) 1,383 (99) 4,379 (63) 527 (89) Fayette 560 (15) 17,948 (20) 5,478 (38) 303 (8) 3,410 (61) 7,008 (14) 1,516 (43) Ford 281 (88) 24,263 (10) 6,823 (25) 0 4,761 (26) 3,562 (87) 1,177 (57) Franklin 646 (8) 8,634 (64) 5,153 (43) 46 (56) 3,741 (50) 7,430 (8) 2,898 (20) Fulton 473 (40) 22,369 (13) 5,346 (39) 272 (11) 5,707 (15) 7,245 (10) 1,381 (47) Gallatin 481 (37) 6,556 (79) 8,317 (15) 0 5,263 (22) 6,762 (17) 1,411 (46) Greene 237 (97) 7,015 (76) 2,750 (90) 279 (10) 4,430 (34) 5,000 (51) 1,422 (45) Grundy 312 (80) 8,939 (63) 5,162 (42) 61 (46) 3,272 (66) 5,828 (33) 407 (97) Hamilton 766 (2) 7,436 (73) 3,612 (77) 142 (24) 3,752 (49) 5,621 (35) 2,561 (23) Hancock 542 (19) 8,467 (65) 4,673 (55) 25 (76) 4,003 (43) 4,294 (65) 1,364 (48) Hardin 583 (12) 13,174 (42) 10,928 (7) 299 (9) 5,314 (20) 7,082 (13) 817 (73) Henderson 463 (43) 32,160 (6) 3,355 (81) 0 6,284 (8) 4,023 (75) 1,908 (36) Henry 368 (56) 6,366 (83) 5,143 (44) 52 (53) 3,285 (65) 5,680 (34) 1,939 (35) Iroquois 335 (71) 6,315 (84) 4,651 (56) 36 (67) 3,514 (57) 4,574 (61) 1,695 (39) Jackson 290 (86) 15,481 (29) 5,656 (35) 13 (83) 2,993 (77) 3,469 (88) 5,543 (8) Jasper 326 (76) 9,703 (59) 3,197 (86) 0 3,145 (71) 7,786 (7) 460 (92) Jefferson 544 (18) 16,351 (26) 11,681 (6) 60 (50) 3,453 (59) 5,961 (30) 3,441 (16) Jersey 240 (96) 32,448 (5) 4,528 (59) 156 (21) 3,261 (67) 5,181 (46) 498 (90) JoDaviess 202 (98) 2,433 (99) 2,516 (95) 83 (40) 3,655 (54) 4,424 (62) 418 (96) Johnson 513 (28) 7,076 (75) 3,206 (84) 0 1,359 (100) 6,132 (26) 1,676 (40) Kane 334 (72) 13,864 (37) 7,568 (18) 73 (42) 3,647 (56) 3,943 (80) 1,234 (53) Kankakee 306 (82) 27,119 (8) 9,578 (12) 22 (77) 4,213 (38) 4,850 (54) 4,835 (10) Kendall 323 (78) 12,104 (50) 4,368 (61) 68 (45) 3,102 (75) 2,767 (98) 347 (99) Knox 410 (49) 14,899 (31) 6,065 (31) 110 (34) 6,408 (6) 4,623 (60) 3,256 (18) Lake 322 (79) 27,475 (7) 5,311 (41) 131 (27) 2,820 (80) 3,589 (85) 1,222 (54) LaSalle 575 (13) 2,222 (101) 5,738 (33) 92 (38) 4,740 (28) 5,981 (29) 903 (69) Lawrence 621 (10) 33,550 (3) 5,334 (40) 244 (14) 7,792 (3) 7,199 (11) 1,626 (42) Lee 471 (42) 10,723 (55) 4,293 (65) 54 (52) 5,528 (17) 4,160 (70) 715 (78) Livingston 433 (48) 8,303 (67) 4,713 (53) 13 (82) 3,794 (48) 3,360 (91) 1,096 (63)

92
Divorce and Annulments
Truancy (K-12)
Suspensions (K-12)
Expulsions (K-12)
Dropouts (9-12) Unemployment
Public Assistance
County Rate (Rank) Rate (Rank) Rate (Rank) Rate
(Rank) Rate (Rank) Rate (Rank) Rate (Rank) Logan 481 (36) 13,291 (39) 7,139 (22) 25 (75) 1,876 (95) 3,607 (84) 696 (79) McDonough 352 (64) 11,149 (54) 4,087 (69) 0 2,410 (89) 2,889 (96) 2,036 (33) McHenry 345 (65) 13,233 (41) 4,232 (66) 42 (63) 3,104 (74) 3,230 (94) 143 (100)McLean 365 (58) 10,104 (57) 4,582 (57) 61 (47) 4,156 (39) 2,458 (101) 877 (71) Macon 484 (35) 7,640 (72) 10,194 (10) 43 (58) 6,880 (5) 5,007 (50) 6,102 (6) Macoupin 524 (25) 11,215 (52) 4,104 (68) 173 (18) 4,384 (36) 4,918 (53) 985 (66) Madison 179 (101) 19,720 (17) 7,142 (21) 97 (36) 5,396 (18) 4,715 (58) 4,789 (11) Marion 672 (6) 14,751 (33) 7,096 (23) 50 (54) 5,589 (16) 6,609 (18) 4,250 (13) Marshall 372 (55) 4,474 (94) 4,897 (50) 60 (49) 3,157 (70) 4,129 (71) 2,151 (31) Mason 374 (53) 6,250 (85) 5,073 (46) 56 (51) 4,360 (37) 6,098 (27) 2,497 (24) Massac 686 (5) 14,843 (32) 8,633 (13) 38 (65) 6,392 (7) 4,974 (52) 4,325 (12) Menard 360 (61) 6,162 (87) 3,803 (74) 35 (69) 2,070 (94) 3,626 (83) 1,310 (49) Mercer 201 (99) 8,309 (66) 4,039 (70) 0 1,707 (96) 6,433 (22) 2,366 (26) Monroe 333 (73) 9,225 (62) 3,807 (73) 0 1,030 (102) 3,136 (95) 379 (98) Montgomery 476 (38) 9,675 (60) 6,643 (27) 72 (43) 3,225 (69) 5,851 (32) 664 (81) Morgan 336 (70) 11,960 (51) 3,128 (87) 36 (68) 3,137 (72) 3,981 (77) 1,978 (34) Moultrie 357 (63) 4,656 (91) 3,249 (83) 0 3,812 (47) 3,930 (81) 424 (94) Ogle 341 (66) 14,636 (34) 3,439 (79) 76 (41) 2,393 (90) 4,169 (69) 591 (86) Peoria 339 (68) 21,088 (16) 14,306 (3) 640 (4) 7,152 (4) 4,333 (64) 7,146 (4) Perry 515 (27) 10,278 (56) 2,618 (92) 0 4,573 (32) 9,685 (1) 2,103 (32) Piatt 312 (81) 4,620 (92) 4,006 (71) 146 (22) 2,767 (82) 3,468 (89) 598 (84) Pike 374 (54) 22,621 (12) 3,364 (80) 0 3,907 (44) 5,482 (37) 1,705 (38) Pope 567 (14) 16,042 (27) 16,342 (2) 1,049 (1) 5,970 (11) 8,347 (3) 1,007 (65) Pulaski 272 (92) 40,656 (1) 18,151 (1) 268 (12) 4,040 (42) 8,509 (2) 6,912 (5) Putnam 329 (75) 13,069 (43) 5,034 (48) 484 (5) 3,691 (52) 5,347 (41) 69 (102)Randolph 457 (45) 12,542 (47) 3,199 (85) 42 (62) 3,310 (63) 5,425 (38) 2,182 (30) Richland 557 (16) 22,218 (15) 6,105 (30) 36 (66) 4,074 (41) 6,801 (15) 2,247 (29) Rock Island 509 (30) 12,451 (48) 8,435 (14) 108 (35) 5,066 (25) 5,209 (43) 5,676 (7) St. Clair 364 (59) 17,572 (22) 13,476 (4) 157 (20) 4,742 (27) 5,866 (31) 9,936 (3) Saline 741 (4) 15,300 (30) 5,511 (36) 45 (57) 4,677 (29) 8,343 (4) 2,474 (25) Sangamon 271 (93) 17,414 (23) 10,621 (8) 129 (28) 1,606 (98) 3,584 (86) 3,077 (19) Schuyler 501 (32) 8,153 (69) 7,571 (17) 250 (13) 3,651 (55) 5,371 (40) 102 (101)Scott 361 (60) 2,887 (97) 2,502 (96) 0 2,446 (88) 5,151 (47) 1,301 (50) Shelby 406 (51) 15,621 (28) 4,296 (63) 69 (44) 3,692 (51) 5,129 (48) 594 (85) Stark 300 (85) 2,455 (98) 4,173 (67) 655 (3) 2,724 (84) 6,363 (23) 841 (72) Stephenson 274 (90) 26,565 (9) 10,227 (9) 176 (16) 4,656 (31) 6,250 (25) 1,781 (37) Tazewell 527 (22) 6,189 (86) 5,664 (34) 175 (17) 2,752 (83) 3,682 (82) 954 (67) Union 656 (7) 7,007 (77) 6,010 (32) 85 (39) 5,744 (14) 6,464 (21) 3,787 (15) Vermilion 391 (52) 12,846 (45) 7,442 (20) 712 (2) 6,087 (9) 6,553 (20) 5,187 (9) Wabash 510 (29) 17,987 (19) 1,093 (102) 0 5,202 (23) 8,042 (6) 1,292 (51) Warren 491 (34) 8,250 (68) 5,040 (47) 32 (70) 2,845 (78) 4,271 (66) 2,325 (27) Washington 323 (77) 10,017 (58) 2,697 (91) 43 (59) 5,761 (13) 3,948 (79) 420 (95) Wayne 525 (24) 4,688 (90) 3,059 (88) 0 2,797 (81) 6,794 (16) 1,121 (60) White 553 (17) 13,949 (36) 3,710 (76) 0 6,011 (10) 5,072 (49) 1,268 (52) Whiteside 533 (21) 13,830 (38) 4,848 (51) 29 (72) 4,662 (30) 3,979 (78) 739 (77) Will 277 (89) 5,935 (88) 8,083 (16) 162 (19) 3,419 (60) 4,012 (76) 1,499 (44) Williamson 506 (31) 23,130 (11) 5,501 (37) 42 (61) 3,498 (58) 6,578 (19) 4,061 (14) Winnebago 367 (57) 39,108 (2) 12,534 (5) 114 (32) 5,294 (21) 4,740 (56) 2,566 (22) Woodford 304 (83) 4,404 (96) 2,998 (89) 145 (23) 2,310 (93) 2,772 (97) 542 (88) Statewide 318 14,112 6,934 110 6,022 4,353 5,697

93
Total Drug Arrests Total Drug
Submissions Reported Violent Index Offenses
Teen Births (10-17)
Adolescent Drug and Alcohol Treatment
County Rate (Rank) Rate (Rank) Rate (Rank) Rate (Rank) Rate (Rank) Adams 562 (48) 495 (40) 458 (23) 510 (88) 470 (37) Alexander 115 (100) 490 (42) 980 (4) 1,510 (6) 1,108 (8) Bond 221 (92) 151 (89) 198 (67) 788 (50) 372 (52) Boone 787 (17) 678 (15) 196 (70) 780 (51) 414 (45) Brown 273 (86) 964 (5) 72 (99) 650 (67) 179 (80) Bureau 358 (75) 56 (98) 144 (82) 627 (69) 334 (58) Calhoun 275 (85) 20 (102) 275 (51) 0 0 Carroll 342 (79) 162 (88) 168 (77) 407 (91) 690 (20) Cass 591 (42) 299 (65) 153 (80) 1,673 (3) 492 (34) Champaign 697 (30) 924 (8) 711 (9) 800 (46) 503 (31) Christian 413 (71) 537 (30) 498 (19) 907 (38) 991 (11) Clark 500 (57) 282 (69) 206 (63) 862 (43) 966 (12) Clay 130 (99) 419 (51) 96 (94) 1,153 (22) 331 (59) Clinton 177 (94) 244 (76) 113 (90) 795 (48) 206 (78) Coles 624 (39) 759 (13) 280 (50) 879 (40) 1,064 (9) Cook 1,411 (3) 1,316 (1) 1,050 (3) 1,549 (4) 468 (38) Crawford 587 (43) 372 (57) 215 (61) 612 (73) 686 (21) Cumberland 524 (52) 507 (34) 267 (52) 1,062 (30) 730 (16) DeKalb 634 (36) 271 (71) 283 (49) 579 (78) 309 (62) DeWitt 631 (37) 577 (24) 298 (45) 659 (64) 638 (26) Douglas 627 (38) 520 (32) 316 (41) 642 (68) 135 (86) DuPage 468 (66) 29 (100) 139 (83) 374 (93) 62 (95) Edgar 579 (45) 137 (91) 528 (17) 565 (82) 1,247 (4) Edwards 760 (20) 80 (93) 115 (88) 990 (34) 418 (44) Effingham 645 (35) 803 (10) 309 (44) 946 (36) 496 (33) Fayette 289 (83) 486 (44) 197 (68) 1,074 (29) 0 Ford 365 (73) 176 (86) 197 (69) 1,208 (17) 459 (39) Franklin 310 (82) 328 (60) 536 (16) 1,113 (24) 566 (29) Fulton 698 (29) 246 (74) 518 (18) 394 (92) 317 (61) Gallatin 1,086 (4) 109 (92) 109 (91) 2,432 (1) 155 (82) Greene 257 (89) 164 (87) 542 (15) 677 (60) 0 Grundy 765 (19) 653 (18) 200 (65) 522 (87) 72 (93) Hamilton 174 (96) 151 (90) 116 (87) 1,455 (8) 113 (89) Hancock 258 (88) 59 (97) 124 (85) 625 (70) 264 (68) Hardin 167 (97) 21 (101) 188 (73) 1,527 (5) 1,240 (5) Henderson 85 (102) 212 (80) 0 1,156 (21) 109 (90) Henry 835 (13) 338 (59) 114 (89) 567 (81) 222 (77) Iroquois 364 (74) 491 (41) 370 (35) 798 (47) 1,372 (3) Jackson 473 (64) 480 (46) 596 (12) 814 (45) 632 (27) Jasper 623 (40) 613 (21) 385 (33) 571 (80) 642 (25) Jefferson 991 (6) 974 (4) 737 (7) 1,302 (13) 684 (22) Jersey 1,071 (5) 406 (53) 258 (53) 471 (89) 174 (81) JoDaviess 731 (26) 310 (63) 215 (60) 552 (83) 395 (49) Johnson 955 (7) 435 (50) 427 (26) 1,389 (10) 893 (13) Kane 549 (49) 455 (48) 360 (36) 1,081 (27) 146 (84) Kankakee 738 (25) 496 (38) 490 (20) 1,206 (18) 454 (40) Kendall 697 (31) 238 (78) 161 (79) 340 (94) 78 (92) Knox 706 (28) 657 (17) 315 (42) 656 (65) 369 (53) Lake 564 (47) 46 (99) 199 (66) 774 (53) 412 (46) LaSalle 752 (21) 490 (43) 248 (56) 904 (39) 304 (63) Lawrence 751 (22) 395 (55) 78 (98) 584 (77) 134 (87) Lee 935 (9) 269 (73) 421 (29) 677 (61) 378 (51)

94
Total Drug Arrests Total Drug
Submissions Reported Violent Index Offenses
Teen Births (10-17)
Adolescent Drug and Alcohol Treatment
County Rate (Rank) Rate (Rank) Rate (Rank) Rate (Rank) Rate (Rank) Livingston 466 (67) 603 (23) 166 (78) 776 (52) 301 (65) Logan 497 (59) 779 (11) 337 (38) 736 (57) 249 (70) McDonough 489 (62) 340 (58) 638 (10) 613 (72) 537 (30) McHenry 326 (81) 288 (68) 150 (81) 461 (90) 94 (91) McLean 903 (10) 630 (20) 470 (21) 571 (79) 655 (23) Macon 790 (16) 949 (6) 575 (13) 1,158 (20) 1,030 (10) Macoupin 341 (80) 824 (9) 231 (58) 794 (49) 143 (85) Madison 831 (14) 532 (31) 411 (30) 1,033 (31) 272 (67) Marion 580 (44) 457 (47) 192 (71) 1,286 (14) 1,519 (2) Marshall 349 (78) 206 (82) 243 (57) 661 (63) 231 (75) Mason 355 (77) 178 (85) 399 (31) 586 (75) 296 (66) Massac 739 (24) 765 (12) 455 (24) 1,743 (2) 500 (32) Menard 264 (87) 296 (66) 256 (54) 750 (54) 69 (94) Mercer 849 (12) 384 (56) 436 (25) 178 (97) 253 (69) Monroe 518 (55) 326 (61) 65 (100) 268 (95) 249 (71) Montgomery 470 (65) 1,149 (3) 284 (48) 1,165 (19) 222 (76) Morgan 503 (56) 281 (70) 322 (39) 739 (56) 353 (55) Moultrie 224 (91) 399 (54) 91 (97) 0 247 (72) Ogle 606 (41) 564 (28) 104 (92) 531 (86) 409 (47) Peoria 518 (54) 939 (7) 751 (6) 1,319 (12) 487 (35) Perry 411 (72) 303 (64) 212 (62) 1,089 (25) 472 (36) Piatt 281 (84) 204 (83) 122 (86) 197 (96) 343 (56) Pike 943 (8) 639 (19) 178 (75) 828 (44) 0 Pope 770 (18) 68 (95) 181 (74) 0 2,137 (1) Pulaski 218 (93) 504 (35) 1,266 (2) 1,222 (16) 810 (14) Putnam 493 (61) 66 (96) 49 (101) 0 0 Randolph 487 (63) 611 (22) 189 (72) 743 (55) 732 (15) Richland 861 (11) 495 (39) 291 (46) 867 (42) 1,181 (6) Rock Island 661 (33) 295 (67) 470 (22) 1,024 (32) 340 (57) St. Clair 495 (60) 486 (45) 1,355 (1) 1,476 (7) 187 (79) Saline 441 (68) 550 (29) 322 (40) 1,121 (23) 432 (43) Sangamon 529 (51) 661 (16) 752 (5) 1,021 (33) 360 (54) Schuyler 1,627 (2) 1,168 (2) 97 (93) 698 (59) 0 Scott 163 (98) 199 (84) 217 (59) 877 (41) 243 (73) Shelby 441 (69) 313 (62) 92 (96) 1,077 (28) 654 (24) Stark 253 (90) 79 (94) 95 (95) 549 (84) 0 Stephenson 715 (27) 568 (25) 396 (32) 952 (35) 697 (18) Tazewell 798 (15) 245 (75) 285 (47) 653 (66) 320 (60) Union 497 (58) 454 (49) 126 (84) 704 (58) 451 (42) Vermilion 669 (32) 566 (26) 730 (8) 1,408 (9) 696 (19) Wabash 750 (23) 240 (77) 170 (76) 532 (85) 1,133 (7) Warren 358 (76) 225 (79) 427 (27) 1,320 (11) 148 (83) Washington 86 (101) 206 (81) 548 (14) 670 (62) 301 (64) Wayne 653 (34) 513 (33) 426 (28) 615 (71) 698 (17) White 2,075 (1) 697 (14) 377 (34) 584 (76) 452 (41) Whiteside 566 (46) 496 (37) 252 (55) 1,084 (26) 379 (50) Will 547 (50) 564 (27) 339 (37) 603 (74) 128 (88) Williamson 176 (95) 413 (52) 201 (64) 910 (37) 580 (28) Winnebago 519 (53) 497 (36) 622 (11) 1,275 (15) 405 (48) Woodford 420 (70) 271 (72) 313 (43) 126 (98) 232 (74) Statewide 934 810 669 1,119 406

95
APPENDIX C Identifying Significant Changes or Differences Between Numbers
To determine if there are noteworthy increases or decreases over time or if two numbers are significantly different it is imperative that researchers take into consideration the natural fluctuation of numbers (i.e., we do not expect the same number of cases, offenses, or crimes to be reported every year). Researchers typically consider two standard errors the range in which there is uncertainty of whether or not a number has notably increased or decreased. To calculate two standard errors of a number, one would use the following equation, with t = total number.
SE = 2 ( t )
After calculating the standard error, the upper and lower bounds are calculated. The equations used to calculate the upper and lower bounds are listed below, with t = total number.
Upper bound = (t + SE)
Lower bound = (t - SE) If the number of interest is the rate rather than the total number, the following equations are used to calculate the upper and lower bounds of the rate, with t = total number and p = population used to calculate the rate.
Upper bound = (t + SE) * 100,000 p
Lower bound = (t - SE) * 100,000
p Upper and lower bounds can also be calculated for percentages using the following equation, with t=number of interest and t2=total number.
Upper bound = (t + SE) * 100 t2
Lower bound = (t - SE) * 100
t2
Once the calculations have been completed, they can be used to determine: (1) if and when significant changes occurred between two years and (2) if one county’s rate is significantly different than the rate in another county. Changes between Two Years Researchers and practitioners often ask: how has the rate or percent changed from one year to the next. In other words, has the rate increased, decreased, or remained the same between time 1 and time 2. Calculating the upper and lower bounds for those years of interest is one way to determine not only if the rate has increased or decrease, but also if that change is statistically significant. For instance, one may want to know if the percent of students suspended that were suspended more than once in the 1990/1991 academic year was significantly different than

96
the percent in the 2000/2001 academic year. By examining the upper and lower bounds, one can identify if a significant change has occurred. To determine if there was a significant increase or decrease, the upper and lower bounds for each of the years examined are analyzed. If the upper or lower bounds for time 1 (e.g., 1990) overlap with the upper or lower bounds at time 2 (e.g., 2000), then these points are not considered different. If there is no overlap, the points are considered significantly different. Figure C.1 shows the percent of students suspended that were suspended more than once for the 1990/1991 and 2000/2001 academic years. As Figure C.1 illustrates, the upper bound for the 2000/2001 academic year overlaps with the lower bound for the 1990/1991 school year. That is, the upper bound value for the academic year 2000/2001 (68 percent) falls within the upper and lower bounds of the 1990/1991 academic year (76 and 61 percent). Therefore, it can be concluded that the percent of students suspended that were suspended more than once in the 1990/1991 academic year is not notably different than the percent in the 2000/2001 academic year.
Figure C.1
Difference between Rates Not only is it important to determine if there are noteworthy increases or decreases over time, but it is also important to know if one county’s rate is different than the rate of another county. Again, calculating the upper and lower bounds of the rate can help one determine if there are real differences between counties (this analysis can also be used when examining differences between numbers and percents). Figure C.2 shows DeKalb County’s and the similar counties’ child sexual abuse rates and the corresponding upper and lower bounds for those rates. The thicker trend lines are the actual child sexual abuse rates for DeKalb County and similar counties. When there is no overlap between the three trend lines for DeKalb County (i.e., the upper bound, the DeKalb County rate and the lower bound) and the three trends lines for the similar counties (i.e., the upper bound, the
Comparing the Percent of Students Suspended in 1990/1991 and 2000/2001 that were Suspended
more than Once
0%
10%
20%
30%
40%
50%
60%
70%
80%
90%
90/91 00/01Academic Year
Per
cent
Upper Bound Lower Bound

97
actual rate and the lower bound), then the rates are considered different. For instance, as shown in Figure C.2, in 1990 and 1994, the upper bounds of the similar counties’ child sexual abuse rate does not overlap with the lower bounds of DeKalb County’s child sexual abuse rate. However, throughout the rest of the time period examined, there is considerable overlap. Thus, it can be concluded that overall, DeKalb County’s child sexual abuse rate was comparable to the rate experienced in the similar counties, with two exceptions. In 1990 and 1994, the child sexual abuse rate in DeKalb County was notably higher than the rate in similar counties.
Figure C.2
Reported Child Sexual Abuse Rates, 1990-2000
0
100
200
300
400
500
600
700
1990 1991 1992 1993 1994 1995 1996 1997 1998 1999 2000
Year
Rat
es p
er 1
00,0
00 p
erso
ns
ages
0-1
8
Upper DeKalb DeKalb Lower DeKalbUpper Similar Counties Similar Counites Lower Similar Counites
No overlap
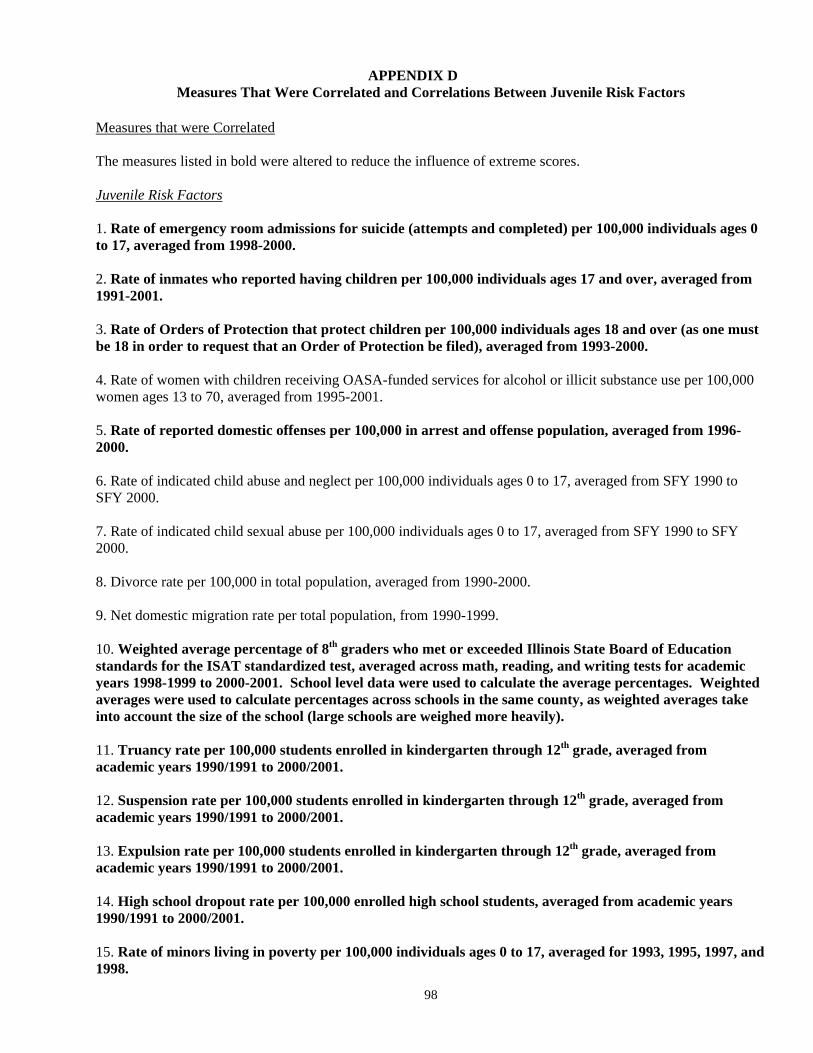
98
APPENDIX D Measures That Were Correlated and Correlations Between Juvenile Risk Factors
Measures that were Correlated The measures listed in bold were altered to reduce the influence of extreme scores. Juvenile Risk Factors 1. Rate of emergency room admissions for suicide (attempts and completed) per 100,000 individuals ages 0 to 17, averaged from 1998-2000. 2. Rate of inmates who reported having children per 100,000 individuals ages 17 and over, averaged from 1991-2001. 3. Rate of Orders of Protection that protect children per 100,000 individuals ages 18 and over (as one must be 18 in order to request that an Order of Protection be filed), averaged from 1993-2000. 4. Rate of women with children receiving OASA-funded services for alcohol or illicit substance use per 100,000 women ages 13 to 70, averaged from 1995-2001. 5. Rate of reported domestic offenses per 100,000 in arrest and offense population, averaged from 1996-2000. 6. Rate of indicated child abuse and neglect per 100,000 individuals ages 0 to 17, averaged from SFY 1990 to SFY 2000. 7. Rate of indicated child sexual abuse per 100,000 individuals ages 0 to 17, averaged from SFY 1990 to SFY 2000. 8. Divorce rate per 100,000 in total population, averaged from 1990-2000. 9. Net domestic migration rate per total population, from 1990-1999. 10. Weighted average percentage of 8th graders who met or exceeded Illinois State Board of Education standards for the ISAT standardized test, averaged across math, reading, and writing tests for academic years 1998-1999 to 2000-2001. School level data were used to calculate the average percentages. Weighted averages were used to calculate percentages across schools in the same county, as weighted averages take into account the size of the school (large schools are weighed more heavily). 11. Truancy rate per 100,000 students enrolled in kindergarten through 12th grade, averaged from academic years 1990/1991 to 2000/2001. 12. Suspension rate per 100,000 students enrolled in kindergarten through 12th grade, averaged from academic years 1990/1991 to 2000/2001. 13. Expulsion rate per 100,000 students enrolled in kindergarten through 12th grade, averaged from academic years 1990/1991 to 2000/2001. 14. High school dropout rate per 100,000 enrolled high school students, averaged from academic years 1990/1991 to 2000/2001. 15. Rate of minors living in poverty per 100,000 individuals ages 0 to 17, averaged for 1993, 1995, 1997, and 1998.
99
16. Unemployment rate per 100,000 individuals in the eligible labor force, averaged from 1990-2000. 17. Average median household income, averaged for 1993, 1995, 1997, and 1998. 18. Rate of minors living in families receiving TANF (Temporary Assistance for Needy Families) per 100,000 individuals ages 0 to 18, averaged from 1997-2000. 19. Drug arrest rate per 100,000 individuals in the arrest and offense population, averaged from 1990-2000. 20. Rate of drug submissions to ISP labs, per 100,000 individuals in the arrest and offense population, averaged from 1998-2001. 21. Violent index offense rate (violent index offenses reported) per 100,000 individuals in the total population, averaged from 1990-2000. 22. Percent of total county population that are minorities, calculated based on populations from 1990-1999. 23. Rate of minors receiving OASA (Office of Alcoholism and Substance Abuse) funded services for alcohol or illicit substance use per 100,000 individuals ages 10 to 16, averaged from 1994-2001. 24. Teenage pregnancy rate per 100,000 females ages 10 to 17, averaged from 1993-2000. Juvenile Justice System Measures 1. Juvenile delinquency petition rate per 100,000 individuals ages 10 to 16, averaged from 1999-2000. 2. Juvenile delinquency adjudication rate per 100,000 individuals ages 10 to 16, averaged from 1999-2000. 3. Post-adjudicatory juvenile detention rate per 100,000 individuals ages 10 to 16, averaged from 1998-2000. 4. Active juvenile probation caseload rate per 100,000 individuals ages 10 to 16, averaged from 1990-2000. Correlations between Juvenile Risk Factors The table below shows correlations between the juvenile risk factors. To conserve space, the 23 juvenile risk factors are labeled using the numbers above (1 for emergency room suicide admissions, 2 for Orders of Protection, etc.). The cells in the table show the Pearson’s correlation coefficients for the corresponding juvenile risk factors. The correlation coefficients listed in bold were statistically significant. Statistical significance means that the correlation coefficient was large enough to be able to make the statement that a linear relationship exists between the two risk factors. A threshold is used to determine statistical significance. Some correlation coefficients that are statistically significant barely exceed the threshold, while others exceed the threshold by a great deal. Consistent with this, the table shows that statistically significant correlations between juvenile risk factors range from 0.20 (a moderate linear relationship) to 0.87 (a strong linear relationship).
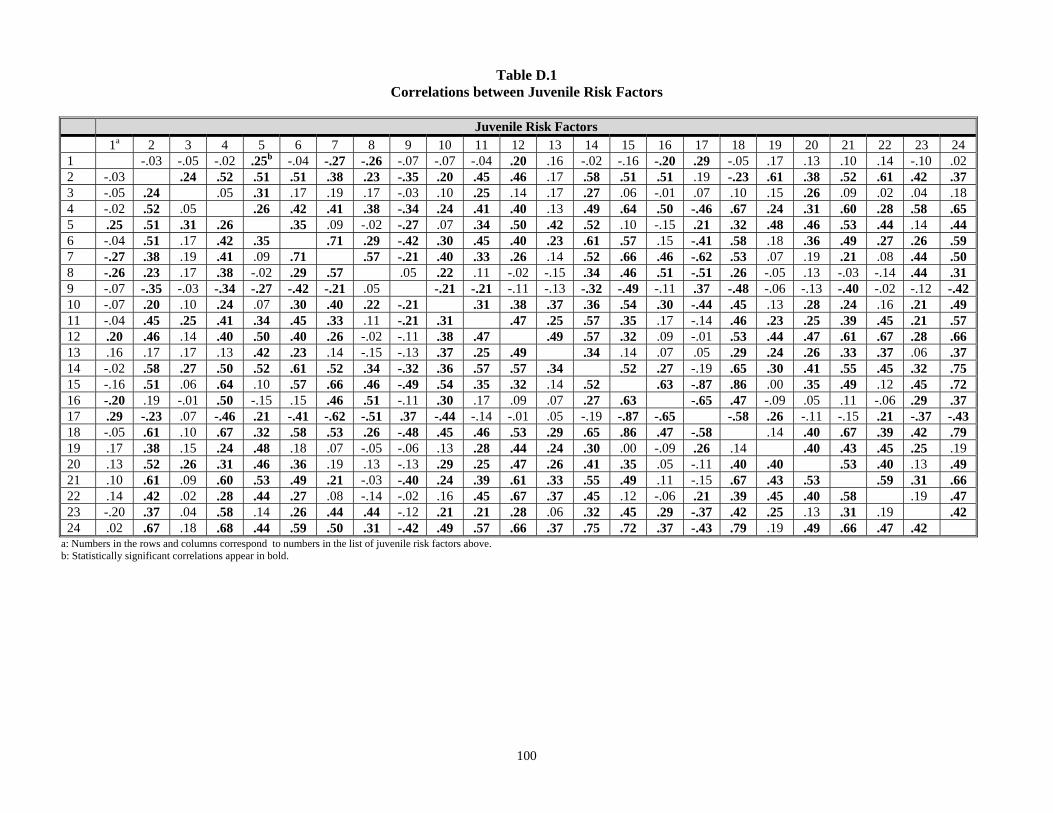
100
Table D.1 Correlations between Juvenile Risk Factors
Juvenile Risk Factors
1a 2 3 4 5 6 7 8 9 10 11 12 13 14 15 16 17 18 19 20 21 22 23 24 1 -.03 -.05 -.02 .25b -.04 -.27 -.26 -.07 -.07 -.04 .20 .16 -.02 -.16 -.20 .29 -.05 .17 .13 .10 .14 -.10 .02 2 -.03 .24 .52 .51 .51 .38 .23 -.35 .20 .45 .46 .17 .58 .51 .51 .19 -.23 .61 .38 .52 .61 .42 .37 3 -.05 .24 .05 .31 .17 .19 .17 -.03 .10 .25 .14 .17 .27 .06 -.01 .07 .10 .15 .26 .09 .02 .04 .18 4 -.02 .52 .05 .26 .42 .41 .38 -.34 .24 .41 .40 .13 .49 .64 .50 -.46 .67 .24 .31 .60 .28 .58 .65 5 .25 .51 .31 .26 .35 .09 -.02 -.27 .07 .34 .50 .42 .52 .10 -.15 .21 .32 .48 .46 .53 .44 .14 .44 6 -.04 .51 .17 .42 .35 .71 .29 -.42 .30 .45 .40 .23 .61 .57 .15 -.41 .58 .18 .36 .49 .27 .26 .59 7 -.27 .38 .19 .41 .09 .71 .57 -.21 .40 .33 .26 .14 .52 .66 .46 -.62 .53 .07 .19 .21 .08 .44 .50 8 -.26 .23 .17 .38 -.02 .29 .57 .05 .22 .11 -.02 -.15 .34 .46 .51 -.51 .26 -.05 .13 -.03 -.14 .44 .31 9 -.07 -.35 -.03 -.34 -.27 -.42 -.21 .05 -.21 -.21 -.11 -.13 -.32 -.49 -.11 .37 -.48 -.06 -.13 -.40 -.02 -.12 -.42 10 -.07 .20 .10 .24 .07 .30 .40 .22 -.21 .31 .38 .37 .36 .54 .30 -.44 .45 .13 .28 .24 .16 .21 .49 11 -.04 .45 .25 .41 .34 .45 .33 .11 -.21 .31 .47 .25 .57 .35 .17 -.14 .46 .23 .25 .39 .45 .21 .57 12 .20 .46 .14 .40 .50 .40 .26 -.02 -.11 .38 .47 .49 .57 .32 .09 -.01 .53 .44 .47 .61 .67 .28 .66 13 .16 .17 .17 .13 .42 .23 .14 -.15 -.13 .37 .25 .49 .34 .14 .07 .05 .29 .24 .26 .33 .37 .06 .37 14 -.02 .58 .27 .50 .52 .61 .52 .34 -.32 .36 .57 .57 .34 .52 .27 -.19 .65 .30 .41 .55 .45 .32 .75 15 -.16 .51 .06 .64 .10 .57 .66 .46 -.49 .54 .35 .32 .14 .52 .63 -.87 .86 .00 .35 .49 .12 .45 .72 16 -.20 .19 -.01 .50 -.15 .15 .46 .51 -.11 .30 .17 .09 .07 .27 .63 -.65 .47 -.09 .05 .11 -.06 .29 .37 17 .29 -.23 .07 -.46 .21 -.41 -.62 -.51 .37 -.44 -.14 -.01 .05 -.19 -.87 -.65 -.58 .26 -.11 -.15 .21 -.37 -.43 18 -.05 .61 .10 .67 .32 .58 .53 .26 -.48 .45 .46 .53 .29 .65 .86 .47 -.58 .14 .40 .67 .39 .42 .79 19 .17 .38 .15 .24 .48 .18 .07 -.05 -.06 .13 .28 .44 .24 .30 .00 -.09 .26 .14 .40 .43 .45 .25 .19 20 .13 .52 .26 .31 .46 .36 .19 .13 -.13 .29 .25 .47 .26 .41 .35 .05 -.11 .40 .40 .53 .40 .13 .49 21 .10 .61 .09 .60 .53 .49 .21 -.03 -.40 .24 .39 .61 .33 .55 .49 .11 -.15 .67 .43 .53 .59 .31 .66 22 .14 .42 .02 .28 .44 .27 .08 -.14 -.02 .16 .45 .67 .37 .45 .12 -.06 .21 .39 .45 .40 .58 .19 .47 23 -.20 .37 .04 .58 .14 .26 .44 .44 -.12 .21 .21 .28 .06 .32 .45 .29 -.37 .42 .25 .13 .31 .19 .42 24 .02 .67 .18 .68 .44 .59 .50 .31 -.42 .49 .57 .66 .37 .75 .72 .37 -.43 .79 .19 .49 .66 .47 .42
a: Numbers in the rows and columns correspond to numbers in the list of juvenile risk factors above. b: Statistically significant correlations appear in bold.

Illinois Criminal Justice Information Authority
120 S. Riverside Plaza, Suite 1016 Chicago, Illinois 60606 Telephone: 312-793-8550 TDD: 312-793-4170 Fax: 312-793-8422 www.icjia.state.il.us
Rod R. Blagojevich, Governor Candice M. Kane, Executive Director