a probabilistic model of meter perception: simulating...
TRANSCRIPT

HYPOTHESIS AND THEORYpublished: 22 May 2017
doi: 10.3389/fpsyg.2017.00824
Frontiers in Psychology | www.frontiersin.org 1 May 2017 | Volume 8 | Article 824
Edited by:
Naresh N. Vempala,
Ryerson University, Canada
Reviewed by:
Xavier Serra,
Pompeu Fabra University, Spain
Maarten Grachten,
Austrian Research Institute for Artificial
Intelligence, Austria
*Correspondence:
Bastiaan van der Weij
Specialty section:
This article was submitted to
Cognition,
a section of the journal
Frontiers in Psychology
Received: 25 October 2016
Accepted: 05 May 2017
Published: 22 May 2017
Citation:
van der Weij B, Pearce MT and
Honing H (2017) A Probabilistic Model
of Meter Perception: Simulating
Enculturation. Front. Psychol. 8:824.
doi: 10.3389/fpsyg.2017.00824
A Probabilistic Model of MeterPerception: Simulating Enculturation
Bastiaan van der Weij 1*, Marcus T. Pearce 2 and Henkjan Honing 1
1Music Cognition Group, Amsterdam Brain and Cognition, Institute for Logic, Language, and Computation, University of
Amsterdam, Amsterdam, Netherlands, 2Music Cognition Lab, School of Electronic Engineering and Computer Science,
Queen Mary University of London, London, United Kingdom
Enculturation is known to shape the perception of meter in music but this is not explicitly
accounted for by current cognitive models of meter perception. We hypothesize that the
induction of meter is a result of predictive coding: interpreting onsets in a rhythm relative to
a periodic meter facilitates prediction of future onsets. Such prediction, we hypothesize,
is based on previous exposure to rhythms. As such, predictive coding provides a possible
explanation for the waymeter perception is shaped by the cultural environment. Based on
this hypothesis, we present a probabilistic model of meter perception that uses statistical
properties of the relation between rhythm and meter to infer meter from quantized
rhythms. We show that our model can successfully predict annotated time signatures
from quantized rhythmic patterns derived from folk melodies. Furthermore, we show that
by inferringmeter, our model improves prediction of the onsets of future events compared
to a similar probabilistic model that does not infer meter. Finally, as a proof of concept,
we demonstrate how our model can be used in a simulation of enculturation. From the
results of this simulation, we derive a class of rhythms that are likely to be interpreted
differently by enculturated listeners with different histories of exposure to rhythms.
Keywords: rhythm, cognition, meter perception, predictive coding, enculturation, computational modeling
1. INTRODUCTION
In a variety of settings, perception appears to be tuned to statistical properties of the environment.It has for example been found that certain properties of neuron receptive fields in early visualprocessing (Olshausen and Field, 1996) and early auditory processing (Smith and Lewicki, 2006)emerge from information theoretically efficient learning algorithms trained respectively on naturalimages or sounds. Such tuning, it has been suggested, happens both on an evolutionary time-scalethrough gradual adaptation, and on an ontogenetic time scale, through brain plasticity (Clark,2013).
The perception of meter in music appears to be shaped by cultural differences in musicalconventions. Exposure to rhythmically different music has been shown to influence perceptionfrom an early age (Hannon and Trehub, 2005a,b), but such shaping possibly continues intoadulthood (Creel, 2011, 2012). In the current paper, we hypothesize that considering meterperception from the perspective of predictive coding (Rao and Ballard, 1999; Friston, 2005; Clark,2013) can help to understand how meter perception is shaped by one’s environment.
Rhythm is an important component of music traditions all over the world (Savage et al.,2015). When listening to rhythms, onsets in the rhythm are perceived relative to a periodic andhierarchically organized framework of beats (Honing, 2013). This mental framework, called meter,

van der Weij et al. A Probabilistic Model of Meter Perception
is induced in the mind of the listener by the rhythm. Therelation between rhythm and meter is complex. For a meterto be perceived, not every beat in the meter needs to coincidewith onsets in the rhythm. In many cases, listeners can, throughconscious effort, alter their metrical interpretation of a rhythm.At the same time, not every meter is equally easy to hear in everyrhythm. Meter, once induced, tends to show a certain resistanceto change. Therefore, meter perception is a fundamentallyincremental process (Longuet-Higgins and Steedman, 1971): thesame rhythmic passage can sound different depending on themeter induced by the rhythm preceding the passage (Honing,2013).
The organizing structure of meter is commonly described asa hierarchy of pulses, yielding a periodic pattern of metricalaccents varying in salience at different points in time. Metricalaccent, or metrical salience, is commonly treated as a proxy fortemporal expectation, or the probability of an event onset at aparticular pulse (Palmer and Krumhansl, 1990). By investigatinga corpus of Western classical music, Palmer and Krumhansl(1990) found that the distribution of onsets over differentpositions relative to the meter reflected theoretical descriptionsof metrical hierarchy (Lerdahl and Jackendoff, 1983). Using agoodness-of-fit paradigm, Palmer and Krumhansl (1990) foundthat temporal expectations of North-American listeners alsoreflect metrical hierarchy, although musicians showed evidenceof deeper hierarchical differentiation than non-musicians. Basedon these findings, Palmer and Krumhansl (1990) suggestedthat composers communicate meter to listeners through thedistribution of onsets at different metrical positions. Listeners,in turn, acquire their knowledge about meter through thedistribution of onsets over metrical positions in the music theyare exposed to.
More recent work has addressed the question of whetherhierarchical organization of onset distributions is a generalproperty of rhythmic organization or whether it is specific toWestern classical music and related styles. Holzapfel (2015),for instance, found that in traditional Turkish makam music,the distribution of onsets is modulated by the specific usul—atype of rhythmic mode, corresponding in some ways to meter—underlying a piece. Furthermore, the distribution of onsets withinone usul in Turkish makam music does not always exhibithierarchical organization. London et al. (2016) found that peaksin onset distributions in a corpus ofMalian drumming recordingsare not periodically spaced. London et al. (2016) conclude thatin makam music and Malian drumming, distributions of onsetsdo reflect metrical structure, but this structure is not alwaysisochronous or strictly hierarchical.
London et al. (2016) point out that their and Holzapfel(2015) results question a basic assumption made by manycomputational models, as well as empirical studies, namely thatmetrical accent is equivalent to the likelihood of an onset. Amore likely alternative is that metrical expectations are derivedfrom extensive exposure to a musical idiom, by which, beyonddistributions of onsets and style-specific, stereotypical rhythmicpatterns associated with certain meters are learned.
Consistent with this suggestion, an increasing number ofempirical studies show that rhythm perception is affected by
enculturation (cf. Morrison and Demorest, 2009). For example,Bulgarian or Macedonian adults are better in detecting metricalviolations in meters with a non-isochronous tactus level—thelevel of beat that listeners are most likely to tap along with—(e.g.,5/8 or 7/8) than North-American listeners (Hannon and Trehub,2005a). This effect appears to be specific to complex meters towhich the listeners have been exposed (Hannon et al., 2012).
There have also been a number of observations in theethnomusicological literature suggesting that individuals fromdifferent cultures perceive rhythms differently. For example,during field work in the Bolivian Andes, while studyingEaster songs from Northern Potosí, (Stobart and Cross, 2000)realized that while they had assumed many of the tunes whereindisputably anacrustic (i.e., a rhythm starting on an off-beat),the local populations appeared to perceive them as beginning on adownbeat. Another example is provided by rhythms from West-African Sub-Saharanmusical cultures, which are characterized bya great deal of metrical ambiguity (Locke, 1982). In particular,many of these rhythms can be interpreted as having a binaryor ternary pulse. While individuals from West-African culturesappear to perceive both pulses with equivalent ease, it can takegreat effort forWestern listeners to hear the ternary pulse in someof these rhythms.
The idea that perception, in general, is shaped by statisticalproperties of the environment is not new (e.g., Barlow, 1961).However, it recently has been developed into a frameworkwhich has been argued to bear the promise of providingan overarching theory of perception (Clark, 2013). Underthe name of predictive coding (Rao and Ballard, 1999), thisframework firmly grounds perception in prediction, basedlargely on previous sensory experience. In fact, the theoryproposes that the brain’s primary occupation is to explainsensory input using hierarchical generative models gleaned fromprevious experience (Clark, 2013). Such models are realizedin a hierarchical organization of layers. The lowest layer inthe hierarchy represents sensations received directly from thesenses. Through feed-forward connections, information travelsupward in the hierarchy. Meanwhile, layers higher up in thehierarchy attempt to predict information, propagated by layersbelow. These predictions are cast to lower layers throughfeedback connections. Successful prediction cancels out theupward propagation of information. As a result, only predictionerror, information that higher layers failed to predict, propagatesupwards in the hierarchy. Based on prediction error, layersgradually adapt their processing characteristics in a way thatminimizes prediction error with respect to layers lower inthe hierarchy. By this process of adaptation, the hierarchy oflayers is gradually shaped into a generative model of sensations,where layers higher up in the hierarchy track causes in theexternal world that underlie the received sensations (Friston,2005). From an information-theoretic point of view, the resultingcoding scheme is highly efficient: the more accurate the top-down predictions, the less bottom-up information is left to beprocessed.
We propose a predictive coding account of meter perceptionthat involves statistical learning of musical rhythms andgeneration of probabilistic expectations for event timings. Meters
Frontiers in Psychology | www.frontiersin.org 2 May 2017 | Volume 8 | Article 824

van der Weij et al. A Probabilistic Model of Meter Perception
are modeled as distinct causes underlying the musical surface.Inferring the underlying meter from rhythm allows the rhythmto be related to rhythms previously heard in that meter, whichmay help prediction performance. Enculturation is modeled byestimating the parameters of the generative model on a corpusof quantized rhythms annotated with meter. Since the modellearns the statistical properties of rhythms through exposure andperforms metrical inference based on these, it has the potential tosimulate enculturation effects in meter perception.
The paper is organized in six sections. In the remainingpart of the current section, Section 1.1 develops an account ofmeter perception based on predictive coding, while Section 1.2discusses relevant work in computational modeling of musicperception. Section 2 presents the probabilistic model of meterperception in detail, concluding with a set of behaviors weexpect the model to exhibit. Section 3 presents the methodsused in a series of simulations designed to test these behaviors,while Section 4 presents the results of the simulations. Section 5discusses the results in the context of the existing literature andincludes implications for future research.
1.1. Meter Perception as Predictive CodingThe dynamic interaction of top-down and bottom-up processingpostulated by predictive coding is reminiscent of dynamicinteraction of bottom-up meter-induction and top-downinfluence exerted by the induced meter, as pointed out by Vuustand Witek (2014).
The hypothesis we explore in this paper is that predictivecoding can explain how meter perception is influenced byenculturation. To explore the consequences of this idea, wepresent a probabilistic model of meter perception, based on anempirical Bayes scheme. Empirical Bayes schemes describe howgenerative systems, such as the generative models posited bypredictive coding, are updated by experience (Friston, 2005).We model meters as virtual causes underlying the rhythmicsurface: a meter imposes constraints the likelihood of rhythms. Alistener commanding an appropriate generative model reflectingthis relationship (i.e., how rhythms are generated from meters),can, when presented only with a rhythmic surface, infer theunderlying meter. This process of inferring underlying causes(meters) of experienced sensations (rhythms) involves invertingthe generative model of those sensations (which are theend-product of the generative process). We hypothesize thatinterpreting the rhythm in the context of an inferred meterwill reduce the discrepancy between predicted and experiencedsensations. In other words, inferring meter makes the rhythmmore predictable.
The generative model includes prior expectations, obtainedfrom previous experience, about which metrical categories arelikely to occur in general. For example, meters with non-isochronous pulses (“complex” meters) are relatively uncommonin Western-European music, but much more common in musicfrom the Balkans and Eastern Mediterranean region. Listenersfrom these regions may be more likely to interpret a rhythm in ameter with non-isochronous pulses than listeners from WesternEurope. These kind of prior biases might underlie the findings ofHannon and Trehub (2005a) mentioned in the previous section.
Metrical categories favored by prior biases entail expectationsregarding the surface structure of rhythms. As bottom-upevidence from the rhythm begins to flow in, these (top-down)expectations are either confirmed or violated. Prediction errorresults from a violation of the top-down expectations by theincoming evidence. To reduce prediction error, the listenerrevises their metrical interpretation of the rhythm, which in turnalters the flow of top-down predictions. A predictive codingperspective of meter perception thus posits a dynamic interplaybetween bottom-up evidence and top-down expectations.
Crucially, both prior biases toward certain meters and thedependencies between meter and the rhythmic surface—whichrhythms can be generated by a certain meter—are the resultof previous exposure. The generative model in the mind ofthe listener underlying these representations is carved out byprevious experience in predictive processing of rhythmic signals.Since the statistical properties of rhythms vary between styles(e.g., Holzapfel, 2015; London et al., 2016), the processing biasesof listeners with significant differences in their exposure tomusical styles are likely to vary as well.
1.2. Related WorkOur approach in some respects resembles other recentprobabilistic models, in particular a generative model presentedby Temperley (2007). Temperley (2007, ch. 2) models meterperception as probabilistic inference on a generative modelwhose parameters are estimated using a training corpus. Meter isrepresented as a multi-leveled hierarchical framework, which themodel generates level by level. The probability of onsets dependsonly on the metrical status of the corresponding onset time.Temperley (2009) generalizes this model to polyphonic musicalstructure, and introduces a metrical model that conditions onsetprobability on whether onsets occur on surrounding metricallystronger beats. This approach introduces some sensitivity torhythmic context into the model. In later work, Temperley(2010) evaluates this model, the hierarchical position model, andcompares its performance to other metrical models with varyingdegrees of complexity. One model, called the first-order metricalposition model, was found to perform slightly better than thehierarchical position model, but this increase in performancecomes at the cost of a higher number of parameters. Temperleyconcludes that the hierarchical position model provides the besttrade-off between model-complexity and performance.
In a different approach, Holzapfel (2015) employs Bayesianmodel selection to investigate the relation between usul (atype of rhythmic mode, similar in some ways to meter) andrhythm in Turkish makammusic. The representation of metricalstructure does not assume hierarchically organization, allowingfor arbitrary onset distributions to be learned. Like the modelscompared by Temperley (2010), this model is not presentedexplicitly as a meter-finding model, but is used to investigate thestatistical properties of a corpus of rhythms.
The approach presented here diverges from these modelsin that it employs a general purpose probabilistic model ofsequential temporal expectation based on statistical learning(Pearce, 2005) combined with an integrated process of metricalinference such that expectations are generated given an inferred
Frontiers in Psychology | www.frontiersin.org 3 May 2017 | Volume 8 | Article 824

van der Weij et al. A Probabilistic Model of Meter Perception
meter. The sequential model is a variable-order metrical positionmodel. Taking into account preceding context widens the rangeof statistical properties of rhythmic organization that can belearned by the model. In particular, the model is capable ofrepresenting not only the frequency of onsets at various metricalpositions, but also the probability of onsets at metrical positionsconditioned on the preceding rhythmic sequence. The vastlyincreased number of parameters of this model introduces a risk ofover-fitting; models withmany parametersmay start to fit to noisein their training data, which harms generalization performance.However, we employ sophisticated smoothing techniques thatavoid over-fitting (Pearce and Wiggins, 2004). Furthermore, weto some extent safe-guard against over-fitting by evaluating ourmodel using cross-validation.
2. THE PROBABILISTIC MODEL
In this section and the sections that follow, we use the wordsmetrical category and metrical interpretation in a specific sense.Metrical categories, denoted by m, represent different metricalframeworks in which rhythms can be interpreted. Metricalcategories correspond directly to time signatures taken fromscores. Each metrical category has an associated period, denotedby Tm. The period is encoded as a discrete number representingthe duration of one bar of m in basic quantized units of time(see Section 2.1). The phase parameter, φ, encodes how a metricalcategory aligns with the rhythmic surface. More precisely, φ
encodes the time-interval between the downbeat of the firstbar and the time point marked by zero in the encoding of therhythmic pattern. Together, a metrical category and phase form ametrical interpretation.
The approach described below deals not with real audiosignals. Instead, the musical surface is represented as a sequenceof events. Each event corresponds to a note, as it might be foundin a musical score. The nth event in a sequence is denotedby en. A sequence of events, starting at event n and ending atevent m is denoted by emn . Section 2.1 provides more details therepresentation of rhythmic patterns.
Predictive coding postulates internal generative modelsreflecting the causal structure of the external world. In analogy tothis, we model meter perception as the inversion of a generativemodel of rhythms. Enculturation through exposure to rhythmsis modeled by deriving the parameters of the generative modelfrom a corpus of rhythms annotated with metrical interpretation.During listening, the metrical category underlying a givenrhythm is generally not known to the listener. Instead, it has to beinferred from rhythmic surface, which is assumed to result fromthe generative model. The likelihood of a metrical interpretationgiven an observed rhythm (i.e., a sequence of events) can beinferred from the generative model through the application ofBayes’ formula, as shown in Equation (1).
posterior︷ ︸︸ ︷
p(m,φ|en0) =
likelihood︷ ︸︸ ︷
p(en0 |m,φ)
prior︷ ︸︸ ︷
p(m,φ)
p(en0)︸ ︷︷ ︸
evidence
. (1)
Two factors play a role in calculating the likelihood of a metricalcategory: The a priori likelihood of the metrical category itself,operationalized here as themetrical category’s conventionality. InEquation (1), this distribution is labeled prior. The other factor isthe likelihood of the rhythmic pattern given a certain metricalstructure. In Equation (1), this function is labeled likelihood.The distribution over metrical interpretations inferred from theobserved events is called the posterior distribution. The factorlabeled evidence in Equation (1) is a constant with respect tometrical interpretation. It ensures that the distribution sums tounity.
The proposed generative model is illustrated in Figure 1. Togenerate a rhythm, a metrical category is first generated froma distribution, p(m), reflecting the prior likelihood of metricalcategories. Next, a phase is sampled from a uniform distributionover a range of discrete phases allowed in m. From a modelassociated with the selected metrical category, events are thengenerated in an incremental fashion. As can be seen in Figure 1,the likelihood of an event is conditioned on underlying metricalcategory and preceding events.
Equation (1) can be expanded into the incremental andrecursive equation shown in Equation (2). This equationexpresses the posterior distribution given all events asproportional to the product of the likelihood of the lastevent, en and the posterior given all but the last event, en−1
0 .Inferring the posterior incrementally after each event by refiningthe posterior that resulted from the previous events can beinterpreted intuitively as the listener integrating the (bottom-up)information provided by each event into their (top-down) beliefsabout the underlying metrical category. Note that the evidencenormalization constant has been omitted for clarity.
per-event posterior︷ ︸︸ ︷
p(m,φ|en0) ∝
{
per-event likelihood︷ ︸︸ ︷
p(en|m,φ, en−10 )
updated prior︷ ︸︸ ︷
p(m,φ|en−10 ) if n > 0,
p(en|m,φ)p(m,φ) else.
(2)
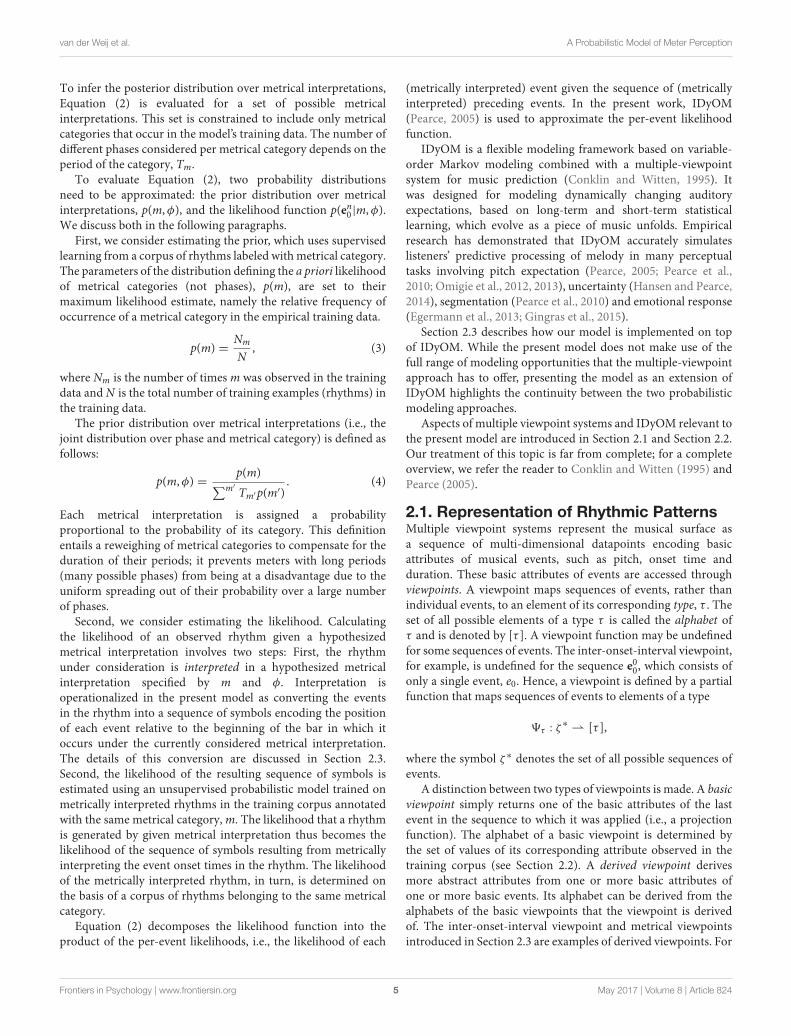
FIGURE 1 | Conditional dependency relations assumed by the model
between its probabilistic variables visualized as a graphical model
(Bishop, 2007, ch. 8). Shaded nodes represent observed variables,
unshaded nodes represent unobserved, hidden variables. Each node in the
graph is associated with a discrete probability distribution. If one or more
arrows terminate at a node, its associated probability distribution is
conditioned on the node(s) that the arrows originate from. Nodes labeled en
represent musical events indexed by n. The hidden variable at the top
represents a metrical interpretation. The hidden variable labeled e represents a
predicted subsequent event.
Frontiers in Psychology | www.frontiersin.org 4 May 2017 | Volume 8 | Article 824
van der Weij et al. A Probabilistic Model of Meter Perception
To infer the posterior distribution over metrical interpretations,Equation (2) is evaluated for a set of possible metricalinterpretations. This set is constrained to include only metricalcategories that occur in the model’s training data. The number ofdifferent phases considered per metrical category depends on theperiod of the category, Tm.
To evaluate Equation (2), two probability distributionsneed to be approximated: the prior distribution over metricalinterpretations, p(m,φ), and the likelihood function p(en0 |m,φ).We discuss both in the following paragraphs.
First, we consider estimating the prior, which uses supervisedlearning from a corpus of rhythms labeled withmetrical category.The parameters of the distribution defining the a priori likelihoodof metrical categories (not phases), p(m), are set to theirmaximum likelihood estimate, namely the relative frequency ofoccurrence of a metrical category in the empirical training data.
p(m) =Nm
N, (3)
where Nm is the number of timesm was observed in the trainingdata and N is the total number of training examples (rhythms) inthe training data.
The prior distribution over metrical interpretations (i.e., thejoint distribution over phase and metrical category) is defined asfollows:
p(m,φ) =p(m)
∑m′Tm′p(m′)
. (4)
Each metrical interpretation is assigned a probabilityproportional to the probability of its category. This definitionentails a reweighing of metrical categories to compensate for theduration of their periods; it prevents meters with long periods(many possible phases) from being at a disadvantage due to theuniform spreading out of their probability over a large numberof phases.
Second, we consider estimating the likelihood. Calculatingthe likelihood of an observed rhythm given a hypothesizedmetrical interpretation involves two steps: First, the rhythmunder consideration is interpreted in a hypothesized metricalinterpretation specified by m and φ. Interpretation isoperationalized in the present model as converting the eventsin the rhythm into a sequence of symbols encoding the positionof each event relative to the beginning of the bar in which itoccurs under the currently considered metrical interpretation.The details of this conversion are discussed in Section 2.3.Second, the likelihood of the resulting sequence of symbols isestimated using an unsupervised probabilistic model trained onmetrically interpreted rhythms in the training corpus annotatedwith the same metrical category,m. The likelihood that a rhythmis generated by given metrical interpretation thus becomes thelikelihood of the sequence of symbols resulting from metricallyinterpreting the event onset times in the rhythm. The likelihoodof the metrically interpreted rhythm, in turn, is determined onthe basis of a corpus of rhythms belonging to the same metricalcategory.
Equation (2) decomposes the likelihood function into theproduct of the per-event likelihoods, i.e., the likelihood of each
(metrically interpreted) event given the sequence of (metricallyinterpreted) preceding events. In the present work, IDyOM(Pearce, 2005) is used to approximate the per-event likelihoodfunction.
IDyOM is a flexible modeling framework based on variable-order Markov modeling combined with a multiple-viewpointsystem for music prediction (Conklin and Witten, 1995). Itwas designed for modeling dynamically changing auditoryexpectations, based on long-term and short-term statisticallearning, which evolve as a piece of music unfolds. Empiricalresearch has demonstrated that IDyOM accurately simulateslisteners’ predictive processing of melody in many perceptualtasks involving pitch expectation (Pearce, 2005; Pearce et al.,2010; Omigie et al., 2012, 2013), uncertainty (Hansen and Pearce,2014), segmentation (Pearce et al., 2010) and emotional response(Egermann et al., 2013; Gingras et al., 2015).
Section 2.3 describes how our model is implemented on topof IDyOM. While the present model does not make use of thefull range of modeling opportunities that the multiple-viewpointapproach has to offer, presenting the model as an extension ofIDyOM highlights the continuity between the two probabilisticmodeling approaches.
Aspects of multiple viewpoint systems and IDyOM relevant tothe present model are introduced in Section 2.1 and Section 2.2.Our treatment of this topic is far from complete; for a completeoverview, we refer the reader to Conklin and Witten (1995) andPearce (2005).
2.1. Representation of Rhythmic PatternsMultiple viewpoint systems represent the musical surface asa sequence of multi-dimensional datapoints encoding basicattributes of musical events, such as pitch, onset time andduration. These basic attributes of events are accessed throughviewpoints. A viewpoint maps sequences of events, rather thanindividual events, to an element of its corresponding type, τ . Theset of all possible elements of a type τ is called the alphabet ofτ and is denoted by [τ ]. A viewpoint function may be undefinedfor some sequences of events. The inter-onset-interval viewpoint,for example, is undefined for the sequence e00, which consists ofonly a single event, e0. Hence, a viewpoint is defined by a partialfunction that maps sequences of events to elements of a type
9τ : ζ ∗ ⇀ [τ ],
where the symbol ζ ∗ denotes the set of all possible sequences ofevents.
A distinction between two types of viewpoints is made. A basicviewpoint simply returns one of the basic attributes of the lastevent in the sequence to which it was applied (i.e., a projectionfunction). The alphabet of a basic viewpoint is determined bythe set of values of its corresponding attribute observed in thetraining corpus (see Section 2.2). A derived viewpoint derivesmore abstract attributes from one or more basic attributes ofone or more basic events. Its alphabet can be derived from thealphabets of the basic viewpoints that the viewpoint is derivedof. The inter-onset-interval viewpoint and metrical viewpointsintroduced in Section 2.3 are examples of derived viewpoints. For
Frontiers in Psychology | www.frontiersin.org 5 May 2017 | Volume 8 | Article 824

van der Weij et al. A Probabilistic Model of Meter Perception
derived viewpoints, multiple different sequences of events maymap to the same element.
The function 8τ returns the sequence of viewpoint elementsof type τ obtained by applying the viewpoint function 9τ
incrementally to to all prefixes of the sequence in order ofincreasing length:
8τ (en0) =
{
8τ (en− 10 )9τ (e
n0) if 9τ (e
n0) 6=⊥,
8τ (en− 10 ) else,
where ⊥ is a symbol indicating that the viewpoint is undefinedfor the given sequence of events.
The model introduced here makes use of a single basicviewpoint, namely on, returning the onset attribute of the lastevent in a sequence, and a set of derived metrical viewpoints. Thealphabet of onset, [on], contains natural numbers that encodethe temporal position of a note as an integer-multiple of basicquantized units. To obtain a finite, meaningful alphabet for on,the onset alphabet is constructed online by adding the set of inter-onset intervals encountered in the training data to the onset of theprevious event.
2.2. Predicting Musical EventsPredicting sequences of musical events in IDyOM requiresspecifying a set of viewpoints, τ0, τ1, · · · , τn, on which to basepredictions. A predictive model is associated with each of theseviewpoints. Each predictive model is trained on the set ofsymbol sequences obtained by applying the associated viewpointfunction 8τ to all event sequences in the training corpus.To approximate the predictive distribution for a future event,p(e|en0), given a sequence of preceding events en0 , the function8τ is applied, once for each of the specified viewpoints, to en0 toobtain a set of sequences of viewpoint elements.
The per-viewpoint predictions, pτ (9τ (e)|8τ (en0)) are then
combined into a single event prediction, using a mechanism thatinvolves a weighted geometricmean. Some subtleties are involvedin converting the predictive distributions to a single domain sothat they can be combined (Pearce, 2005, ch. 7). These neednot concern us, as the model proposed here only uses a singleviewpoint to predict a single attribute of the event representation(although it could be extended in the future to use multipleviewpoints).
IDyOM thus reduces the challenge of estimating p(e|en0)to the parallel prediction of symbol sequences by estimatingpτ (9τ (e)|8τ (e
n0)) for each viewpoint τ0, τ1, · · · , τn. The
(domain-general) method employed by IDyOM for predictingsymbol sequences is based on a data-compression scheme calledprediction by partial matching (PPM), introduced by Clearyand Witten (1984). Pearce and Wiggins (2004) provide anoverview of various modifications and improvements to theoriginal PPM scheme that have been proposed over the years,and compare their performance using an information-theoreticperformance measure (see Section 2.4). IDyOM implementsmultiple prediction schemes and furthermore allows predictionsto be based on two separate models: a long-term modeltrained on a corpus of training data and a short-term modeltrained, online, on only the current sequence of events. In our
simulations, we use only a long-term model (see Pearce et al.,2005), employing a PPM* scheme using method C (Moffat,1990) for calculating escape probabilities and adapted to useinterpolated smoothing—the configuration Pearce and Wiggins,2004 found to yield the best results for a long-term model.A parameter called model order-bound parameter limits theamount of previous events taken into account in the predictingthe next event, e: An order-bound of b means that it is assumedthat p(e|en0) ≈ p(e|en
n−b). While Pearce and Wiggins (2004)
found that an unbounded model order worked best, the presentpaper presents results for varying model order-bounds of up tofour.
2.3. Metrical Viewpoints, Metrical Models,and Metrical InferenceThe per-event likelihood function in Equation (2) is a predictivedistribution that, based on events observed so far and ahypothesized metrical interpretation, specified by m and φ,predicts the next event. This relies on interpreting the sequenceof events in the given metrical interpretation and estimating thelikelihood of the resulting sequence of symbols given a predictivemodel of such sequences in the provided metrical category.Interpretation of a rhythm in a specific metrical interpretation isachieved in IDyOM through the introduction of a set of metricalviewpoints. Metrical viewpoints transform a sequence of absoluteonset times into a sequence of symbols that depend on themetrical interpretation implemented by the viewpoint.
The general form of a metrical viewpoint τm,φ is
9τm,φ (en0) = f (m,φ, en0),
where f is a function that implements the metrical interpretationgiven a phase and metrical category.
The present model uses a simple metrical interpretationfunction that returns the metrical position of an onset.This function makes few assumptions about the structuralorganization of meter, and can accommodate complex, non-isochronous meters. The metrical position of an onset isdefined as its position relative to the period and phase of aninterpretation. The general definition of the resulting metricalposition viewpoint, mp, is given below
9mpm,φ(en0) =
(
9on(en0)− φ
)
mod Tm,
where the viewpoint on is a basic viewpoint that returns the onsetof the last event in a sequence of events.
One metrical viewpoint is created for each metricalinterpretation considered by the model by instantiating mand φ to a specific value.
The alphabet of the mp viewpoint is given by
[mpm,φ] = {0, 1, · · · ,Tm − 1}.
Using metrical viewpoints, metrical inference can beimplemented on top of the standard IDyOM machinery,with one important caveat: the predictive model of a metricalviewpoint, τm,φ is trained only on those sequences in the training
Frontiers in Psychology | www.frontiersin.org 6 May 2017 | Volume 8 | Article 824

van der Weij et al. A Probabilistic Model of Meter Perception
data that have been annotated with metrical category m. Hence,the predictability of a metrically interpreted rhythm dependsonly on rhythms previously observed in the correspondingmetrical category.
One further subtlety needs to be addressed to completethe model. Note that the per-viewpoint predictive distributionsmentioned in Section 2.2 are defined over a viewpoint’s alphabet[τ ]. In order to predict the onset of the next event this alphabetneeds to be mapped back to the alphabet of the onset viewpoint,[on]. However, any metrical position in [mp] theoreticallycorresponds to an infinite number of periodically spaced onsettimes. To be able to generate predictions for specific onset times,and for metrical inference to work correctly, it is necessary thatthe alphabet of a metrical viewpoint maps to unique onset times.This can be achieved by linking the metrical position viewpointto another metrical viewpoint, which encodes the distance in barsbetween the last event and the predicted event.
The equation below defines the bar distance viewpoint, bd interms of an intermediate metrical viewpoint, bn (bar number),which calculates the number of bars elapsed between time zeroand the onset of the last event.
9bdm,φ (en0) = 9bnm,φ (e
n0)− 9bnm,φ (e
n− 10 ),
where metrical viewpoint bn is defined as
9bnm,φ (en0) = integer
((
9onen0 − φ
)
Tm
)
.
A linked viewpoint is a special case of a derived viewpointcomposed of a number of constituent viewpoints. The elementsof linked viewpoints are tuples containing the values ofthe constituent viewpoints. A linked viewpoint composed ofτ1, · · · , τn is denoted by τ1 ⊗ · · · ⊗ τn , its alphabet is given bythe Cartesian product of the constituent viewpoints’ alphabets:[τ1]× · · · × [τn].
The linked metrical viewpoint used in our simulations isdenoted by mp⊗ bd, and encodes metrical position and distancein bars between the penultimate and last event. Elements in thealphabet of this viewpoint have a one-to-one correspondence toelements in [on].
To summarize: metrical viewpoints and separate predictivemodels per metrical category enable using IDyOM to estimatethe per-event likelihood function in Equation (2). In this model,the likelihood of a metrical interpretation m depends on thepredictability of the sequence of symbols that results frominterpreting the rhythm in that metrical interpretation. Thispredictability in turn depends on the set of rhythms previouslyobserved inm.
2.4. Expectation and Information ContentWe have focussed our discussion so far on the issue of inferringa posterior distribution over metrical interpretations. In order tocalculate prediction error, it is necessary to derive the predictivedistribution over future note onsets given a preceding rhythmiccontext and an inferred meter.
To estimate prediction error, we look at the amount ofinformation communicated by each observation. Although itis sometimes referred to as cross-entropy (e.g., Manning andSchütze, 1999, ch. 2), we call this quantity the information content(MacKay, 2003) of an event. Information content is defined as thenegative logarithm of the likelihood of observing the next eventgiven the predictive distribution conditioned on the sequence ofevents observed so far:
h(e|en0) = − log2 p(e|en0). (5)
In an information-theoretic sense, this quantity is equivalentto prediction error. An unlikely (unexpected) event results ina high prediction error, signaled by high information content.Conversely, a likely event results in a low prediction error,signaled by low information content.
The predictive distribution corresponds to the probabilitydistribution associated with the hidden variable labeled e in thegraphical model in Figure 1. This distribution is obtained fromthe generative model by marginalizing out meter and phase fromthe posterior distribution inferred from the preceding events:
p(e|en0) =
m∑
φ∑
p(e|m,φ, en0)p(m,φ|en0), (6)
where the summation over meters sums over all metricalcategories considered by the model, m ∈ M, and the summationover phases sums over all possible phase of category m, φ ∈
{0, 1, · · · ,Tm − 1}.Equation (6) shows that the prediction of the onset of the next
event is subject to top-down influence from the distribution overmetrical interpretations inferred from bottom-up informationfrom the events observed so far.
2.5. HypothesesWe expect an accurate computational model of human meterperception to show certain patterns of behavior. First, we expectit to be able to infer meters that agree with the time signaturesin notated scores (Longuet-Higgins and Lee, 1982; Temperley,2004). Second, we argued that the metrical knowledge, acquiredby listeners through exposure to a musical idiom, is characterizednot only by the distribution of onsets over metrical positions, butalso by the probabilistic properties of how rhythms in particularmeters sequentially unfold. Thus, we expect that a model thatcan learn such properties will lead to increased performance infinding time signatures notated in scores compared to a similarmodel that does not learn these properties. Third, we arguedabove that categorizing rhythms into metrical categories canplausibly be regarded as a strategy to reduce prediction error forthose rhythms. Therefore, we expect that our model will showbetter performance in predicting the timing of musical eventsthan a comparable model that is agnostic of meter. Fourth, weexpect that our model will simulate enculturation by showingsensitivity to the statistical properties of the rhythms it wastrained on. A model trained on rhythms with similar statisticalproperties as the rhythms it is evaluated on will perform betterthan amodel that was trained on rhythmswith different statisticalproperties. If the statistical properties of rhythms originating
Frontiers in Psychology | www.frontiersin.org 7 May 2017 | Volume 8 | Article 824

van der Weij et al. A Probabilistic Model of Meter Perception
from two cultures with different cultural practices regardingrhythm are sufficiently different, we expect that a model trainedon rhythms from the same culture as the rhythms it is evaluatedon will outperform a model trained on rhythms from a culturewith different rhythmic practices. We evaluate these expectationsin Sections 3 and 4.
3. METHODS
3.1. Resolution of Onset Time and PhaseFor reasons of computational efficiency, the resolution the phaseparameter of metrical interpretations is restricted to sixteenthnotes. This means that, for example, in the 3/4 category twelvedifferent phases are possible (since the duration of one 3/4 baris twelve sixteenth notes). Since all onset times in rhythms usedin this study encode distance from the beginning of the first barin the annotated meter, the correct phase of a rhythm can berepresented under any phase resolution. The representation ofrhythms in a phase of zero does not influence the evaluation: asfar as the model is concerned, all phases are initially equally likelysince the prior distribution over phase is uniform. The presenceof 32th notes and 16th-note triplets in the training data requiresthat onset times are represented as integer multiples of symbolicunits corresponding to 96th notes.
3.2. Training DataExcept for one artificially constructed test set, the datasets used inour simulations are all derived from the Essen folksong collection(Schaffrath and Huron, 1995). The Essen folksong collection isa corpus consisting of monophonic transcriptions of folksongs,originating from various geographical regions across the globe.The majority of the folksongs in this dataset originate fromregions in Germany and China. We use a version of the Essenfolksong collection encoded in humdrum format, which weobtained from http://kernscores.stanford.edu.
Folksongs without an annotated time signature, or withmultiple time signatures are filtered out. The simulationsdescribed below use different subsets of this filtered version ofthe Essen folksong collection.
3.3. Classification Performance and theInfluence of Preceding ContextThe first expectation formulated in Section 2.5 concerns themodel’s ability to infer meters that agree with time signaturesnotated in scores. To evaluate this, classification performance ismeasured using ten-fold cross validation on a dataset of Germanfolksongs. In a cross validation scheme, a model is trained andevaluated ten times on different partitions of the dataset into atraining set and a test set. Reported classification scores are basedon the average classification score over all ten partitions.
The second expectation we formulated is that modelsexploiting sequential probabilistic properties will perform betterin this task than a similar model that does not exploitsuch properties. To evaluate this, we measure classificationperformance of five different models configured with order-bounds ranging from zero to four using cross validation. Theorder-bound parameter (see Section 2.2) allows us to vary the
degree to which the model can learn sequential probabilisticproperties of rhythms, interpolating between a model that canonly learn distributions of onsets over metrical positions (order-bound zero) and a model that predicts the subsequent metricalposition based on the metrical positions of the last four events(order-bound four).
The result of performing inference on the generative model—inferring meter from a rhythm—is not a single classification, buta posterior probability distribution over metrical interpretations.To determine in which meter the model interprets a rhythm,an additional inferential step is required. All classification scoresreported in this paper are based on the interpretations with thehighest posterior probability after observing the entire rhythm.An interpretation is considered correct if its phase and categoryagree with the annotated time signature.
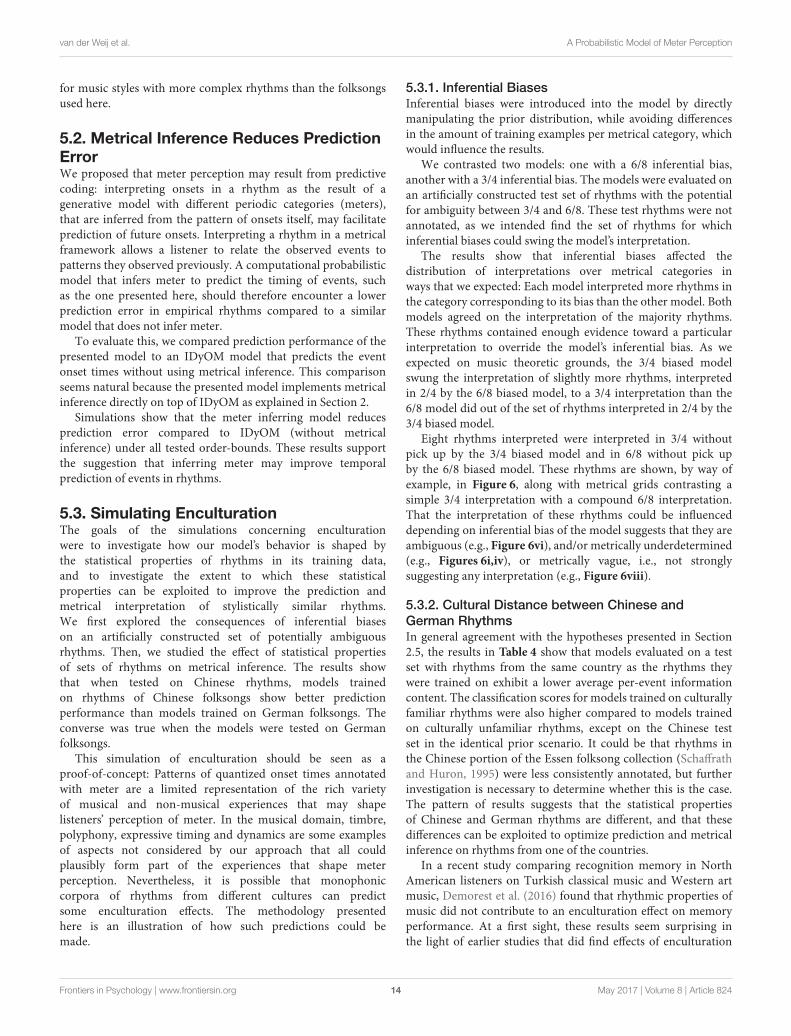
For these simulations, we used rhythms extracted from 4,966German folksongs in the Essen folksong collection. This set isconstructed by selecting all melodies with an “ARE” record (areaof origin; Huron, 1999) indicating a region of Germany from theEssen folksong collection, subject to the constraints describedin Section 3.2. Figure 2 shows the distribution of meters in theresulting dataset. The most frequently appearing time signaturesin this set are 4/4, 2/4, 3/4, and 6/8.
3.4. Does Metrical Inference ReducePrediction Error?The third expectation we formulated is that a model usinginferred meter to predict the onsets of musical events willoutperform comparable models that do not use metricalinference. To assess whether metrical inference increasespredictive performance we compare the model an IDyOMmodelthat predicts event onset time without inferringmeter. Predictionperformance is measured by looking at average informationcontent (see Section 2.4), which represents the discrepancybetween predicted and observed events.
This IDyOM model is configured to use a single viewpoint,encoding inter-onset intervals between subsequent events, topredict onset time. Inter-onset interval is defined as the difference
FIGURE 2 | Histogram showing the of the distribution of meters in the
dataset of 4,966 German folksongs from the Essen folksong collection.
Frontiers in Psychology | www.frontiersin.org 8 May 2017 | Volume 8 | Article 824

van der Weij et al. A Probabilistic Model of Meter Perception
between the onset time of the final and penultimate event. Bothmodels are trained and evaluated on the same dataset using cross-validation, and the input of both models consists only of onsettimes encoded in the event representation.
The results are reported, as before, for order-bounds varyingfrom zero to four. The values represent average informationcontent over cross validation folds.
3.5. Simulating EnculturationThe fourth expectation concerning the model’s behavior weformulated is that it should show sensitivity to the statisticalproperties of its training data. To investigate this, two typesof statistical aspects of training data that affect the model’sbehavior in different ways are distinguished. The first aspect isthe distribution of metrical categories in the training rhythms.This distribution is directly reflected in the prior distribution,encoding a priori likelihood of different metrical categories. Theeffect of the prior distribution on themodel’s behavior can be seenas inferential biases. The second aspect concerns the sequentialstructure of the training rhythms themselves. This aspect includesthe distribution of onsets over different metrical positions, butalso the typical unfolding of rhythms interpreted in a specificmeter and the presence of stereotypical rhythmic patterns.
These two aspects of training data may influence theencountered prediction error on novel rhythms as well asthe metrical category in which rhythms are interpreted.To investigate the effect of inferential biases, we focus onconsequences of inferential biases for metrical interpretation.In the investigation of the statistical properties of rhythmsthemselves we focus on the effects of training data on predictionerror.
The simulations described below are all conducted using anorder-bound of four, since the cross validation results indicatethat, out of the considered order-bounds, four works best (seeSection 4).
3.5.1. Inferential BiasesA high prevalence of certain metrical categories in the musicto which a listener has been exposed to previously may leadto inferential biases: a tendency to interpret rhythms in thepervasive category. In probabilistic terms, this is a sensiblebehavior: in the presence of uncertainty, it is optimal to tendtoward categories with a high a priori likelihood of occurring.Such likelihoods are represented in the prior distribution overmetrical categories. Inferential biases are top-down in the sensethat they are independent of the particular rhythm encounteredby the model. Once the model begins to process a rhythm,the prior distribution is updated by bottom-up evidence fromthe rhythm. Inferential biases can alternatively be understoodas changing the initial state of meter induction. Meters favoredby the prior distribution require less evidence from rhythmicevents to gain a high posterior likelihood. In cases where arhythm is ambiguous (i.e., provides evidence for two or moremetrical categories), inferential biases toward either category canbe decisive in the model’s interpretation.
To investigate the effect of inferential biases, we train twomodels on a subset of the German folksongs described in Section
3.3 containing 658 2/4 (a simple duple meter), 658 3/4 (a simpletriple meter) and 658 6/8 (a compound duple meter) trainingexamples. We bias the prior distribution of one model to favor3/4 interpretations while the other model is biased to favor 6/8interpretations.
In this simulation the prior distribution is not estimatedempirically using the relative frequency of metrical categories inthe training data. Instead, the parameters of the prior distributionare manually set to the values shown in Table 1. The rationalebehind this choice is that if we would manipulate the priordistribution by altering the number of training rhythms in ametrical category, the number of training examples from whichthe model predictive model of that category is learned would beaffected, which introduces performance differences that cannotbe attributed solely to the prior distribution.
The consequences of the biased prior distribution areinvestigated using an artificially constructed test set. Toconstruct this set, first, a set of rhythmic patterns is constructedby generating all possible patterns within the followingconstraints: the total duration of a pattern is exactly twelvesixteenth notes, none of the patterns begin with a rest and theminimum inter-onset interval is a sixteenth note. The resultingset consists of 211 rhythmic patterns: each pattern begins withan onset and each sixteenth-note time point between the secondand twelfth sixteenth-note can contain an event onset. Becausetwelve sixteenth notes is exactly the duration of one 3/4 or 6/8bar, this set contains all rhythms with a minimum interval ofa sixteenth note that fit in one bar of a 3/4 or 6/8 meter. Toconstruct the final test set, each of these patterns is repeated fourtimes. The repetition allows the model more time to converge ona single interpretation.
Both models are used to infer meter for each rhythm inthe test set. Note that while three different categories, 2/4, 3/4,and 6/8, are considered, the quadruple repetition of patternswith a duration of twelve sixteenth notes may favor 3/4 and6/8 interpretations. Since this potential bias is a property of thetest set on which both models are evaluated, it does not causeproblems for the evaluation of the effect of inferential biases.
We expect that inferential biases will increase the numberof rhythms interpreted in the category corresponding to thebias. Due to the juxtaposition of 3/4 and 6/8 inferential biases,and the bar-level period-correspondence between these twometers, we expect to find the greatest degree of disagreementin interpretation of rhythms in the test set between the 3/4and 6/8 categories: the 3/4 biased model will likely interpretrhythms classified by the 6/8 biased model as 6/8 in 3/4 and viceversa.
TABLE 1 | Prior probabilities of metrical categories used for simulating
inferential biases.
Category Prior probability
3/4 biased 6/8 biased
2/4 4/9 4/9
3/4 4/9 1/9
6/8 1/9 4/9
Frontiers in Psychology | www.frontiersin.org 9 May 2017 | Volume 8 | Article 824

van der Weij et al. A Probabilistic Model of Meter Perception
It seems plausible that 3/4 and 6/8 inferential biases will leadto some disagreement about the 2/4 category. An inferentialbias may lead a model to interpret rhythms classified by theother model as 2/4 in the category corresponding to its bias.At the tactus level, 2/4 and 3/4 exhibit structural similarities: byconvention, 2/4 and 3/4 both imply simple meters, where beatsare subdivided into two smaller units. The 6/8 time signature,on the other hand, implies a compound meter. These (music-theoretic) similarities between 2/4 and 3/4 may lead the 3/4biasedmodel to interpret more rhythms, interpreted in 2/4 by the6/8 biased model, according to its bias than the 6/8 biased modelwill out of the rhythms interpreted in 2/4 by the 3/4 biasedmodel.It is worth noting that 2/4 and 6/8 have a different structuralsimilarity at the level above the tactus: they are both duple meters.However, the duration of beat in 2/4 and 6/8, in our quantizedinput representation, is different, preventing this similarity fromplaying a role in our model.
The set of rhythms interpreted differently by both modelslikely consists of rhythms that do not strongly imply one specificinterpretation. We expect such rhythms to be either ambiguous,or metrically over- or under-determined (London, 2012, pp. 75–76). Because we define a classification as the interpretation withthe maximum posterior probability, the model always producesan interpretation of a rhythm, even if evidence from the rhythm isweak or conflicting. Therefore, some of the rhythms about whichthe models disagree may be metrically vague, i.e., not stronglysuggesting any interpretation.
3.5.2. Cultural Distance between Chinese and
German RhythmsIn two simulations, we investigate how the model responds tobeing trained on folksongs originating from China or Germany.Music from these two areas might be different enough tolead to differences in rhythmic processing between enculturatedindividuals. By training the model on a dataset of Chinese andGerman folksongs, we can simulate how, according to the model,exposure to these stylistically different sets of rhythms affectsperception.
To this end, we use two dataset sets, containing folksongsoriginating respectively from Germany and China. The Germandataset is the same one that is used for the cross validationsimulations described in Section 3.3. The dataset of Chinesefolksongs is constructed in the same way as the Germandataset, namely by selecting all folksongs from the Essenfolksong collection whose “ARE” reference record (Huron, 1999)indicated a region in China and after first filtering out folksongswith zero or more than one annotated time signatures.
We run simulations in two separate conditions. In bothconditions, two models are trained: one on a Chinese trainingset, and one on a German training set. Both of these models aresubsequently evaluated on a separate Chinese and German testset consisting of rhythms that do not occur in the training data.In contrast to the simulation described above, we estimate theprior distribution in its normal way (see Equations 3 and 4).
The number of rhythms of each metrical category used in thetest and train sets in the first and second condition are shown inTable 2.
In the first condition (see the columns under “identical” inTable 2), we control for the effect of the prior distribution anduse identical distributions of metrical categories in the trainingdata of both models. This allows us to attribute observed effectsto differences in the statistical properties of rhythms, rulingout effects of differences in the number of training examplesor the differences in prior distributions. Meters considered inthe simulation need to be well represented in both datasets. Inthe German and Chinese dataset that we have available, thisconstraint leaves 2/4, 3/4, and 3/8 as suitable categories. Despitethis reduction, the number of rhythms in meters other than 2/4in the Chinese dataset remains rather small.
Due to the small number of rhythms in meters other than2/4 in the Chinese dataset, it is not possible to use a uniformdistribution of meters in the test sets for this condition. Instead,we only include rhythms in 2/4 in the German and Chinesetest set.
In the second condition (see the columns under “empirical” inTable 2), we allow the prior distribution to influence results anduse empirical distributions of metrical categories in the trainingdata of both models. By empirical, we mean that the relativefrequencies of meters in the test and training sets that we usedare equal to those observed in the Essen folksong collection.Both training sets contained in total an equal number of trainingexamples.
Rhythms in the test sets for this condition are distributed tothe same proportions as in the corresponding training sets. TheChinese test set predominantly contains rhythms annotated in2/4 while the German test set also contains substantial numbersof rhythms in 3/4 and 4/4.
We expect that, on the Chinese and the German test sets, themodel trained and tested on culturally similar music will exhibitlower average information content and higher classificationperformance than the model trained on culturally differentmusic. We expect to see this pattern of results both for theidentical, as well as for the empirical distribution of meters in thetraining data.
4. RESULTS
4.1. Classification Performance andPreceding ContextFigure 3A shows the average number of correct interpretationsfound by our model at order-bounds ranging from zero tofour. The averages are obtained by first averaging all per-eventinformation contents (see Section 2.4) in the test set of one crossvalidation fold, and subsequently over all cross-validation folds.The standard deviations are calculated over the averages percross validation fold. At order-bound zero, the model interpretsrhythms in agreement with annotated time signatures in, onaverage 38%, of the cases. At order-bound one, classificationperformance increases sharply to, on average, 67% of the rhythmsin agreement with the annotated time signature. Increasingorder-bound further yields modest improvements. At order-bound four, the highest we tested, on average, 71% the rhythmswere interpreted in agreement with the annotated time signature.
Frontiers in Psychology | www.frontiersin.org 10 May 2017 | Volume 8 | Article 824

van der Weij et al. A Probabilistic Model of Meter Perception
TABLE 2 | Number of rhythms in different metrical categories in the training and test sets used in the simulation of enculturation.
Distribution of meters Identical Empirical
Country of origin Germany China Germany China
Dataset Training Test Training Test Training Test Training Test
Meter 2/4 950 200 950 200 339 60 1,009 178
4/4 132 0 132 0 427 75 90 16
3/4 35 0 35 0 296 52 24 4
3/8 19 0 19 0 74 13 13 2
All 1,136 200 1,136 200 1,136 200 1,136 200
FIGURE 3 | Classification performance and average information content for five different models varying in order-bound, evaluated using ten-fold
cross-validation. Markers represent values obtained by averaging over the ten folds. Error bars extend one standard deviation above and below the average values.
(A) Proportions of correctly classified interpretations. (B) Average information contents for the model (with metrical inference) compared to IDyOM without metrical
inference.
Variability in performance between different partitions of thedata in a training and test set is low, as the small error bars inFigure 3A show.
4.2. Metrical Inference and Prediction ErrorFigure 3B shows prediction performance in terms of average per-event information content of rhythms under IDyOM (withoutmetrical inference) and our extended version of IDyOM (withmetrical inference). Both models were tested at order-boundsranging from zero to four.
The results shows that, in general, information contentdecreases as order-bound increases for both the IDyOM model(without metrical inference) and our model (with metricalinference). The results also show that for all tested order-bounds, the average information content is lower our model(with metrical inference): for example 2.19 compared to 2.29for order-bound zero and 1.34 compared to 1.54 at order-boundfour.
4.3. Simulating Enculturation4.3.1. Inferential BiasesThe results obtained from contrasting two models with manuallymanipulated prior distributions on an artificially generated testset are summarized in Table 3.
TABLE 3 | A contingency table showing the number of time signature
classifications by a 3/4 biased model and a 6/8 biased model.
3/4 biased
6/8 3/4 2/4 All
6/8 biased 6/8 471 83 40 594
3/4 0 395 0 395
2/4 0 54 1,005 1,059
All 471 532 1,045 2,048
The results shows that both models interpret approximatelyhalf of all rhythms in 2/4. The rightmost column shows that the6/8 biased model interprets more rhythms in 6/8 than in 3/4,while the bottom row shows that the 3/4 biased model interpretsmore rhythms in 3/4 than in 6/8.
The numbers on the diagonal show that both models agreeon the vast majority of interpretations. Both models agree on theinterpretation of rhythms that are classified as 3/4 or 6/8 despiteinferential bias: None of the rhythms that the 3/4 biased modelinterprets as 6/8 are interpreted differently by the 6/8 biasedmodel. Similarly, none of the rhythms that the 6/8 biased modelinterprets as 3/4 are classified differently by the 3/4 biased model.
Frontiers in Psychology | www.frontiersin.org 11 May 2017 | Volume 8 | Article 824

van der Weij et al. A Probabilistic Model of Meter Perception
The numbers off the diagonal show that the greatest degreeof disagreement occurs between the 6/8 and 3/4 categories, butthere is also substantial disagreement between 2/4 and 3/4 and2/4 and 6/8.
There are two categories of rhythms sensitive to inferentialbiases: The first category consists of 83 rhythms that the 6/8biased model interprets in 6/8 while the 3/4 biased modelinterprets them in 3/4. The second category consists of rhythmsthat one model interprets in 2/4 while the other model interpretsthem in the category its biased toward. The 6/8 biased modelinterprets 40 rhythms in 6/8 that the 3/4 biased model interpretsin 2/4. Out of the rhythms classified by the 6/8 biased model as2/4, the 3/4 biased model interprets slightly more rhythms inagreement with its bias (namely 54), than the 6/8 biased modeldoes out of the rhythms classified by the 3/4 biased model as 2/4(namely 40).
4.3.2. Cultural Distance between Chinese and
German RhythmsTable 4 shows average information content and classificationperformance obtained in the simulations of enculturation withGerman or Chinese folksongs. Results from two conditions arereported: one in which the German and Chinese training setshave an identical distribution of metrical categories and one inwhich they have empirical distributions of metrical categories.
In both conditions the results can be said to show effectsof enculturation: The average information content for modelsevaluated on rhythms from the same country as the rhythmsin their training data (culturally familiar) is lower than formodels trained on rhythms from the other country (culturallyunfamiliar). Classification performance shows a similar pattern:in most cases, classification performance is better for modelsevaluated on culturally familiar rhythms. However, in theidentical prior condition, classification performance of theGerman model on the Chinese test set was slightly higher than ofthe Chinese model. Furthermore, in the identical prior condition,the average information content of the Chinese model is lowerwhen evaluated on the German test set compared to the Chinesetest set.
For both models and in both conditions, but most notably inthe identical priors condition, information content of rhythms inthe Chinese test set was slightly higher than that of rhythms inthe German test set.
Figures 4A,B project the rhythms from both test tests ontoa two-dimensional plane. The coordinates of each rhythm aredetermined by the average information content of events in therhythm under the Chinese model (x-axis) and German model(y-axis). Under this projection, rhythms from the two culturesform clusters that are to some degree spatially separated. Thedegree of separation is stronger in the empirical prior condition(Figure 4B). For both conditions, average information content ofevents in a single test set is highly correlated between bothmodels(see Table 5).
5. DISCUSSION
A predictive coding view of perception entails that perceptiondepends on generative models in the mind of the perceiver thatare tuned by statistical properties of the environment, throughevolutionary adaptation and sensory experience, to predict
TABLE 4 | Average information content and classification performance of
models trained and evaluated on test sets with rhythms from Germany
and China.
Training set Test set
Identical priors Empirical priors
German Chinese German Chinese
Information content German 1.21 1.63 1.34 1.72
Chinese 1.32 1.49 1.70 1.49
Classification German 0.84 0.80 0.73 0.72
Chinese 0.59 0.77 0.47 0.75
Results are reported for two different conditions. One in which training sets contain
identical distributions of metrical categories, and one in which training sets contain
empirical distributions of metrical categories.
A B
FIGURE 4 | Scatter plots of the average information content of rhythms for the Chinese and German models. (A) Results for the training and test sets with
fixed distributions of meters. (B) Results for the training and test sets with empirical distributions of meters.
Frontiers in Psychology | www.frontiersin.org 12 May 2017 | Volume 8 | Article 824

van der Weij et al. A Probabilistic Model of Meter Perception
TABLE 5 | Pearson product-moment correlation coefficients between
average information content per rhythm under the German and the
Chinese model, showing the degree to which information-content
assigned to the same rhythms by both models is related.
German test set Chinese test set
Fixed prior 0.74 0.94
Empirical prior 0.86 0.89
sensations. We hypothesized that effects of enculturation on theperception of meter can be understood in terms of predictivecoding. To explore the consequences of this idea, we presenteda probabilistic model of meter perception for which predictivecoding served as the conceptual basis. The underlying hypothesisis that meter perception is the result of a strategy, based onstatistical learning, probabilistic prediction and inference, forincreasing predictive accuracy in processing of temporal eventsin music.
A set of expectations concerning the model’s behavior wasderived based on: the relevance of the model as a cognitivemodel of meter perception, theoretical proposals about therelation between rhythm and meter, the model’s ability to reduceprediction error, and finally the model’s potential to simulateenculturation. To investigate the degree to which the modelmeets these expectations, we ran a series of simulations. Theresults show that the model can infer metrical structure fromrhythms, and that this ability improves when statistical propertiesof the succession of onsets in the metrical context are taken intoaccount. A comparison with a similar model that does not usemetrical inference demonstrates that metrical inference reducesprediction error in predicting the timing of musical events.Finally the results show hypothesized patterns of enculturationwhen models are trained on corpora varying, both naturallyand artificially, in terms of distribution of meters and rhythmicproperties.
The following sections discuss the simulation results in detail.
5.1. Meter Classification and PrecedingContextA model of meter perception can reasonably be expectedto interpret a simple rhythm in a meter that agrees withthe time signature that an educated listener would use whentranscribing that rhythm. The used rhythms were taken fromfolksongs in the Essen folksong collection (Schaffrath andHuron,1995). Despite its possible relevance to determining the timesignature, melodic information was disregarded. This limitationnotwithstanding, cross-validation results indicate that the modelgenerally infers interpretations that agree both in category andphase with annotated time signatures. The best performingmodel configuration interprets rhythms in a time signatureand phase that agrees with annotations in the Essen folksongcollection in 71% of the cases. These classifications were selectedby the model out of a large pool of alternatives. Summing thenumber of possible phases per considered metrical category (seeSection 2) yields 320 possible metrical interpretations. Many of
A B
FIGURE 5 | Two rhythms that result in different orderings of the same
set of mp⊗ bd viewpoint elements. The number-pairs below the notes are
the values of mp⊗ bd. The top number represents the value of the bd
(bar-distance) viewpoint, the bottom number represents the value of the mp
(metrical position; expressed in multiples of an eighth note duration) viewpoint.
The rhythm in (A) is structurally different from the rhythm in (B), but under a
zeroth-order mp ⊗ bd viewpoint, they are indistinguishable.
these categories occur very infrequently in the training data,resulting in a low a priori likelihood for these categories. Ifwe limit interpretations to the four most frequently occurringmetrical categories—4/4, 2/4, 3/4, and 6/8—the number ofinterpretation options reduces to 48.
By varying the model’s order-bound (the amount of precedingevents that inform the prediction of the next event, see Section2.2), we investigated to what degree learning statistical propertiesof the succession of metrical positions in rhythms improved themodel’s performance.
Increasing the order-bound from zero to one yields themost significant improvement in classification performance. Thisfinding is consistent with results obtained by Temperley (2010)in a comparison of six onset-prediction models. Some of thesemodels were metrical, which means they made use of provided(rather than probabilistically inferred) metrical information.Temperley (2010) found that out of the compared models, thetwometrical and context-sensitive models, namely the first-ordermetrical duration model and hierarchical position model, yieldedthe lowest cross-entropy (information content) score.
The performance increase between order bound zero and oneis unsurprising. In a zeroth-order model, events in a rhythm areconditionally independent given a meter. If the meter is known,the probability of the next event only depends on its metricalstatus and is independent of preceding events1. In a zeroth-ordermodel, a rhythm is a “bag of notes”: the order in which notesoccur is irrelevant to the final outcome. However, note-orderbears consequences for the metrical interpretation of a rhythm,as illustrated in Figure 5. The rhythm in Figure 5A is structurallydifferent from the rhythm in Figure 5B, yet under a zeroth-ordermodel using mp⊗ bdmetrical viewpoints (see Section 2.3) theserhythms are indistinguishable.
The results show that classification and predictionperformance, increases further when order-bound is increasedto four. Since this improvement is relatively modest, it remainsto be seen to what extent probabilistic information about thesuccession of multiple events facilitates metrical inference.Perhaps the effect of order-bound would be more pronounced
1The bd viewpoint used in our simulations indirectly introduces minor context
dependency: if its value zero it means that the current note is the first note in the
bar.
Frontiers in Psychology | www.frontiersin.org 13 May 2017 | Volume 8 | Article 824
van der Weij et al. A Probabilistic Model of Meter Perception
for music styles with more complex rhythms than the folksongsused here.
5.2. Metrical Inference Reduces PredictionErrorWe proposed that meter perception may result from predictivecoding: interpreting onsets in a rhythm as the result of agenerative model with different periodic categories (meters),that are inferred from the pattern of onsets itself, may facilitateprediction of future onsets. Interpreting a rhythm in a metricalframework allows a listener to relate the observed events topatterns they observed previously. A computational probabilisticmodel that infers meter to predict the timing of events, suchas the one presented here, should therefore encounter a lowerprediction error in empirical rhythms compared to a similarmodel that does not infer meter.
To evaluate this, we compared prediction performance of thepresented model to an IDyOM model that predicts the eventonset times without using metrical inference. This comparisonseems natural because the presented model implements metricalinference directly on top of IDyOM as explained in Section 2.
Simulations show that the meter inferring model reducesprediction error compared to IDyOM (without metricalinference) under all tested order-bounds. These results supportthe suggestion that inferring meter may improve temporalprediction of events in rhythms.
5.3. Simulating EnculturationThe goals of the simulations concerning enculturationwere to investigate how our model’s behavior is shaped bythe statistical properties of rhythms in its training data,and to investigate the extent to which these statisticalproperties can be exploited to improve the prediction andmetrical interpretation of stylistically similar rhythms.We first explored the consequences of inferential biaseson an artificially constructed set of potentially ambiguousrhythms. Then, we studied the effect of statistical propertiesof sets of rhythms on metrical inference. The results showthat when tested on Chinese rhythms, models trainedon rhythms of Chinese folksongs show better predictionperformance than models trained on German folksongs. Theconverse was true when the models were tested on Germanfolksongs.
This simulation of enculturation should be seen as aproof-of-concept: Patterns of quantized onset times annotatedwith meter are a limited representation of the rich varietyof musical and non-musical experiences that may shapelisteners’ perception of meter. In the musical domain, timbre,polyphony, expressive timing and dynamics are some examplesof aspects not considered by our approach that all couldplausibly form part of the experiences that shape meterperception. Nevertheless, it is possible that monophoniccorpora of rhythms from different cultures can predictsome enculturation effects. The methodology presentedhere is an illustration of how such predictions could bemade.
5.3.1. Inferential BiasesInferential biases were introduced into the model by directlymanipulating the prior distribution, while avoiding differencesin the amount of training examples per metrical category, whichwould influence the results.
We contrasted two models: one with a 6/8 inferential bias,another with a 3/4 inferential bias. The models were evaluated onan artificially constructed test set of rhythms with the potentialfor ambiguity between 3/4 and 6/8. These test rhythms were notannotated, as we intended find the set of rhythms for whichinferential biases could swing the model’s interpretation.
The results show that inferential biases affected thedistribution of interpretations over metrical categories inways that we expected: Each model interpreted more rhythms inthe category corresponding to its bias than the other model. Bothmodels agreed on the interpretation of the majority rhythms.These rhythms contained enough evidence toward a particularinterpretation to override the model’s inferential bias. As weexpected on music theoretic grounds, the 3/4 biased modelswung the interpretation of slightly more rhythms, interpretedin 2/4 by the 6/8 biased model, to a 3/4 interpretation than the6/8 model did out of the set of rhythms interpreted in 2/4 by the3/4 biased model.
Eight rhythms interpreted were interpreted in 3/4 withoutpick up by the 3/4 biased model and in 6/8 without pick upby the 6/8 biased model. These rhythms are shown, by way ofexample, in Figure 6, along with metrical grids contrasting asimple 3/4 interpretation with a compound 6/8 interpretation.That the interpretation of these rhythms could be influenceddepending on inferential bias of the model suggests that they areambiguous (e.g., Figure 6vi), and/or metrically underdetermined(e.g., Figures 6i,iv), or metrically vague, i.e., not stronglysuggesting any interpretation (e.g., Figure 6viii).
5.3.2. Cultural Distance between Chinese and
German RhythmsIn general agreement with the hypotheses presented in Section2.5, the results in Table 4 show that models evaluated on a testset with rhythms from the same country as the rhythms theywere trained on exhibit a lower average per-event informationcontent. The classification scores for models trained on culturallyfamiliar rhythms were also higher compared to models trainedon culturally unfamiliar rhythms, except on the Chinese testset in the identical prior scenario. It could be that rhythms inthe Chinese portion of the Essen folksong collection (Schaffrathand Huron, 1995) were less consistently annotated, but furtherinvestigation is necessary to determine whether this is the case.The pattern of results suggests that the statistical propertiesof Chinese and German rhythms are different, and that thesedifferences can be exploited to optimize prediction and metricalinference on rhythms from one of the countries.
In a recent study comparing recognition memory in NorthAmerican listeners on Turkish classical music and Western artmusic, Demorest et al. (2016) found that rhythmic properties ofmusic did not contribute to an enculturation effect on memoryperformance. At a first sight, these results seem surprising inthe light of earlier studies that did find effects of enculturation
Frontiers in Psychology | www.frontiersin.org 14 May 2017 | Volume 8 | Article 824

van der Weij et al. A Probabilistic Model of Meter Perception
FIGURE 6 | The full set of rhythms interpreted as non-anacrustic 3/4 rhythm by a model with a 3/4 inferential bias and a non-anacrustic 6/8 rhythm by
a model with a 6/8 inferential bias. Each rhythm is shown in dot notation between a compound 6/8 metrical grid (above) and a 3/4 simple metrical grid (below).
The gray bars highlight onsets that fall on beats with different theoretical saliencies in both interpretations. Score transcriptions of the rhythms in 6/8 and 3/4 are
shown above and below the grids.
related to rhythmic organization of music (Hannon and Trehub,2005a,b; Hannon et al., 2012). However, it is possible that whilerhythms are capable of eliciting effects of enculturation, suchrhythms did not occur in the stimuli used by Demorest et al.(2016). Demorest et al. (2016) used a small set of stimuli that werenot specifically selected to contain rhythms likely to elicit an effectof enculturation. The methodology applied in this simulationof enculturation is an example of how probabilistic models ofrhythm perception can be employed to predict which rhythmsare likely to elicit an effect of enculturation.
We hypothesized that fine-tuning of perception to thestatistical properties of musical rhythms in one’s environment ina way that leads to a reduction of prediction-error in rhythmstypical of one’s environment leads to differences in the processingof meter. This idea is closely related to the notion of culturaldistance—the degree to which pitch relations in a musical excerptresemble the pitch relations typical to music from one’s ownculture—introduced recently by Demorest and Morrison (2016).The cultural distance hypothesis (Demorest and Morrison, 2016)states that cultural distance is predictive of various culturallydependent responses such as preference, tension, expectation,and memory. This hypothesis is supported by a series of studieswhere cultural distance of stimulus material was found to affect
memory performance (for an extensive overview, see Morrisonand Demorest, 2009). Demorest and Morrison (2016) proposethat cultural distance could be measured using probabilisticmodels of melodic expectancy, such as IDyOM, that learn thestatistical properties of music from a particular culture. Musicthat is culturally distant from the music such a model is trainedon should be predicted less effectively than culturally familiarmusic. As such, in the context of a cross-cultural study, averageinformation content—the degree to which observed eventsdeviate from one’s expectations—can be seen as an operationaldefinition of cultural distance.
The model presented here can supplement predictions aboutmelodic cultural distance as provided by existing probabilisticmodels, with predictions about rhythmic cultural distance.Cultural distance, as predicted by our probabilistic model, canthen be read directly from Figures 4A,B. If the probabilisticaspects of rhythm learned by the presented model correspondto those implicitly learned by human listeners, then, accordingto the cultural distance hypothesis, rhythms in the top-rightpart of Figures 4A,B should be more difficult to remember forGerman listeners while rhythms in the bottom-right part ofFigures 4A,B should be more difficult to remember for Chineselisteners.
Frontiers in Psychology | www.frontiersin.org 15 May 2017 | Volume 8 | Article 824

van der Weij et al. A Probabilistic Model of Meter Perception
Other culturally dependent responsesmentioned byDemorestand Morrison (2016) such as, expectation, preference, andtension can be potentially linked to information content aswell. Regarding expectation, information content is a directconsequence of predictive failure and has been shown to accountwell for human pitch expectations (Pearce, 2005; Hansen andPearce, 2014). Regarding preference, perceived groove andexperienced pleasure have been hypothesized to depend on theright balance between predictability and unpredictability (Witeket al., 2014). Furthermore, influential proposals have postulatedclose ties between expectation and both emotional responsesto music (Huron, 2006) and musical meaning (Meyer, 1957).Regarding tension, melodic expectation has recently been linkedto expressive performance, which in turn was linked to perceivedtension (Gingras et al., 2015).
5.4. General DiscussionWhile it is commonly assumed that the metrical accent of abeat, as derived from formal hierarchical descriptions of meter(Lerdahl and Jackendoff, 1983), is proportional to the probabilityof onsets at those beats, recent findings by Holzapfel (2015)and London et al. (2016) challenge this view. London et al.(2016) suggested that onset frequency need not be correlated withmetrical accent for effective communication of meter. Instead,they argue, it is the recurrence and stability of rhythmic figuresin the context of specific meters that may play a key role in therelation between rhythm and meter.
The results we presented show that models which takeinto account the preceding context of musical events, thuspossessing the potential to learn the typical unfolding ofmultiple characteristic rhythmic patterns under different meters,are generally better at predicting rhythms and reconstructingannotated meters from note onsets alone. These findings, wewould argue, provide further support for the idea the relationshipbetween rhythm and meter is not only characterized by thedistribution of note onsets, but also by characteristic rhythms andstatistical properties of succession of interval between events.
The model we presented learns a generative model ofrhythms from an annotated corpus. The supervised aspect ofthis approach challenges the cognitive plausibility of our model.Humans develop a feel for meter in their own culture withoutsomeone explicitly informing them about the “right” metricalinterpretation. Nevertheless, situated exposure to rhythm almostalways happens within a context containing an abundance ofmulti-sensory information related to the rhythmic practice.Within the music itself, other instruments, expressive timing anddynamics may provide strong metrical cues. In the environment,being rocked to music as an infant, participating in dancing orobserving other people dance all contribute to the multi-sensorycontext by which rhythm perception is shaped.While not entirelyputting concerns related to the supervised aspect of our approachto rest, metrical annotations in our training data can potentiallybe seen as capturing some of the information communicated insituated exposure to rhythms.
We have only considered event onset times in the presentstudy, but other musical aspects such as melodic repetition areknown influence the perception of meter as well (Hannon et al.,
2004). A full account of meter perception should take theseaspects into account. Our model could be a good starting pointfor such an account: due to the implementation of the model inIDyOM, it is possible to link metrical viewpoints with melodicviewpoints and incorporate melodic aspects into the generativemodel.
Another limitation of the current model is its relativelysimple representation of metrical structure. Time signaturesfall short in capturing the structural complexity of perceivedmeter. The model treats metrical categories as independentgenerative models and structural similarities between metersremain unexploited. The model is limited in its interpretationof rhythms into metrical categories by the categories observedin training data. In future work, we will seek to address theselimitations by extending the model’s representation of metricalstructure.
The model introduced here represents an extension ofprevious work in probabilistic modeling of music (Conklin andWitten, 1995; Pearce, 2005). It is worth pointing out that thepredictive mechanisms on which the model presented here isbased, are domain independent (Pearce and Wiggins, 2004). ThePPM* sequence prediction methods we employ can be applied toany domain that can be represented as structured sequences ofsymbols. Indeed, they were originally proposed in the field of textcompression, but have proven to be useful in cognitive models ofmelodic expectation as well (Pearce, 2005; Pearce and Wiggins,2012).
In summary, we have presented a computational probabilisticmodel meter perception, grounded in a predictive codingperspective of perception. The model has the potential tosimulate musical expectations resulting from the perceptionof meter, shaped by previous exposure. The results showthat the model can interpret simple rhythms in meters thatagree with annotated time signatures and that it generatesthe hypothesized effects of enculturation. Simulations such asthe ones presented here, can be used to generate theoreticalpredictions for cross-cultural studies of rhythm perception.Future research will determine the extent to which the learningprocesses implemented by our model capture aspects of those atwork in human listeners.
AUTHOR CONTRIBUTIONS
BW designed and implemented the model. The model buildson IDyOM, which was designed and implemented by MP; MPand HH improved the model; HH, MP, and BW designed thesimulations; BW performed the research and analyzed the data;BW wrote the paper; HH and MP improved the paper.
FUNDING
HH is supported by a Distinguished Lorentz fellowship grantedby the Lorentz Center for the Sciences and the NetherlandsInstitute for Advanced Study in the Humanities and SocialSciences (NIAS) and a Horizon grant of the NetherlandsOrganization for Scientific Research (NWO). BW and MP also
Frontiers in Psychology | www.frontiersin.org 16 May 2017 | Volume 8 | Article 824

van der Weij et al. A Probabilistic Model of Meter Perception
received support from the EPSRC Digital Music Platform Grantheld at Queen Mary (EP/K009559/1). MP is supported by a grantfrom the UK Engineering and Physical Science Research Council(EPSRC, EP/M000702/1).
ACKNOWLEDGMENTS
We thank the reviewers for their helpful comments whichsignificantly improved the presentation of this work.
REFERENCES
Barlow, H. B. (1961). “Possible principles underlying the transformations
of sensory messages,” in Sensory Communication, ed W. A. Rosenblith
(Cambridge, MA: MIT Press), 217–234.
Bishop, C. M. (2007). Pattern Recognition and Machine Learning. New York, NY:
Springer.
Clark, A. (2013). Whatever next? Predictive brains, situated agents, and the
future of cognitive science. Behav. Brain Sci. 36, 181–253. doi: 10.1017/S0140
525X12000477
Cleary, J. G., and Witten, I. H. (1984). Data compression using adaptive
coding and partial string matching. IEEE Trans. Commun. 32, 396–402.
doi: 10.1109/TCOM.1984.1096090
Conklin, D., and Witten, I. H. (1995). Multiple viewpoint systems for music
prediction. J. New Music Res. 24, 51–73. doi: 10.1080/09298219508570672
Creel, S. C. (2011). Specific previous experience affects perception of harmony
and meter. J. Exp. Psychol. Hum. Percept. Perform. 37, 1512–1526.
doi: 10.1037/a0023507
Creel, S. C. (2012). Similarity-based restoration of metrical information: different
listening experiences result in different perceptual inferences. Cogn. Psychol. 65,
321–351. doi: 10.1016/j.cogpsych.2012.04.004
Demorest, S. M., and Morrison, S. J. (2016). “Quantifying culture: the cultural
distance hypothesis of melodic expectancy,” in The Oxford Handbook of
Cultural Neuroscience 1st Edn., Chapter 12, eds J. Y. Chiao, S.-C. Li, R.
Seligman, and R. Turner (Oxford: Oxford University Press).
Demorest, S. M., Morrison, S. J., Nguyen, V. Q., and Bodnar, E. N. (2016). The
influence of contextual cues on cultural bias in music memory. Music Percept.
33, 590–600. doi: 10.1525/mp.2016.33.5.590
Egermann, H., Pearce, M. T., Wiggins, G. A., and McAdams, S. (2013).
Probabilistic models of expectation violation predict psychophysiological
emotional responses to live concert music. Cogn. Affect. Behav. Neurosci. 13,
533–553. doi: 10.3758/s13415-013-0161-y
Friston, K. J. (2005). A theory of cortical responses. Philos. Trans. R. Soc. Lond. Ser.
B Biol. Sci. 360, 815–836. doi: 10.1098/rstb.2005.1622
Gingras, B., Pearce, M. T., Goodchild, M., Dean, R. T., Wiggins, G. A., and
McAdams, S. (2015). Linking melodic expectation to expressive performance
timing and perceived musical tension. J. Exp. Psychol. Hum. Percept. Perform.
42, 594–609. doi: 10.1037/xhp0000141
Hannon, E. E., Snyder, J. S., Eerola, T., and Krumhansl, C. L. (2004). The role of
melodic and temporal cues in perceiving musical meter. J. Exp. Psychol. Hum.
Percept. Perform. 30, 956–974. doi: 10.1037/0096-1523.30.5.956
Hannon, E. E., Soley, G., and Ullal, S. (2012). Familiarity overrides complexity
in rhythm perception: a cross-cultural comparison of American and
Turkish listeners. J. Exp. Psychol. Hum. Percept. Perform. 38, 543–548.
doi: 10.1037/a0027225
Hannon, E. E., and Trehub, S. E. (2005a). Metrical categories in infancy and
adulthood. Psychol. Sci. 16, 48–55. doi: 10.1111/j.0956-7976.2005.00779.x
Hannon, E. E., and Trehub, S. E. (2005b). Tuning in to musical rhythms: infants
learn more readily than adults. Proc. Natl. Acad. Sci. U.S.A. 102, 12639–12643.
doi: 10.1073/pnas.0504254102
Hansen, N. C., and Pearce, M. T. (2014). Predictive uncertainty in auditory
sequence processing. Front. Psychol. 5:1052. doi: 10.3389/fpsyg.2014.01052
Holzapfel, A. (2015). Relation between surface rhythm and rhythmic modes in
Turkish Makam music. J. New Music Res. 44, 25–38. doi: 10.1080/09298215.
2014.939661
Honing, H. (2013). “Structure and interpretation of rhythm in music,” in The
Psychology of Music, 3rd Edn., ed D. Deutsch (London: Academic Press),
369–404.
Huron, D. B. (1999).Music Research Using Humdrum: A User Guide. Stanford, CA:
Center for Computer Assisted Research in the Humanities.
Huron, D. B. (2006). Sweet Anticipation: Music and the Psychology of Expectation.
Cambridge, MA: The MIT Press.
Lerdahl, F., and Jackendoff, R. (1983). A Generative Theory of Tonal Music.
Cambridge, MA: MIT Press.
Locke, D. (1982). Principles of offbeat timing and cross-rhythm in southern Eve
dance drumming. Ethnomusicology 26, 217–246. doi: 10.2307/851524
London, J. (2012). Hearing in Time, 2nd Edn. New York, NY: Oxford University
Press.
London, J., Polak, R., and Jacoby, N. (2016). Rhythm histograms and musical
meter: a corpus study of Malian percussion music. Psychon. Bull. Rev. 24,
474–480. doi: 10.3758/s13423-016-1093-7
Longuet-Higgins, H. C., and Lee, C. S. (1982). The perception of musical rhythms.
Perception 11, 115–128. doi: 10.1068/p110115
Longuet-Higgins, H. C., and Steedman, M. J. (1971). On interpreting bach. Mach.
Intell. 6, 221–241.
MacKay, D. J. C. (2003). Information Theory, Inference, and Learning Algorithms.
Cambridge, MA: Cambridge University Press.
Manning, C. D., and Schütze, H. (1999). Foundations of Statistical Natural
Language Processing. Cambridge, MA: The MIT Press.
Meyer, L. B. (1957). Meaning in music and information theory. J. Aesthet. Art Crit.
15, 412–424. doi: 10.2307/427154
Moffat, A. (1990). Implementing the PPM data compression scheme. IEEE Trans.
Commun. 38, 1917–1921. doi: 10.1109/26.61469
Morrison, S. J., and Demorest, S. M. (2009). “Cultural constraints on music
perception and cognition,” in Cultural Neuroscience: Cultural Influences on
Brain Function, vol. 178 of Progress in Brain Research, ed J. Y. Chiao
(Amsterdam: Elsevier), 67–77.
Olshausen, B. A., and Field, D. J. (1996). Emergence of simple-cell receptive field
properties by learning a sparse code for natural images. Nature 381, 607–609.
doi: 10.1038/381607a0
Omigie, D., Pearce, M. T., and Stewart, L. (2012). Tracking of pitch
probabilities in congenital amusia. Neuropsychologia 50, 1483–1493.
doi: 10.1016/j.neuropsychologia.2012.02.034
Omigie, D., Pearce, M. T., Williamson, V. J., and Stewart, L. (2013).
Electrophysiological correlates of melodic processing in congenital amusia.
Neuropsychologia 51, 1749–1762. doi: 10.1016/j.neuropsychologia.2013.05.010
Palmer, C., and Krumhansl, C. L. (1990). Mental representations for
musical meter. J. Exp. Psychol. Hum. Percept. Perform. 16, 728–741.
doi: 10.1037/0096-1523.16.4.728
Pearce, M. T. (2005). The Construction and Evaluation of Statistical Models of
Melodic Structure in Music Perception and Composition. Ph.D. thesis, City
University, London.
Pearce, M. T., Conklin, D., and Wiggins, G. A. (2005). “Methods for combining
statistical models of music,” in Computer Music Modeling and Retrieval: Second
International Symposium, CMMR 2004 (Esbjerg, Denmark), Revised Papers
(Berlin; Heidelberg: Springer), 295–312. doi: 10.1007/978-3-540-31807-1_22
Pearce, M. T., Müllensiefen, D., and Wiggins, G. A. (2010). The role
of expectation and probabilistic learning in auditory boundary
perception: a model comparison. Perception 39, 1367–1392. doi: 10.1068/
p6507
Pearce, M. T., and Wiggins, G. A. (2004). Improved methods for statistical
modelling of monophonic music. J. New Music Res. 33, 367–385. doi: 10.1080/
0929821052000343840
Pearce, M. T., and Wiggins, G. A. (2012). Auditory expectation: the information
dynamics of music perception and cognition. Top. Cogn. Sci. 4, 625–652.
doi: 10.1111/j.1756-8765.2012.01214.x
Frontiers in Psychology | www.frontiersin.org 17 May 2017 | Volume 8 | Article 824

van der Weij et al. A Probabilistic Model of Meter Perception
Rao, R. P. N., and Ballard, D. H. (1999). Predictive coding in the visual cortex:
a functional interpretation of some extra-classical receptive-field effects. Nat.
Neurosci. 2, 79–87. doi: 10.1038/4580
Savage, P. E., Brown, S., Sakai, E., and Currie, T. E. (2015). Statistical universals
reveal the structures and functions of humanmusic. Proc. Natl. Acad. Sci. U.S.A.
112, 8987–8992. doi: 10.1073/pnas.1414495112
Schaffrath, H., and Huron, D. (1995). The Essen Folksong Collection in the
Humdrum Kern Format. Menlo Park, CA: Center for Computer Assisted
Research in the Humanities.
Smith, E. C., and Lewicki, M. S. (2006). Efficient auditory coding. Nature 439,
978–982. doi: 10.1038/nature04485
Stobart, H., and Cross, I. (2000). The Andean anacrusis? Rhythmic structure and
perception in Easter songs of Northern Potosí, Bolivia. Br. J. Ethnomusicol. 9,
63–92. doi: 10.1080/09681220008567301
Temperley, D. (2004). An evaluation system for metrical models. Comput. Music J.
28, 28–44. doi: 10.1162/0148926041790621
Temperley, D. (2007).Music and Probability. Cambridge, MA: MIT Press.
Temperley, D. (2009). A unified probabilistic model for polyphonic
music analysis. J. New Music Res. 38, 3–18. doi: 10.1080/09298210902
928495
Temperley, D. (2010). Modeling common-practice rhythm. Music Percept. 27,
355–376. doi: 10.1525/mp.2010.27.5.355
Vuust, P., andWitek, M. A. G. (2014). Rhythmic complexity and predictive coding:
a novel approach to modeling rhythm and meter perception in music. Front.
Psychol. 5:1111. doi: 10.3389/fpsyg.2014.01111
Witek, M. A. G., Clarke, E. F., Wallentin, M., Kringelbach, M. L., and Vuust,
P. (2014). Syncopation, body-movement and pleasure in Groove music. PLoS
ONE 9:e94446. doi: 10.1371/journal.pone.0094446
Conflict of Interest Statement: The authors declare that the research was
conducted in the absence of any commercial or financial relationships that could
be construed as a potential conflict of interest.
Copyright © 2017 van der Weij, Pearce and Honing. This is an open-access
article distributed under the terms of the Creative Commons Attribution License
(CC BY). The use, distribution or reproduction in other forums is permitted,
provided the original author(s) or licensor are credited and that the original
publication in this journal is cited, in accordance with accepted academic practice.
No use, distribution or reproduction is permitted which does not comply with these
terms.
Frontiers in Psychology | www.frontiersin.org 18 May 2017 | Volume 8 | Article 824