a pregnant pause economic prospects for the remainder of 2008 carl r. tannenbaum economic consultant...
TRANSCRIPT
A Pregnant Pause
Economic Prospects forthe Remainder of 2008
Carl R. TannenbaumEconomic [email protected]

Pregnant Pause, April 2008
Let’s Not Forget:Things Haven’t Been That Bad!Quarterly Change in US GDP, Annualized
“Potential”
-2%
0%
2%
4%
6%
8%
2001 2002 2003 2004 2005 2006 2007

Pregnant Pause, April 2008
Expansions: Not Always Smooth Sailing
-2%
0%
2%
4%
6%
1985 1989 1993 1997 2001 2005
Year over Year Growth in Real GDP
• Growth recessions punctuated the long expansions of the ’80s and ’90s

Pregnant Pause, April 2008
The Housing CorrectionTrends in Home Sales
4
5
6
7
8
Jan-02 Jan-03 Jan-04 Jan-05 Jan-06 Jan-07 Jan-08
(Mill
ions
, SAAR
)
Existing New
Sources: National Association of Realtors, National Association of Home Builders
Pregnant Pause, April 2008
3
4
5
6
7
8
9
10
11
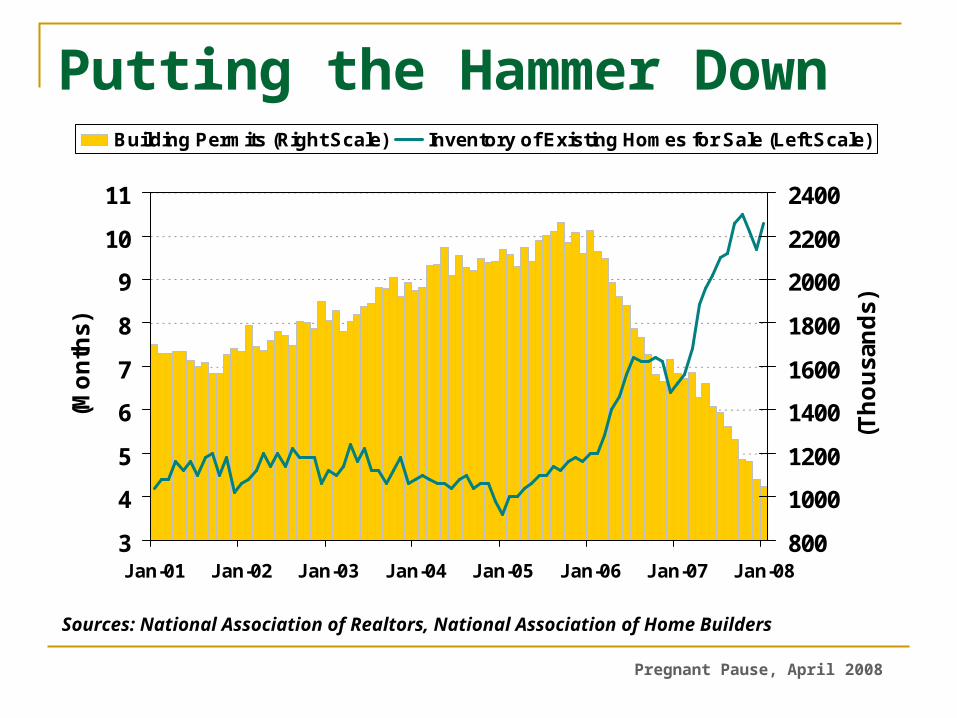
Jan-01 Jan-02 Jan-03 Jan-04 Jan-05 Jan-06 Jan-07 Jan-08
(Mo
nth
s)
800
1000
1200
1400
1600
1800
2000
2200
2400
(Th
ou
san
ds)
Building Permits (Right Scale) Inventory of Existing Homes for Sale (Left Scale)
Putting the Hammer Down
Sources: National Association of Realtors, National Association of Home Builders
Pregnant Pause, April 2008
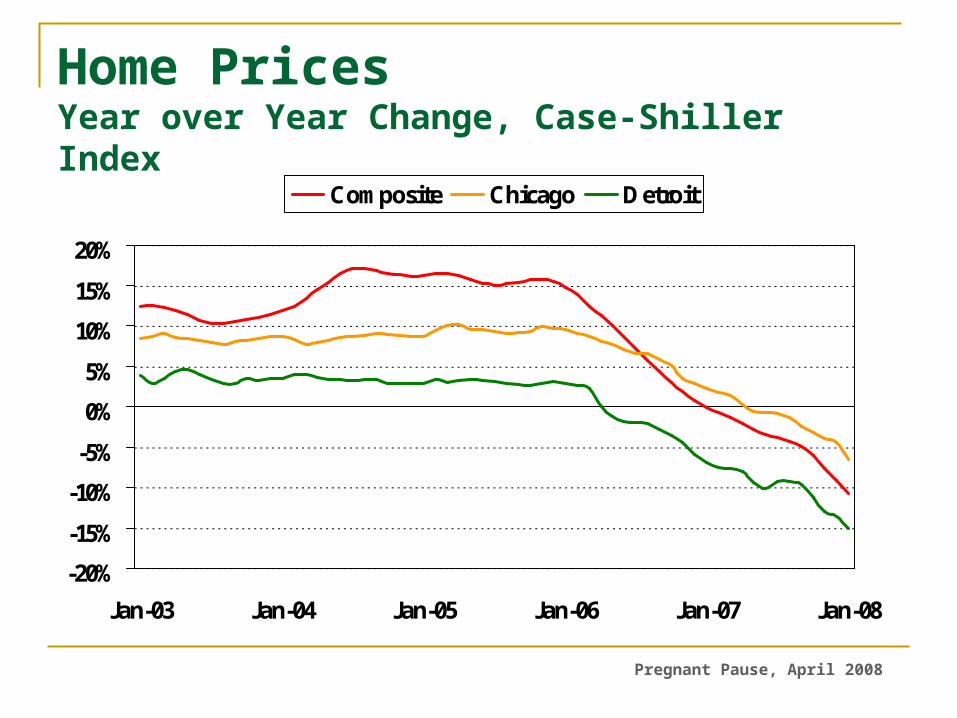
Home PricesYear over Year Change, Case-Shiller Index
-20%
-15%
-10%
-5%
0%
5%
10%
15%
20%
Jan-03 Jan-04 Jan-05 Jan-06 Jan-07 Jan-08
Composite Chicago Detroit

Pregnant Pause, April 2008
FICO ScoresWeighted Average of FICO Scores for Total Originations
660
670
680
690
700
2002 2003 2004 2005 2006

Pregnant Pause, April 2008
ARM Share of new originations
0%
5%
10%
15%
20%
25%
30%
35%
40%
Jan-00 Jan-01 Jan-02 Jan-03 Jan-04 Jan-05 Jan-06 Jan-07

Pregnant Pause, April 2008
Past Their PrimeHome mortgages 30 or more days past due
Source: Mortgage Bankers Association

Pregnant Pause, April 2008
-40
-20
0
20
40
60
80
100
1990 1993 1996 1999 2002 2005 2008
All Mortgages Prime Nontraditional Subprime
Senior Loan Officer Survey: Home MortgagesNet Percentage of Respondents Tightening Credit
Source: Federal Reserve
Highest on record

Pregnant Pause, April 2008
Views on Sub-Prime
Not a complete disaster, but some very questionable practices
Break in housing prices causes contagion to other mortgage segments
A wake-up call for borrowers and lenders
Losses: $200 billion; widely dispersed

Pregnant Pause, April 2008
Borrowers
FinancialIntermediaries
Investors
The Modern Financial Reality
Pregnant Pause, April 2008
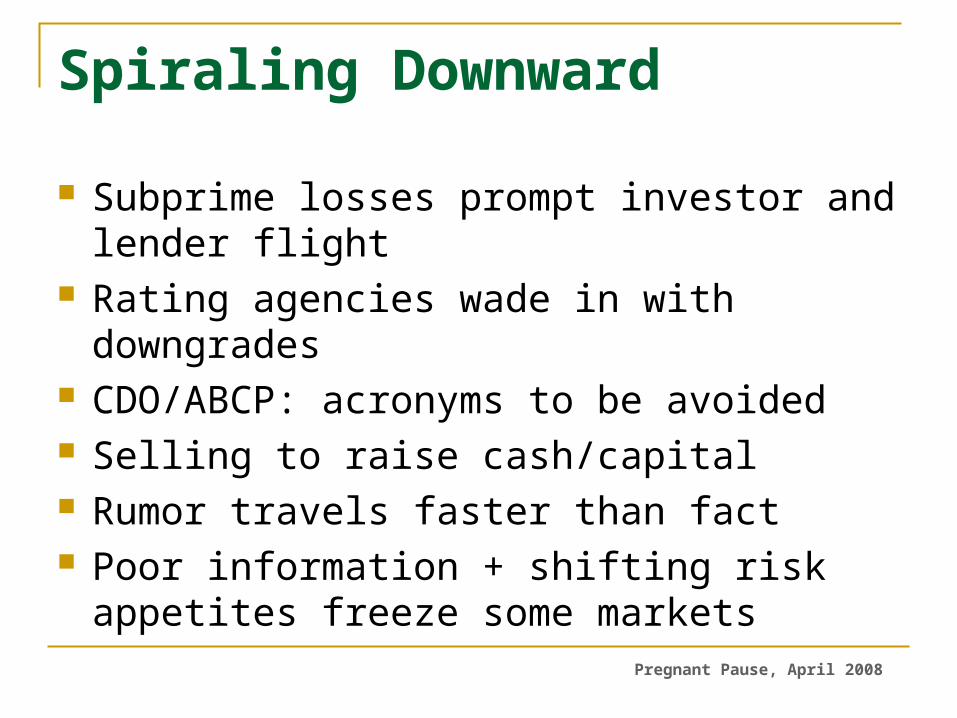
Spiraling Downward
Subprime losses prompt investor and lender flight
Rating agencies wade in with downgrades CDO/ABCP: acronyms to be avoided Selling to raise cash/capital Rumor travels faster than fact Poor information + shifting risk appetites
freeze some markets

Pregnant Pause, April 2008
Corporate CreditworthinessComposite of Credit Default Swaps
20
40
60
80
100
120
140
160
180
200
Apr-07 Jul-07 Oct-07 Jan-08
(Bas
is P
oint
s)
Source: Bloomberg

Pregnant Pause, April 2008
New Debt Issues
0
100
200
300
400
500
600
700
$$ B
illions
2006 2007
Municipal
Treasury
Mortgage
Corporate
Agency
Asset-Backed
Source: SIFMA

Pregnant Pause, April 2008
Source: Federal Reserve
Commercial and Industrial LoansAll Commercial Banks
900
1000
1100
1200
1300
1400
1500
Jan '05 Jul '05 Jan'06 Jul '06 Jan '07 Jul '07 Jan '08
$$ B
illions
Annualized Growth: 13%
Annualized Growth: 27%

Pregnant Pause, April 2008
Tightening the Vise?
Rating Agencies
Congress
Bond Insurers
Regulators?

Pregnant Pause, April 2008
Senior Loan Officer Survey: Commercial Real EstateNet Percentage of Respondents Tightening Credit
-40
-20
0
20
40
60
80
100
1990 1993 1996 1999 2002 2005 2008
Source: Federal Reserve
-40
-20
0
20
40
60
80
100
1990 1993 1996 1999 2002 2005 2008
-40
-20
0
20
40
60
80
100
1990 1993 1996 1999 2002 2005 2008
-40
-20
0
20
40
60
80
100
1990 1993 1996 1999 2002 2005 2008
Highest on record

Pregnant Pause, April 2008
Impacts on Venture Capital/Private Equity Difficult to raise debt; difficult to sell companies
— Capital more costly or simply unavailable— Covenants tighter
More inward focus: managing existing deals as opposed to seeking new ones
Smaller deals, more minority interest Robin Hood economics: the discussion of
carried interest More restrictions just when we need fresh
capital the most?!

Pregnant Pause, April 2008
Signs of Investor ConservatismMoney Market Fund Assets
1000
1500
2000
2500
3000
3500
4000
2004 2005 2006 2007 2008
($$
Bill
ions
)
Source: ICI
US Treasury Yield Curve
0%
1%
2%
3%
4%
5%
6%
3 mo 6 mo 2 Yr 5 Yr 10 Yr 30 Yr
Maturity
Jun-07 Apr-08
Source: Bloomberg
• This money will eventually have to go back to work!

Pregnant Pause, April 2008
Conclusions: Credit
We’re working to avoid a credit crunch Wall Street firms remain under stress; high
vulnerability to event risk Effect on community banks has been limited,
but translation from Wall Street down to Main Street is possible
We’re seeing the downside of the modern financial markets

Pregnant Pause, April 2008
Real Personal ConsumptionYear over Year Change
0.0%
1.0%
2.0%
3.0%
4.0%
2004 2005 2006 2007 2008

Pregnant Pause, April 2008
Employment Trends
-100
0
100
200
300
400
Jan-05 Jan-06 Jan-07 Jan-08
(Th
ou
san
ds)
4.0%
4.5%
5.0%
5.5%
6.0%
Change in Payrolls (Left Scale) Unemployment Rate (Right Scale)
Source: Bureau of Labor Statistics

Pregnant Pause, April 2008
Mr. Bernanke’s Big Test
• Doesn’t want to reward Doesn’t want to reward reckless behaviorreckless behavior
• Expansion is less secureExpansion is less secure
• Inflation above comfort Inflation above comfort zonezone
• The financial system came The financial system came close to melting downclose to melting down
Tough choices, but pulling Tough choices, but pulling out all stopsout all stops
Pregnant Pause, April 2008
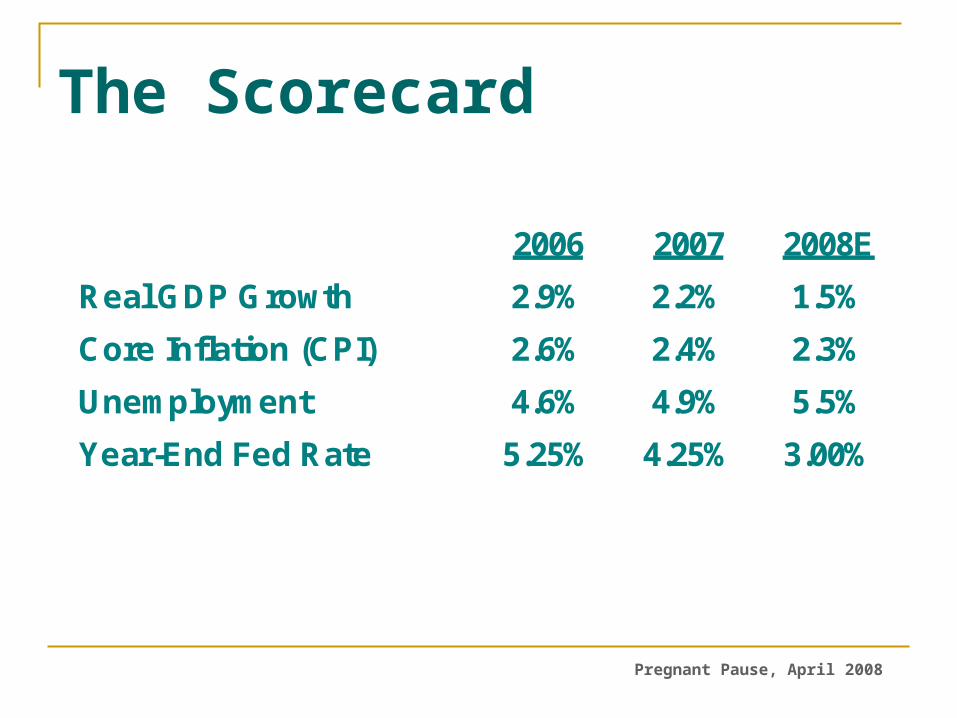
The Scorecard
2006 2007 2008E
Real GDP Growth 2.9% 2.2% 1.5%
Core Inflation (CPI) 2.6% 2.4% 2.3%
Unemployment 4.6% 4.9% 5.5%
Year-End Fed Rate 5.25% 4.25% 3.00%
Pregnant Pause, April 2008
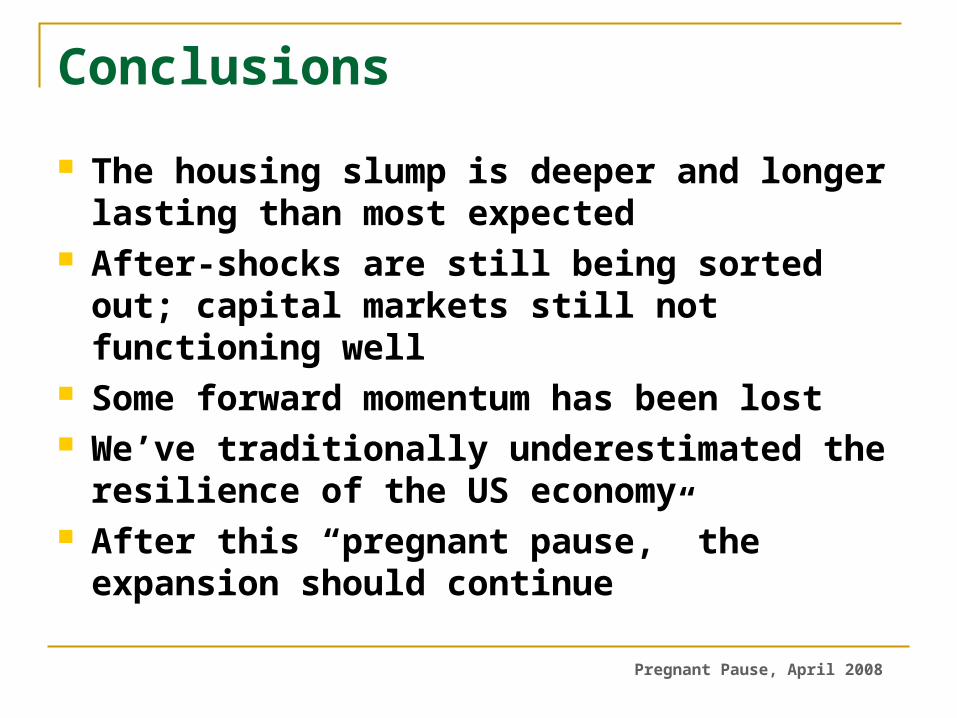
Conclusions
The housing slump is deeper and longer lasting than most expected
After-shocks are still being sorted out; capital markets still not functioning well
Some forward momentum has been lost We’ve traditionally underestimated the
resilience of the US economy After this “pregnant pause,” the expansion
should continue

A Pregnant Pause
Economic Prospects forthe Remainder of 2008
Carl R. TannenbaumEconomic [email protected]