a pre-investigation on the saving …eidergisi.istanbul.edu.tr/sayi12/iueis12m5.pdfa...
TRANSCRIPT

A PRE-INVESTIGATION ON THE SAVING
BEHAVIOUR OF THE EUROPEAN AREA: A ROBUST CLASSIFICATION ON THIS ISSUE
Özlem YORULMAZ* Oya EKİCİ**
Abstract
Keywords: Life-cycle savings model, outlying European countries for saving structure comparison, robust outlier detection. Jel Classification: E21, J11, N34, C19
__________________________________________________________________________________________ Özet
Anahtar Kelimeler: Yaşam boyu tasarruf modeli, tasarruf yapısı karşılaştırmasına göre aykırı Avrupa ülkeleri, dayanıklı aykırı gözlem teşhisi. Jel Sınıflaması: E21,J11,N34,C19
* Arş. Gör. Dr., İstanbul Üniversitesi, İktisat Fakültesi, Ekonometri Bölümü, E-Mail: [email protected] ** Arş. Gör. Dr., İstanbul Üniversitesi, İktisat Fakültesi, Ekonometri Bölümü, E-Mail: [email protected]
Saving behaviours of countries are shaped with the effects of the some elements as social policies, age structures, cultures, and so forth. Inherently these elements change country to country. Since the possible European countries saving behaviour variation can be seen as a striking issue, the paper aims to explore and classify the different structured countries. For the purpose the classification process is based on Modigliani’s life-cycle model and performed with robust approach. .
Ülkelerin tasarruf davranışları sosyal politikalar, yaş yapısı, kültür ve bunun gibi bazı unsurların etkisiyle şekillenir. Doğal olarak bu farklılıklar ülkeden ülkeye değişmektedir. Zira Avrupa ülkelerinin olası tasarruf yapısı değişikliği dikkat çekici bir konu olarak görülebileceğinden, bu çalışma farklı yapıdaki ülkelerin incelenmesi ve sınıflandırılmasını amaçlar. Bu sebeple, sınıflama süreci dayanıklı yaklaşım çerçevesinde Modigliani’nin yaşam boyu hipotezine dayandırılmıştır.
İSTANBUL ÜNİVERSİTESİ İKTİSAT FAKÜLTESİ
EKONOMETRİ VE İSTATİSTİK DERGİSİ Ekonometri ve İstatistik Sayı:12 2010 89–101

A Pre-Inv. on Sav. Beh. of Euro. Area: A Robust Class.
90
1. INTRODUCTION
Mostly, national characteristics of countries are distinct from the each others and this
natural result causes their savings behaviour variation. Actually the factors on these
distinctions also can be counted in details; impact of culture, economic, demographic and
institutional factors so forth. Instead analyzing in details and classifying according to these
hardly measurable factors, the groups that the countries constituted are diagnosed here with an
appropriate econometric technique.
Policy makers plan future steps of government and make decisions by considering
some macroeconomic indicators and they submit their policies based on these macroeconomic
variables. Hence sometimes immeasurable effects like behaviours appear as a key stress on
the subject. The subject studied here can provide policy makers a point of view that helps
their decision making on saving, for instance decision of a union, international trade or
actuarial studies so forth.
In studying countries’ savings, the model that we adopted is based on life cycle
hypothesis. According to the conventional life-cycle savings hypothesis, a rational individual
adopts a lifetime consumption plan that balances the utility gained from acquiring additional
investment assets against expenditures on current consumption across all stages of the life-
cycle (Ando & Modigliani, 1963). Economic agents in this model are assumed to save part of
their disposable income during the period before retirement, and consume from the
accumulated wealth during retirement. Besides the significant need of income variable,
involving the population age structure is also a must for a saving model. Here by considering
these both determinants, in 1980 a study was carried out by Belsey, Kuh and Welsch about to
different countries from all over the world from 1960 to 1970. This paper puts the need to
similar study for European countries with current data to examine saving behaviour cross-
countries.
Through the prior knowledge of included European countries’ possible dissimilar
socioeconomic pattern, which might have meaning possible existence of outlier observations
that are far from rest of them, we applied robust analysis as a supplement to the study of
Belsey et al.
Ekonometri ve İstatistik Sayı:12 2010
91
For that study, Belsey et al. used standard OLS analysis to diagnose outliers with
classical diagnostics, but it is known that OLS analysis has 0-zero breakdown value (means
that an arbitrarily small percentage of deviant observations can change the OLS estimations to
any value at all from to (Asad et al, 2001)). This defect leads us to prefer to use
robust regression analysis for avoiding some distortion effects in OLS estimates. Thus, in this
presented study we adopted more effective estimation technique to diagnose outliers.
The data contain 27 different European countries’ numbers from 1990 to 2006. Here
we should remark that we took the median value of all variables for the period. So, the model
that is of the interest;
iiiiii AGEAGERDPIRDPIGNSR )65()15( 43210 (1)
where the response variable GNSR is gross national savings rate and the regressors are
respectively real disposable income, changing real disposable income from year to year,
average percentage of population under 15, and average percentage of population over
2. LIFE-CYCLE SAVINGS HYPOTHESIS
The life-cycle theory was developed by Modigliani, Ando and Brumberg. The life-
cycle hypothesis views individuals, instead, as planning their consumption and saving
behaviour over long periods with the intention of allocating their consumption in the best
possible way over their entire lifetimes. So the life-cycle hypothesis views savings as
resulting mainly from individuals’ desires to provide for consumption in old age. Within this
context, we can state the consumption function as;
LNH bYaWC (2)
where NHW is nonhuman wealth, a is mpc* ( marginal propensity to consume) of
wealth, LY is labor income, and b is the mpc of labor income. In other words, they determine
two different incomes; employment and asset income. As it is seen both have different mpc
* The marginal propensity to consume (mpc) is measured as the ratio of the change in consumption to the change in income.
A Pre-Inv. on Sav. Beh. of Euro. Area: A Robust Class.
92
and actually habits and interest rate determine it. Though there are difficulties associated with
the measurement of them.
To simplify the hypothesis, the following assumptions are made; Income is constant
during the working life. A temporary change in income doesn’t change the consumption. So
consumption is consistent along lifetime. People distribute their income among the
consumption and investment to maximize their economic welfare or utility. People generally
save while working and then use these savings to finance spending in their retirement years.
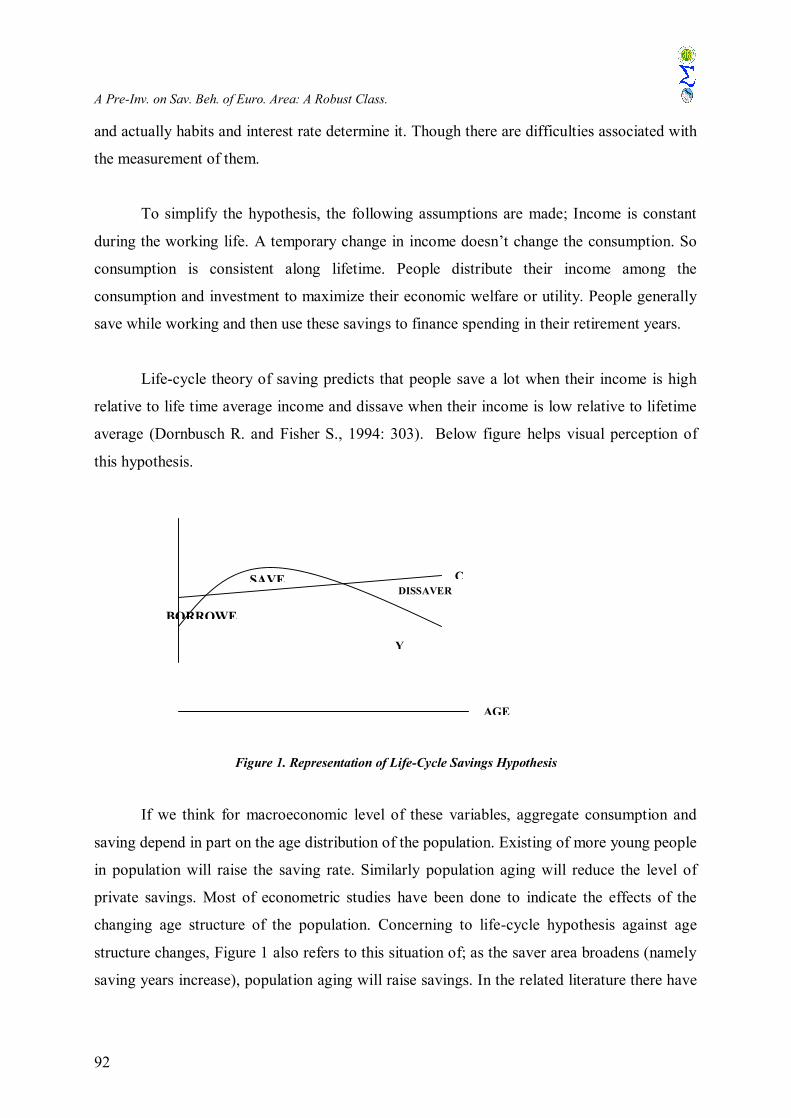
Life-cycle theory of saving predicts that people save a lot when their income is high
relative to life time average income and dissave when their income is low relative to lifetime
average (Dornbusch R. and Fisher S., 1994: 303). Below figure helps visual perception of
this hypothesis.
Figure 1. Representation of Life-Cycle Savings Hypothesis
If we think for macroeconomic level of these variables, aggregate consumption and
saving depend in part on the age distribution of the population. Existing of more young people
in population will raise the saving rate. Similarly population aging will reduce the level of
private savings. Most of econometric studies have been done to indicate the effects of the
changing age structure of the population. Concerning to life-cycle hypothesis against age
structure changes, Figure 1 also refers to this situation of; as the saver area broadens (namely
saving years increase), population aging will raise savings. In the related literature there have
BORROWE
SAVEDISSAVER
C
Y
AGE

Ekonometri ve İstatistik Sayı:12 2010
93
placed some studies of Horioka (1997), Thornton (2001), Ekici and Yorulmaz (2008), in
which the age structure and saving rate relation were investigated.
Beyond these settlements, one of the further studies of Modigliani (1986) provides a
good review of the theory of the determinants of individual and national thrift. In this study he
claims that saving rate is independent of its per-capita income.
Aggregate saving also depends on such characteristics of the economy as the average
age of retirement and presence or absence of a social security program. Sun (2001)
emphasized private pension and social security effects on savings. So it would be challenging
to add model these two factors as variables that reflect the income and health care policies of
countries. But the original version of the model is followed.
We used “gross national savings” variable instead of “personal savings” and
justification for this preference can be stated like this; as Attanasio and Székely (2000)
pointed out, especially micro data is affected by severe measurement problems. Due to
measuring different items or elements, this kind of studies lead reader to conceptual
confusion. For instance, the differences in the definition of consumption, income and
differences in the population of reference all prevent a direct comparison between aggregate
measures of saving rates and measures derived from micro sources.
We met the similar situation during the data collection. In the National Accounts of
many developing countries national saving is not disaggregated into private and public, and,
even available, private saving is not divided between households and corporate. On the other
hand, in the few micro data sources available, data on asset ownership, entitlements to
pensions and so on. Thus, matching aggregate private saving to micro data is not easy. Even if
one thinks that households are the ultimate owners of corporations and assumes that they are
able to “pierce the corporate veil,” aggregate private saving and micro data may differ if
foreign investors own some firms. (Attanasio, O. and Székely M., 2000).

A Pre-Inv. on Sav. Beh. of Euro. Area: A Robust Class.
94
3. METHOD
The Classification of European countries is based on outlier maps that are proposed in
Rousseeuw and Van Zomeren’s (1990) study. The drawings of these maps consist of the
residuals obtained from regression and the distances of observations. At this point, the
classical or robust method decision causes to emerge dissimilar classification results.
The standard OLS estimator is widely used in regression analysis due to its
computational ease. Unfortunately, it is quite sensitive to outliers and other deviations from
the standard linear regression model. One of the assumptions of OLS estimator is identically
and independently distributed errors. However this assumption may not be ensured when the
data contain outliers. An outlier is an observation that lies outside of the overall pattern of the
other observations. The risk of outliers to the standard OLS estimation is that they can have a
strong adverse effect on the estimations, and then estimations can be biased and inefficient.
In low dimensional data it is possible to notice outliers but in high dimensional data, outliers
might not be noticed visibly.
An observation can be an outlier in vertical (y direction), in horizontal (x direction) or
both. Outliers in the x space are also referred as leverage points; they can affect the regression
model. Outliers in the y direction have large residuals. Observations that lie far from the mass
of the x have high leverage, they have a significant influence on the OLS regression
coefficients. Observations that are close to the centre have a little leverage effect; they do not
considerably affect the shape of the regression relationship.
As is known robust regression is an important technique for analyzing data that are
contaminated with outliers and it provides resistant results and gives a possibility to detect
outliers. In order to give resistant estimations, the technique limits the influence of outliers.
One of the simple robust regression methods is Least Absolute Deviations (LAD) but it is
not protective against outliers in the x direction. Huber introduced M estimation (1973) for
regression, but when the data contain outliers in the x direction, the method has no advantage
over least squares.
Ekonometri ve İstatistik Sayı:12 2010
95
Rousseeuw (1984) developed the first robust regression estimators, least median
squares (LMS) and least trimmed squares (LTS). Both are high breakdown estimators which
mean it still maintains its robustness in the case of contamination.
There are several other robust regression methods but we will not mention here. LTS
technique has better statistical efficiency; it is not easily endangered by the contamination of
data. Furthermore it can serve as a diagnostic tool to detect outliers. LTS regression is based
on the subset of h cases (out of n) whose least squares fit possesses the smallest sum of
squared residuals.
h
inieMin
1:
2 ))ˆ((
The coverage h may be set between n/2 and n.
As mentioned before, Rousseeuw and Van Zomeren (1990) proposed a figure to detect
outliers (shows the classification of data into groups of regular observations, bad leverage
points, good leverage points, and vertical outliers), they calculated robust distances with
minimum volume ellipsoid. But since Minimum Covariance Determinant Estimator (MCD)
and LTS are more advantageous in terms of efficiency the figure improved with them.
The good leverage points allow obtaining the regression estimation with high
precision. The bad leverage points and vertical outliers may strongly affect the OLS
estimation and even they can change the slope.
4. DATA AND FINDINGS
As mentioned above the study covers European countries listed here as Austria,
Azerbaijan, Belgium, Bulgaria, Croatia, Check Republic, Denmark, Finland, France,
Germany, Greece, Hungary, Ireland, Italy, Netherlands, Norway, Poland, Portugal, Romania,
Russia, Slovakia, Spain, Sweden, Switzerland, Turkey, Ukraine, United Kingdom.
By use of these observations, the proposed map -mentioned in section 3- was drawn
according to the classical and robust approaches. Equation (1) was decisive for these
approaches. Firstly, least squares estimation method was used to obtain this relation and
reached the following;
A Pre-Inv. on Sav. Beh. of Euro. Area: A Robust Class.
96
iiiii AGEAGERDPIRDPIGNSR )65(7223.0)15(2432.09207.000001.01794.38 (3)
Classical residuals and mahalonobis distances were derived from the estimated
parameters of equation (3). And by means of both residuals and distances, LS Regression
Outlier Map was formed. Afterwards, LTS estimation method used and the same steps were
followed to obtain robust residuals and distances. The estimation of robust regression
equation is as below;
iiiii AGEAGERDPIRDPIGNSR )65(6135.0)15(3808.01974.000001.04425.38 (4)
The coefficients of equations (3) and (4) give almost the similar results with Belsey et
al. That means, the signs of the coefficients are as expected and the theory is verified.
However, the classification is of the main interest of the paper, we give further details on
mapping.
In the section that the method was declared, outlier(s) maps that will be used in
categorization are based on regression residuals and observations’ distances. These maps are
drawn by using Matlab package LIBRA. In the vertical axes of these drawings, the bounds for
residuals are determined with standard values (- 2,5) and (+ 2,5); and in the horizontal axes of
it, the bound for Mahalanobis / robust distances is determined according to the related critical
value of 2 .
To show comparative advantage of robust analysis we preferred to start with reporting
the classical outlier map.
Ekonometri ve İstatistik Sayı:12 2010
97
0 0.5 1 1.5 2 2.5 3 3.5 4
-4
-3
-2
-1
0
1
2
3
4
Germany
Azerbajian
Turkey
Sta
ndar
dize
d LS
resi
dual
Mahalanobis distance
LS Regression Outlier Map
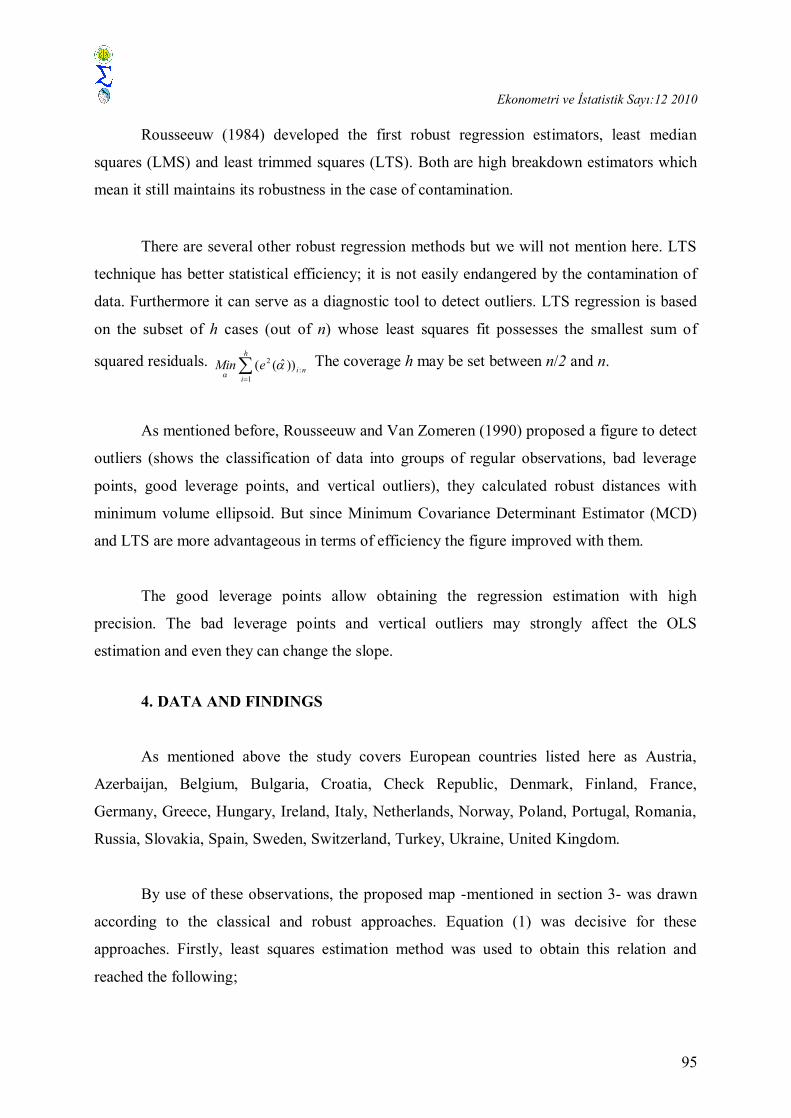
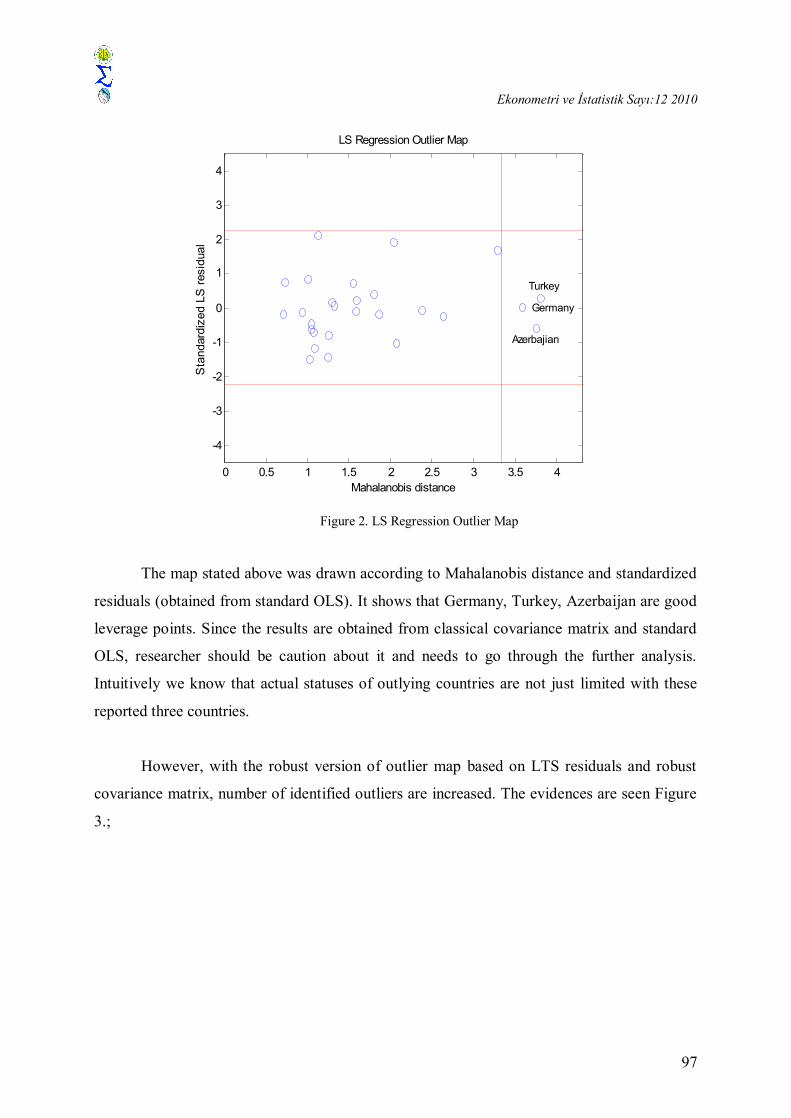
Figure 2. LS Regression Outlier Map
The map stated above was drawn according to Mahalanobis distance and standardized
residuals (obtained from standard OLS). It shows that Germany, Turkey, Azerbaijan are good
leverage points. Since the results are obtained from classical covariance matrix and standard
OLS, researcher should be caution about it and needs to go through the further analysis.
Intuitively we know that actual statuses of outlying countries are not just limited with these
reported three countries.
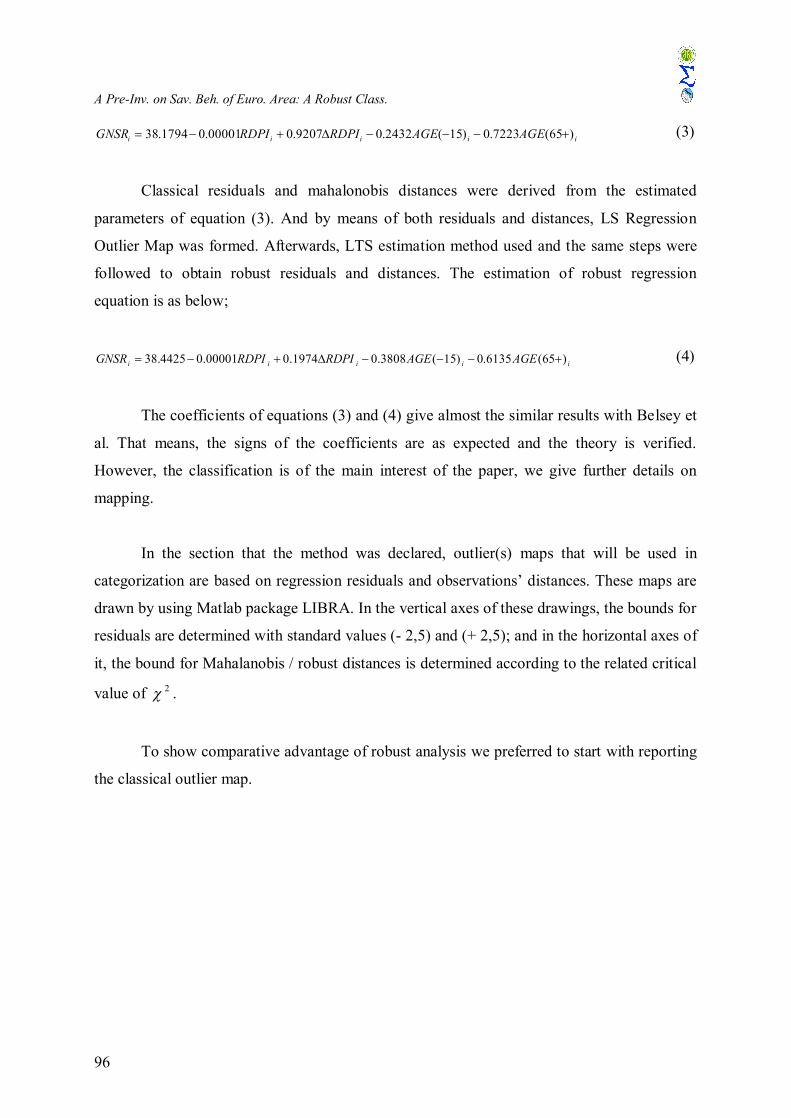
However, with the robust version of outlier map based on LTS residuals and robust
covariance matrix, number of identified outliers are increased. The evidences are seen Figure
3.;
A Pre-Inv. on Sav. Beh. of Euro. Area: A Robust Class.
98
0 2 4 6 8 10 12 14
-4
-3
-2
-1
0
1
2
3
4
5
Spain
Italy
United Kingdom
Azerbajian
Turkey
France Germany
Switzerland
NorwayRussia
Sta
ndar
dize
d LT
S re
sidu
al
Robust distance computed by MCD
LTS Regression Outlier Map
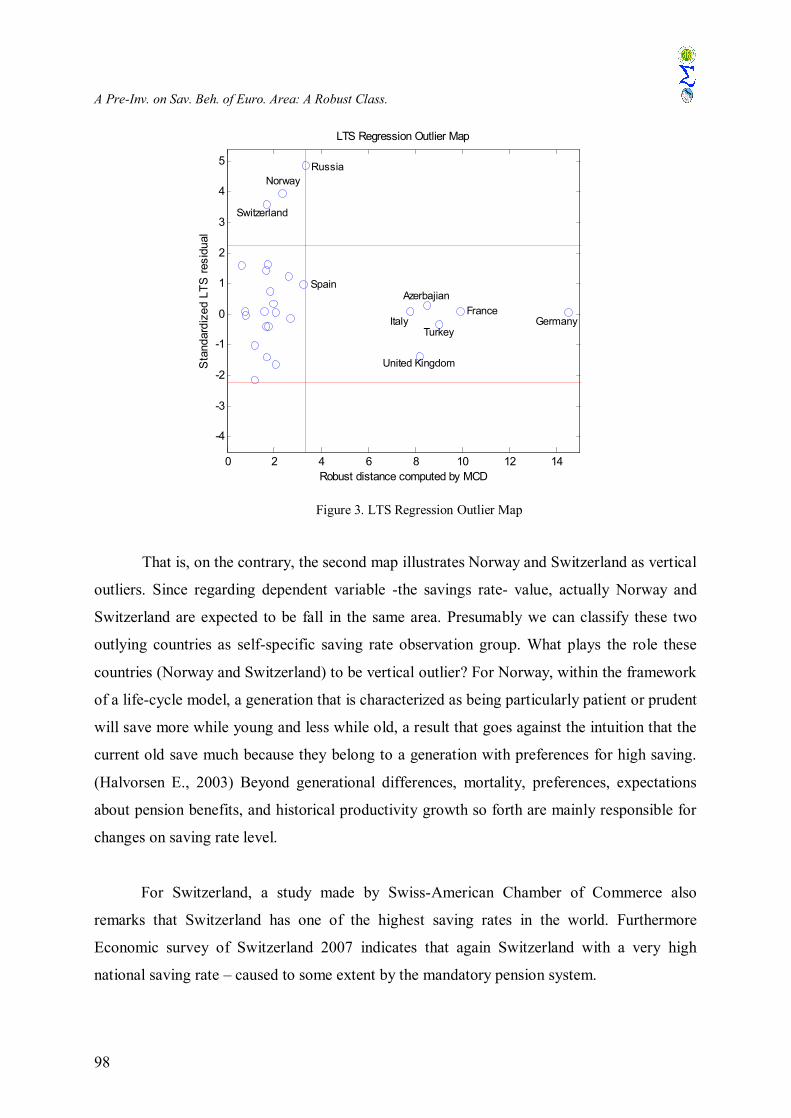
Figure 3. LTS Regression Outlier Map
That is, on the contrary, the second map illustrates Norway and Switzerland as vertical
outliers. Since regarding dependent variable -the savings rate- value, actually Norway and
Switzerland are expected to be fall in the same area. Presumably we can classify these two
outlying countries as self-specific saving rate observation group. What plays the role these
countries (Norway and Switzerland) to be vertical outlier? For Norway, within the framework
of a life-cycle model, a generation that is characterized as being particularly patient or prudent
will save more while young and less while old, a result that goes against the intuition that the
current old save much because they belong to a generation with preferences for high saving.
(Halvorsen E., 2003) Beyond generational differences, mortality, preferences, expectations
about pension benefits, and historical productivity growth so forth are mainly responsible for
changes on saving rate level.
For Switzerland, a study made by Swiss-American Chamber of Commerce also
remarks that Switzerland has one of the highest saving rates in the world. Furthermore
Economic survey of Switzerland 2007 indicates that again Switzerland with a very high
national saving rate – caused to some extent by the mandatory pension system.

Ekonometri ve İstatistik Sayı:12 2010
99
Russia seems at the borderline, which disperses bad leverage points’ area from vertical
outliers’ area. In Russia transition from socialism and so its uncertainties create considerable
effects on income, consumption, even total economic system. The transition led initially to
decline from the high rate of domestics savings maintained in the socialist era. This drop
however was accompanied by a shift in the composition of savings. As the savings of the
government and the enterprises fell, household savings rose, as a share of both total domestics
savings and household disposable income (Foley and Pyle, 2005).
Both from a priori economic expectation and also from the results published at country
yearly statistics, this rest of the countries at map named France, Germany, Italy, Spain and
United Kingdom have high real disposable income levels, which implies being of x-direction
outlier. According to our classification, it is reasonable to call this group as income-specific.
Here we should say that European Purchasing Power statistics appear as a figure that
will verify our results. As is known Purchasing Power is defined as disposable income after
deduction of taxes and compulsory social contributions. These five countries having great
share of Purchasing Power (as Figure 4) are the countries having high level of disposable
income. Besides Figure 4 contributes the comments that can be done for Figure 3 in our study
as well. Even Figure 4 belongs to year 2006, and the shares of the countries remain the same
for last decade.
0,04
0,03
0,04
0,04
0,07
0,12
0,14
0,15
0,18
0,19
Others
New EU Countries
Switzerland
Netherlands
Russia
Spain
Italy
France
UK
Germany
Figure 4. Purchasing Power 2006 in Europe
As to other two good leverage points namely Azerbaijan and Turkey are appeared in
the same area since they are outlying on the x-direction, too. But here the different response

A Pre-Inv. on Sav. Beh. of Euro. Area: A Robust Class.
100
variables cause the countries to fall the area. It speaks of young age structure of Azerbaijan
and Turkey explains this, and the group can be called as age-specific. Finally, the rest of 17
regular observations reflect EU region standard in terms of all variables included in the
analysis. To sum up the interpretations, when the first map is benchmarked with the second
one, the increment of the numbers of the good leverage points can be seen here obviously.
Definitely a serial of micro-studies might be done to explore the saving rate changes of
the countries one by one, but it’s out of the purpose of the paper.
5. CONCLUSION
This paper empirically focused on classification of 27 European countries’ saving
behaviour within the Modigliani’s life cycle saving hypothesis. Robust method was employed
to identify outlying countries that could bias standard OLS used in outlier map. Outliers using
both robust and classical approaches were identified and discussed. The former approach that
is resistant gave the parallel grouping with statistical factbooks. As a response to the title it’s
so clear that some European countries have similar saving tendencies and some have not. In
this respect grouping became available. These findings appear crucial as a way to shed light
on comparisons of saving rates between European countries, also make easy the policy
makers to interpret this intricate issue and benefit in deciding policies. Besides they put more
stress on the necessity of considering the countries with their different structures while
executing their policies.
REFERENCES
Ando, A., and Modigliani F. (1963), The Life Cycle Hypothesis of Saving: Aggregate Implications and Tests,
American Economic Review, Vol. 53, pp. 55-84.
Attanasio, O.P. and Szekely, M. (2000), Household saving in developing countries: inequality, demographics
and all that: how different are Latin America and South East Asia, Inter-American Development Bank, Research
Department, Working Paper: 427.
Belsley, D.A., Kuh, E. and Welsch, R.E. (1980), Regression Diagnostics, Wiley, New York.
Dornbusch R. and Fisher S. (1994), Macroeconomics, McGraw-Hill Inc., 6th ed., p. 635.
Ekici, O. and Yorulmaz, Ö. (2008), The Relation Between Age Structure And Saving Rate Of Turkey: 1968-
2006 Journal of Istanbul University Social Science Institute, Vol. 2008-2.
Ekonometri ve İstatistik Sayı:12 2010
101
Eren, E. (2001), Makro İktisat, Avcıol Basım Yayın, Istanbul, Genişletilmiş 3. Baskı.
Foley, M.C. and Pyle, W. (2005), Household Savings in Russia During the Transition Middlebury College
Economics Discussion Paper No. 05-22
Halvorsen, E. (2003), A Cohort Analysis of Household Saving in Norway, Statistics Norway, Research
Department, Discussion Paper No: 354.
Horioka, C.Y. (1997), A Cointegration Analysis of The Impact of The Age Structure of The Population on The
Household Saving Rate in Japan The Review Of Economics and Statistics Vol. 79, No. 3, 511-516.
Horioka, C.Y. (2007), A Survey of Household Behavior In Japan, Institute of Social and Economic Research,
Osaka University, and National Bureau of Economic Research, Inc.
Mark C. F. and William P. (2005), Household Savings in Russia during the Transition, Middlebury College
Economics Discussion Paper No: 05-22.
Modigliani, F. (1986), Life Cycle, Individual Thrift, and the Wealth of Nations The American Economic Review,
Vol. 76, No. 3, 297-313
Muradoglu G., Taskin F. (1996), Differences in Household Savings Behavior: Evedince From Industrial and
Devoloping Countries, The Developing Economies 34 (2), 138–153.
Ogaki, M., Ostry, J. and Reinhart, C.M. (1995), Saving Behavior in Low- and Middle-Income Developing
Countries: A Comparison, IMF Working Paper No. 95/3.
Rousseeuw, P.J. (1984), Least Median of Squares Regression Journal of the American Statistical Association
Vol. 79, 871-880.
Rousseeuw, P.J., Leroy, A.M. (1986), Robust Regression and Outlier Detection, Wiley.
Rousseeuw, P.J., Van Zomeren B. (1990), Unmasking Multivariate Outliers and Leverage Points, Journal of the
American Statistical Association, Vol. 85, pp. 633-639.
Sun, W. (2001), Testing The Behavioral Life-Cycle Model: The Effect of Social Security and Pensions on
Personal Savings, Ph.D. Thesis, Graduate School of the University of Notre Dame.
Thornton, J. (2001), Age Structure and the Personal Savings Rate in the United States, 1956-1995, Southern
Economic Journal, 68, 166-170.
Zaman, A., Rousseeuw P.J. and Orhan M. (2001), Econometric Applications of High-Breakdown Robust
Regression Techniques, Economics Letters, Vol. 71, pp. 1-8.
Economist Intelligence Unit, EUI Data Services, Country Data, Avaliable from: <http://secure.alacra.com>
[Acessed November20,2007].
Eurostat, Avaliable from:<http://epp.eurostat.ec.europa.eu > [Acessed November 24, 2007].
Wold Development Indicators, WDI Data, Avaliable from:
http://web.worldbank.org/WBSITE/EXTERNAL/DATASTATISTICS>[Acessed November 24, 2007].
http://wis.kuleuven.be/stat/robust/LIBRA.html