a pragmatic perspective on software visualization · software visualizations in context can be ......
TRANSCRIPT
A Pragmatic Perspective on Software Visualization
Arie van Deursen
Delft University of Technology1
Acknowledgements
• SoftVis organizers– Alexandru Telea
– Carsten Görg
– Steven Reiss
• TU Delft co-workers– Felienne Hermans
– Martin Pinzger
• The Chisel Group, Victoria– Margaret-Anne Storey
2

Outline
1. Questions & IntroductionSoftware visualization reflections
2. Zooming in: Visualization for end-user programmers
3. Zooming out:Software visualization reflections revisited
4. DiscussionBut not just at the end
3
4
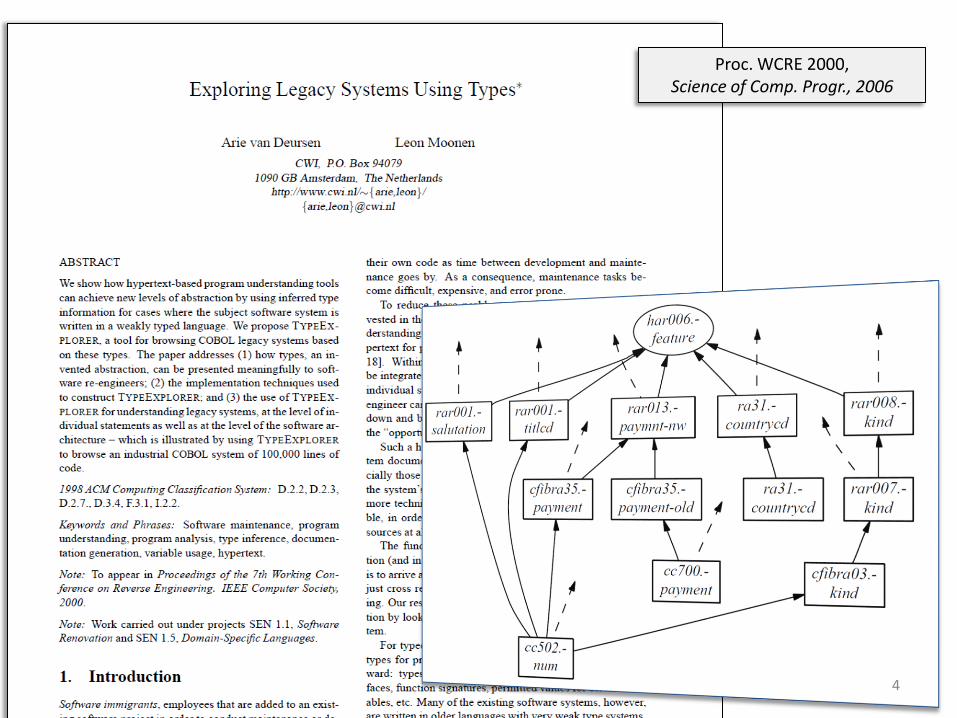
Proc. WCRE 2000, Science of Comp. Progr., 2006

5
Proc. ICSM 1999Sw. Practice & Experience, 2004
www.sig.eu
Software Improvement Group
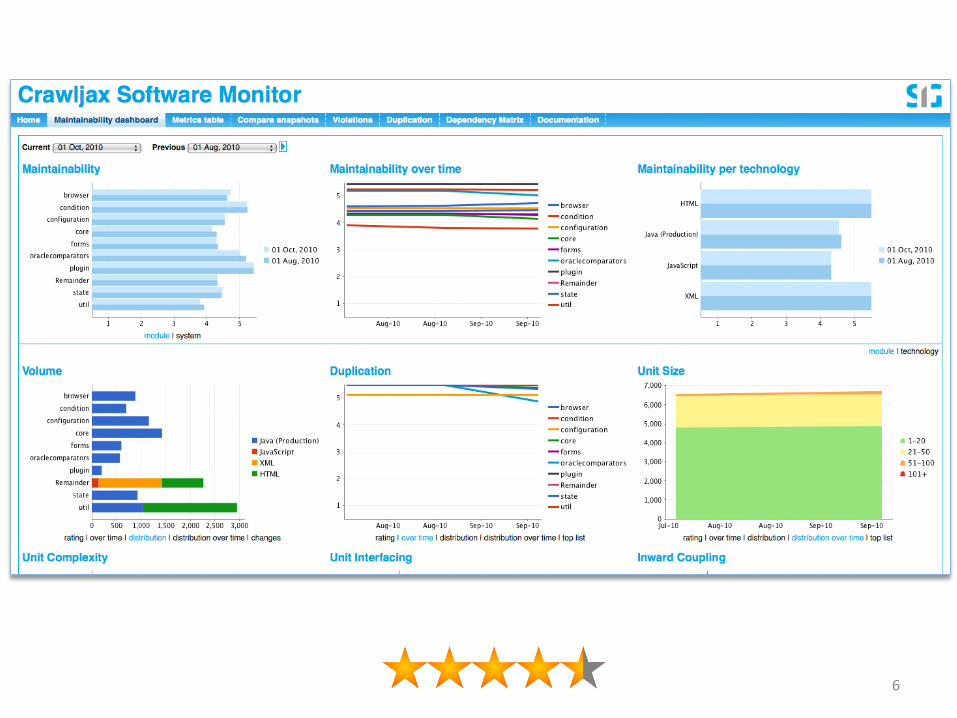
6
7
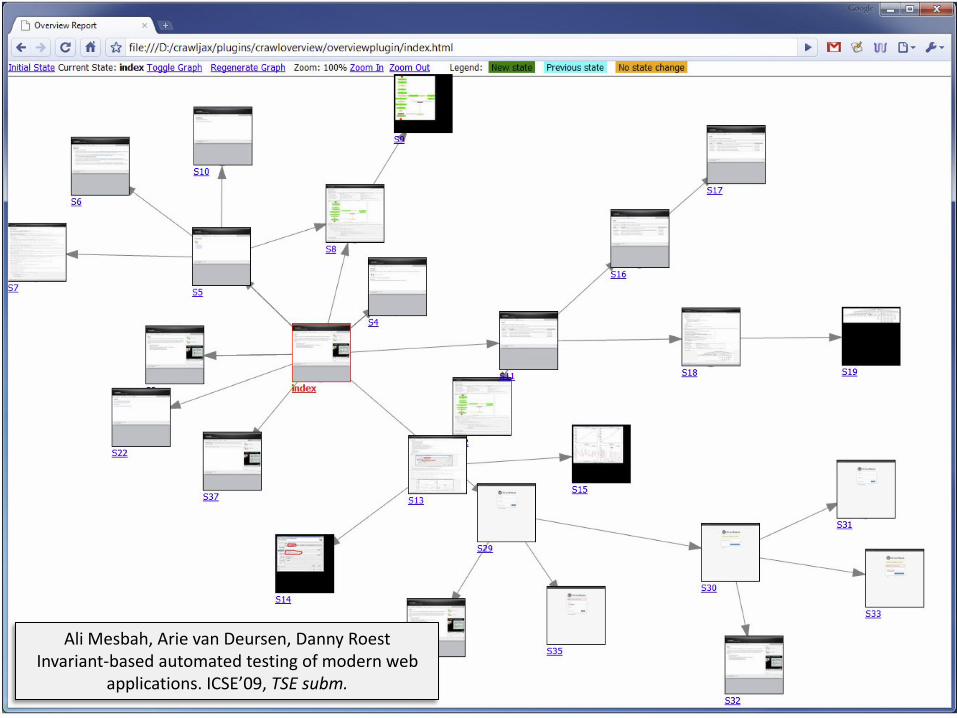
Ali Mesbah, Arie van Deursen, Danny RoestInvariant-based automated testing of modern web
applications. ICSE’09, TSE subm.

8
Bas Cornelissen , Andy Zaidman, Arie van Deursen,A Controlled Experiment for Program Comprehension through Trace Visualization.
IEEE Transactions on Software Engineering, 2010

9
A. Zaidman, B. van Rompaey, A. van Deursen and S. Demeyer .Studying the co-evolution of production and test code in open source and
industrial developer test processes through repository mining. Empirical Software Engineering, 2010
10
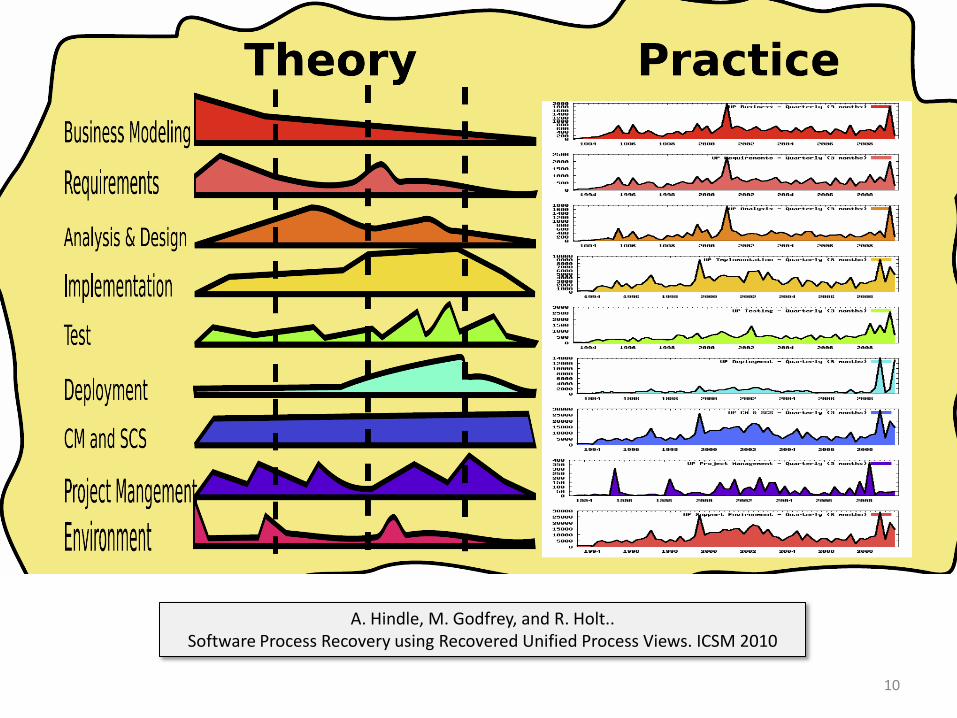
A. Hindle, M. Godfrey, and R. Holt.. Software Process Recovery using Recovered Unified Process Views. ICSM 2010
Observations
1. My visualizations leave room for improvement…
2. Some very cool results are never applied
3. Software visualizations in context can be successful
4. Simpler might be more effective
5. What is our perspective on evaluation?
11
What is “Exciting” in an Engineering Field?
1. Invention of wholly new ideas and directions
2. Work of promise that illuminates #1
3. Early application of #2 showing clear prospect of benefit
4. Substantial exploitation of #3 yielding measurable societal benefits
5. Maturing of #4 with widespread adoption by practitioners
12
A. Finkelstein
A. Wolf
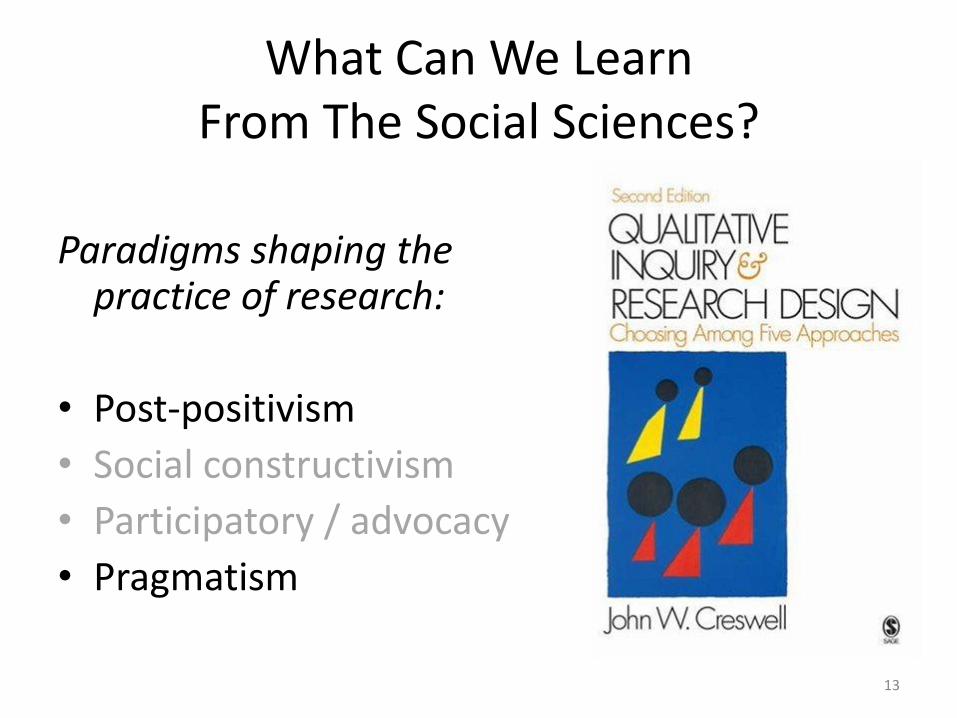
What Can We LearnFrom The Social Sciences?
Paradigms shaping the practice of research:
• Post-positivism
• Social constructivism
• Participatory / advocacy
• Pragmatism
13
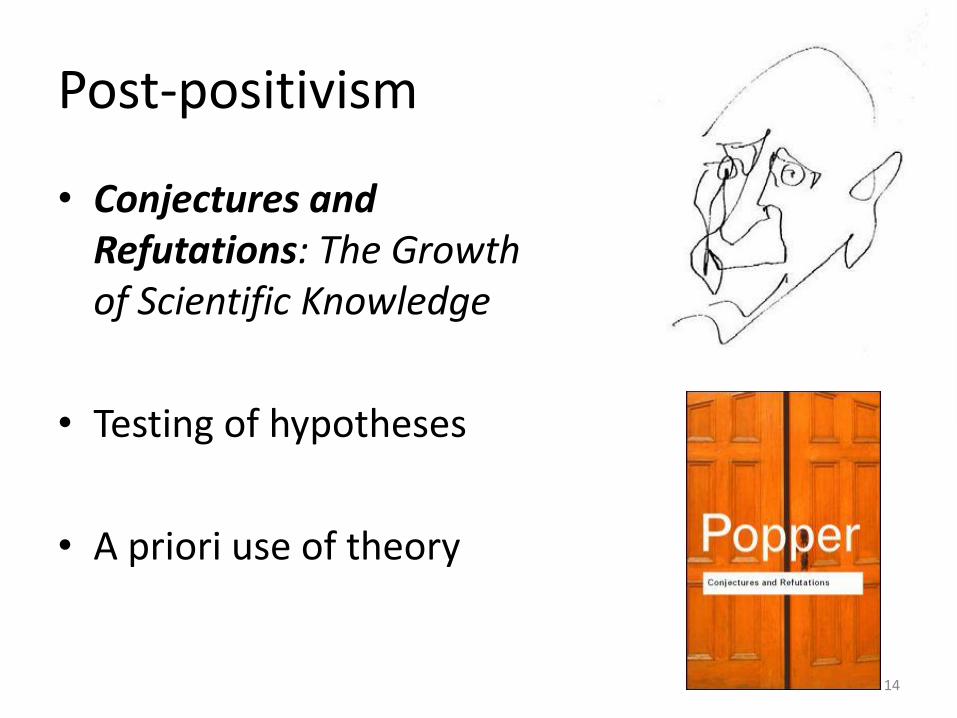
Post-positivism
• Conjectures and Refutations: The Growth of Scientific Knowledge
• Testing of hypotheses
• A priori use of theory
14
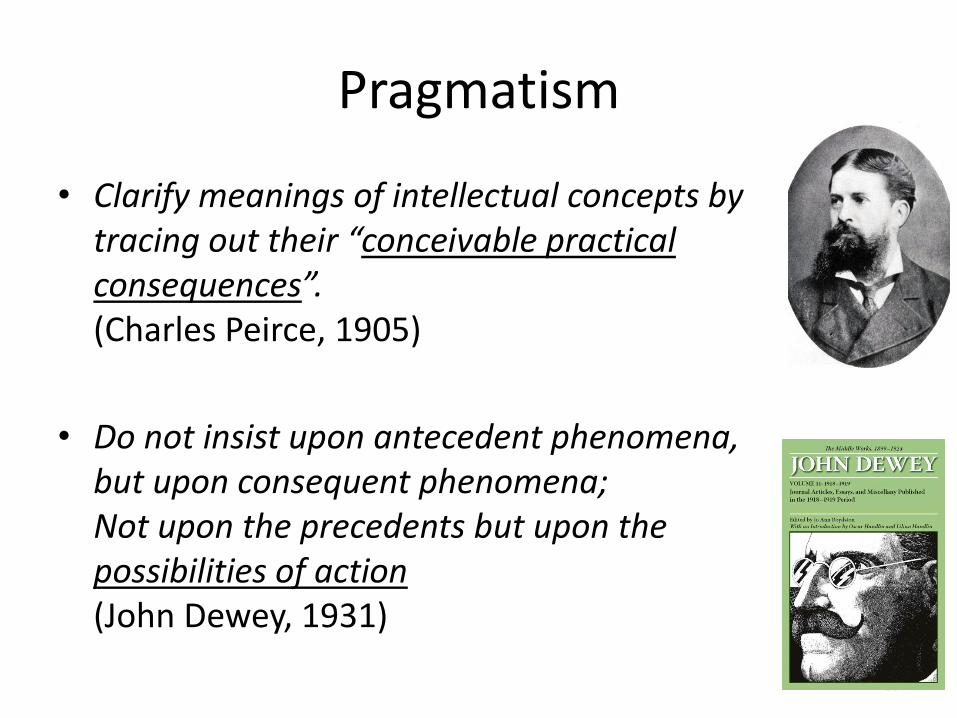
Pragmatism
• Clarify meanings of intellectual concepts by tracing out their “conceivable practical consequences”. (Charles Peirce, 1905)
• Do not insist upon antecedent phenomena, but upon consequent phenomena;Not upon the precedents but upon the possibilities of action (John Dewey, 1931)
15

Pragmatic Considerations
• Not every belief that is “true” is to be acted upon
• Not committed to single research method
• Research occurs in social (and technological) context
• Research builds up “group knowledge”
16
C. Cherryholmes. Notes on Pragmatism and Scientific Realism. Educational Researcher. 1992;21(6):13 - 17.
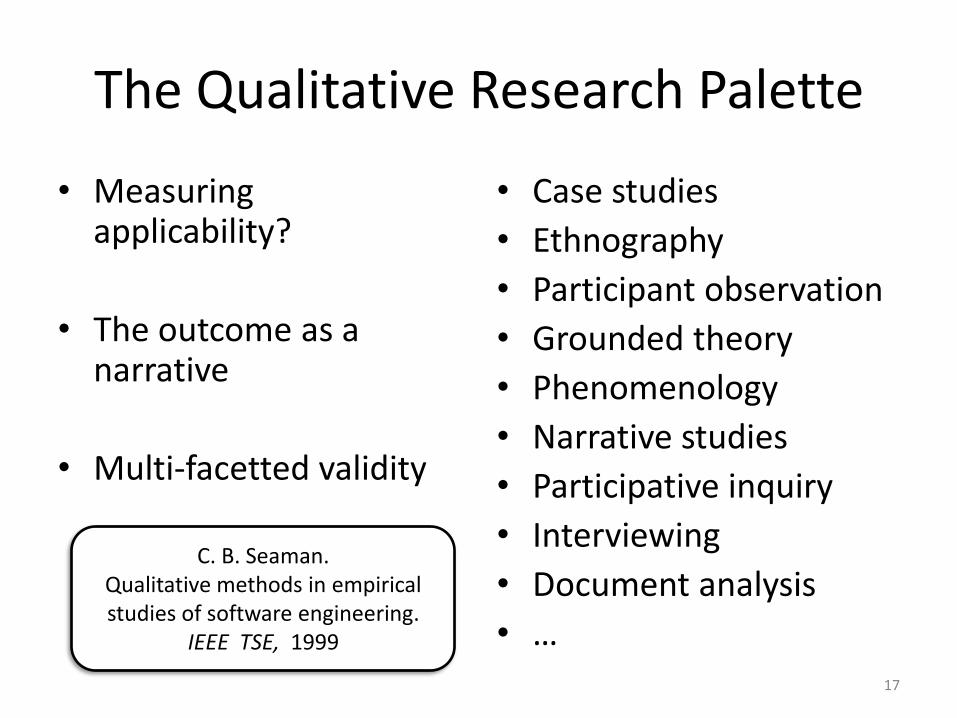
The Qualitative Research Palette
• Measuring applicability?
• The outcome as a narrative
• Multi-facetted validity
• Case studies
• Ethnography
• Participant observation
• Grounded theory
• Phenomenology
• Narrative studies
• Participative inquiry
• Interviewing
• Document analysis
• …17
C. B. Seaman. Qualitative methods in empirical studies of software engineering.
IEEE TSE, 1999

Part II: Zooming In
18
Felienne Hermans, Martin Pinzger, Arie van DeursenSupporting Professional Spreadsheet Users by Generating Leveled Dataflow Diagrams.
Techn. Rep. TUD-SERG-2010-036, Delft University of Technology. Submitted.
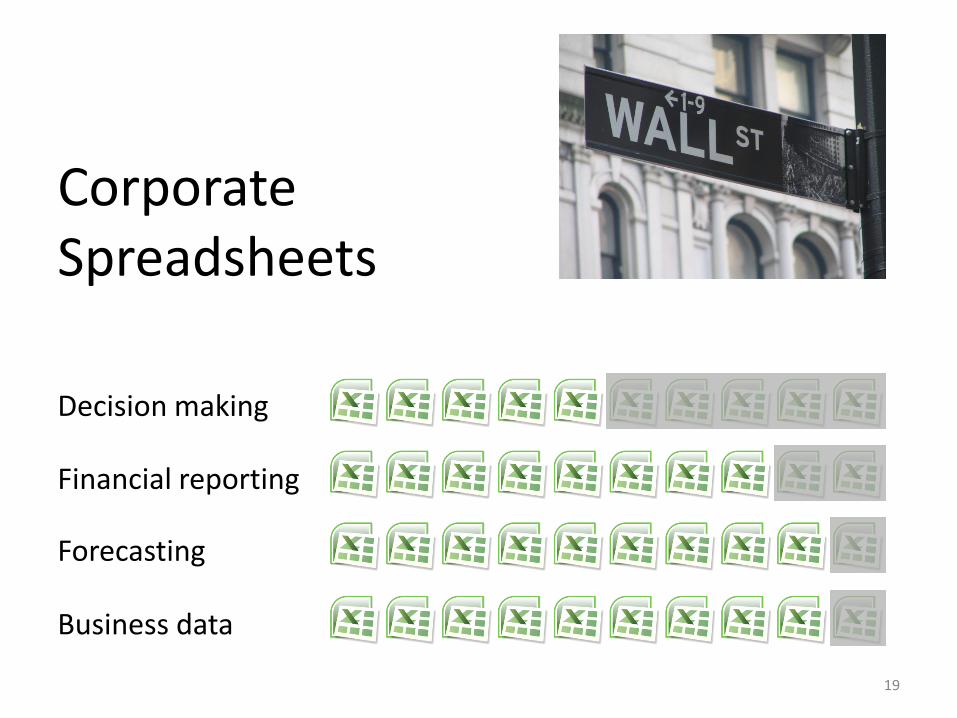
Corporate Spreadsheets
19
Decision making
Financial reporting
Forecasting
Business data

Spreadsheet Research
• Spreadsheet Risks Interest Groups– Managing & identifying
spreadsheet errors
• “End Users Shaping Effective Software” (2005…)– Spreadsheet corpus, testing, debugging, surveys
– ICSE, TOSEM, TSE, Comp. Surveys, VL/HCC, CHI,…
– Nebraska, CMU, Oregon State, Washington, …
F. Hermans, M. Pinzger, and A. van Deursen. Automatically Extracting Class Diagrams from Spreadsheets. ECOOP 2010.
20
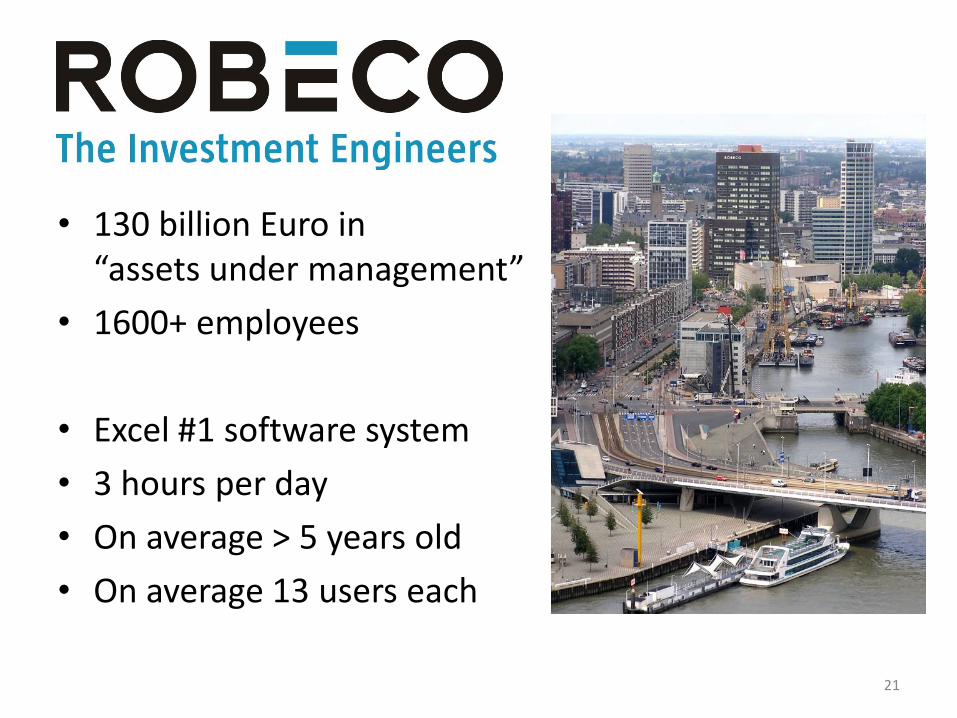
• 130 billion Euro in“assets under management”
• 1600+ employees
• Excel #1 software system
• 3 hours per day
• On average > 5 years old
• On average 13 users each
21

Objectives and Approach
Objective:
• Assist end-user programmers in spreadsheet comprehension
Approach:
• Collect information needs in interviews
• Provide tool addressing key information needs
• Evaluate tool strengths and weaknesses in concrete Robeco setting
22
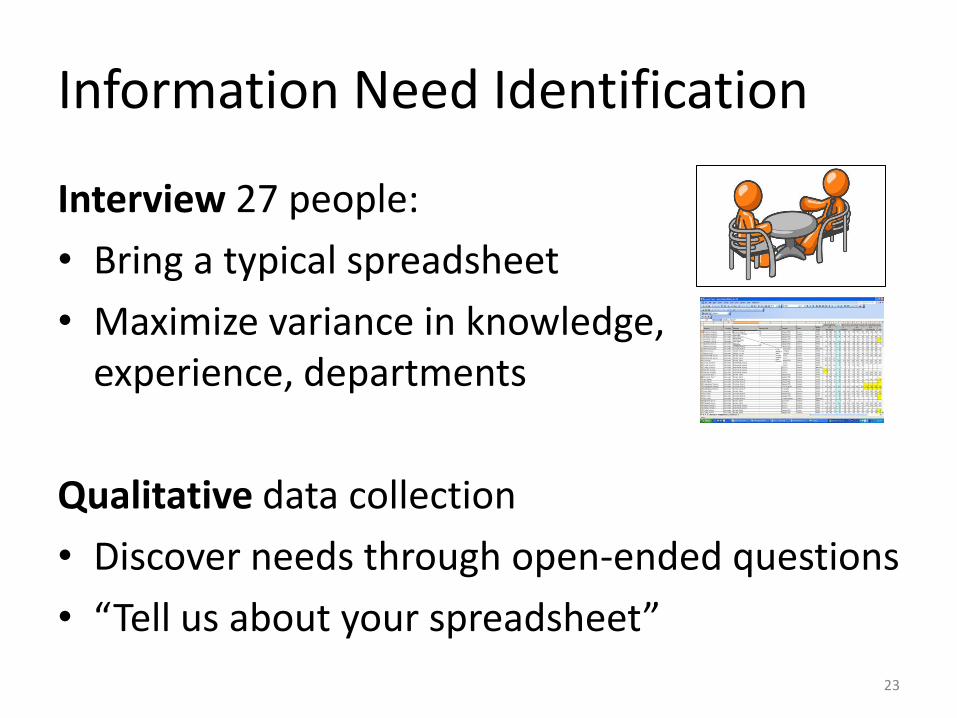
Information Need Identification
Interview 27 people:
• Bring a typical spreadsheet
• Maximize variance in knowledge, experience, departments
Qualitative data collection
• Discover needs through open-ended questions
• “Tell us about your spreadsheet”
23

Grounded Theory
• Systematic procedure to discover theory from (qualitative) data
• Theoretical sensitivity
• Theoretical coding
• Open coding
• Theoretical sampling
• Constant comparative method
• Selective coding
• Memoing
24
S. Adolph, W. Hall, Ph. Kruchten. Using Grounded theory to study the experience of software development. Emp. Sw. Eng., Jan. 2011.
B. Glaser and J. Holton. Remodeling grounded theory. Forum Qualitative Res., 2004.
[ Intermezzo: Eclipse Testing ]
25
http://the-eclipse-study.blogspot.com/

Result I: Transfer Scenarios
• S1: Transfer to colleague (50%)
– new colleague; employee leaves; additional users.
• S2: Check by auditor (25%)
– Assess risks, design, documentation.
• S3: To IT department (25%)
– Replace by custom software
– Increased importance / complexity, multiple people, …
26

Result II: Information Needs
• N1: How are worksheets related? (45%)
• N2: Where do formulas refer to (40%)
• N3: What cells are meant for input (20%)
• N4: What cells are meant for output (20%)
27
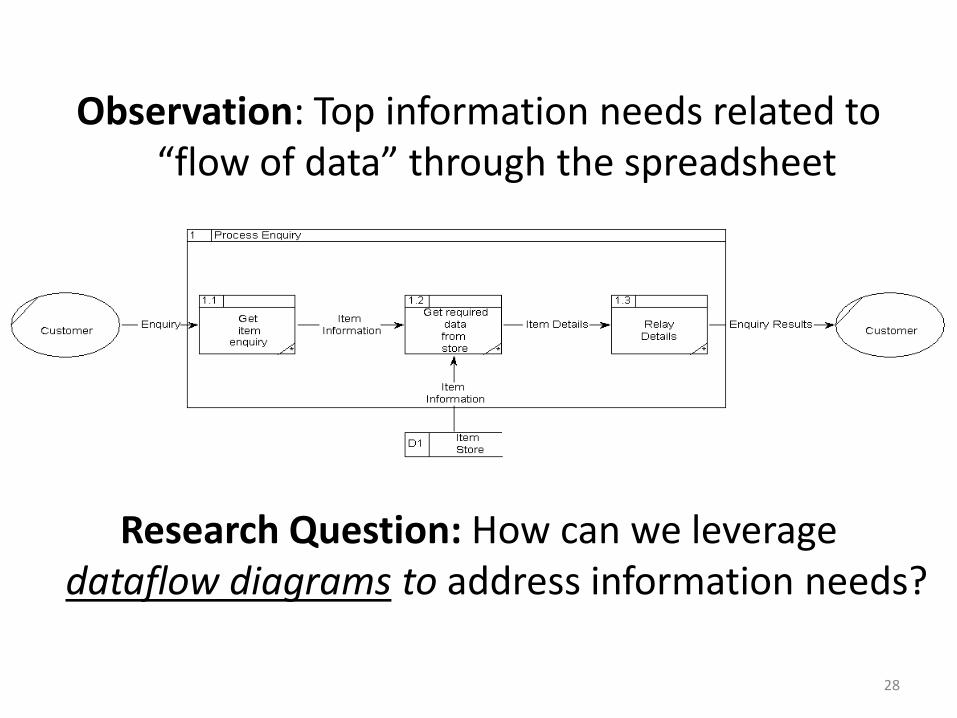
Observation: Top information needs related to “flow of data” through the spreadsheet
Research Question: How can we leverage dataflow diagrams to address information needs?
28
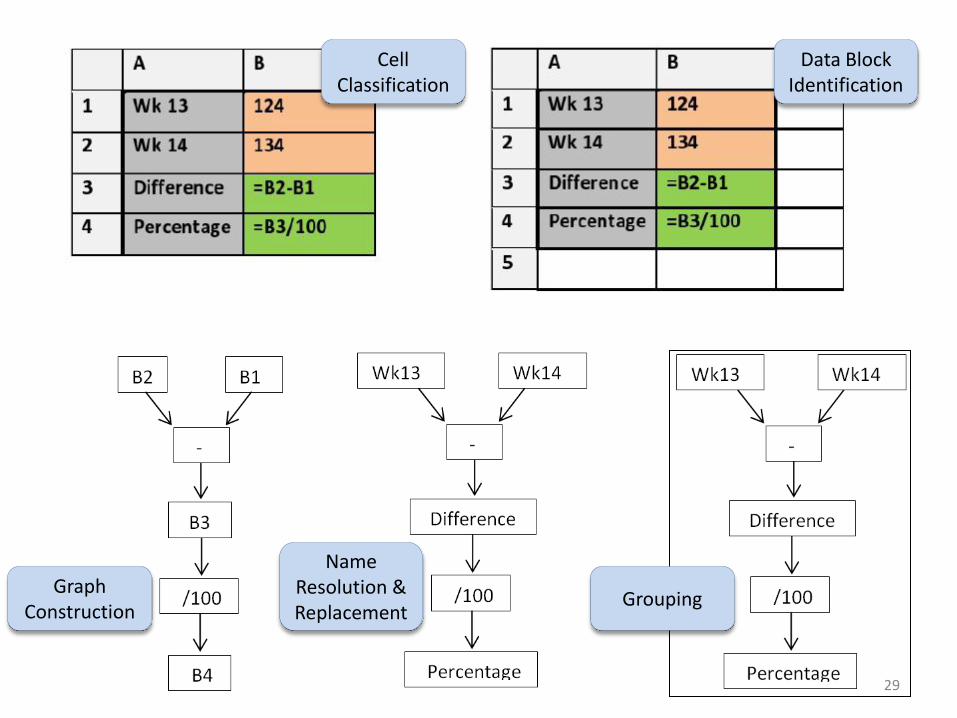
GraphConstruction
NameResolution &Replacement
Grouping
Data BlockIdentification
CellClassification
29

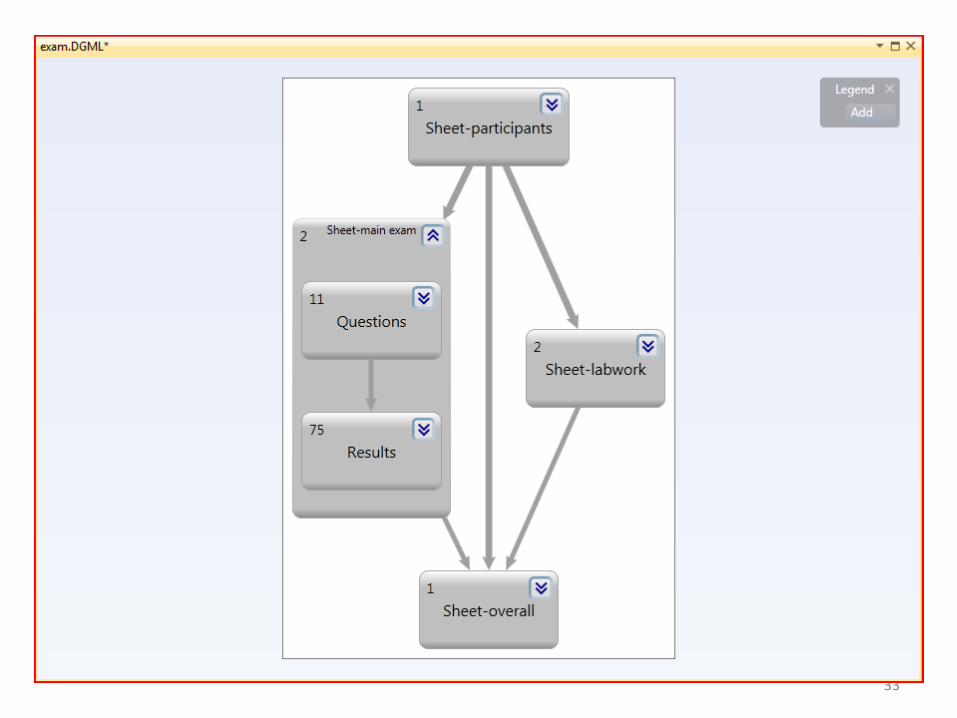
Directed GraphMarkup Language• Visual Studio 2010 DGML
graph browser
• Zooming
• Collapsing / expanding levels
• Grouping of multiple arrows
• Butterfly mode / slicing
• Graph editing (deletion, coloring, leveling)
30Create prototype (GyroSAT) aimed at collecting initial user feedback
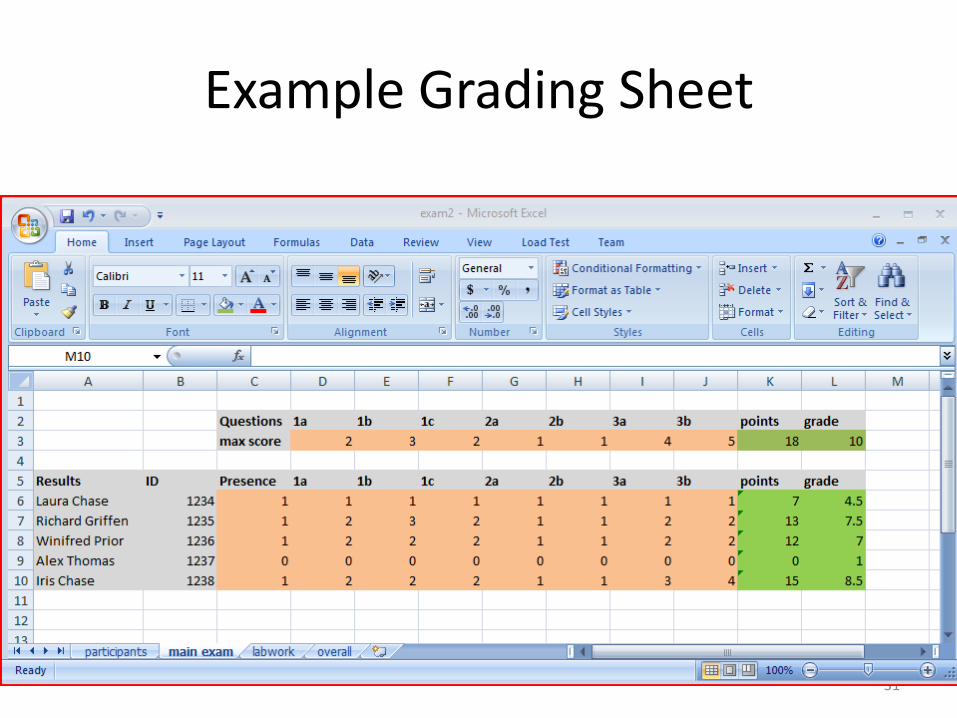
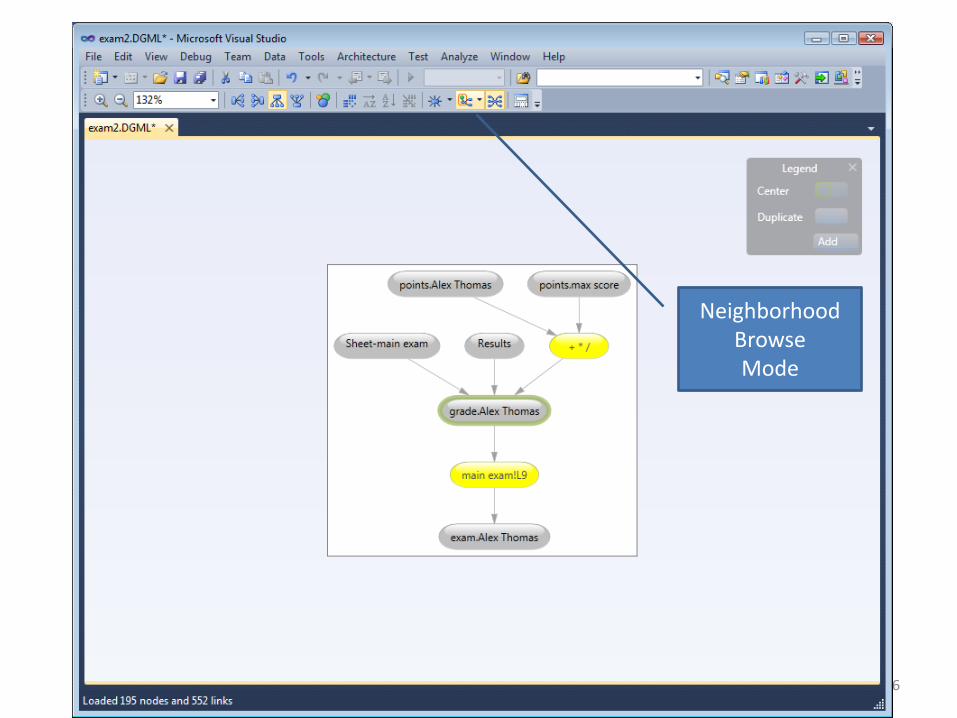
Example Grading Sheet
31

32
33

34

35
36
NeighborhoodBrowseMode

Evaluation
• Is this actually useful for spreadsheet professionals?
• Evaluation I: Interviews
• Evaluation II: Actual transfer tasks
37
McGrath: “Credible empirical knowledge requires consistency or convergence of evidence across studies
based on different methods.”

27 Interviews
38

39

They really outperform the Excel
Audit Toolbar, because they show the entire
view of thesheet
40
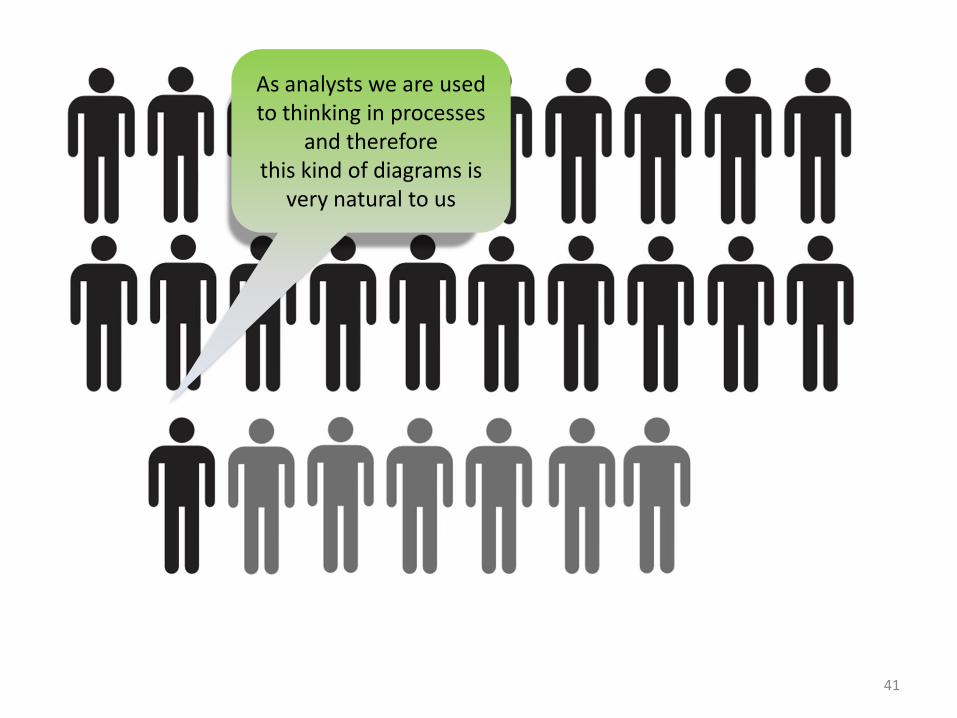
As analysts we are used to thinking in processes
and thereforethis kind of diagrams is
very natural to us
41
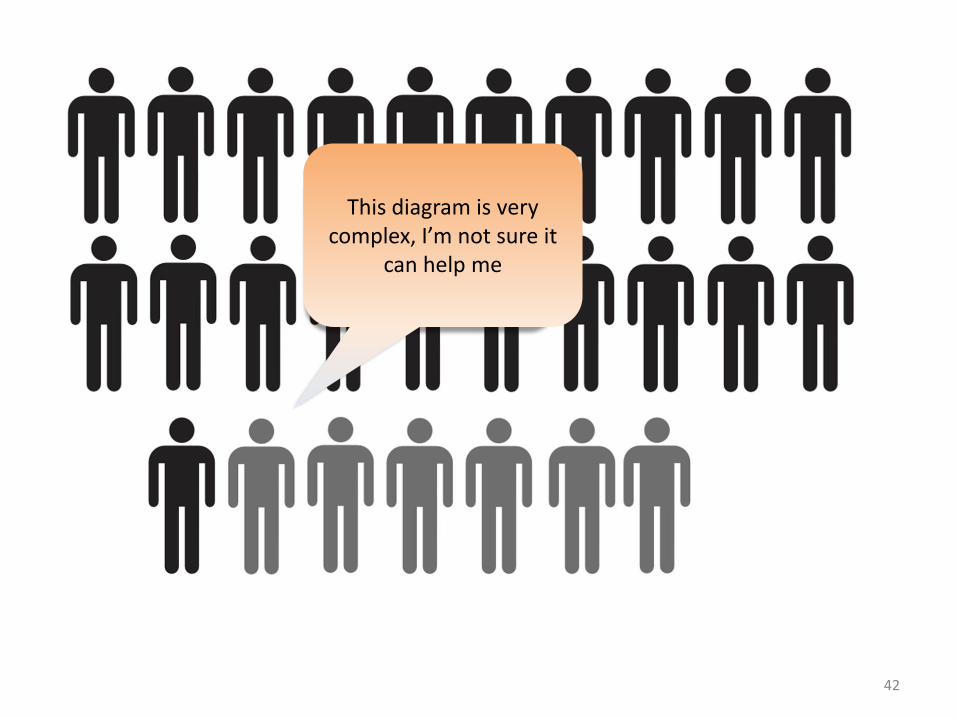
This diagram is very complex, I’m not sure it
can help me
42
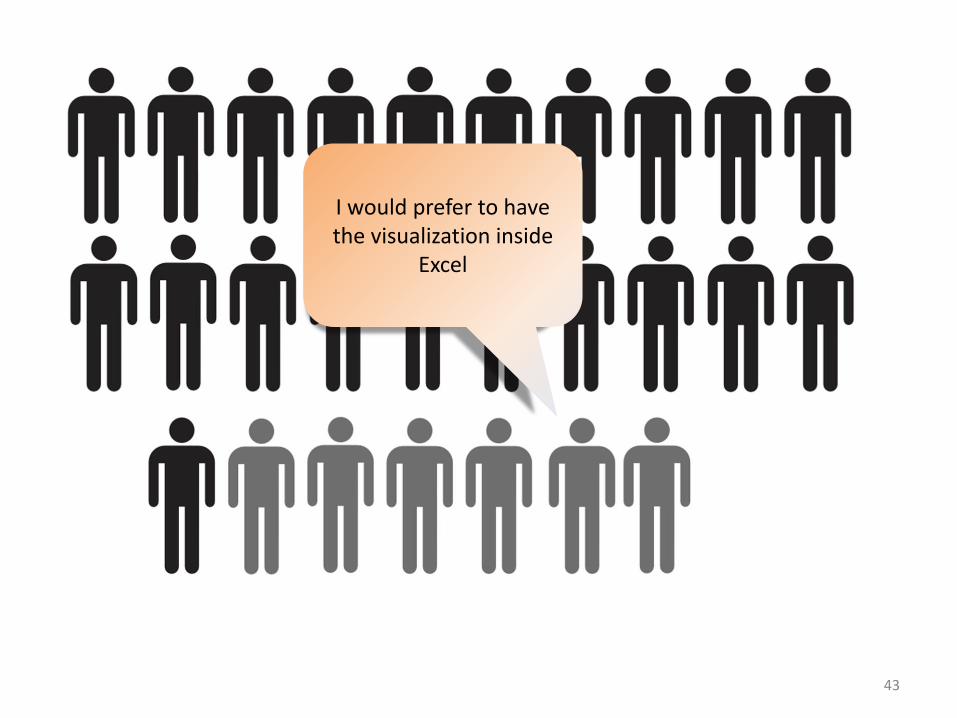
I would prefer to have the visualization inside
Excel
43
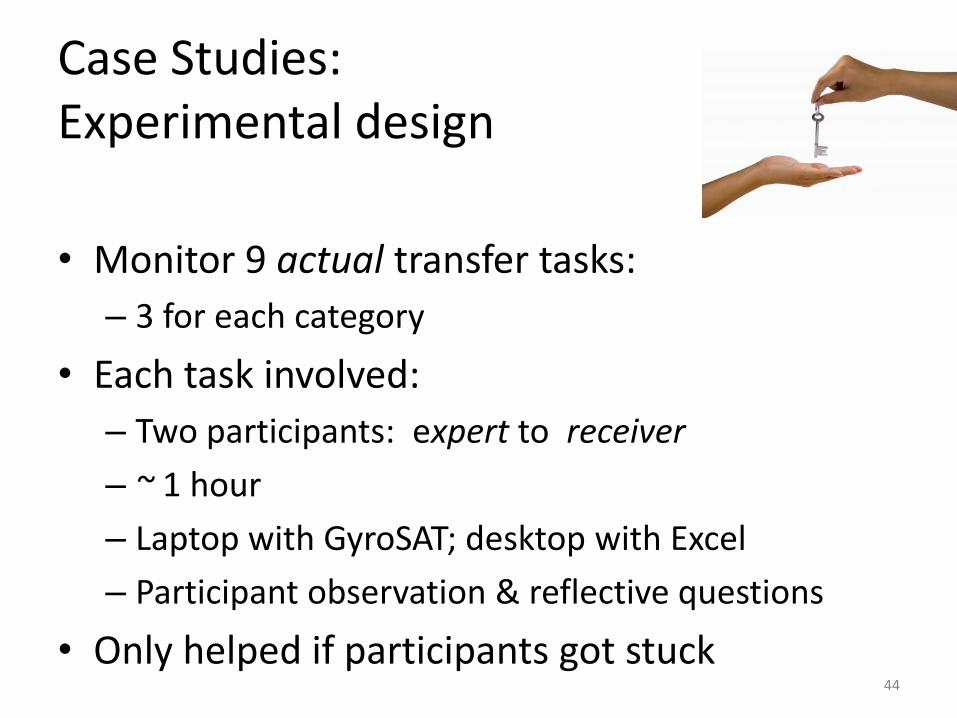
Case Studies:Experimental design
• Monitor 9 actual transfer tasks:
– 3 for each category
• Each task involved:
– Two participants: expert to receiver
– ~ 1 hour
– Laptop with GyroSAT; desktop with Excel
– Participant observation & reflective questions
• Only helped if participants got stuck44
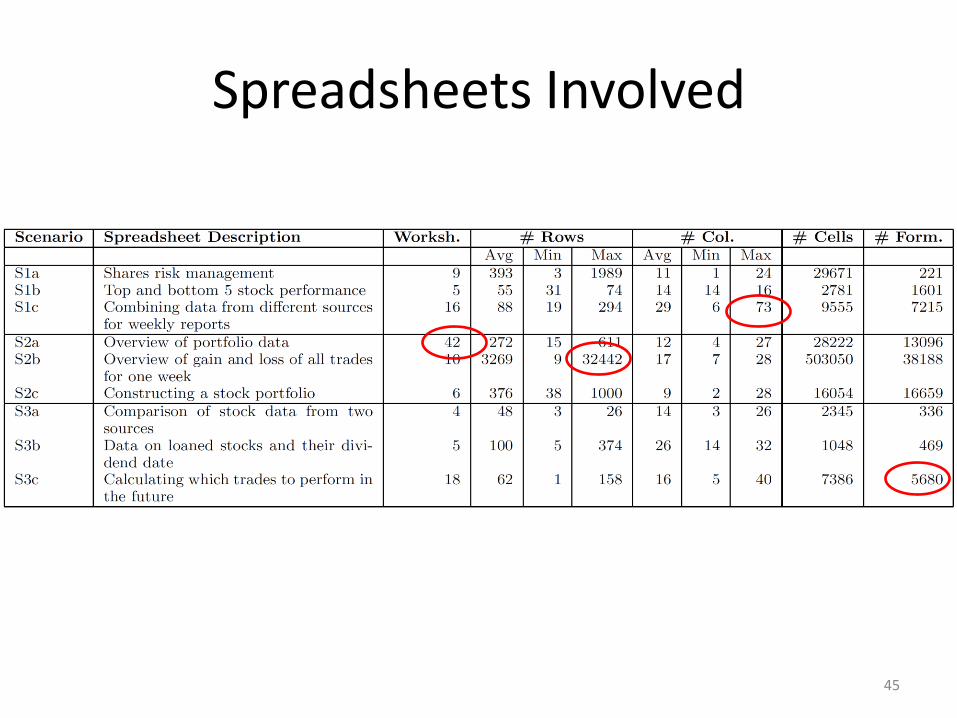
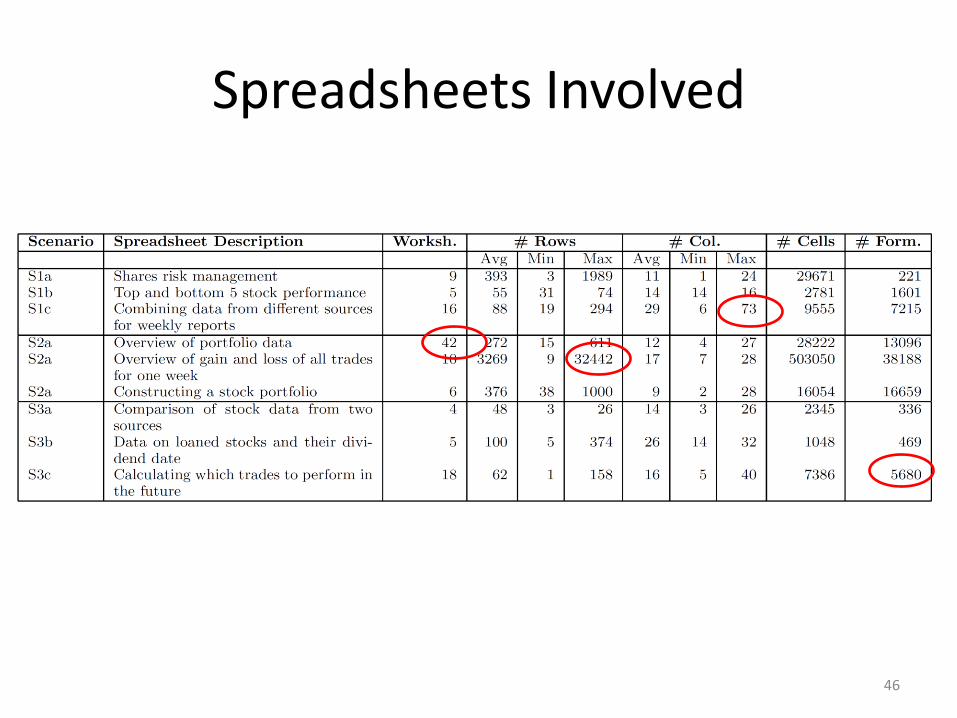
Spreadsheets Involved
45
Spreadsheets Involved
46
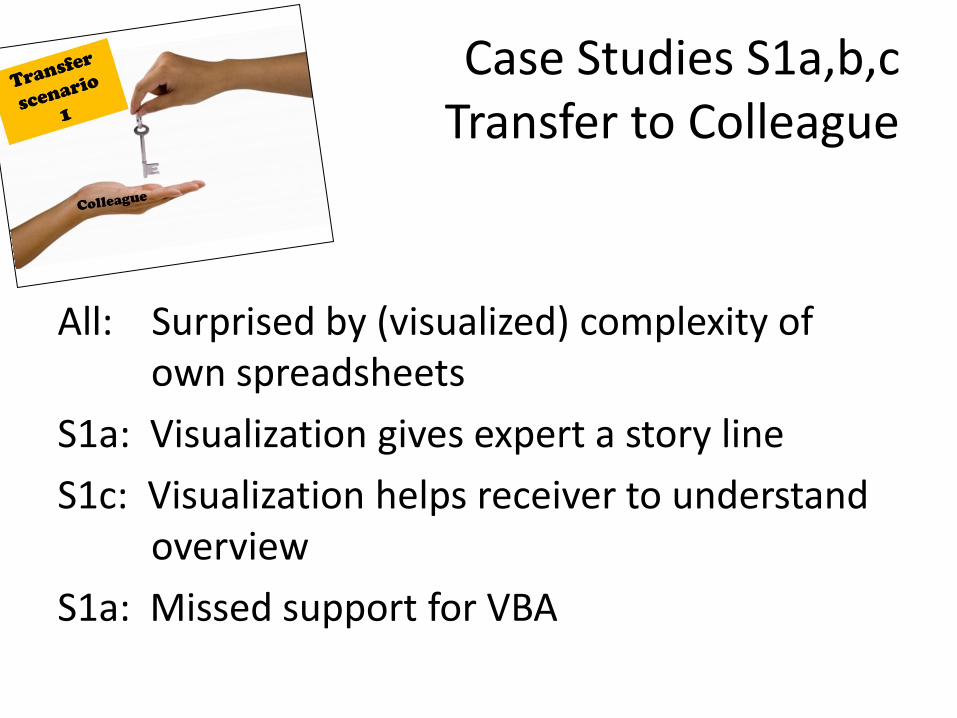
Case Studies S1a,b,cTransfer to Colleague
All: Surprised by (visualized) complexity of own spreadsheets
S1a: Visualization gives expert a story line
S1c: Visualization helps receiver to understand overview
S1a: Missed support for VBA
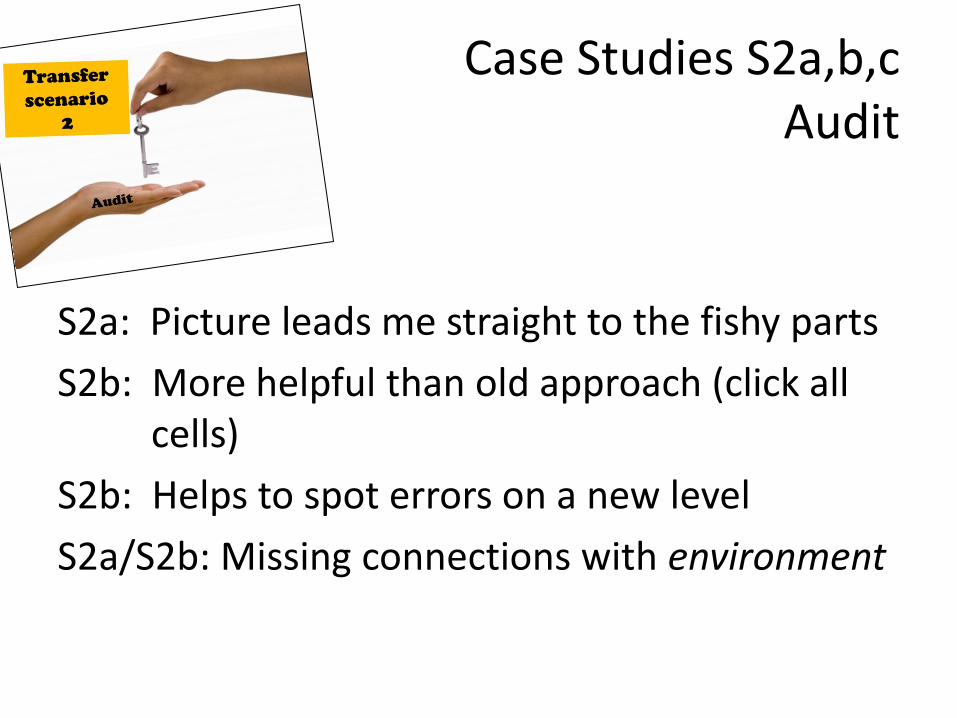
Case Studies S2a,b,cAudit
S2a: Picture leads me straight to the fishy parts
S2b: More helpful than old approach (click all cells)
S2b: Helps to spot errors on a new level
S2a/S2b: Missing connections with environment
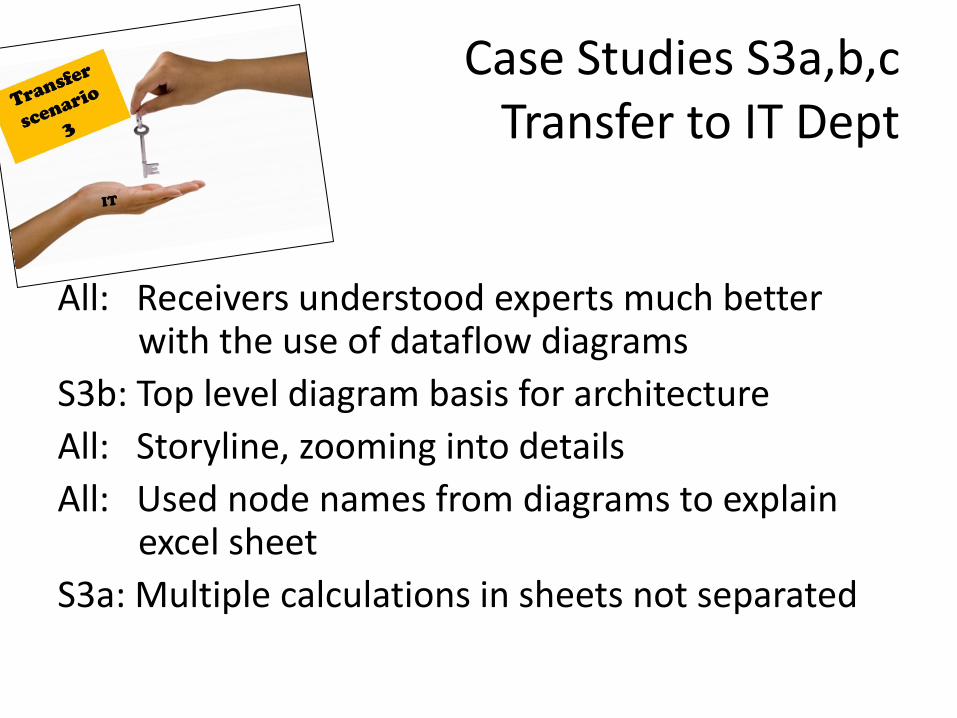
Case Studies S3a,b,cTransfer to IT Dept
All: Receivers understood experts much better with the use of dataflow diagrams
S3b: Top level diagram basis for architecture
All: Storyline, zooming into details
All: Used node names from diagrams to explain excel sheet
S3a: Multiple calculations in sheets not separated

Spreadsheet Visualization
• Threats to validity:– Tradeoff realism versus repeatability
– Robeco spreadsheets only
– Non-random group of participants
• Simple but effective:– Helps to tell the spreadsheet story
– Works for complex, realistic spreadsheets
– VBA + Excel integration high on wish list
50

Part III: Zooming Out
51
Methodological Pride!
• What are our knowledge claims?
• What are the corresponding research methods?
52
Mariam Sensalire, Patrick Ogao, and Alexandru Telea. Evaluation of Software Visualization Tools: Lessons Learned. In Proc. VISSOFT. IEEE, 2009
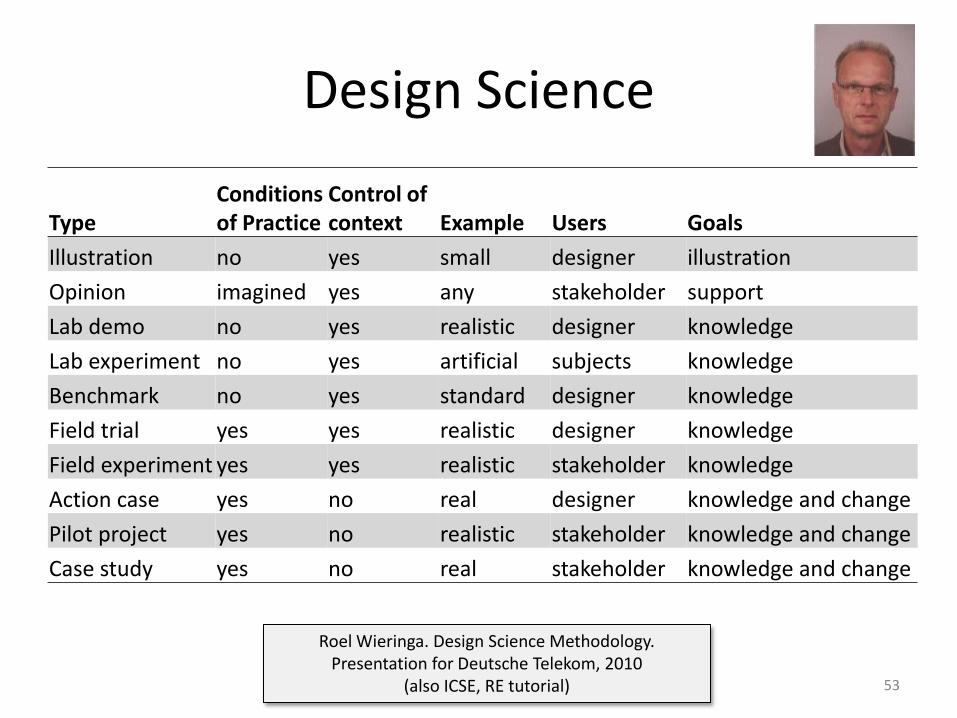
Design Science
53
TypeConditions of Practice
Control ofcontext Example Users Goals
Illustration no yes small designer illustration
Opinion imagined yes any stakeholder support
Lab demo no yes realistic designer knowledge
Lab experiment no yes artificial subjects knowledge
Benchmark no yes standard designer knowledge
Field trial yes yes realistic designer knowledge
Field experiment yes yes realistic stakeholder knowledge
Action case yes no real designer knowledge and change
Pilot project yes no realistic stakeholder knowledge and change
Case study yes no real stakeholder knowledge and change
Roel Wieringa. Design Science Methodology.Presentation for Deutsche Telekom, 2010
(also ICSE, RE tutorial)
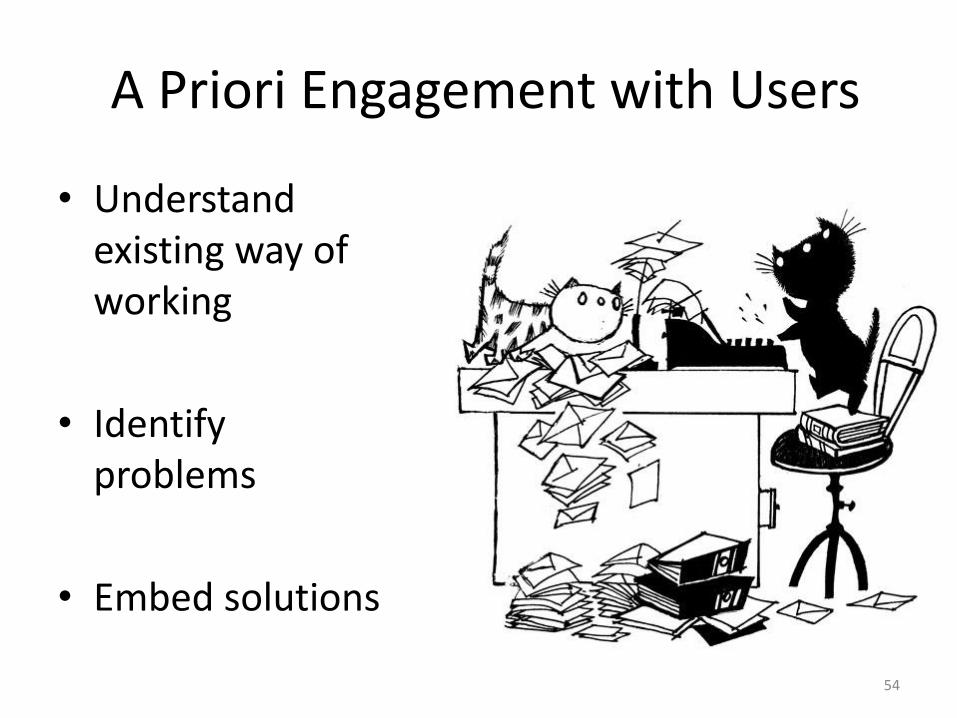
A Priori Engagement with Users
• Understand existing way of working
• Identify problems
• Embed solutions
54

Software = Peopleware
Evaluations are
• qualitative
• incomplete
• subjective
Evidence must
• grow
• and be criticized
55

Visualization = Communication
56
• Beyond individual comprehension
• Evaluate team interaction & collaboration

End-User Programming
57

Start a Company!
58
59