a pq case study - asia power quality initiative · bars are used to make wire ropes.manufacturing...
TRANSCRIPT

Case Study 38
Reduction in Break Down and Specific Energy Consumption by Reducing Harmonics at Usha Martin – Wire Rope Plant
A PQ Case Study
APQI (C) Copyright (2013) All Rights Reserved 1
A PQ Case Study CS 38 ENRG 14
Reduction in Break Down and Specific Energy Consumption by Reducing Harmonics at a Steel Wire Rope Plant

Case Study 38
Reduction in Break Down and Specific Energy Consumption by Reducing Harmonics at Usha Martin – Wire Rope Plant
A PQ Case Study
APQI (C) Copyright (2013) All Rights Reserved 2
38 Abstract: Energy Conservation Act 2001 provides a
legal framework to embarking on energy
conservation in India. Under the act
government classified industries based on
energy consumption and these industries
are known as Designated Consumer (DC).
These DC’s are covered under Perform
Achieve and Trade (PAT) mechanism with
total energy saving target of 6.6 Million
Tonnes of Oil Equivalent by 2015. All
designated consumers are provided with
target of reducing energy consumption
that they have to meet by 2015.
Reduction in energy consumption is one
of the priorities of these DC’s.
Operating the plant without many
breakdowns is one of the top priorities for
any manufacturing facility. Increased
breakdown causes production loss, higher
specific energy consumption and reduced
profit margins. With use of drives, AC to
DC convertors and SMPS loads,
generation of harmonics is inevitable.
These harmonic current can cause
unexpected break downs and loss of
energy due to additional heat generation
in cables, motors and transformers. The
Case study below presents how a steel
wire rope mill reduced specific energy
consumption and breakdowns by filtering
out harmonics.

Case Study 38
Reduction in Break Down and Specific Energy Consumption by Reducing Harmonics at Usha Martin – Wire Rope Plant
A PQ Case Study
APQI (C) Copyright (2013) All Rights Reserved 3
Introduction Usha Martin is India’s largest and world’s second largest steel wire rope manufacturers.
Manufacturing of steel wire involves number of DC motors and AC to DC convertors. Wire
bars are used to make wire ropes.Manufacturing of wire rod uses iron ore as a raw material
and it passes through different process of extracting iron from the iron ore. Wire rod is used
as a raw material to manufacture wire rope.
Schematic diagram -1 below shows production process of steel wire rope.
Transformation of wire rod in wire rope involves drawing and stranding to increase the
length of the wire rod and decrease its diameter. Surface treatment, galvanising and
patenting process are adopted during the making of wire rope to change surface properties
of the metal. In the process of drawing and stranding number of motors with different
capacities are used. Failure of one motor in drawing or stranding section can cause stoppage
of production line and loss in productivity. All these motors are equipped with drives to
control speed of the mill. Failure in drives or control cards will also reduce productivity.
In above manufacturing process various drives present in wire rope mill produces
harmonics. Presence of harmonics in the system can cause problems like:
1. Additional heat generation in the cables and neutral
2. Increase failure rate of electrical and electronics equipment
3. Increased energy consumption due to increased losses
4. Nuisance tripping of circuit breaker
Diagram – 1 Wire Rope production process

Case Study 38
Reduction in Break Down and Specific Energy Consumption by Reducing Harmonics at Usha Martin – Wire Rope Plant
A PQ Case Study
APQI (C) Copyright (2013) All Rights Reserved 4
Background
The production facility was facing problems of breakdown of various electrical and
electronic equipments. Various type of problems and failure in the plant as reported were
as below.
A) Electronic Card Failures listed below starting with the most frequent failures.
1. VFD master drive control card (CUVC),
a) Control Card b) Power card including SMPS and IGBT
2. DC motor field controller card 3. DC motor field controller card with Thyristors 4. AC Drive Card
a) Controller card b) Power card including SMPS and IGBT
5. DC Drive Card a) Controller card b) Power card including SMPS and IGBT
6. PLC and MMI a) CPU card b) MMI controller card c) MMI display card
B) Motor Failures details and types of motor failureslisted below.
1. DC Motors. The plant has 5 to 200kw motors and out of which maximum failure happen for 5kw to 80kw motors.
a) Commutator uneven surface grooving and increased gap between slots b) Bearing wear-out and failure in the bearing-sitting-shaft and bearing-housing
at motor end cover. c) Field winding overheat, insulation puncture and interlayer short-circuit d) Armature insulation puncture
i. Equalizer winding in commutator ii. Inter-pole winding in between field winding
iii. Armature winding in slot.

Case Study 38
Reduction in Break Down and Specific Energy Consumption by Reducing Harmonics at Usha Martin – Wire Rope Plant
A PQ Case Study
APQI (C) Copyright (2013) All Rights Reserved 5
2. Squirrel Cage IM. The plant has FHP to 315kw motors and out of which maximum failure happen for 5kw to 80kw motors.
a) Bearing wear-out and failure in the bearing-sitting-shaft and bearing-housing at motor end cover and bearing cage damage.
b) Stator winding insulation puncture c) Rotor Bar, melt open, happens occasionally and up to 11kw motors only.
3. Slip Ring IM. The plant has 18.5 to 110kw motors and out of which maximum failure happen for 18.5kw to 55kw motors.
a) Bearing wear-out and failure in the bearing-sitting-shaft and bearing-housing at motor end cover and bearing cage damage.
b) Stator winding insulation punctures. c) Rotor winding insulation punctures. d) Slip ring uneven surface grooving and increased gap between slots
C) List of Card/Motor/SWG. Failures and Nuisance Tripping.
Table -1 below shows different types of breakdowns occurring in the plant along with their frequency according to feeder transformer.
TRF Load
Process Mfg. Line
Nuisance Tripping Per 8-hr. Shift
Card Failure Per Month
Motor Failure Per Month
SWG. Failure Per Year
1. 1x3mva TRF-5
Wire Mill
2
2
6
12
1. 2x1mva TRF-1&2 2. 3x1mva TRF-3,4,5 3. 2x1mva TRF-6&8
Wire Mill
2
4
7
24
1. 1x3mva TRF-10 2. 2x1mva TRF-7&9
Wire Mill
1
3
4
12
1. 1x3mva TRF-4 2. 2x3mva TRF-7&8 3. 1x3mva TRF-10 4. 2x1mva TRF-7&9
Ropery
1-per day
1
3
---
1. 2x1mva TRF-1&2
SPD
1-per day
2-year
1
---
Table-1 Breakdown rate

Case Study 38
Reduction in Break Down and Specific Energy Consumption by Reducing Harmonics at Usha Martin – Wire Rope Plant
A PQ Case Study
APQI (C) Copyright (2013) All Rights Reserved 6
In order to find reason behind above mentioned breakdown and failure, the plant
management carried out a detailed harmonic study of the plant. Harmonic levels were
measured at different locations in the plant. Table-2 below shows summary of harmonic
level at incomer level and different feeders in the plant.
Date / Load
3-Ph Voltage KV/volt
3-Ph Current ~ Max
%-THD-v %-THD-i (Harmonics)
MW-pk.
MW-ave.
MVAr-pk.
MVAr-ave.
PF-ave.
Hz-ave. Ref page in annex-II & CTR Remarks
* 33kv Power Source JSEB Incomer and 10mw CPP
33kv JSEB I/C
32.77 33.10 32.93
76.74 78.02 81.68
3.0% 45.0% 5
th, 7
th, 3
rd
4.30 2.45
1.85 0.79
0.96 49.96
* High Harmonics from Loads
33kv CPP I/C
32.66 32.66 32.73
177.66 170.33 171.25
6.0% 7.0% 5
th, 7
th, 3
rd
8.86 7.17
4.43 2.99
0.92 49.99
* Harmonics are within near Limits
* 3mva, 33/0.415kv TRF Load Distributions
TRF-4 Ropery
239.0 241.8 241.2
2947 3099 3011
12% 21% 7
th, 5
th, 3
rd
1975 1677
1478 874
0.89 49.99
* High Harmonics from Loads * 500/1400 =35% Cap effective * In=500A, I3=25% of In
TRF-5 Wire Mill
237.7 239.3 239.6
2648 2725 2810
15% 60% 5
th, 7
th, 3
rd
1988 1260
2043 537
0.93 50.01
* High Harmonics from Loads * 800/1600=50% Cap effective * I/C-1 (x2) & I/C (x1) LF adjusted
TRF-7 LRPC
Ropery
221.1 220.7 217.4
2128 2143 1847
11% 37% 5
th, 7
th, 11
th
1285 1034
581 457
0.92 50.00
* High Harmonics from Loads * 1 of 2 LRPC lines were OFF * 400/400=100% Cap effective
TRF-8 LRPC
Ropery
239.0 238.6 236.3
2122 2120 1453
10% 36% 5
th, 7
th, 3
rd
1260 1128
480 336
0.90 49.98
* High Harmonics from Loads * Ducati Cap burnt & removed
TRF-10 HRBC Ropery& Wire Mill
232.7 234.5 234.7
1983 2046 2002
12% 35% 5
th, 7
th
1196 1011
751 100
0.85 49.99
* High Harmonics from Loads * 200/600=33% Cap effective * 3mva, 11/0.415kv TRF from Main SS
* 1mva, 11/0.415kv TRF Load Distributions TRF-1,2
Main SS Wire Mill
245.6 246.0 246.5
1305 1252 1272
10% 33% 5
th, 7
th, 11
th
910 561
535 50
0.95 49.99
* High Harmonics from Loads * 300/600=50% Cap effective
TR-3,4,5
Main SS Wire Mill
242.9 242.6 242.9
2606 2570 2573
11% 22% 5
th, 7
th, 11
th
1905 1578
693 484
0.96 49.99
* High Harmonics from Loads * Cap ON throughout
Table-2Harmonic level at different feeders
Case Study 38
Reduction in Break Down and Specific Energy Consumption by Reducing Harmonics at Usha Martin – Wire Rope Plant
A PQ Case Study
APQI (C) Copyright (2013) All Rights Reserved 7
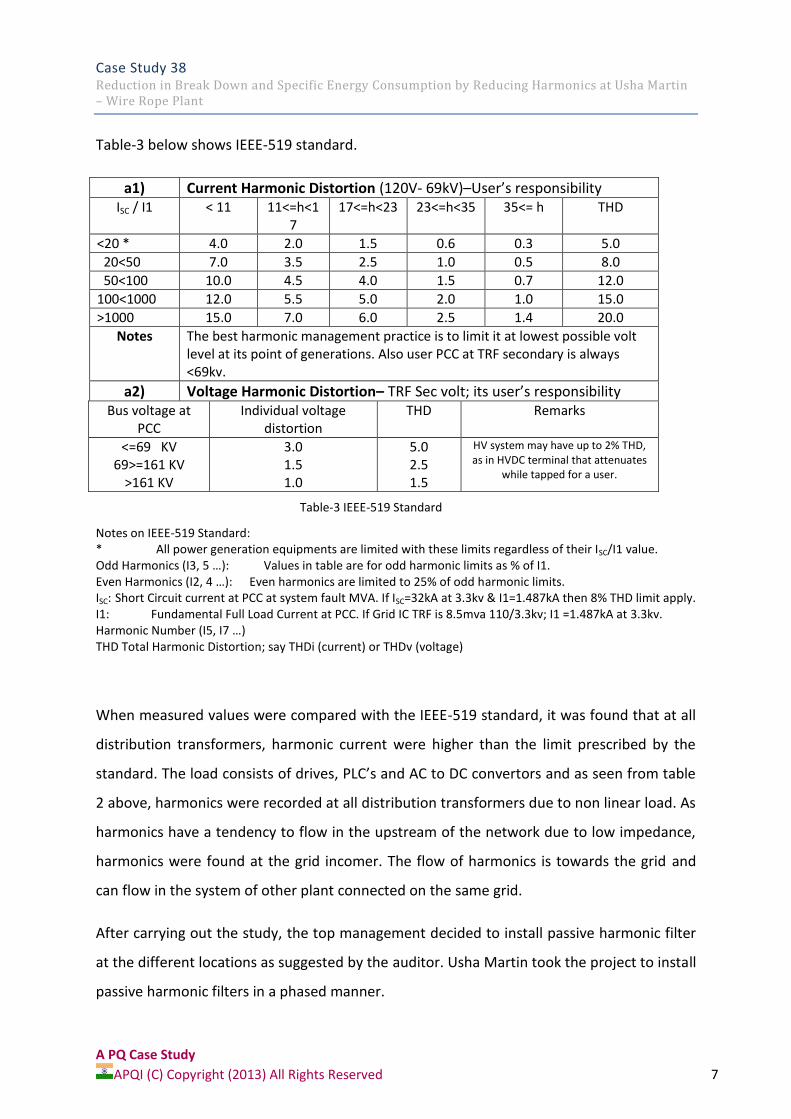
Table-3 below shows IEEE-519 standard.
a1) Current Harmonic Distortion (120V- 69kV)–User’s responsibility ISC / I1 < 11 11<=h<1
7 17<=h<23 23<=h<35 35<= h THD
<20 * 4.0 2.0 1.5 0.6 0.3 5.0
20<50 7.0 3.5 2.5 1.0 0.5 8.0
50<100 10.0 4.5 4.0 1.5 0.7 12.0
100<1000 12.0 5.5 5.0 2.0 1.0 15.0
>1000 15.0 7.0 6.0 2.5 1.4 20.0
Notes The best harmonic management practice is to limit it at lowest possible volt level at its point of generations. Also user PCC at TRF secondary is always <69kv.
a2) Voltage Harmonic Distortion– TRF Sec volt; its user’s responsibility Bus voltage at
PCC Individual voltage
distortion THD Remarks
<=69 KV 69>=161 KV
>161 KV
3.0 1.5 1.0
5.0 2.5 1.5
HV system may have up to 2% THD, as in HVDC terminal that attenuates
while tapped for a user.
Notes on IEEE-519 Standard: * All power generation equipments are limited with these limits regardless of their ISC/I1 value. Odd Harmonics (I3, 5 …): Values in table are for odd harmonic limits as % of I1. Even Harmonics (I2, 4 …): Even harmonics are limited to 25% of odd harmonic limits. ISC: Short Circuit current at PCC at system fault MVA. If ISC=32kA at 3.3kv & I1=1.487kA then 8% THD limit apply. I1: Fundamental Full Load Current at PCC. If Grid IC TRF is 8.5mva 110/3.3kv; I1 =1.487kA at 3.3kv. Harmonic Number (I5, I7 …) THD Total Harmonic Distortion; say THDi (current) or THDv (voltage)
When measured values were compared with the IEEE-519 standard, it was found that at all
distribution transformers, harmonic current were higher than the limit prescribed by the
standard. The load consists of drives, PLC’s and AC to DC convertors and as seen from table
2 above, harmonics were recorded at all distribution transformers due to non linear load. As
harmonics have a tendency to flow in the upstream of the network due to low impedance,
harmonics were found at the grid incomer. The flow of harmonics is towards the grid and
can flow in the system of other plant connected on the same grid.
After carrying out the study, the top management decided to install passive harmonic filter
at the different locations as suggested by the auditor. Usha Martin took the project to install
passive harmonic filters in a phased manner.
Table-3 IEEE-519 Standard

Case Study 38
Reduction in Break Down and Specific Energy Consumption by Reducing Harmonics at Usha Martin – Wire Rope Plant
A PQ Case Study
APQI (C) Copyright (2013) All Rights Reserved 8
Solution adopted by the plant: From the study, it came to knowledge of the plant team that the harmonic levels at
different feeder levels are very high as compared to limit specified by IEEE-519. One of the
very possible reasons for failure of various components in the plant could be presence of
harmonics. The plant team decided to mitigate harmonics by installing harmonic filter. As
the order of harmonics were same for a feeder and loading conditions were almost
constant, the plant team decided to install passive harmonic filter. The passive harmonic
filters were designed as per load current and order of harmonics.
The plant team decided to install passive harmonic filter in a phased manner. In the first
phase, the plant team installed passive harmonic filter on transformer number 4 and
transformer number 5 where presence of harmonics were maximum. Rating of the installed
harmonic filter is as below.
Transformer – 4 (1x3mva, 33kv/ 0.415kv): Passive Tuned Harmonic Filter; 2365A (incl. 30%
overload) 415v, 50 Hz 3840kvar. Tuned at 5th/7th to limit THD-v & THD-i
Transformer – 5 (1x3mva, 33kv/ 0.415kv):Passive Tuned Harmonic Filter; 3422A (incl. 30%
overload) 415v, 50 Hz 5760kvar. Tuned at 5th/7th to limit THD-v & THD-i
The plant installed these filters in the month of May – 2013. In order to assess benefits
gained by the installing harmonic filter at transformer – 4 and transformer – 5, plant team
carried out detailed analysis. The analysis was carried out for:
1. Effect on breakdown
2. Effect on energy consumption
3. Effect on production and specific energy consumption
Post Mitigation Analysis
Effect on harmonics:
After installation of passive harmonic filter at transformer 4 and transformer 5, the plant
team carried out measurement at the above mentioned feeders. Table – 4 gives summary of

Case Study 38
Reduction in Break Down and Specific Energy Consumption by Reducing Harmonics at Usha Martin – Wire Rope Plant
A PQ Case Study
APQI (C) Copyright (2013) All Rights Reserved 9
comparison of harmonic level measured at transformer 4 and 5 with and without harmonic
filter.
Location
Without Harmonic filter With Harmonic Filter
Vthd Ithd Vthd Ithd
Transformer – 4 12% 21% 2.10% 11.20%
Transformer – 5 15% 60% 1.20% 7.20%
Transformer - 4
Figure -3A and 3B shows snapshots of voltage waveform and harmonic levels measured
without and with harmonic filter at transformer – 4. From the snapshot it can be seen that
without harmonic filter the waveform is distorted where as with harmonic filter the
waveform is more of sinusoidal nature with lower level of voltage distortion.
Table-4 Voltage and Current THD comparison
Figure – 3A Vthd and Voltage waveform without harmonic filter at TR-4

Case Study 38
Reduction in Break Down and Specific Energy Consumption by Reducing Harmonics at Usha Martin – Wire Rope Plant
A PQ Case Study
APQI (C) Copyright (2013) All Rights Reserved 10
Figure -4A and 4B showssnapshots of current waveform and harmonic levels measured
without and with harmonic filter at transformer – 4. From the snapshot it can be seen that
without harmonic filter the waveform is distorted where as with harmonic filter the
waveform is more of sinusoidal nature with lower level of current distortion . Graph 4B
shows that 5th order harmonics increased, however graph 4A has maximum value of THD up
to 40% where as graph 4B has maximum value of THD up to 20%.
Figure – 3B Vthd and Voltage waveform with harmonic filter at TR-4
Figure – 4A Ithd and current waveform without harmonic filter at TR-4

Case Study 38
Reduction in Break Down and Specific Energy Consumption by Reducing Harmonics at Usha Martin – Wire Rope Plant
A PQ Case Study
APQI (C) Copyright (2013) All Rights Reserved 11
Transformer - 5
Figure -5A and 5B shows snapshots of voltage waveform and voltage harmonic levels
measured without and with harmonic filter at transformer – 5. From the snapshot it can be
seen that without harmonic filter the waveform is distorted where as with harmonic filter
the waveform is more of sinusoidal nature with lower level of voltage distortion.
Figure – 4B Ithd and current waveform with harmonic filter at TR-4
Figure – 5A Vthd and voltage waveform without harmonic filter at TR-5

Case Study 38
Reduction in Break Down and Specific Energy Consumption by Reducing Harmonics at Usha Martin – Wire Rope Plant
A PQ Case Study
APQI (C) Copyright (2013) All Rights Reserved 12
Figure -6A and 6B shows snapshots of current waveform and current harmonic levels
measured without and with harmonic filter at transformer – 5. From the snapshot it can be
seen that without harmonic filter the waveform is distorted where as with harmonic filter
the waveform is more of sinusoidal nature with lower level of voltage distortion.
Figure – 5B Vthd and voltage waveform with harmonic filter at TR-5
Figure – 6A Ithd and current waveform without harmonic filter at TR-5

Case Study 38
Reduction in Break Down and Specific Energy Consumption by Reducing Harmonics at Usha Martin – Wire Rope Plant
A PQ Case Study
APQI (C) Copyright (2013) All Rights Reserved 13
Effect on breakdown:
Table -4 shows comparison of failure rate of different component in the plant before and
after installation of harmonic filter.
Component Ratings FY 13 APR 13 MAY 13 JUN 13 JUL 13 AUG 13 SEP 13 OCT 13 NOV 13
< 3 KW 14 2 1 0 0 1 0 0 0
3-5 KW 11 1 1 0 0 0 0 1 0
5-10 KW 2 1 1 0 0 0 0 0 0
10-25 KW 4 4 2 1 0 0 1 0 0
>25 KW 2 3 1 0 0 0 0 0 0
Total 33 11 6 1 0 1 1 1 0
< 1 KW 4 0 0 0 0 1 0 0 0
1-11 KW 45 2 1 0 1 0 1 0 0
> 11 KW 7 1 1 0 0 1 0 0 0
Total 56 3 2 0 1 2 1 0 0
< 1 KW 9 0 0 0 0 1 0 0 0
1-11 KW 6 0 2 1 0 0 0 0 0
> 11 KW 8 1 0 0 1 0 0 1 0
Total 23 1 2 1 1 1 0 1 0
No of Motors
Failed
No of Drives
Failed
No of PLCs
Failed
Component Failure Trend
Before HF After HF
Figure – 6B Ithd and current waveform with harmonic filter at TR-5
Table – 4 Breakdown – Before and after installation of harmonic filter

Case Study 38
Reduction in Break Down and Specific Energy Consumption by Reducing Harmonics at Usha Martin – Wire Rope Plant
A PQ Case Study
APQI (C) Copyright (2013) All Rights Reserved 14
Table 5 shows change in annual rate of failure before and after installation of harmonic
filter.
Component
Annual failure rate
before Harmonic filter – FY 2012-13
June-Nov 2013
Failures
Extrapolated - Annual failure rate
after harmonic filter
Change in failure rate
Motors 43 4 8 -81% Reduced by 81%
Drives 52 4 8 -85% Reduced by 85%
PLC's 22 4 8 -64% Decreased by 64%
From table 4 and 5 it can be seen that after installation of harmonic filter, there is significant
reduction in breakdown of different component. Each break down result in loss of
production time in addition to replacement cost for each break down and specific energy
norms going up.
Average benefits gained by the plant due to reduction in breakdown:
1. Average monthly cost saving by INR 240,000.00 due to avoided maintenance cost
2. Average increase in production time - 98 hours per month
Effect on Electricity Charges:
Apart from reduction in breakdown, installation of harmonic filter also helped in reduction
of specific energy consumption.Table-6 shows reduction in average electricity cost on
monthly basis.
ACTUAL ELECTRICITY BILL
Months Monthly
Average - FY13
Monthly Avg Jun-Oct13
% Change
Energy Consumption – kWh
1,891,930.00
1,778,352.00 ↓ by 6%
Maximum demand – kVA
9,236.00
7,872.00 ↓ by 14.77%
Table-5 Breakdown rate – Before and after harmonic filter

Case Study 38
Reduction in Break Down and Specific Energy Consumption by Reducing Harmonics at Usha Martin – Wire Rope Plant
A PQ Case Study
APQI (C) Copyright (2013) All Rights Reserved 15
Unit rate - INR per kWh
5.40
5.40
Demand Charges INR per kVA
235.00
235.00
Part "A" Energy Consumption
10,216,422.00
9,603,100.80 ↓ by 6%
Part "B" Maximum Demand
2,170,460.00
1,849,920.00 ↓ by 14.77%
Total (A+B)
11,957,272.00
11,453,020.80 ↓ by 4.22%
Surcharge For 110% of Contact Demand
94,000.00
- ↓ by 100%
Miscellaneous Charges (Voltage Rebate)
358,718.16
343,590.62 ↓ by 4.22%
Current D.P.S
107,980.00
- ↓ by 100%
After Date D.P.S
76,699.92
186,502.00 ↑ by 143%
Total (C)
(80,038.24)
(157,088.62) ↓ by 96%
Total (A+B+C)
11,877,233.76
11,295,932.18 ↓ by 4.9%
Rebate (PF/LF/Voltage):2% of Total (A+B)
239,145.44
229,060.42 ↓ by 4.22%
Total Assessment in Rs
11,638,088.32
11,066,871.76 ↓ by 4.9%
Total Assessment in Rslakhs
116.38
110.67 ↓ by 4.9%
While assessing change in energy consumption, production levels were also considered.
Average monthly production for the financial year 2012-13 was 10,935 tons. Average
monthly production recorded for the period of June to October 2013 was 11,632 tons. There
is increase in production by 6.4% and reduction in energy consumption by 6%. Overall
reduction in monthly average electricity bill was 4.9%.
With the reduction in energy consumption and increase in production, specific energy
consumption of the wire rod production has reduced significantly.
SPECIFIC ENERGY CONSUMPTION
Parameter Monthly Monthly % Change
Table-6 Energy cost – Before and after harmonic filter

Case Study 38
Reduction in Break Down and Specific Energy Consumption by Reducing Harmonics at Usha Martin – Wire Rope Plant
A PQ Case Study
APQI (C) Copyright (2013) All Rights Reserved 16
Average - FY13
Avg Jun-Oct13
Finish Machine Production in tons 10935 11632 ↑ by 6.4%
KWH/Ton of Production (JSEB) 173 153 ↓ by 11.6%
Rs/Ton of Production 1064 951 ↓ by 10.6%
From the table-6 it can be seen that after installation of passive harmonic filter, finished
machine production has increased by 6.4%. One of the factors of increased productivity can
be attributed to reduced breakdowns. Apart from increase in production, there is reduction
in energy consumption. Reduction in energy consumption is due to reduction in losses
arising out of harmonic current. With increase in productivity and reduction in energy cost,
specific energy consumption is reduced by 11.6%.
The benefits gained by the plant can be summarised as:
1. Reduction in maintenance, repair and replacement cost due to breakdowns.
2. Increased production due to reduction in breakdowns
3. Reduction in specific energy consumption
Financial Analysis: Financial benefits gained by the plant after installation of harmonic filter can be classified
under two heads.
1. Reduction in specific energy consumption
2. Reduction in maintenance, repair and replacement cost of failed components
Table-7 below shows financial analysis of the investment and benefits.
Financial Analysis
Part A - Reduction in specific energy consumption Unit of Measurement
Rs/Ton of Production in FY13 1,064.00 INR/Ton
Rs/Ton of Production on 31.10.13 951.00 INR/Ton
Net Gain in Rs/Ton of Production 113.00 INR/Ton
If Avg Monthly Production remains 11,000.00 Tons
Table-6 Specific Energy Consumption

Case Study 38
Reduction in Break Down and Specific Energy Consumption by Reducing Harmonics at Usha Martin – Wire Rope Plant
A PQ Case Study
APQI (C) Copyright (2013) All Rights Reserved 17
Avg Monthly Monitory Gain
1,242,226.00 INR
Average annual monitory gain - A
14,906,714.00 INR
Part B - Reduction in maintenance, repair and replacement
Average monthly reduction in maintenance cost 240,000.00 INR/Month
Annual reduction in maintenance cost - B 2,880,000.00 INR/Year
Total (A+B) 17,786,714.00 INR/year
Investment 9,800,000.00 INR
Simple Payback 7 Months
From the table-7 it can be seen that the investment made by the plant to mitigate
harmonics has paid back within 7 months.
Conclusion: Reduction of production cost is one of the prime concerns of any production facility. In
order to reduce operation cost, better control over manufacturing process and quality use
of variable frequency drive is becoming common practice in the industry. Apart from
utilisation of drives, PLC’s are also integral part of any manufacturing process. As drives
convert frequency, generation of harmonics cannot be avoided.
Harmonics in the plant can cause:
1. Failure of various electrical/ electronic component 2. Increased energy losses due to heat generated by harmonics
From the above case study, it can be seen that by reduction of harmonics a plant can be
benefited in more than one way. The investment carried out to install harmonic filter can be
paid back within a year. Benefits gained by the plant would be:
1. Significant reduction in specific energy consumption – monetary benefit due to reduction in energy cost
2. Improved productivity due to reduced down time 3. Reduction in failure rate of various electrical/ electronic component – Cost benefit
for replacement/repair/maintenance of failed component
Table-7 Financial Analysis

Case Study 38
Reduction in Break Down and Specific Energy Consumption by Reducing Harmonics at Usha Martin – Wire Rope Plant
A PQ Case Study
APQI (C) Copyright (2013) All Rights Reserved 18
About the Author:
Name: Jeetendra Kumar Jain
General Manager- Usha Martin Limited, Wire & Wire Rope Division
Email: [email protected]
Mr. Jeetendra Kumar Jain is graduate mechanical engineer and MBA in operations. He is
currently heading engineering activities at Usha Martin. Apart from Engineering & Projects,
he is also looking after Safety, Environment, Risk Management, Branding, Kaizen Cell and
IMS.
Mr. Jain has successfully reduced operating cost by reducing energy cost, operating
practices and process improvements in his past assignment at Hindalco and AMCO. At Usha
Martin he initiated various energy conservation projects that also include reduction in
harmonics.
Disclaimer: The sole responsibility for the content of this document lies with the authors. It does not represent the opinion of
the Asia Power Quality Initiative and /or ICPCI/ICA network. APQI and ICA network are not responsible for any use that may
be made of the information contained therein.