a portable measurement system for the evaluation of human gait
TRANSCRIPT
JOURNAL OF AUTOMATIC CONTROL, UNIVERSITY OF BELGRADE, VOL. 19:1-6, 2009©
Abstract— A tool has been developed which can be used to evaluate human gait in a more detailed manner. Its purpose is to record data from an individual during gait then categorize and analyze the intrinsic phases with neuro-fuzzy techniques. The system is simple to use, adaptive, highly mobile, and does not require calibration. The hardware consists of four accelerometers and four force sensitive resistors to record data during walking which is then prepared and collected by a digital device and PDA computer. The gait data is passed into an intelligent fuzzy inference system managed by custom defined fuzzy rules to be classified into four stance phases (heel strike, flat foot, heel lift, toe push-off), and three swing phases (initial flexion, terminal flexion, and terminal extension). After the fuzzy system was trained using data from five healthy subjects, the system’s representative gait classification root mean squared error dropped from 0.2975 to 0.1200, showing a much improved ability to categorize human gait, despite its varied nature. The system represents a robust tool, which can be used in a clinical environment for the analysis of human gait in rehabilitative applications such as rule based control generation for functional electrical stimulation, and gait quality analysis.
Index Terms — Gait Phase Detection, Wearable Sensory
System, Rehabilitation of Walking, Rule Based Control
I. HUMAN GAIT ANALYSIS N order to quantitatively analyze the temporal and spatial characteristics of human gait, it is important to include gait data acquired from a natural environment
consisting of many step cycles. Unfortunately, human gait patterns can be considerably varied due to the biological responses received from the surrounding environment, as well as the nonlinear reflex mechanics which govern balance and positioning [1]-[3]. Accordingly, these variations make it difficult to define “benchmark” gait which prompts the necessity for developing a portable and accurate gait analysis tool for the clinic.
Equipment typically used to record human gait data such as video motion capture systems [4], [5] link experiments to a laboratory setting causing them to be too expensive for daily clinical use, and too time consuming to operate due
Received on Nov 9th 2009. This work was supported in part by the
Danish National Research Foundation, Copenhagen, Denmark and Ministry for Science and Technological Development of Serbia, Belgrade.
F. Stefanovic is currently a Ph. D. student at McGill University, Montreal, Canada. This project was done in fulfillment of a Master’s Degree at the Faculty of Electrical Engineering, University of Belgrade, Belgrade, Serbia (phone: +1.514.398.4400 ext. 00431; fax: +1.514.398.7461; email: [email protected]).
H. Caltenco is PhD student with the Center for Sensory-Motor Interaction, Aalborg University, Aalborg, Denmark. (phone: +45 99407575; Fax: +45 98154008; e-mail: [email protected])
DOI: 10.2298/JAC0901001S
to calibration and set up requirements. Moreover, they cause data to be recorded in an unnatural environment due to the limitations that constrain testing to only a small number of step cycles. These camera based systems are precise, yet, they are not practical for routine application. An alternative to camera based systems is to use more portable methods (e.g., goniometers and force sensors) which record joint angles (trajectories) and any associated ground force reactions. Unfortunately, goniometer based portable systems that are robust and easy to use are not readily available even though some flexible goniometers have excellent characteristics for the application (e.g., Penny and Giles, Biometrics, Gwent, U.K.). Nevertheless, other examples such as those that use force sensitive resistors (FSR), gyroscopes, and accelerometers to detect human gait patterns have recently received much attention [6]-[9]. Frequently, these systems come in the form of a wearable sensory apparatus which can be easily applied to a subject for testing and are practical in a variety of contexts. However, their ability to resolve gait phases is limited and often groups the cycles into larger collections (swing, stance) which cannot distinguish finer features [6], [8], [10]; e.g., the swing phase components are frequently classified vaguely as late swing, early swing, etc [11].
To design a more robust system for gain analysis, we must define the paradigms which are essential to its application. Most notably of course is that the wearable sensory system must be easy to put on for a variety of individual sizes, and robust enough to be applied to a variety of tasks, particularly in a clinical setting. It must also be taken into account that every individual has a unique movement pattern [1]-[3] which poses a significant dilemma for meticulous and comprehensive gait analysis; simply comparing data from one individual to another does not necessarily provide meaningful results. Nevertheless, it is suggested that generalized laws can be established in order to provide regulations to classify human gait patterns on a more selective level. In addition, for this system to be effective it must be able to distinguish the different phases of motion; here we define acceleration and ground reaction data as our units of measure. The preferred solution for tackling this problem is by using fuzzy logic (FL) to create an adaptable intelligent system [7], [9], [11], [14]. The method allows for ‘loose’ principles to be set as rules for the system in order to determine which gait phases correspond to the related accelerations and ground reaction forces. Therefore, a combination of simple hardware and robust software can be part of a promising tool used for assessing and classifying human gait in a qualitative and quantitative manner.
A Portable Measurement System for the Evaluation of Human Gait
Filip Stefanović, Hector Caltenco
I

2 STEFANOVIĆ F, CALTENCO F, A PORTABLE MEASUREMENT SYSTEM FOR THE EVALUATION OF HUMAN GAIT
Figure 1: Hardware placement used for each test subject’s right leg. The two ADXL311 pairs are placed on the thigh and shank, with the FSR insole placed in the shoe. Both ADXL311 pairs have a spacing, δ, of 21.2 cm between their respective ADXL311s. The DCU and PDA are secured with a belt onto each subject; the DCU is at the subject’s back, while the PDA is at the abdomen. The wiring for the hardware connection to the DCU is not shown. Also, the acceleration at the arbitrary reference point is shown by ā0.
II. DESIGNING A NEW TOOL In order to suitably evaluate human gait, it is required
that the most representative phases of gait cycle be defined. Gait cycle has been separated into two events: stance (foot on the ground) comprising four phases (heel strike, flat foot, heel lift, and toe push-off), and swing (foot off the ground) comprising three phases (initial flexion, terminal flexion and terminal extension). These phases must be discernable on a quantitative and analytical level, thus it is important to record all the necessary data whilst keeping the system as simple as possible.
A simple yet practical way to acquire ground reaction force data on the heel or toes is by using force sensitive resistors (FSR). Also, since the position of a swinging object – in this case a leg – can be correlated to its acceleration, accelerometers were anticipated to be an adequate tool to classify the swing phases of a gait cycle. Therefore, we select a combination of accelerometers and FSRs sensors as an acceptable measurement system for classifying the phases of human gait. In particular, four FSR sensors and four dual-axis accelerometers (ADXL311) were selected for evaluating the gait phases for one leg.
The FSR sensors used for this experiment have a resistance of 1 MΩ when they are not put under pressure. However, their operating range during this experiment was approximately between 2 kΩ and 10 kΩ when body weight (pressure on the sole of the foot) was exerted on them during walking; the more pressure exerted on the FSR, the less resistance it exhibits. The four FSR sensors were
secured onto an insole using non-conductive tape. They were then placed in a shoe in order to be located under a test subject’s calcaneus (heel), medial distal phalange (big toe), the most distal part of the medial 1st metatarsal (M. MT), and the most distal part of the lateral 5th metatarsal (L. MT). Additionally, for this application the ADXLs had a measurable operating range of ±2g which corresponds to voltage outputs between 2.1 and 2.7 volts and the output resolution was amplified by a custom built hardware interface. Moreover, the four ADXLs were paired for appropriate positioning on the outer lateral portions of the shank and thigh segments as required for analysis. The pairs were fashioned so that they had a spacing of 21.2 cm between their respective accelerometers; one ADXL pair was secured to the thigh, whilst the other to the shank, Figure 1.
To highlight the application, equations (1) – (6) show that the differences between the sensory outputs from two ADXL sensors on the same segment are proportional to the square of the angular velocity and the angular acceleration of the segment. The equations show that even though the reference point undergoes acceleration, the relationship between angular acceleration and position does not change because the unknown acceleration is cancelled out.
TdNdaa
112
01 αω ++= (1)
TdNdaa
222
02 αω ++= (2) By subtraction, the term ā0 is eliminated:
TddNddaa
)()( 12122
12 −+−=− αω (3)
TNaa
αδω +=− 212 (4)
Then, splitting the equation into its tangential and normal components yields:
δ αkuu xx =− 12 (5) 2
12 δ ωkuu yy =− (6)
Where the constant k is the conversion coefficient of the sensor, d1 and d2 are the distances to the accelerometers from an arbitrary reference point, δ is the distance between the sensors, ω2 is the square of the angular velocity, α is the angular acceleration of the pendulum, ā1 and ā2 are the absolute accelerations experienced by the sensors, and ā0 is the unknown acceleration of the reference point. The terms N and T denote the normal and tangential directions, respectively. For this system, only Eq. (5) is used since it is the tangential component of acceleration (i.e. the angular acceleration of the segment) and Eq. (6) was only given to compliment the rationalization.
TABLE 1 STEP FUNCTION DEFINITION
PHASE VALUE
HEEL (HO) 0.00 FLAT FOOT (FF) 0.13 HEEL LIFT (HL) 0.33 TOE ONLY (TO) 0.50 INITIAL FLEXION 0.67 TERMINAL FLEXION 0.87 TERMINAL
EXTENSION 1.00
JOURNAL OF AUTOMATIC CONTROL, UNIVERSITY OF BELGRADE, VOL 19, 2009. 3
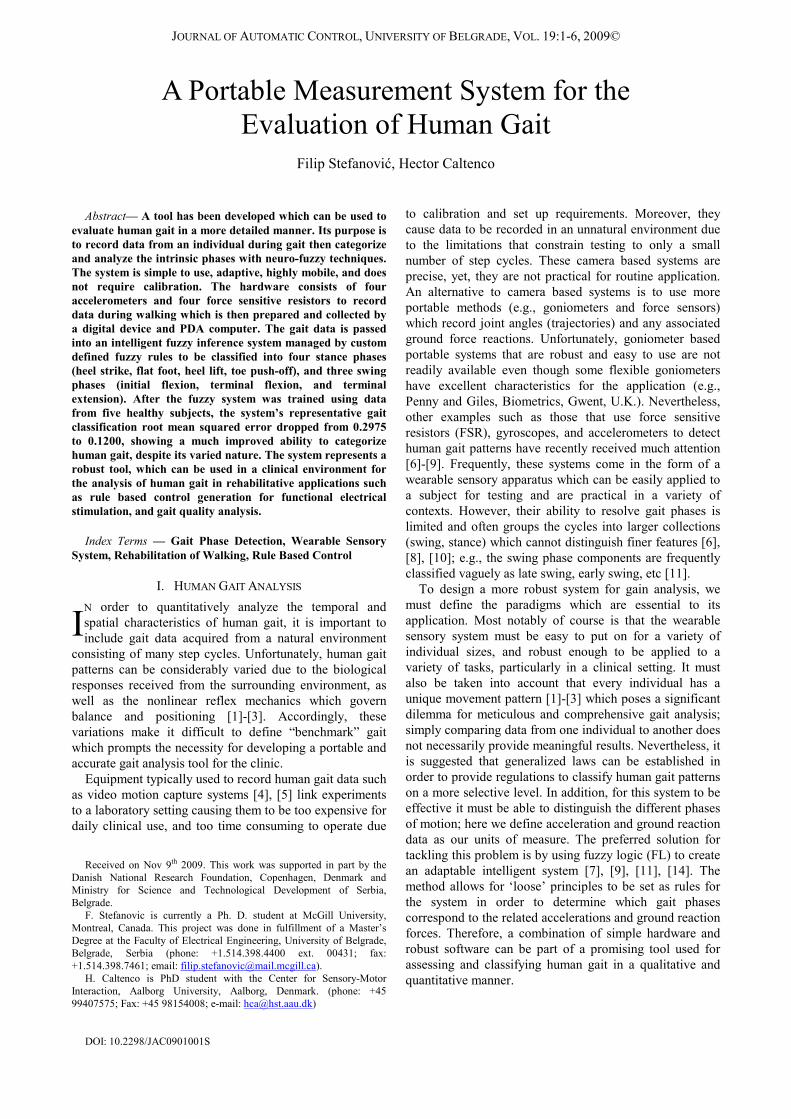
TABLE 2
REPRESENTATIVE STANCE PHASE TIMES (S) CADENC
E HO FF HL TO TOTAL
N/A 0.35 0.66 0.25 0.02 1.10 1.62 0.33 0.53 0.27 0.01 1.01 1.41 0.20 0.44 0.37 0.03 1.06 1.58 0.22 0.59 0.34 0.01 1.12 1.61 0.24 0.62 0.29 0.01 1.19 1.65 0.22 0.78 0.22 0.01 1.10 1.59 0.22 0.77 0.3 0.01 1.18 1.73 0.29 0.6 0.32 0.01 1.23 1.74 0.22 0.69 0.38 0.02 1.23
AVERAGE 1.61 0.24 0.63 0.31 0.014 1.14
ERRORS FOOT CONTACT
VARIATION 4.8% TIMING ERROR 5.7%
The four ADXLs and four FSRs were connected to a custom built data collection unit (DCU) hardware interface, Figure 1. The DCU is a device which collects, filters, and then amplifies the signals coming from FSR and ADXL sensors to prepare the data for digital conversion. Amplification by the DCU is dependent on the FSR sensors but did not exceed 25. Also, all sensor inputs in this experiment were filtered by an analog second order low pass filter with a cut-off frequency of 2.5 Hz before being digitized (4 Channel, National Instruments CF-6004 A/D card; +5 volt supply) and recorded by a PDA computer (HP/Compaq iPAQ hx4700) which wirelessly transmitted the data to a laptop for offline analysis; data were collected at 100 samples per second. Both the DCU and the PDA were fastened to the test subjects with a belt that positioned the DCU at the lower back and the PDA at the abdomen (Figure 1). The acquisition software used in conjunction with the hardware interface was developed in the LabVIEW 7.1 environment and was implemented on the PDA.
Five healthy males with an average age of 23.6 (±1.52) years and an average height of 178 (±3.54) cm were selected for testing. Recall that each individual has their own unique gait pattern, thus it was deemed necessary to standardize stride length and phase time to maintain consistent data. As such, the cadence speed was standardized by using a metronome set to 70 beats per minute which indicates a comfortable walking speed of 70 steps per minute – the test subjects were asked to duplicate the step speed during recording. The stride length was also standardized by marking off twenty lines, 60 cm apart, and the subjects were instructed to step on them during testing; this provided 10 paces of useful data as only one leg was linked with the hardware. Note that this standardization was only done for experimental purposes and is not required for normal use. In any case, the subjects were not required to be strictly precise when standardizing gait since imprecise (fuzzy) rules would later be used for classifying their characteristics. During these tests, each subject was recorded three times under the same conditions while the best of the three recorded sets of data
was taken as the control. The “best sets” were selected by investigating the defined propagation of FSR output data, termed best fit (BF). In other words, it was checked whether or not the FSR data generally followed the defined normal foot motion progression of Heel, Flat Foot, Heel Lift and Toe Only contact, in that order. The representative subject (i.e. control subject) for the investigation was chosen by evaluating which individual’s FSR data followed the BF most accurately.
Following this, imprecise rules were generated in order to develop a fuzzy inference system (FIS) which could analyze the recorded gait patterns and classify their phases. Of course, in this case the solution was to create partial membership functions such as those available in fuzzy logic. Fuzzifying the BF rules (i.e. allowing them to be only partially true) can allow the system to be more robust and applicable to the varying gait data which is unique to every individual. Since 6 inputs are required for classification (i.e. the 4 FSR outputs, and the 2 calculated tangential accelerations), the FIS required 6 input membership functions (MF) to create a summed weight for system classification. The 6 MFs were selected as: shank acceleration, thigh acceleration, heel FSR, M. MT FSR, L. MT FSR, and toe FSR. Accordingly, the MFs were defined by investigating FSR and accelerometer output as they pertained to each gait phase. Since acceleration and position are related in pendulum motion, the three phases of swing were defined solely by acceleration since the FSRs would not be in contact with the ground.
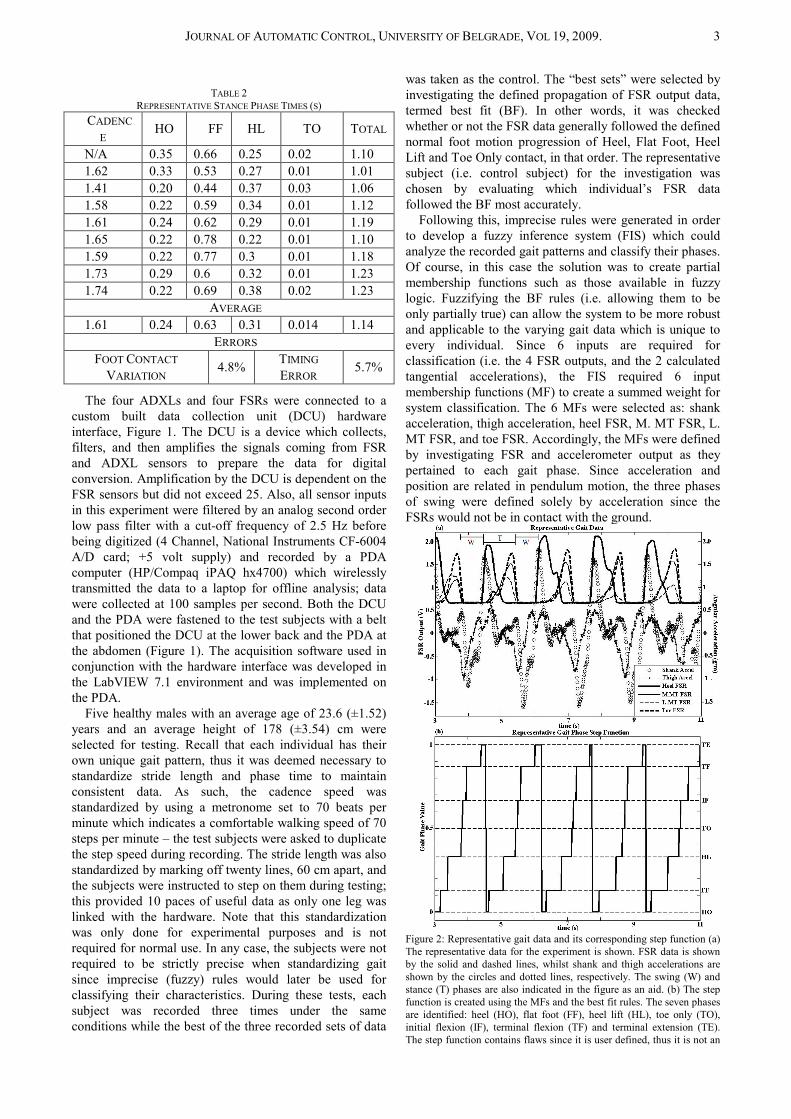
Figure 2: Representative gait data and its corresponding step function (a) The representative data for the experiment is shown. FSR data is shown by the solid and dashed lines, whilst shank and thigh accelerations are shown by the circles and dotted lines, respectively. The swing (W) and stance (T) phases are also indicated in the figure as an aid. (b) The step function is created using the MFs and the best fit rules. The seven phases are identified: heel (HO), flat foot (FF), heel lift (HL), toe only (TO), initial flexion (IF), terminal flexion (TF) and terminal extension (TE). The step function contains flaws since it is user defined, thus it is not an

4 STEFANOVIĆ F, CALTENCO F, A PORTABLE MEASUREMENT SYSTEM FOR THE EVALUATION OF HUMAN GAIT
acceptable solution. It can however be used as a reference for later application as untrained FIS output data.
Uncovering the appropriate acceleration condition for each phase helps provide the shank and thigh MF characteristics (e.g. positive maximum acceleration coincides with maximum extension, negative maximum acceleration coincides with maximum flexion, etc). Thus, since we can easily measure what occurs at maximum and minimum segment positions (acceleration characteristics) we can extrapolate what we should observe at the intermediate points as well. Similarly for stance phases, the FSR MFs were characterized based on whether the sensor was on or off. This means that the FSR MFs define how accurate the BFs are in relation to the observed on/off conditions (e.g. the heel lift phase will have the following FSR MF conditions: heel - off, M. MT - on, L. MT - on, toe - on).
In order for the FIS and its rules to operate correctly, a set of untrained data must be created as a base model for tuning. To accomplish this, the gait phases are quantized as shown in Table 1 and then applied at the appropriate intervals depending on the FSR and segment acceleration data; the gait phase values were normalized on the interval [0, 1]. Note that the values were chosen arbitrarily and have no meaning other than for classification. A Sugeno-type FIS which evaluates “AND” logic gates using the product method was selected with linear untrained outputs defined by the same values given by the gait phase function and was trained using the back propagation method for 100 epochs.
Figure 3: Examples of the variability associated with human gait. (a) The data shows that Subject #2 generally ends the stance phase (T) with a L.MT push-off instead of a toe push-off (i.e. L.MT is the last FSR to reach zero). The swing phase is denoted by W. (b) The data shows Subject #5’s stance phase ends with toe push-off but with substantial weight being applied to the L.MT portion of the foot.
The system was trained using the representative subject’s data, and checked using data from subject #3. The three remaining test subjects’ data were used for testing. Finally, the “checking” and “testing” data sets were obtained from subjects who demonstrated gait patterns which did not comply with the finite BFs. The FIS system and its MF rules were created in the MATLAB fuzzy toolbox and trained in the ANFIS editor GUI.
III. RESULTS The first step in deciphering the raw data was to record
it in terms of start and stop times for each input interval so that data consistency between the subjects could be determined, as well as overall accuracy. Table 2 shows the absolute FSR contact times (in seconds) as recorded by each of the sensors for the most representative subject. The foot contact variation was calculated by comparing the total average foot contact time with the sum of the total average heel, flat foot, heel lift and toe only times; it defines the average difference in time that the foot is in contact with the ground during stance.
Figure 4: Fuzzy MFs created for the FIS. (a) The shank acceleration MF designed for rule evaluation. PosMax indicates the maximum positive acceleration during gait, and NegMax indicates the negative maximum acceleration during gait. Midrange denotes accelerations that are close to zero. (b) The thigh acceleration MF designed for rule evaluation. (c) The FSR MFs are comprised of on and off memberships. On indicates when an FSR is in contact with the ground, off indicates when it is not. All

JOURNAL OF AUTOMATIC CONTROL, UNIVERSITY OF BELGRADE, VOL 19, 2009. 5
four FSR MFs (Heel, M.MT, L.MT, Toe) have this same shape. The MF level ranges from 0 (false) to 1 (true).
The timing error was calculated by comparing the cadence time to the metronome time. Accordingly, the results from the other subjects were similar to that of Table 2 and are not included. The cumulative average foot contact variation and timing errors were 3.63% and of 3.16% among all individuals, respectively. These results demonstrate a strong consistency in the data and confirm the accuracy of the gait standardization described earlier.
Figure 5: Untrained FIS output (a) The training data is plotted with the step function. (b) The testing data is plotted with the step function. In both diagrams the FIS output is represented by stars, while the step function (FIS data) is represented by circles; the step function appears as a thick dark line in most cases. It may seem as though the untrained FIS behaves very well, but recall that the step function is not a good representation of gait.
The acceleration and FSR data recorded from the representative subject is shown in Fig. 2a. Fig. 2b and includes the quantized gait phase values (defined earlier) using the data from Fig. 2a. The step-like function was realized by using Table 1 as well as the maxima and minima of the acceleration graphs. Accordingly, the stance phases were all defined by investigating the FSR sensors whilst the remaining three swing phases were defined by investigating the correlation between angular acceleration and position. That is, the initial flexion is defined to occur at the local shank acceleration maximum, terminal flexion is defined to occur at the shank negative maximum acceleration, whilst the terminal extension is defined to occur at positive maximum shank acceleration. As such,
the thigh acceleration reaches its minimum at approximately initial flexion and its maximum at terminal extension.
Figure 6: Trained FIS output. The transition between the phases is made evident by the trained FIS whose output shows consistent behaviour in classifying gait automatically for the subjects.
Observe that the defined BFs may work very well for the representative test subject, but do not for some of the other four subjects (Fig. 3). Fig. 3a and Fig. 3b show different walking patterns than that of the representative subject since they tended to push off with the lateral phalanges rather than the medial. This indicates that the “Toe Only” phase is not synchronous with the BF and therefore the finite BF rules would not fully apply. Recall, that since the finite BF rules are absolute (i.e. true or false), fuzzy MFs were introduced to satisfy the conditions. The MFs selected for the shank and thigh accelerations are shown in Fig. 4a and Fig. 4b, respectively, whilst the MF shape used for all 4 FSRs is shown in Fig. 4c. The acceleration MFs are shaped by three curves: NegMax, Midrange, and PosMax. NegMax indicates when the segment acceleration is at its negative maximum (i.e. maximum flexion), PosMax indicates when it is at its positive maximum (i.e. maximum extension), and Midrange indicates when the acceleration is close to zero (e.g. acceleration is low during stance, thus toe push off will have a relatively low initial shank acceleration). Note that the stance phase’s MFs follow BF progression.
Recall that a step function was defined from the finite BFs of the FSRs and the accelerations in order to quantify

6 STEFANOVIĆ F, CALTENCO F, A PORTABLE MEASUREMENT SYSTEM FOR THE EVALUATION OF HUMAN GAIT
the seven phases of human gait. The resultant gait phase function was used for the fuzzy system in order to provide an output classifier for the FIS behavior. The untrained FIS output behavior for the representative and testing model is shown in Fig. 5 whilst the trained FIS output is shown in Fig. 6. Notice that the system showed consistent behavior while classifying the phases. The untrained model had training, checking, and testing data root mean squared errors (RMSE) of 0.29 0.31 and 0.34, respectively. The trained FIS model showed training, checking and testing data RMSEs of 0.12, 0.15 and 0.16, respectively. This substantial improvement of RMSEs for the trained FIS output shows that machine learning provided a much more accurate estimate for classifying human gait. It demonstrates that the FIS was able to recognize the seven phases of gait even though FSR and accelerometer data was varied for the 5 subjects.
IV. DISCUSSION The results have shown an adaptive and robust tool
which is applicable to gait analysis. With a high degree of accuracy, the device demonstrates an ability to investigate a wide variety of gait phases as well as the associated characteristics associated with healthy motion. In fact, the ability to classify several components of swing and stance phases separates it from other systems and makes it a far more attractive option for gait analysis. Granted, there is room for improvement in the system by enhancing the associated MFs, however it is able to classify gait with small errors (~12%) for widely varying gait patterns.
Additionally, since the hardware setup is quite simple, the system demonstrates a practical approach for clinical application in gait analysis as well. Present rehabilitation techniques such as functional electrical stimulation (FES) are administered by using user specific rule based control schemes for stimulation [11], [13], [14]. The trained FIS presented here can easily be adapted for this application in order to determine the rules necessary for such control. That is, by separating gait into its associated phases, the generation of rules for the controller can be tied specifically to certain gait phases. Generally, FES systems are controlled by muscle stimulation levels to create torque profiles in order to match sets of desired joint trajectories [1]-[3]. Since the gait phases can be classified by the defined fuzzy system, only an addition of corresponding muscle behavior would have to be performed in order to create a set of rules for its control. Of course, the novel gait analysis tool provides this capability in a noninvasive and highly mobile manner coupled with an adaptive and detailed approach. Of course, the development of rule based control is an essential step for applying several modern approaches in rehabilitation, such as in restoration of walking [5], [7], [9], [11]-[13] and rehabilitation. For this reason, rule based control is a preferred option for applying rehabilitation techniques in applications due to considerable lag and other complexities associated with feedback control. The designed wearable system can therefore be used as a medium to develop these rules as they pertain to an individual's gait symptoms and can be tuned to conform specifically to unique users.
Notably, the results attained from the measurement system can be analyzed to show the quality of gait using
analytical methods and numerical tools, such as that available through Optiwalk [15].
It should also be highly emphasized that attaching the developed system to an individual takes, on average, less than 10 minutes, calibration is not necessary for proper operation, and the system communicates with a computer using BlueTooth technology. This allows for a high level of robustness in the system, ease of use, as well as an unrestricted movement environment for the subject in consideration.
ACKNOWLEDGEMENT We would also like to acknowledge the support of Prof.
Dejan Popović and Dragana Miljković, MS student at the Faculty of Electrical Engineering, University of Belgrade
REFERENCES [1] Popović DB, Sinkjær T. ‘Control of Movement for the Physically
Disabled’, Springer: London, 2000. [2] Tomović R, Popović DB, Stein R. ‘Nonanalytical Methods for
Motor Control’, World Scientific Publishing: Singapore, 1995, pp. 119-132.
[3] Popović DB, Stein R, Oğuztöreli M, Lebiedowska M, Jonić S. Optimal Control of Walking with Functional Electrical Stimulation: A Computer Simulation Study, IEEE Transactions on Rehabilitation Engineering, 1999, vol. 7, pp. 69-79.
[4] Zhang R, Vogler C, Metaxas D. Human Gait Recognition at Sagittal Plane, Image and Vision Computing, 2007, vol. 25, pp. 321-330.
[5] Tao L, Inoue Y, Shibata K, Morioka H. Development of wearable sensor combinations for human lower extremity motion analysis, IEEE International Conference on Robotics and Automation, 2006, pp. 1655-1660.
[6] Pappas I, Popović M, Keller T, Dietz V, Morari M. A reliable gait phase detection system, IEEE Trans on Neural Systems and Rehabilitation Engineering, 2001, vol. 9, pp. 113-125.
[7] Luo R, Yu-Chih Y. Sensory controlled intelligent assistant system for walking rehabilitation, IEEE Annual Conference of Industrial Electronics Society, 2002, pp. 1573-1578.
[8] Šurdilović D, Jinyu Z, Bernhardt R. Gait phase and center of pressure measuring system, IEEE International Conference on Industrial Informatics, 2004, pp. 331-334.
[9] Liu T, Inoue Y, Shibata K. A Wearable Sensor System for Human Motion Analysis and Humanoid Robot Control, IEEE International Conference on Robotics and Biomimetics, 2006, pp. 43-48.
[10] Gardner M, Barker J, Briggs S, Backus S, Helfet D, Lane J, Lorich D. An evaluation of accuracy and repeatability of a novel gait analysis device, Archives of Orthopaedic and Trauma Surgery, 2007, vol. 127, pp. 223-227.
[11] Skelly M, Chizeck H. Real-time gait event detection for paraplegic FES walking, IEEE Transactions on Neural Systems and Rehabilitation Engineering, 2001, vol. 9, pp. 59-68.
[12] Melendez A, and Caltenco H. Intelligent Control for an Active Transfemoral Prosthesis, M.S. Thesis, Aalborg University, Aalborg, Denmark, 2007.
[13] Kostov A, Andrews B, Popović DB, Stein R, Armstrong W. Machine Learning in Functional Electrical Stimulation Systems for Locomotion, IEEE Transactions on Biomedical Engineering, 1995, vol. 42, pp. 541-551.
[14] Popović DB, Radulović M, Schwirtlich L, Jauković N. Automatic vs. Hand-controlled Walking in Paraplegics, Medical Engineering & Physics, 2003, vol. 5, pp. 63-73.
[15] Došen S, Popović DB, Azevedo-Coste C. Optiwalk. Un nouvel outil pour la conception et la simulation de lois de commande pour le contrôle de la marche de patients atteints de déficits moteurs, Journal Européen des Systèmes Automatisés, 2007, vol. 41, pp. 239-259.