a population-based statewide survey on cancer …...maryland cancer survey, 2002 a population-based...
TRANSCRIPT

Maryland Cancer Survey, 2002
A Population-Based Statewide Survey on Cancer Screening and Behavioral Risk Factors
Funded by the Cigarette Restitution Fund
Cancer Prevention, Education, Screening, and Treatment Program
Maryland Department of Health and Mental Hygiene

Maryland Cancer Survey, 2002
A Population-Based Statewide Survey on Cancer Screening and Behavioral Risk Factors
Funded by the Cigarette Restitution Fund
Cancer Prevention, Education, Screening, and Treatment Program Maryland Department of Health and Mental Hygiene
Prepared by: Eileen Steinberger, MD, MS Annette Hopkins, RN, MS Min Zhan, PhD Jane Uman, MPH Monique Glover, MPH Ebenezer Israel, MD, MPH Department of Epidemiology and Preventive Medicine School of Medicine, University of Maryland, Baltimore Team Members from the Maryland Department of Health and Mental Hygiene Carmela Groves, RN, MS Marsha Bienia, MBA Diane Dwyer, MD Center for Cancer Surveillance and Control Please send your inquiries to: Eileen Steinberger, MD, MS Department of Epidemiology and Preventive Medicine University of Maryland, Baltimore 660 West Redwood Street Suite 100 Howard Hall Baltimore, MD 21201 [email protected] 410-767-0791
Acknowledgements
We sincerely thank Larry Magder, PhD, Division Head of Biostatistics, Department
of Epidemiology and Preventive Medicine, University of Maryland, Baltimore,
School of Medicine for his consultation on our survey methods and analysis.
Additional thanks to Alyse Weinstein, MS, Research Statistician, Center for Cancer
Surveillance and Control, Maryland Department of Health and Mental Hygiene
(DHMH) and Helio Lopez, MS, BRFSS Coordinator, Office of Public Health
Assessment, DHMH for consultation on BRFSS methods and data analysis.

Table of Contents
1. Survey Highlights and Introduction 2. Methods for Survey Design and Data Collection 3. Survey Sample 4. Colorectal Cancer Screening 5. Prostate Cancer Screening 6. Women’s Health: Breast and Cervical Cancer Screening 7. Oral Cancer Screening 8. Methods to Prevent Sun Exposure 9. Perceived Risk of Developing Cancer and Screening Behaviors 10. Access to Healthcare and Cancer Screening 11. Lifestyle Factors and Cancer Screening 12. Summary of the Maryland Cancer Survey, 2002 and Survey
Questionnaire

Maryland Cancer Survey, 2002 Highlights
• Compared to Healthy People 2010 objectives:
•
•
• • • • • •
Maryland exceeds the 2010 objectives: 58% of Marylanders ≥ 50 years of age report they have ever had a
colonoscopy or sigmoidoscopy, 84% of Maryland women ≥ 40 years of age report having had a
mammogram in the past 2 years, 90% of Maryland women ≥ 40 years of age report having had a
Pap smear in the past 3 years, 34% of Marylanders ≥ 40 years of age report having had an oral
cancer screening in the past year, 37% of Marylanders ≥ 40 years of age engage in vigorous physical
activity at least 3 days a week for 20 minutes a day.
Maryland does not meet the 2010 objectives for the following cancer risk factors: Smoking (18% of Marylanders age 40 years and older report
current cigarette use), Fruit and vegetable consumption (only 15% of Marylanders, ≥ 40
years of age, reported eating the recommended five or more servings per day),
Percent of the population who has a “normal” body mass index (35% of Marylanders ≥ 40 years of age were overweight and 25% were obese).
• Although there are no HP2010 objectives for prostate cancer screening, Maryland
exceeds the national baseline (based on BRFSS 2001) for PSA and DRE • African Americans were significantly less likely than the white population to:
Have had oral cancer screening (29% vs. 48%), Have had colonoscopy or sigmoidoscopy (54% vs. 60%).
• Cancer screenings generally increased with:
increasing age, higher education levels, higher income levels, having health insurance, having a primary health care provider, having had a physical exam in the past two years.
• Screening rates were higher when a health care provider recommended screening.

• “The doctor did not order the test” was always a prominent reason for not being screened among people who had not been screened or were not up to date with screening.
• Strengths of the Maryland Cancer Survey (MCS) include:
•
•
• • •
Population-based sample, weighted to the Maryland population, using national Behavioral Risk Factor Surveillance System survey methods A large sample size focusing on Marylanders who were 40 years of age and older
• Limitations of the MCS include:
Telephone survey using only land-line numbers, not cell phones Only took responses from those who spoke English Only surveyed those who lived in residences and not the institutionalized population

Chapter 1. Introduction
This document contains the results of the Maryland Cancer Survey (MCS) conducted in 2002. The MCS was commissioned by the Surveillance and Evaluation Unit of the Center for Cancer Surveillance and Control, Maryland Department of Health and Mental Hygiene (DHMH) and performed by the Department of Epidemiology and Preventive Medicine at the University of Maryland, Baltimore, School of Medicine. The purpose of the survey was to determine cancer screening rates and to measure cancer risk behaviors among persons age 40 years and older living in Maryland, for selected cancers. The goals established in Healthy People 2010 were used for comparison.
In 2000, the Maryland State Legislature established the Cigarette Restitution Fund (CRF)
with monies received from the tobacco settlement, which in turn led to the establishment of the Cancer Prevention, Education, Screening, and Treatment (CPEST) Program. Under this program, the Surveillance and Evaluation Unit is charged with collecting, analyzing, and monitoring data related to the seven cancers targeted by DHMH and with measuring and evaluating the results of cancer prevention and education in Maryland. The MCS meets this need by providing information concerning cancer screening rates, knowledge of cancer and cancer screening, and lifestyle factors related to cancer.
The State of Maryland has made great headway in its fight against cancer in the last 10
years, dropping from being first in the United States in cancer mortality in 1991 to 9th in 1999. Even with these improvements, over 23,000 cases of cancer (excluding non-melanoma skin cancer) were reported in 1999 and cancer remains the second leading cause of death, accounting for 24% of all deaths in Maryland. 1
With greater knowledge about the factors that affect cancer screening and cancer risk
behaviors, policies can be made and programs implemented to promote cancer prevention and screening for earlier detection of cancer. With a greater emphasis on cancer prevention and screening, fewer lives in Maryland will be lost to cancer.
1 Annual Cancer Report, Cigarette Restitution Fund Program, September 2002, Maryland Department of Health and Mental Hygiene.

Chapter 2. Methods for Survey Design and Data Collection The Maryland Cancer Survey (MCS) 2002 was conducted as a population-based, random digit dial, computer assisted telephone interview (CATI), utilizing list-assisted disproportionate stratified sampling. This method is similar to the Behavioral Risk Factor Surveillance System (BRFSS) Survey, conducted annually in each state and funded by the Centers for Disease Control and Prevention (CDC).1 Respondents for the MCS were limited to people 40 years and older, residing in a private household in the state of Maryland. People not eligible for the survey included those who were less than 40 years of age, did not speak English, or were unable to communicate because of a physical or mental impairment, and people living in group homes and institutions.
The state was divided into two geographic strata: urban (consisting of Baltimore City and the seven counties in the Metropolitan Baltimore-Washington, D.C. area) and rural (consisting of the remaining 16 counties in Western and Southern Maryland, and the Eastern Shore of Maryland) (Chart 2-1). Genesys, Inc. provided a pool of 100,000 random telephone numbers. The rural area was over-sampled, making up 31.5% of the telephone number pool, whereas the rural population comprises 21.5% of the total Maryland population. Each geographic stratum had three types of telephone number ‘blocks’: ‘listed one plus,’ ‘not listed one plus,’ and ‘zero block,’ corresponding to the number of residential telephone numbers found among a series of 100 numbers. Based on information from previous surveys, ‘one plus’ blocks were known to contain at least one residential telephone number, and were sampled at a higher rate than the ‘zero block’ telephone numbers.2 Staff from UMB and DHMH drafted a questionnaire and circulated it to the local CRF programs for comment. Validated questions were chosen from the BRFSS Survey, National Health Interview Survey (NHIS), National Health and Nutrition Examination Survey (NHANES), and the DHMH Oral Health Survey. Some questions were original to this survey. We conducted two focus groups, one on the Eastern Shore and the other in Baltimore City, to assess the comprehension and utility of the questions. The survey was piloted among 40 adults by telephone. Based on responses from the focus groups and the pilot survey, a final questionnaire was developed. Institutional Review Board approval was received from the University of Maryland, Baltimore, School of Medicine and DHMH. The questionnaire is included at the end of the report in Chapter 12. REDA, International Inc., a survey and research firm located in Wheaton, MD, conducted the interviews for the survey, using CATI technology. To reach a final disposition, REDA staff made up to nine calling attempts to each telephone number on various days of the week and at different times of the day. When someone answered the telephone, the number was confirmed to be a residential phone number (cell phones and non-residences were excluded). If it was determined that there was one person, age 40 years or older living in the household, that adult was interviewed. If two or more people lived there, then one was then chosen at random for the interview. An anonymous questionnaire was administered which took about 20 minutes. 1 Behavioral Risk Factor Surveillance System user’s guide-http://www.cdc.gov/brfss/usersguide.htm 2 Overview BRFSS-2002-http://www.cdc.gov/brfss/surveydata/2002/overview_02.rtf

Interviewers asked questions about demographics, cancer screening behaviors, health risk factors, and access to health care. Data Analysis The dataset was weighted according to the BRFSS weighting protocol.3 If a respondent refused to give his race or gender, the respondent was omitted from the analysis because those responses are required for weighting. The responses from 31 persons were deleted from the sample because the respondent refused to report race. For 65 respondents who failed to give their age, an age was imputed based on the mean age of other respondents in the same geographic stratum who had the same race and gender. Pre-stratification weighting was based on the sampling probability by geographic region (urban vs. rural), residential telephone sampling among the three types of phone numbers (listed one-plus, not listed one-plus, and zero block), the number of adults age 40 and over in the respondent’s household, and the number of residential telephone numbers in each household. Post-stratification weighting was based on the number of people in age-race-gender categories for each geographic stratum. The age strata consisted of five-year age groups (for example 40-44, 45-49, etc.) up through 69 years of age. Those 70 and older were combined into one age stratum because of small sample size in the older age-race-gender strata. A final weight was calculated based on the pre- and post-stratification weights.
Each demographic variable was stratified by Hispanic ethnicity. Because the number of people who identified themselves as Hispanic was very small (2%) (Table 3-1) and because only small differences by ethnicity were noted for the demographic or screening variables, Hispanic ethnicity is not listed separately among the “selected characteristics” in the analysis tables.
For all other demographic variables except income, there were a small number of
responses of “don’t know/not sure” and “refused,” and these responses are not included in the analysis. Where levels of income are reported in the analysis, the categories “don’t know/not sure” and “refused” are included. For the purposes of this analysis, groupings were made for the following categorical variables: marital status was combined into four groups: married or partner of an unmarried couple; divorced or separated; widowed; and never married. Education levels were combined into five levels: less than high school; high school graduate or graduate equivalent diploma (GED); some college (1-3 years); college graduate; and advanced degree. Employment was grouped into four categories: employed for wages; self-employed; retired; and other. Unemployed for less than or greater than one year, homemaker, student, and unable to work were all combined in the “other” category. Income categories were grouped as <$25,000; $25,000-<$35,000; $35,000-<$50,000; $50,000-<$75,000; and $75,000 and above.
All analyses presented on oral cancer screening include responses from the entire sample, age 40 years and older. The section on breast cancer screening includes responses from all women age 40 years and older, while the section on cervical cancer screening includes women age 40 years and older who have not had a hysterectomy. Analysis of colorectal cancer (CRC) screening questions (fecal occult blood test, sigmoidoscopy, and colonoscopy) contains responses of those age 50 years and older. Questions about knowledge of CRC screening were 3 BRFSS weighting formula-http://www.cdc.gov/brfss/ti-weighting.htm
analyzed for the entire sample, 40 years and older. Tables describing data on prostate specific antigen testing and digital rectal exam were analyzed for men age 50 and older. Tables assessing knowledge of prostate cancer screening and recommendations were analyzed for all men in the sample.
Statistical analyses (population-based numbers and percentages) were performed with weighted data using Stata, Version 8. Unless otherwise noted, results in the tables have the following values: “N” is the number of people in the sample who responded to a survey question, “n” is the number of persons in the survey sample answering “yes” to that question or the number who had that characteristic, the “wt N” (weighted N) is the number of people in the Maryland population who are represented by the sample n, the “wt %” (weighted percent) is the proportion of the Maryland population who, based on the weighted sample, answered “yes” to the question or had that characteristic. “95% CI” is the weighted 95% confidence interval around the weighted percent. (The 95% confidence interval can be thought of in the following manner-- If we take samples from our population over and over again, and calculate a confidence interval for the same characteristic of the population for each sample (e.g., the percentage of Maryland women having a Pap smear), we expect 95% of the resulting intervals to include the true value of that population characteristic.) All percentages are based on the number of respondents answering the question and excludes missing and “don’t know/not sure” answers (except for income questions, as previously described). In the tables, the heading “Stat Sig” stands for ‘statistical significance.’ Statistical significance for a survey question is explained by the symbol that is in the “Stat Sig” column opposite the selected characteristic that the question is being analyzed by. The symbol “**” in this column shows that there is a statistically significant difference with a p-value ≤ 0.05 for the characteristic shown. The symbol “^” shows that the differences were not statistically significant (i.e., p > 0.05). A total of 84,172 phone numbers were called or prescreened as non-residential numbers: 51.8% were non-working numbers, 10.3% were phone numbers of a business or institution, 5.6% refused the interview, and 6% resulted in 5071 completed interviews. The remaining 26.3% phone numbers were ineligible or excluded for a variety of reasons. The CASRO response rate, defined as Completed Interviews/(Eligible + Presumed Eligible) was 38.4%. The completion rate defined as Completed Interviews/Known Eligible was 65.4%.

Chart 2-1 Maryland Counties: “Rural” versus “Urban”
Counties of Maryland “Urban” Counties “Rural” Counties

Chapter 3. The Survey Sample
A total of 5,071 people were interviewed for the survey. Responses from 31 people who refused to give their race were omitted from the dataset for analysis, leaving 5,040 respondents. Sixty-eight percent of the sample lived in urban areas of Maryland, 32% lived in rural areas. Whites comprised 76% of the sample, African Americans and Blacks made up 20%, and Asians comprised 3%, Hawaiian and Pacific Islanders made up 0.1%, Native American and Alaskan natives made up 0.7%, and other responses comprised 2.0% of the sample. “African American” is used in the report to represent people who called their race African American or black. “Other” race refers to people who called their race something different from White or African American or black, and includes Asians, Hawaiian and Pacific Islanders, Native American and Alaskan natives, and any other responses to the race question. Respondents claiming Hispanic heritage accounted for 2% of the sample. Charts 3-1 and 3-2 compared the race and gender and the age of the survey respondents to the Maryland population. White women were over-represented in the sample, accounting for 46% of the respondents, compared to 38% of the population (Chart 3-1). People age 65 years and older made up 30% of the sample, compared to 26% of the population (Chart 3-2). Table 3-1 shows the demographics of the sample and their weighted proportions. The number of people who were surveyed in each county, is shown in Table 3-2, by gender and race.
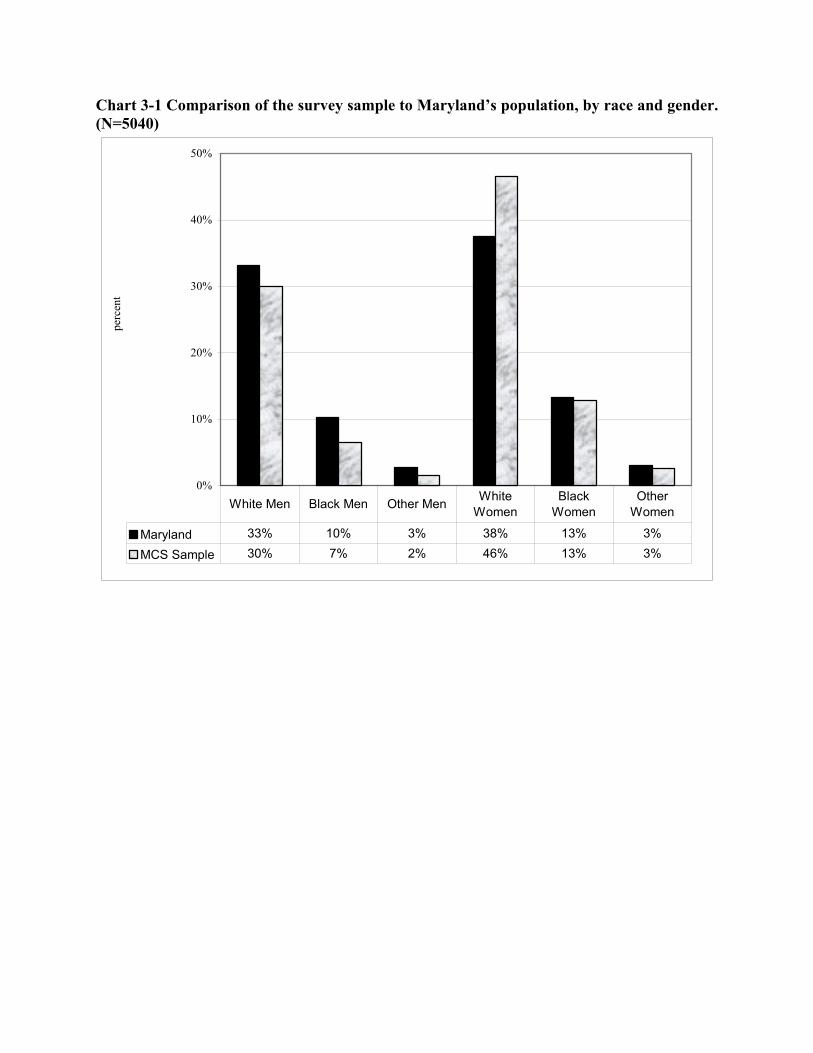
Chart 3-1 Comparison of the survey sample to Maryland’s population, by race and gender. (N=5040)
0%
10%
20%
30%
40%
50%
perc
ent
Maryland 33% 10% 3% 38% 13% 3%
MCS Sample 30% 7% 2% 46% 13% 3%
White Men Black Men Other Men White Women
Black Women
Other Women

Chart 3-2 Comparison of the survey sample to Maryland’s population, by age. (N=5040)
0%
10%
20%
30%
40%
50%
perc
ent
Maryland 37% 36% 14% 12%MCS Sample 32% 38% 17% 13%
40-49 years 50-64 years 65-74 years 75 years and above

TABLE 3-1 DEMOGRAPHICS OF THE SAMPLE POPULATION, AGE 40 YEARS AND OLDER, WEIGHTED NUMBERS AND PERCENTAGES, MARYLAND CANCER SURVEY 2002
Selected Characteristic N wt N wt % 95% CI N wt N wt % 95% CI N wt N wt % 95% CISurvey Sample, age 40 years and older 5040 2,276,083 100.0% 3405 1,785,735 78.5% 1635 490,348 21.5%
GenderMale 1920 1,050,301 46.2% 1298 816,587 45.7% 622 233,714 47.7%Female 3120 1,225,782 53.9% 2107 969,148 54.3% 1013 256,634 52.3%
Age 40-49 years 1604 850,758 37.4% 1116 674,903 37.8% 488 175,855 35.9%50-64 years 1933 826,018 36.3% 1298 648,753 36.3% 635 177,265 36.2%65 -74 years 858 350,958 15.4% 577 273,720 15.3% 281 77,237 15.8%75 years and above 645 248,349 10.9% 414 188,359 10.6% 231 59,991 12.2%
RaceWhite 3852 1,608,875 70.7% 2399 1,181,300 66.2% 1453 427,575 87.2%African American 981 535,396 23.5% 850 482,808 27.0% 131 52,588 10.7%Other 207 131,812 5.8% 156 121,627 6.8% 51 10,185 2.1%
Gender and RaceWhite Males 1509 755,434 33.2% 948 551,725 30.9% 561 203,709 41.5%African American Males 332 233,427 10.3% 291 208,173 11.7% 41 25,254 5.2%Other Males 79 61,440 2.7% 59 56,689 3.2% 20 4,751 1.0%White Females 2343 853,441 37.5% 1451 629,575 35.3% 892 223,866 45.7%African American Females 649 301,969 13.3% 559 274,635 15.4% 90 27,334 5.6%Other Females 128 70,372 3.1% 97 64,938 3.6% 31 5,434 1.1%
Hispanic EthnicityYes 107 52,732 2.3% 1.9-2.9% 78 44,159 2.5% 1.9-3.2% 29 8,573 1.8% 1.2-2.7%No 4928 2,220,208 97.6% 96.9-98.0% 3322 1,738,433 97.4% 96.6-97.9% 1606 481,776 98.3% 97.3-98.9%Don't Know/Not Sure 3 1,593 0.1% 0.02-0.2% 3 1,593 0.1% 0.03-0.3% 0 0 0.0% -Refused 2 1,550 0.1% 0.02-0.3% 2 1,550 0.1% 0.02-0.4% 0 0 0.0% -
Marital StatusMarried 2943 1,502,239 66.3% 64.8-67.7% 1910 1,149,479 64.7% 62.9-66.4% 1033 352,760 72.1% 69.8-74.4%Divorced 693 261,918 11.6% 10.6-12.6% 493 214,240 12.1% 10.9-13.3% 200 47,678 9.8% 8.4-11.4%Widowed 806 250,244 11.0% 10.2-11.9% 528 196,268 11.0% 10.1-12.1% 278 53,976 11.0% 9.7-12.5%Separated 155 62,610 2.8% 2.3-3.3% 116 50,976 2.9% 2.3-3.5% 39 11,634 2.4% 1.6-3.5%Never Married 380 168,756 7.4% 6.6-8.4% 312 148,999 8.4% 7.4-9.5% 68 19,757 4.0% 3.1-5.2%Partner of Unmarried Couple 41 21,255 0.9% 0.7-1.3% 30 17,986 1.0% 0.7-1.5% 11 3,269 0.7% 0.4-1.3%
URBAN RURALTOTAL
For gender, age, race, and gender and race, the "wt N" is equal to the actual population of Maryland for those categories, the "wt %" is equal to the actual population proportion, because the sample was weighted to reflect the population.

TABLE 3-1 DEMOGRAPHICS OF THE SAMPLE POPULATION, AGE 40 YEARS AND OLDER, WEIGHTED NUMBERS AND PERCENTAGES, MARYLAND CANCER SURVEY 2002
Selected Characteristic N wt N wt % 95% CI N wt N wt % 95% CI N wt N wt % 95% CIURBAN RURALTOTAL
EducationKindergarten or less 4 1,824 0.1% 0-0.2% 2 978 0.1% 0-0.2% 2 847 0.2% 0-0.7%Grades 1-8 124 52,234 2.3% 1.9-2.8% 75 38,742 2.2% 1.7-2.8% 49 13,492 2.8% 2.0-3.7%Grades 9-11 383 173,638 7.6% 6.8-8.6% 237 128,346 7.2% 6.2-8.3% 146 45,292 9.2% 7.8-11.0%High School Grad or GED 1481 656,754 28.9% 27.4-30.3% 876 468,894 26.3% 24.6-28.0% 605 187,860 38.3% 35.7-41.1%College 1-3 years 1132 493,506 21.7% 20.4-23.0% 736 376,060 21.1% 19.6-22.7% 396 117,446 24.0% 21.7-26.4%College Grad 1032 487,476 21.4% 20.1-22.8% 784 414,428 23.2% 21.6-24.9% 248 73,048 14.9% 13.1-17.0%Master's Degree 623 285,497 12.5% 11.5-13.7% 484 246,945 13.8% 12.6-15.2% 139 38,552 7.9% 6.6-9.4%Doctoral or Advanced Professional Degree 239 112,963 5.0% 4.3-5.7% 193 99,941 5.6% 4.8-6.5% 46 13,021 2.7% 1.9-3.6%Refused 22 12,191 0.5% 0.3-0.9% 18 11,401 0.6% 0.4-1.1% 4 790 0.2% 0.1-0.5%
Employment StatusEmployed for Wages 2382 1,136,400 49.9% 48.3-51.6% 1644 897,262 50.3% 48.3-52.2% 738 239,138 48.8% 46.0-51.5%Self Employed 375 176,760 7.8% 6.9-8.7% 250 136,557 7.7% 6.7-8.8% 125 40,203 8.2% 6.8-9.9%Unemployed > 1 year 78 39,370 1.7% 1.3-2.2% 57 32,945 1.8% 1.4-2.5% 21 6,425 1.3% 0.8-2.2%Unemployed < 1 year 80 40,038 1.8% 1.4-2.3% 64 33,428 1.9% 1.4-2.5% 16 6,611 1.4% 0.8-2.3%Homemaker 311 139,368 6.1% 5.4-6.9% 193 106,981 6.0% 5.1-7.0% 118 32,387 6.6% 5.4-8.0%Student 19 9,062 0.4% 0.2-0.7% 14 7,601 0.4% 0.2-0.8% 5 1,461 0.3% 0.1-0.8%Retired 1607 649,667 28.5% 27.2-30.0% 1049 501,185 28.1% 26.4-29.8% 558 148,482 30.3% 27.9-32.7%Unable to work 170 76,886 3.4% 2.8-4.0% 119 61,756 3.5% 2.8-4.2% 51 15,130 3.1% 2.3-4.2%Refused 18 8,532 0.4% 0.2-0.7% 15 8,020 0.5% 0.3-0.8% 3 512 0.1% 0-0.3%
Household IncomeLess than $10,000 117 46,234 2.0% 1.7-2.5% 75 36,095 2.0% 1.6-2.6% 42 10,138 2.1% 1.5-2.9%$10,000-<$15,000 150 58,459 2.6% 2.1-3.1% 85 41,722 2.3% 1.8-3.0% 65 16,737 3.4% 2.6-4.5%$15,000-<$20,000 191 74,739 3.3% 2.8-3.9% 108 52,025 2.9% 2.3-3.7% 83 22,714 4.6% 3.7-5.9%$20,000-<$25,000 454 191,455 8.4% 7.6-9.3% 298 149,983 8.4% 7.4-9.5% 156 41,472 8.5% 7.1-10.1%$25,000-<$35,000 513 209,657 9.2% 8.4-10.1% 308 149,051 8.4% 7.4-9.4% 205 60,606 12.4% 10.7-14.3%$35,000-<$50,000 716 325,905 14.3% 13.2-15.5% 456 242,964 13.6% 12.3-15.0% 260 82,941 16.9% 14.9-19.1%$50,000-<$75,000 753 363,843 16.0% 14.8-17.2% 512 283,978 15.9% 14.5-17.4% 241 79,865 16.3% 14.3-18.5%$75,000 or greater 1320 644,705 28.3% 26.9-29.8% 983 534,682 29.9% 28.2-31.8% 337 110,022 22.4% 20.2-24.9%Don't Know/Not Sure 220 88,500 3.9% 3.3-4.5% 136 66,448 3.7% 3.1-4.5% 84 22,052 4.5% 3.6-5.7%Refused 606 272,585 12.0% 11.0-13.1% 444 228,786 12.8% 11.6-14.1% 162 43,800 8.9% 7.6-10.5%
For gender, age, race, and gender and race, the "wt N" is equal to the actual population of Maryland for those categories, the "wt %" is equal to the actual population proportion, because the sample was weighted to reflect the population.

TABLE 3-2 TOTAL NUMBER OF PEOPLE INTERVIEWED IN EACH COUNTY, BY GENDER AND RACE (revised October 2004)*
Males Females WhitesAfrican-Americans/
Blacks Other Race Total
County n % n % n % n % n % n
percent of
sample
Allegany 33 25.6 96 74.4 127 98.5 0 0.0 2 1.6 129 2.6Anne Arundel 151 36.7 261 63.4 371 90.1 38 9.2 3 0.7 412 8.2Baltimore City 147 33.2 296 66.8 175 39.5 249 56.2 19 4.3 443 8.9Baltimore 224 33.6 442 66.4 542 81.4 104 15.6 20 3.0 666 13.3Calvert 47 39.8 71 60.2 104 88.1 11 9.3 3 2.5 118 2.4Caroline 16 32.0 34 68.0 44 88.0 6 12.0 0 0.0 50 1.0Carroll 64 45.1 78 54.9 136 95.8 1 0.7 5 3.5 142 2.8Cecil 50 43.1 66 56.9 105 90.5 5 4.3 6 5.2 116 2.3Charles 43 35.2 79 64.8 95 77.9 20 16.4 7 5.7 122 2.4Dorchester 18 40.9 26 59.1 36 81.8 8 18.2 0 0.0 44 0.9Frederick 76 31.0 169 69.0 228 93.1 8 3.3 9 3.7 245 4.9Garrett 23 41.8 32 58.2 55 100.0 0 0.0 0 0.0 55 1.1Harford 75 41.2 107 58.8 159 87.4 20 11.0 3 1.7 182 3.6Howard 100 47.9 109 52.2 170 81.3 30 14.4 9 4.3 209 4.2Kent 11 36.7 19 63.3 27 90.0 3 10.0 0 0.0 30 0.6Montgomery 310 39.4 477 60.6 623 79.2 93 11.8 71 9.0 787 15.8Prince George's 223 41.2 318 58.8 203 37.5 310 57.3 28 5.2 541 10.8Queen Anne's 35 51.5 33 48.5 67 98.5 1 1.5 0 0.0 68 1.4St. Mary's 47 45.2 57 54.8 87 83.7 10 9.6 7 6.7 104 2.1Somerset 15 45.4 18 54.6 26 78.8 6 18.2 1 3.0 33 0.7Talbot 24 39.3 37 60.7 53 86.9 7 11.5 1 1.6 61 1.2Washington 83 39.9 125 60.1 198 95.2 5 2.4 5 2.4 208 4.2Wicomico 56 40.3 83 59.7 110 79.1 27 19.4 2 1.4 139 2.8Worcester 34 36.2 60 63.8 78 83.0 12 12.8 4 4.3 94 1.9
* Information is based on the 4998 respondents who provided county of residence Maryland Cancer Survey, 2002

4. Colorectal Cancer Screening
Cancer of the colon and rectum (colorectal cancer or CRC) is the fourth most common cause of cancer (excluding non-melanoma skin cancer) in Maryland, behind prostate, female breast, and lung cancer. In 1999, it was the second leading cause of cancer deaths in Maryland, which had the 6th highest CRC mortality rate among the states and the District of Columbia.1 Programs were implemented in FY 2001 for the prevention and screening of colorectal cancer by all local health departments in Maryland, except Baltimore City.
Knowledge of CRC screening is high in Maryland (Table 4-1). Among all residents in Maryland 40 years and over, 92% knew there were screening tests for colon cancer, 81% had heard of the home kit for the fecal occult blood test (FOBT), while 88% had heard of endoscopy (sigmoidoscopy or colonoscopy) as a means of examining the colon. Eighty-five percent knew that CRC screening was being promoted in the media (Table 4-2). Only 27% reported having heard that the local health departments had no-cost screening for low-income persons, and this did not vary significantly by race or gender. However, awareness of the health department programs increased with increasing age and was higher in the lowest income group (35% of those earning < $25,000 annually were aware vs. 21% for respondents earning $75,000 or higher per year).
Fifty-seven percent of Maryland adults, age 50 years and older, have ever had an FOBT (Table 4-3), while 44% have had the test within the preceding two years. Fecal occult blood testing was statistically significantly more common among urban dwellers (59%) than rural (54%). Women were statistically significantly more likely to have had an FOBT than men, as were those persons 65 years and older, compared to those 50-64 years. There was no difference in FOB testing between whites (58%) and African Americans (58%). However only 42% of people of “other” races reported ever having had an FOBT. People with less education and those who were self-employed were less likely to have had the test.
Table 4-4 shows the main reasons why people have never done the FOBT or have not
performed the test within the past year. The major reasons include the response that their doctor did not order it, they didn’t know the test was needed, never thought of it, have not had any problems, or that they had another type of CRC exam. Few people (< 10%) reported that the main reason they were not tested was because the test was too expensive or that they did not have insurance, did not want to know if they had cancer, had no family history or were not at increased risk, or reported that the doctor had done the test in the office. Whether or not a health care provider recommends the FOBT appears to be a very important factor in whether or not the test is done. Among people reporting a provider recommended the test within the last year, 72% had the FOBT. Among those reporting no provider recommendation, only 8% had the test within the last year.
Fifty-eight percent of Maryland adults, age 50 years and older, have ever had
sigmoidoscopy or colonoscopy (i.e., endoscopy) (Table 4-5). Statistically significantly more people living in urban areas have had endoscopy than those living in rural areas (59% vs. 54%). 1 Annual Cancer Report, Cigarette Restitution Fund Program, Maryland Department of Health and Mental Hygiene, September, 2002.

Men reported having had an endoscopic examination more often than women (61% vs. 56%). Those 50-64 years of age reported endoscopic examination statistically significantly less often than those greater than 65 years of age (52% vs. 67%). White men (62%) and African American men (59%) and white women (59%) had endoscopy more often than African American women (50%) and men and women of “other” races (47% and 45%, respectively). As with FOBT, higher educational levels were statistically significantly associated with higher proportions of endoscopic examination. People that never married or were self-employed had lower rates of screening. Higher percentages of screening were seen at higher annual income levels.
Among the 48% of people age 50 and older, reporting they had never had endoscopy or
had not had an endoscopic exam in the last five years, the most common reason cited by 37% was that the doctor did not order the test or did not say the test was needed (Table 4-6). Other common reasons included no reason or the person never thought of it, they didn’t know the test was needed, and they didn’t have any problems. Infrequently cited reasons (1-9%) included procrastination, too painful, unpleasant, or embarrassing, too expensive or didn’t have insurance, the person didn’t want to know they had cancer, or the person didn’t have a doctor.
As with FOBT, health care provider recommendations are very important to having an
endoscopic examination. Among people who reported receiving a provider recommendation for endoscopy, 85% have had the exam. Among those who said that they did not receive a recommendation from a health care provider, only 12% had the exam. Of 42% of people that reported never having sigmoidoscopy or colonoscopy, 91% reported seeing a physician in the preceding two years for a routine check-up.
Having a first-degree relative (FDR) (brother, sister, parent, or child) diagnosed with
colorectal cancer or adenomatous polyps puts one at increased risk for developing colorectal cancer. Eleven percent of people, age 40 and above, reported they had an FDR who had been diagnosed with colon cancer. Among people age 50 and above, 75% of those reporting a family history of CRC have ever had an endoscopic examination and this was significantly higher than among people without a family history (56%). Of those that have had endoscopy, 83% have had a colonoscopy. Among people between the ages of 40 and 49, 42% of people with a family history of CRC have ever had an endoscopy, and of those 86% reported having a colonoscopy.
For people of average risk, the American Cancer Society (ACS) recommends one of the
following screening modalities: annual FOBT, sigmoidoscopy every five years, sigmoidoscopy every five years with annual FOBT, or colonoscopy every ten years. Seventy-four percent of Marylanders over the age of 50 have ever been screened for CRC using any of the above procedures; 17% with FOBT only, 3% by sigmoidoscopy only, 11% with FOBT and sigmoidoscopy, 43% by colonoscopy, and 26% of Marylanders reported never having been tested by FOBT or endoscopy.
Another important measure of screening compliance is whether people are being tested in
a timely manner, that is, whether they are up-to-date for their various screening types. Twenty six percent of all Marylanders over the age of 50 have never been tested for CRC by FOBT or endoscopy, 9% have been tested but are not up-to-date, and 65% of Maryland adults are up-to-date per ACS guidelines, with the largest number having had colonoscopies.

Healthy People 2010 has set 50% as its goal for the adult population age 50 years and
older for 1) having had an FOBT in the last two years, and 2) ever having received a sigmoidoscopy.2 Chart 4-1 shows how this year’s survey compares to national baselines and the Healthy People 2010 targets for colorectal cancer screening. Marylanders are well ahead of the national baseline from the 1998 National Health Interview Survey, which found that 35% of adults age 50 years and older had FOB testing within the past two years and 37% had ever had sigmoidoscopy. This compares to the Maryland rate on the 2002 MCS of FOBT of 44% and endoscopy rate of 58%.
2 Healthy People 2010, US Department of Health and Human Services, 2000.

TABLE 4-1 PEOPLE REPORTING AWARENESS OF TESTS FOR COLORECTAL CANCER SCREENING, AMONG THOSE AGE 40 YEARS AND OLDER
Selected Characteristic N n wt % 95% CI Stat Sig N n wt % 95% CI Stat Sig N n wt % 95% CI Stat SigTotal Population 5010 4668 92% 91-93% 5008 4103 81% 80-82% 5020 4483 88% 87-89%
Gender ^ ** **Male 1906 1759 92% 90-93% 1904 1491 79% 76-81% 1913 1659 86% 84-88%Female 3104 2909 93% 92-94% 3104 2612 83% 81-85% 3107 2824 89% 88-91%
Age ** ** **40-49 years 1596 1459 90% 88-92% 1592 1145 72% 69-74% 1598 1362 83% 80-85%50-64 years 1930 1843 95% 93-96% 1922 1655 86% 84-88% 1926 1774 92% 90-93%65 years and above 1484 1366 92% 91-94% 1494 1303 88% 86-89% 1496 1347 90% 88-92%
Race ** ** **White 3833 3637 95% 94-96% 3826 3183 82% 81-84% 3839 3541 92% 91-93%African American 974 861 88% 85-90% 976 775 79% 76-82% 975 783 79% 76-82%Other 203 170 79% 71-86% 206 145 72% 64-79% 206 159 74% 65-81%
Gender and Race ** ** **White Males 1498 1408 94% 93-95% 1497 1184 79% 77-81% 1503 1341 89% 88-91%African American Males 329 286 87% 82-90% 328 252 78% 73-83% 331 253 77% 71-82%Other Males 79 65 80% 65-89% 79 55 74% 62-84% 79 65 79% 65-88%White Females 2335 2229 96% 95-97% 2329 1999 85% 83-87% 2336 2200 94% 93-95%African American Females 645 575 88% 85-91% 648 523 80% 76-83% 644 530 80% 76-84%Other Females 124 105 79% 68-87% 127 90 71% 60-80% 127 94 69% 58-78%
Peole reporting they know there are screening tests for colorectal cancer ~
People reporting they have heard of the home kit to test for blood in the stool ~
People reporting they have heard of tests called sigmoidoscopy or
colonoscopy ~
~ Some data missing for marital status, education, and employment status.** Statistically significant, p-value < 0.05.^ Not statistically significant, p-value > 0.05.
Maryland Cancer Survey, 2002

TABLE 4-1 PEOPLE REPORTING AWARENESS OF TESTS FOR COLORECTAL CANCER SCREENING, AMONG THOSE AGE 40 YEARS AND OLDER
Selected Characteristic N n wt % 95% CI Stat Sig N n wt % 95% CI Stat Sig N n wt % 95% CI Stat Sig
Peole reporting they know there are screening tests for colorectal cancer ~
People reporting they have heard of the home kit to test for blood in the stool ~
People reporting they have heard of tests called sigmoidoscopy or
colonoscopy ~
Marital Status ** ** **Married or partner of unmarried couple 2974 2801 93% 92-94% 2966 2451 82% 80-83% 2977 2728 90% 89-91%Divorced or separated 841 768 90% 87-92% 846 662 76% 73-80% 845 738 84% 80-87%Widowed 798 735 91% 89-93% 797 678 85% 81-87% 800 695 85% 82-88%Never Married 378 346 91% 87-94% 377 296 79% 74-83% 376 303 77% 71-82%
Education ** ** **Less than high school 501 428 83% 79-87% 506 374 72% 67-77% 501 374 73% 67-77%High school grad or GED 1476 1357 90% 88-92% 1470 1174 79% 76-81% 1473 1269 83% 80-85%College 1-3 years 1125 1073 96% 95-97% 1126 955 85% 82-87% 1131 1035 91% 88-93%College grad 1026 966 94% 91-95% 1026 860 83% 79-85% 1032 972 93% 91-95%Advanced degree 860 823 95% 93-96% 858 720 83% 80-86% 861 812 94% 91-95%
Employment Status ** ** **Employed for wages 2374 2244 94% 92-95% 2374 1886 79% 77-80% 2372 2129 88% 86-90%Self-employed 374 340 90% 84-93% 373 276 75% 70-80% 373 335 90% 86-93%Retired 1591 1480 93% 92-94% 1596 1413 89% 87-90% 1602 1452 90% 88-92%Other 653 589 87% 83-90% 647 511 77% 72-80% 656 551 80% 76-84%
Household Income ** ** **<$25,000 904 791 85% 82-88% 904 710 76% 72-79% 906 729 76% 72-80%$25,000-<$35,000 511 469 90% 87-93% 511 406 78% 73-82% 509 443 85% 80-88%$35,000-<$50,000 714 672 93% 90-95% 712 577 80% 77-84% 715 638 87% 83-90%$50,000-<$75,000 750 712 94% 91-96% 749 604 80% 76-83% 752 693 91% 88-93%$75,000 or greater 1318 1272 96% 94-97% 1312 1110 84% 82-86% 1318 1246 94% 92-95%Don't Know/Not Sure 213 192 90% 84-94% 220 187 86% 79-90% 216 182 84% 76-89%Refused 600 560 93% 90-95% 600 509 84% 80-87% 604 552 90% 86-93%
~ Some data missing for marital status, education, and employment status.** Statistically significant, p-value < 0.05.^ Not statistically significant, p-value > 0.05.
Maryland Cancer Survey, 2002

TABLE 4-2 RESPONSES TO QUESTIONS ON AWARENESS OF MEDIA PROMOTION OF CRC SCREENING AND LOW COST SCREENING PROGRAMS, AMONG THOSE AGE 40 YEARS AND OLDER
Selected Characteristic N n wt % 95% CI Stat Sig N n wt % 95% CI Stat SigTotal Population 4932 4209 85% 83-86% 4963 1410 27% 26-29%
Gender ** ^Male 1867 1526 82% 80-84% 1898 493 26% 24-28%Female 3065 2683 87% 85-88% 3065 917 28% 27-30%
Age ^ **40-49 years 1573 1336 84% 82-87% 1587 354 22% 20-25%50-64 years 1904 1659 86% 84-88% 1912 526 27% 25-30%65 years and above 1455 1214 83% 81-85% 1464 530 35% 32-38%
Race ** ^White 3756 3227 86% 84-87% 3796 1091 27% 26-29%African American 970 820 83% 80-86% 962 269 28% 25-32%Other 206 162 78% 69-84% 205 50 23% 16-31%
Gender and Race ** ^White Males 1458 1198 83% 81-85% 1494 388 26% 23-29%African American Males 330 270 81% 76-86% 325 94 30% 25-36%Other Males 79 58 72% 58-83% 79 11 13% 6-26%White Females 2298 2029 88% 87-89% 2302 703 29% 27-31%African American Females 640 550 85% 81-88% 637 175 27% 23-31%Other Females 127 104 83% 73-90% 126 39 31% 22-42%
People reporting they have seen or heard colon cancer screening being
promoted on TV, radio, in a health care facility, or in a magazine, newspaper or
some place else ~
People reporting awareness of no cost colon cancer screening programs at
health department ~
~ Some data missing for marital status, education, and employment status.** Statistically significant, p-value < 0.05.^ Not statistically significant, p-value > 0.05.
Maryland Cancer Survey, 2002
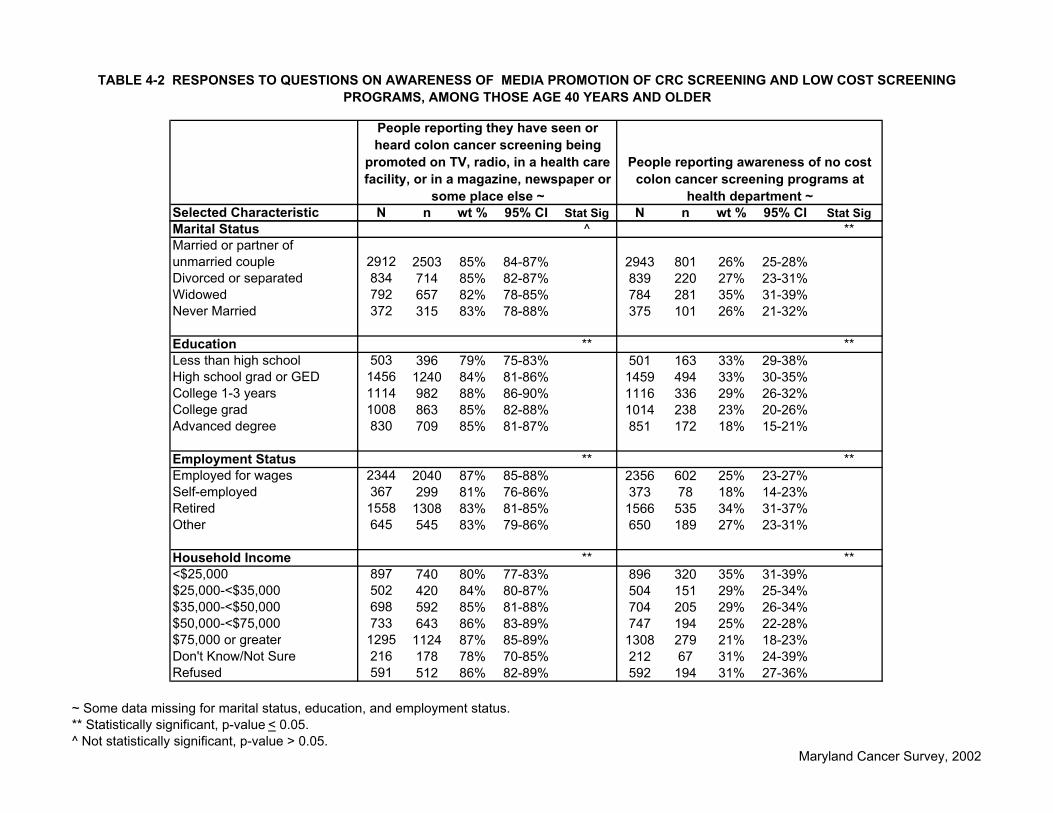
TABLE 4-2 RESPONSES TO QUESTIONS ON AWARENESS OF MEDIA PROMOTION OF CRC SCREENING AND LOW COST SCREENING PROGRAMS, AMONG THOSE AGE 40 YEARS AND OLDER
Selected Characteristic N n wt % 95% CI Stat Sig N n wt % 95% CI Stat Sig
People reporting they have seen or heard colon cancer screening being
promoted on TV, radio, in a health care facility, or in a magazine, newspaper or
some place else ~
People reporting awareness of no cost colon cancer screening programs at
health department ~
Marital Status ^ **Married or partner of unmarried couple 2912 2503 85% 84-87% 2943 801 26% 25-28%Divorced or separated 834 714 85% 82-87% 839 220 27% 23-31%Widowed 792 657 82% 78-85% 784 281 35% 31-39%Never Married 372 315 83% 78-88% 375 101 26% 21-32%
Education ** **Less than high school 503 396 79% 75-83% 501 163 33% 29-38%High school grad or GED 1456 1240 84% 81-86% 1459 494 33% 30-35%College 1-3 years 1114 982 88% 86-90% 1116 336 29% 26-32%College grad 1008 863 85% 82-88% 1014 238 23% 20-26%Advanced degree 830 709 85% 81-87% 851 172 18% 15-21%
Employment Status ** **Employed for wages 2344 2040 87% 85-88% 2356 602 25% 23-27%Self-employed 367 299 81% 76-86% 373 78 18% 14-23%Retired 1558 1308 83% 81-85% 1566 535 34% 31-37%Other 645 545 83% 79-86% 650 189 27% 23-31%
Household Income ** **<$25,000 897 740 80% 77-83% 896 320 35% 31-39%$25,000-<$35,000 502 420 84% 80-87% 504 151 29% 25-34%$35,000-<$50,000 698 592 85% 81-88% 704 205 29% 26-34%$50,000-<$75,000 733 643 86% 83-89% 747 194 25% 22-28%$75,000 or greater 1295 1124 87% 85-89% 1308 279 21% 18-23%Don't Know/Not Sure 216 178 78% 70-85% 212 67 31% 24-39%Refused 591 512 86% 82-89% 592 194 31% 27-36%
~ Some data missing for marital status, education, and employment status.** Statistically significant, p-value < 0.05.^ Not statistically significant, p-value > 0.05.
Maryland Cancer Survey, 2002

TABLE 4-3 PEOPLE REPORTING TO HAVE EVER PERFORMED A HOME FECAL OCCULT BLOOD TEST (FOBT), AMONG THOSE AGE 50 YEARS AND OLDER
Selected Characteristic N n wt % 95% CI Stat Sig N n wt % 95% CI Stat Sig N n wt % 95% CI Stat SigTotal Population 3417 1952 57% 56-59% 2277 1350 59% 56-61% 1140 602 54% 50-57
Gender ** ^ **Male 1285 689 54% 51-58% 855 484 56% 52-60% 430 205 49% 44-54%Female 2132 1263 60% 58-62% 1422 866 61% 58-63% 710 397 58% 54-62%
Age ** ** **50-64 years 1925 1008 52% 50-55% 1293 700 53% 50-56% 632 308 50% 45-54%65 years and older 1492 944 65% 62-67% 984 650 66% 63-70% 508 294 59% 54-63%
Race ** ** ^White 2698 1557 58% 56-61% 1675 1008 60% 57-63% 1023 549 54% 51-57%African American 593 340 58% 53-62% 507 297 59% 54-63% 86 43 52% 40-64%Other 126 55 42% 32-53% 95 45 42% 31-54% 31 10 40% 22-62%
Gender and Race ** ** ^White Males 1046 561 55% 52-58% 651 370 57% 53-61% 395 191 49% 44-54%African American Males 195 109 56% 48-64% 170 98 57% 49-65% 25 11 50% 30-71%Other Males 44 19 39% 24-58% 34 16 39% 23-59% 10 3 39% 13-73%White Females 1652 996 61% 59-64% 1024 638 62% 59-66% 628 358 58% 54-63%African American Females 398 231 59% 53-65% 337 199 60% 54-66% 61 32 53% 39-66%Other Females 82 36 44% 32-57% 61 29 44% 31-58% 21 7 42% 20-67%
TOTAL ~ URBAN ~ RURAL ~
~ Some data missing for marital status, education, and employment status.** Statistically significant, p-value < 0.05.^ Not statistically significant, p-value > 0.05.
Maryland Cancer Survey, 2002

TABLE 4-3 PEOPLE REPORTING TO HAVE EVER PERFORMED A HOME FECAL OCCULT BLOOD TEST (FOBT), AMONG THOSE AGE 50 YEARS AND OLDER
Selected Characteristic N n wt % 95% CI Stat Sig N n wt % 95% CI Stat Sig N n wt % 95% CI Stat Sig
TOTAL ~ URBAN ~ RURAL ~
Marital Status ^ ^ ^Married or partner of unmarried couple 1934 1130 58% 55-60% 1258 761 59% 56-62% 676 369 55% 51-59%Divorced or separated 549 282 53% 48-58% 391 208 54% 49-60% 158 74 46% 38-55%Widowed 759 444 60% 56-64% 495 307 63% 58-67% 264 137 51% 45-58%Never Married 157 91 58% 49-66% 121 72 59% 49-68% 36 19 50% 33-68%
Education ** ** **Less than high school 428 203 47% 41-52% 257 131 48% 41-55% 171 72 44% 36-53%
High school grad or GED 1051 549 53% 49-56% 615 334 54% 50-58% 436 215 50% 45-55%College 1-3 years 715 439 63% 59-67% 467 300 65% 60-70% 248 139 56% 49-63%College grad 639 390 61% 56-65% 492 306 61% 56-66% 147 84 58% 49-66%Advanced degree 564 360 63% 59-68% 429 270 62% 57-67% 135 90 69% 60-77%
Employment Status ** ** **Employed for wages 1211 642 53% 50-56% 834 457 53% 50-57% 377 185 50% 45-56%Self-employed 214 95 45% 37-53% 140 67 47% 37-56% 74 28 40% 29-53%Retired 1582 1005 65% 62-68% 1030 684 67% 63-70% 552 321 58% 54-63%Other 394 204 51% 46-57% 259 137 51% 45-58% 135 67 52% 42-61%
Household Income ** ^ ^<$25,000 725 370 52% 48-56% 434 225 52% 47-57% 291 145 51% 45-58%$25,000-<$35,000 386 203 53% 47-58% 235 125 53% 46-60% 151 78 52% 43-61%$35,000-<$50,000 477 272 57% 52-62% 292 179 60% 53-66% 185 93 50% 42-58%$50,000-<$75,000 426 255 60% 54-65% 305 189 61% 55-67% 121 66 53% 44-63%$75,000 or greater 745 453 60% 56-64% 565 349 61% 56-65% 180 104 59% 51-67%Don't Know/Not Sure 189 105 59% 51-67% 115 70 61% 51-71% 74 35 52% 40-65%Refused 469 294 62% 57-67% 331 213 63% 57-69% 138 81 58% 49-67%
~ Some data missing for marital status, education, and employment status.** Statistically significant, p-value < 0.05.^ Not statistically significant, p-value > 0.05.
Maryland Cancer Survey, 2002

TABLE 4-4 RESPONSES TO THE QUESTION "WHAT WAS THE MOST IMPORTANT REASON YOU HAVE NEVER DONE/NOT DONE A HOME BLOOD STOOL TEST IN THE LAST YEAR?"*
Selected Characteristic wt %Doctor didn't order it/didn't say I needed it 29%No reason, never thought about it 22%Didn't need / didn't know I needed this type of test 16%Haven't had any problems 10%Put it off/didn't get around to it 7%Too expensive/no insurance/cost of test 1%Too painful, unpleasant, or embarrassing 1%Had another type of colorectal exam, like colonoscopy, sigmoidoscopy or barium enema 14%Don't have a doctor 2%Didn't want to know I had cancer 1%Other 6%Fear 0%Not at increased risk of cancer/no family history of cancer 0%Doctor did the test in his office 2%Never heard of it/didn't know it existed 2%* Asked of 2320 participants age 50 years and older who had never done a home blood stool test or have not done the test in the preceding year. More than one response could be given per respondent.
Maryland Cancer Survey, 2002

TABLE 4-5 PEOPLE REPORTING TO HAVE EVER HAD A SIGMOIDOSCOPY OR COLONOSCOPY, AMONG THOSE AGE 50 YEARS AND OLDER
Selected Characteristic N n wt % 95% CI Stat Sig N n wt % 95% CI Stat Sig N n wt % 95% CI Stat SigTotal Population 3409 1982 58% 56-60% 2274 1368 59% 57-61% 1135 614 55% 52-58%
Gender ** ** ^Male 1282 774 61% 58-64% 855 540 62% 58-66% 427 234 57% 51-62%Female 2127 1208 56% 54-59% 1419 828 57% 54-60% 708 380 54% 50-58%
Age ** ** **50-64 years 1929 1002 52% 49-54% 1296 689 52% 49-55% 633 313 49% 45-54%65 years and older 1480 980 67% 65-70% 978 679 69% 66-72% 502 301 62% 58-67%
Race ** ** ^White 2691 1604 60% 58-62% 1672 1050 62% 59-65% 1019 554 55% 52-58%African American 591 312 54% 50-59% 507 266 54% 49-59% 84 46 57% 45-69%Other 127 66 46% 36-57% 95 52 46% 35-58% 32 14 42% 24-63%
Gender and Race ** ** ^White Males 1041 634 62% 59-65% 648 422 65% 60-69% 393 212 55% 50-60%African American Males 196 112 59% 51-67% 172 96 58% 49-66% 24 16 72% 50-86%Other Males 45 28 47% 30-65% 35 22 47% 29-65% 10 6 59% 24-86%White Females 1650 970 59% 56-61% 1024 628 60% 57-63% 626 342 55% 51-59%African American Females 395 200 50% 45-56% 335 170 51% 45-57% 60 30 46% 32-59%Other Females 82 38 45% 32-58% 60 30 46% 33-60% 22 8 28% 13-50%
TOTAL ~ URBAN ~ RURAL ~
~ Some data missing for marital status, education, and employment status.** Statistically significant, p-value < 0.05.^ Not statistically significant, p-value > 0.05.
Maryland Cancer Survey, 2002

TABLE 4-5 PEOPLE REPORTING TO HAVE EVER HAD A SIGMOIDOSCOPY OR COLONOSCOPY, AMONG THOSE AGE 50 YEARS AND OLDER
Selected Characteristic N n wt % 95% CI Stat Sig N n wt % 95% CI Stat Sig N n wt % 95% CI Stat SigTOTAL ~ URBAN ~ RURAL ~
Marital Status ** ** **Married or partner of unmarried couple 1932 1164 60% 58-63% 1255 780 61% 58-64% 677 384 58% 54-62%Divorced or separated 543 289 53% 48-58% 387 218 55% 50-61% 156 71 42% 34-51%Widowed 759 443 58% 54-62% 499 307 60% 55-65% 260 136 52% 45-58%Never Married 157 80 48% 40-57% 121 58 46% 36-56% 36 22 61% 42-77%Education ** ** **Less than high school 426 188 46% 40-51% 258 123 47% 41-54% 168 65 41% 33-49%High school grad or GED 1047 573 55% 51-58% 612 338 55% 50-59% 435 235 55% 49-60%College 1-3 years 713 423 61% 56-65% 467 285 61% 56-66% 246 138 58% 51-64%College grad 639 425 65% 61-69% 491 333 65% 60-70% 148 92 63% 54-71%Advanced degree 564 362 63% 59-68% 429 280 64% 58-69% 135 82 61% 52-70%
Employment Status ** ** **Employed for wages 1216 648 54% 50-57% 838 465 55% 51-59% 378 183 49% 44-55%Self-employed 213 102 45% 38-53% 139 67 45% 35-55% 74 35 47% 35-59%Retired 1569 1026 66% 63-69% 1024 696 67% 64-70% 545 330 62% 58-66%Other 395 196 50% 44-56% 259 132 50% 44-57% 136 64 48% 39-58%
Household Income ** ** **<$25,000 721 356 49% 45-54% 433 217 50% 45-55% 288 139 47% 41-54%$25,000-<$35,000 384 214 56% 50-62% 233 131 57% 50-64% 151 83 53% 44-61%$35,000-<$50,000 478 290 60% 55-65% 293 183 60% 53-66% 185 107 60% 52-68%$50,000-<$75,000 426 253 61% 55-66% 305 193 63% 57-69% 121 60 50% 40-59%$75,000 or greater 747 469 63% 58-66% 566 362 63% 58-67% 181 107 60% 52-68%Don't Know/Not Sure 185 103 57% 49-65% 113 72 61% 50-71% 72 31 48% 35-60%Refused 468 297 61% 55-66% 331 210 60% 53-65% 137 87 66% 57-73%
~ Some data missing for marital status, education, and employment status.** Statistically significant, p-value < 0.05.^ Not statistically significant, p-value > 0.05.
Maryland Cancer Survey, 2002

TABLE 4-6 RESPONSES TO THE QUESTION "WHAT WAS THE MOST IMPORTANT REASON YOU HAVE NEVER HAD/NOT HAD A SIGMOIDSCOPY OR COLONOSCOPY IN THE LAST FIVE YEARS?"*
Selected Characteristic wt %Doctor didn't order it/didn't say I needed it 37%No reason, never thought about it 22%Didn't need/ didn't know I needed this type of test 18%Haven't had any problems 15%Put it off/didn't get around to it 9%Too expensive/no insurance/cost of test 3%Too painful, unpleasant, or embarrassing 5%Had another type of colorectal exam 1%Don't have a doctor 1%Didn't want to know I had cancer 1%Didn't have childcare or respite care if adult caregiver 0%Other 5%Afraid 0%Not at high risk of cancer/no family history of cancer 0%Never heard of it/didn't know it existed 1%* Asked of 1692 participants age 50 years and older who have never had a sigmoidoscopy or colonoscopy, or have not had either procedure in the preceding five years year. More than one response could be given per respondent.
Maryland Cancer Survey, 2002

Chart 4-1 Comparison of the results of the Maryland Cancer Survey, 2002 to national baselines and Healthy People 2010 target values; proportion of people age 50 years and older who have had a fecal occult blood test (FOBT) in the previous two years and have ever had a sigmoidoscopy or colonoscopy.
35%
50%44%
37%
50%
58%
0%
20%
40%
60%
80%
100%
NHIS(1998)
2010Target
MCS,2002
NHIS(1998)
2010Target
MCS,2002
Had FOBT in the previous 2 years Ever had sigmoidoscopyor colonoscopy
percent
NHIS-National Health Interview Survey 2010 Target-Healthy People 2010 MCS, 2002-Maryland Cancer Survey, 2002

Chapter 5. Prostate Cancer Screening
Cancer of the prostate is the most common cancer (excluding non-melanoma skin cancer) among men in Maryland, accounting for 3,869 cases in 1999.1 It is the second leading cause of cancer deaths among men in the state, after lung cancer. In 1999, Maryland had the 10th highest mortality rate for prostate cancer among the 50 states and the District of Columbia.
Serum prostatic specific antigen (PSA) and the digital rectal exam (DRE) are the two tests most commonly used to screen for prostate cancer. Whether or not men should be screened for prostate cancer and at what age screening should begin is a controversial issue. The American Cancer Society (ACS) recommends annual screening beginning at age 50 for men of average risk and earlier, at age 45, for men at higher risk (African Americans and men who have a first degree relative with prostate cancer). The ACS recommends that men with several first degree relatives with prostate cancer, could begin testing at age 40.2 On the other hand, the US Preventive Services Task Force (USPSTF) stated that there is insufficient evidence for or against routine screening for prostate cancer using PSA testing or DRE.3 The USPSTF, as well as other groups, recommend that a man and his healthcare provider discuss the pros and cons of screening for informed decision making before a man chooses to undergo testing.
Based on the MCS 2002, 80% of men, age 40 years and older, in Maryland had heard of the PSA test (Table 5-1): men in older age groups (65 years and above and 50-64 years) were statistically significantly more likely to have knowledge of the PSA test than those men 40-49 years (91%, 85%, 68%). There was no significant difference in knowledge by race. Statistically significant differences in knowledge of the PSA test were seen by marital status, education, employment, and income. Men who were never married, those who had less education, or those who had employment status of “other” were less likely to have knowledge of the PSA test. Knowledge of the PSA test increased with higher income levels (range 71-83%).
When asked whether a doctor or other health care provider had recommended the PSA test, 55% said “yes”. This proportion was much higher in men age 50-64 years (64%) and age 65 years and above (84%) than in younger men age 40-49 (29%). While there was no significant difference by race, those that never married, had less education, or had “other” employment status were less likely to have reported having the test recommended.
Table 5-2 shows that of Maryland men age 50 years and older, 75% report ever having had the PSA test, with 61% of Maryland men, in that age group, having had the test within the last year. The percentage of men who ever had a PSA test did not vary by urban vs. rural residence. African American men were less likely than white men to have been screened with PSA in both urban and rural areas, (71% vs. 77%), but this result was not statistically significant. Men in the 50-64 age group were less likely to have ever had the test, as were those men who never married, had less than a high school education, or had employment status of “other”.
1 Annual Cancer Report, Cigarette Restitution Fund Program, Maryland Department of Health and Mental Hygiene, September, 2002. 2 American Cancer Society, Detailed guide –prostate cancer , Can prostate cancer be found early? http://www.cancer.org/docroot/CRI/content/CRI_2_4_3X_Can_prostate_cancer_be_found_early_36.asp 3 Screening-Prostate USPSTF Update, 2002 release-http://www.ahcpr.gov/clinic/uspstf/uspsprca.htm

Among all men under age 50, 22% of those age 40-44 years had been screened, compared to 39% of those 45-49 years. Among African Americans, 40% of men age 45-49 had ever been screened.
When asked reasons for never being screened or not being screened within the past year,
32% reported the doctor did not order it, 20% gave no reason or never thought about it, 16% said they either did not need the test or did not know this test was needed, and 12% reported not having any problems (Table 5-3). Infrequent reasons included the cost of the test and not having a doctor. Among those men who reported that a health care provider had recommended PSA testing, 97% reported that they had the test. Among those reporting that the test had not been recommended, only 19% had the test. Of those men who reported never having had a PSA, 82% reported having a general physical exam in the last two years.
Of Maryland men age 50 years and older, 89% reported ever having had a DRE and 62% have had the test within the last year (Table 5-4). As with PSA testing, men age 65 years and older were more likely to have had a DRE than those younger. However, this did not vary by area of residence or race. Men who were never married, had less education, or had employment status of “other” had a lower proportion of screening by DRE.

TABLE 5-1 KNOWLEDGE OF THE PROSTATIC SPECIFIC ANTIGEN (PSA) TEST AND RECOMMENDATIONS BY HEALTHCARE PROVIDERS, AMONG MEN AGE 40 YEARS AND OLDER
Selected Characteristic N n wt % 95% CI Stat Sig N n wt % 95% CI Stat SigMale Population 1896 1532 80% 78-82% 1870 1096 55% 53-58%
Age ** **40-49 years 618 415 68% 64-72% 613 177 29% 25-34%50-64 years 769 657 85% 82-88% 755 504 64% 60-68%65 years and above 509 460 91% 88-93% 502 415 84% 80-87%
Race ^ ^White 1489 1225 82% 79-84% 1469 878 56% 53-59%African American 331 246 75% 69-80% 326 176 53% 46-59%Other 76 61 77% 63-86% 75 42 55% 40-69%
Marital Status ** **Married or partner of unmarried couple 1323 1093 82% 79-84% 1305 789 58% 55-61%Divorced or separated 283 222 76% 69-82% 278 156 51% 44-58%Widowed 141 117 81% 72-87% 138 94 64% 54-72%Never Married 140 92 65% 55-74% 140 52 30% 22-39%
Education ** **Less than high school 176 122 68% 59-75% 171 81 44% 36-53%High school grad or GED 502 381 74% 69-78% 503 268 50% 45-55%College 1-3 years 384 304 79% 73-83% 377 214 54% 49-60%College grad 425 362 85% 81-89% 420 260 58% 53-64%Advanced degree 403 357 87% 82-90% 393 268 64% 58-69%
Employment Status ** **Employed for wages 966 747 77% 73-80% 953 464 46% 42-49%Self-employed 199 154 78% 71-84% 195 92 45% 37-54%Retired 617 559 91% 88-93% 610 499 83% 79-86%Other 108 66 60% 49-70% 106 36 32% 23-42%
Household Income ** **<$25,000 249 180 71% 64-77% 247 123 48% 41-56%$25,000-<$35,000 183 146 78% 70-84% 181 110 57% 48-65%$35,000-<$50,000 284 224 78% 72-83% 280 156 50% 44-57%$50,000-<$75,000 324 263 80% 75-85% 318 172 52% 46-58%$75,000 or greater 599 502 83% 79-87% 594 360 57% 52-62%Don't Know/Not Sure 43 35 79% 61-90% 39 28 66% 47-81%Refused 214 182 84% 77-89% 211 147 66% 58-74%
Men reporting that a health care provider ever recommend they have a PSA test ~
Men reporting they have heard of a test called PSA, used to check for prostate cancer ~
~ Some data missing for marital status, education, and employment status.** Statistically significant, p-value < 0.05.^ Not statistically significant, p-value > 0.05.
Maryland Cancer Survey, 2002

TABLE 5-2 MEN REPORTING TO HAVE EVER HAD A PROSTATIC SPECIFIC ANTIGEN (PSA) TEST, AMONG THOSE AGE 50 YEARS AND OLDER
Selected Characteristic N n wt % 95% CI Stat Sig N n wt % 95% CI Stat Sig N n wt % 95% CI Stat SigMale Population 1251 958 75% 72-78% 835 637 75% 71-78% 416 321 76% 72-81%
Age ** ** **50-64 years 751 524 68% 63-71% 501 344 67% 62-72% 250 180 70% 63-76%65 years and above 500 434 87% 83-90% 334 293 87% 83-91% 166 141 87% 80-91%
Race ^ ^ ^White 1015 785 77% 74-80% 633 489 77% 73-80% 382 296 77% 72-82%African American 194 141 71% 63-77% 169 123 71% 62-78% 25 18 70% 47-85%Other 42 32 66% 44-83% 33 25 65% 42-83% 9 7 77% 36-95%
Marital Status ** ** **Married or partner of unmarried couple 874 695 78% 74-81% 576 457 77% 73-81% 298 238 79% 73-83%Divorced or separated 184 124 66% 57-74% 130 86 65% 55-74% 54 38 69% 54-82%Widowed 132 106 78% 68-85% 88 72 77% 65-85% 44 34 80% 67-90%Never Married 55 29 48% 35-62% 39 21 50% 34-66% 16 8 43% 20-69%
Education ** ** **Less than high school 142 83 57% 48-67% 84 50 59% 47-71% 58 33 53% 39-67%High school grad or GED 332 239 72% 66-77% 186 129 70% 62-77% 146 110 76% 68-83%College 1-3 years 233 181 78% 72-83% 149 112 77% 68-83% 84 69 82% 71-89%College grad 267 218 78% 71-84% 201 165 78% 69-84% 66 53 82% 70-90%Advanced degree 272 233 83% 76-88% 211 178 82% 74-87% 61 55 89% 77-96%
Employment Status ** ** **Employed for wages 472 337 69% 64-74% 322 226 68% 62-74% 150 111 71% 62-79%Self-employed 114 77 64% 52-75% 73 49 62% 46-75% 41 28 71% 54-83%Retired 600 514 87% 83-89% 389 337 87% 83-90% 211 177 85% 79-89%Other 59 25 41% 28-56% 46 21 43% 28-59% 13 4 34% 12-65%Household Income ** ** ^<$25,000 190 124 65% 57-72% 121 76 62% 52-71% 69 48 72% 59-82%$25,000-<$35,000 139 105 77% 68-84% 83 62 76% 65-85% 56 43 77% 63-87%$35,000-<$50,000 189 139 70% 62-77% 108 74 66% 56-75% 81 65 79% 67-87%$50,000-<$75,000 181 138 75% 67-82% 131 102 77% 68-84% 50 36 68% 52-81%$75,000 or greater 358 293 79% 73-84% 265 217 78% 71-84% 93 76 84% 75-90%Don't Know/Not Sure 34 29 78% 55-91% 18 16 84% 50-96% 16 13 66% 35-88%Refused 160 130 80% 72-86% 109 90 81% 71-88% 51 40 76% 61-87%
TOTAL ~ URBAN ~ RURAL ~
~ Some data missing for marital status, education, and employment status.** Statistically significant, p-value < 0.05.^ Not statistically significant, p-value > 0.05.
Maryland Cancer Survey, 2002

TABLE 5-3 RESPONSES TO THE QUESTION "WHAT WAS THE MOST IMPORTANT REASON YOU HAVE NEVER HAD/NOT HAD A PSA TEST IN THE LAST 12 MONTHS?"*
Selected Characteristic wt %Doctor didn't order it/didn't say I needed it 32%No reason, never thought about it 20%Didn't need/ didn't know I needed this type of test 16%Haven't had any problems 12%Put it off/didn't get around to it 12%Too expensive/no insurance/cost of test 2%Didn’t want to know the results 0%Don't have a doctor 4%Other 6%Have had a prostatectomy 0%Never heard of it/didn't know it existed 3%Don't know if I had it or not 3%* Asked of 520 male participants age 50 years or older who have never had a PSA or have not had a the test in the preceding year. More than one response could be given per participant
Maryland Cancer Survey, 2002

TABLE 5-4 MEN REPORTING TO HAVE EVER HAD A DIGITAL RECTAL EXAM (DRE), AMONG THOSE AGE 50 YEARS AND OLDER
Selected Characteristic N n wt % 95% CI Stat Sig N n wt % 95% CI Stat Sig N n wt % 95% CI Stat SigMale Population 1285 1135 89% 87-91% 857 761 89% 87-91% 428 374 88% 84-91%
Age ** ** ^50-64 years 774 667 87% 84-90% 515 445 87% 84-90% 259 222 86% 81-90%65 years and above 511 468 92% 89-94% 342 316 93% 89-95% 169 152 90% 84-94%
Race ^ ^ ^White 1044 931 90% 87-92% 651 582 90% 87-92% 393 349 89% 85-92%African American 196 169 88% 82-92% 171 151 89% 83-93% 25 18 76% 55-89%Other 45 35 83% 68-92% 35 28 83% 67-92% 10 7 81% 48-95%
Marital Status ** ** **Married or partner of unmarried couple 896 807 90% 88-92% 589 535 91% 88-93% 307 272 89% 85-92%Divorced or separated 190 164 88% 82-92% 134 116 88% 81-93% 56 48 86% 73-94%Widowed 136 122 91% 86-95% 92 82 91% 84-95% 44 40 93% 82-97%Never Married 57 38 65% 50-77% 40 27 67% 50-80% 17 11 59% 32-82%
Education ** ** **Less than high school 148 117 80% 71-86% 88 72 83% 72-90% 60 45 73% 58-84%High school grad or GED 339 290 86% 82-90% 191 160 85% 79-90% 148 130 89% 83-93%College 1-3 years 238 214 92% 88-95% 151 138 94% 89-96% 87 76 88% 79-94%College grad 276 246 90% 86-94% 207 185 90% 85-94% 69 61 90% 79-96%Advanced degree 279 264 94% 90-97% 216 203 93% 88-96% 63 61 97% 86-99%
Employment Status ** ^ ^Employed for wages 485 428 88% 85-91% 331 293 88% 84-92% 154 135 88% 81-93%Self-employed 118 101 89% 82-93% 75 64 89% 81-94% 43 37 87% 73-95%Retired 615 553 91% 89-93% 399 362 92% 89-94% 216 191 89% 84-93%Other 61 48 79% 66-88% 47 38 81% 66-90% 14 10 69% 38-89%Household Income ** ** ^<$25,000 193 167 88% 82-92% 123 109 89% 82-94% 70 58 85% 74-91%$25,000-<$35,000 144 114 77% 68-84% 86 63 72% 61-82% 58 51 87% 73-94%$35,000-<$50,000 195 171 87% 81-92% 110 95 86% 77-92% 85 76 90% 81-95%$50,000-<$75,000 186 167 92% 87-95% 134 121 93% 88-96% 52 46 88% 74-95%$75,000 or greater 368 342 95% 92-97% 272 257 96% 93-98% 96 85 89% 81-94%Don't Know/Not Sure 37 33 85% 64-95% 21 19 87% 58-97% 16 14 80% 45-95%Refused 162 141 86% 78-92% 111 97 86% 76-92% 51 44 88% 76-95%
RURAL ~URBAN ~TOTAL ~
~ Some data missing for marital status, education, and employment status.** Statistically significant, p-value < 0.05.^ Not statistically significant, p-value > 0.05. Maryland Cancer Survey, 2002

Chapter 6. Women’s Health: Breast and Cervical Cancer Screening Breast cancer remains the most common reportable cancer among women and represented 16% of all new cancers in Maryland in 1999. There were 3,714 new cases of invasive breast cancer among Maryland women. It accounted for 7.7% of all cancer deaths in Maryland in 1999 with 782 deaths, and is the second leading cause of cancer deaths among women after lung cancer.1 In 1999, 226 women in Maryland were diagnosed with invasive cervical cancer and 77 women died of the disease. Among the 50 states and the District of Columbia, Maryland women rank 5th highest in breast cancer mortality and 25th highest in cervical cancer mortality.1
Mammography and clinical breast exam (CBE) are the tests recommended to screen for breast cancer. Papanicolau (Pap) smear is the screening test that is recommended for the early detection of pre-malignant and malignant changes of the cervix. Death from cervical cancer is largely preventable with regular Pap smears. In the MCS, 2002, 98% of women, age 40 years and older, reported that a health care provider had recommended she have a Pap smear in the last year, compared to 86% of women reporting a recommendation to receive a mammogram. Mammograms were recommended statistically significantly more often among women age 50-64 years, compared to the younger (40-49 years) or older (65 years and older) age groups (89% vs. 83% and 85% respectively) (Table 6-1). While there was no difference by race, significant differences were seen by marital status, education, employment status, and income. Women who were either married or the partner of an unmarried couple reported health care provider recommendations for mammograms more frequently. Women who had not completed high school, had an annual household income of less than $25,000, or had an employment status of “other” were less likely to report a health care provider recommendation for a mammogram in the last year. While the vast majority of women in all age groups reported that a health care provider recommended a Pap smear in the last year, women 65 years of age and older had statistically significantly lower rates (94%) compared to women in younger age groups (98% and 99% for women 40-49 years and 50-64 years, respectively). Women who never married or were widowed, had less than a high school education, or had annual household incomes of less than $25,000 reported lower rates of recommendations for Pap smear. When examining employment status, women who were retired reported the lowest rates, which may correspond with lower rates among those over 65 years of age.
Among Maryland women age 40 years and older, 93% reported ever having had a mammogram (Table 6-2). Eighty-four percent reported having had a mammogram in the last two years. While there was no difference between those living in urban and rural areas for ever having had a mammogram, statistically significantly lower rates were reported by women age 40-49 years, compared to older age groups. The only significant difference by race was in the rural region, where women of “other” races had lower percentages. Women who were never married, had less education, or had employment status of “other” reported statistically significantly lower rates of ever having had a mammogram. While there were differences in mammogram rates by annual household income, no specific trends were identified. 1 Annual Cancer Report, Cigarette Restitution Fund Program, Maryland Department of Health and Mental Hygiene, September, 2002.

Women who had never had a mammogram or had not had the test in the last two years
were asked the reason and these results are shown in Table 6-3. The most common reason given was they put it off or didn’t get around to it (procrastinated). This was followed by women not thinking of getting a mammogram or no reason given, the doctor did not order it or did not say it was needed, the women didn’t know the test was needed, the test was too expensive or the women did not have insurance, or the women did not have any problems. Among the women who report that a health care provider had recommended a mammogram in the last year, 81% reported having the test within the last year. Among those who did not have a health care provider recommendation, only 21% reported having a mammogram within the last year.
Ninety-four percent of Maryland women, age 40 years and older, reported ever having had a CBE (Table 6-4), with no difference by urban or rural area of residence. Eighty-seven percent of women had a CBE in the last two years. While women reporting to have ever had a CBE do not vary by race, having had a CBE was reported less often among women age 65 years and older. Lower rates were seen among women who were widowed or never married, had a high school education or less, had employment status of retired or “other,” or had an annual income less than $25,000 or reported “don’t know/not sure” to the income question. Among women who have not had a hysterectomy, 97% report ever having had a Pap smear (Table 6-5). Ninety percent of Maryland women (who have a uterus) had a Pap smear within the last three years. While there was no difference in ever having had a Pap smear by area of residence, women age 65 years and older had statistically significantly lower rates. Women who were never married or had less than a high school education had statistically significantly lower Pap smear rates, as did those with employment status retired and “other.” Those reporting annual incomes of less than $25,000 and answering “don’t know/not sure” to the income question also had lower rates.
Among women who have not had a hysterectomy, the most common reason for never having or not having had a Pap smear in the last three years was they never thought about it or gave no reason, followed by the woman did not have any problems or the test was too expensive, or the doctor did not order it (Table 6-6). Maryland women are making great strides towards achieving Healthy People 2010 goals for breast and cervical cancer screening (Chart 6-1). In 1998, the national baseline for having a mammogram in the preceding two years among women age 40 years and above was 67%. The Healthy People 2010 goal is 70%.2 Maryland exceeded that goal in 2002, with 84% of women reporting they have had a mammogram in the last two years. Maryland women have also attained the Healthy People 2010 goal of having a Pap smear, within the past three years, of 90%.
2 Healthy People 2010, US Department of Health and Human Services, 2002.

TABLE 6-1 WOMEN REPORTING THAT A HEALTHCARE PROVIDER RECOMMENDED CANCER SCREENING WITH MAMMOGRAM AND PAP SMEAR, AMONG THOSE AGE 40 YEARS AND OLDER
Selected Characteristic N n wt % 95% CI Stat Sig N n wt % 95% CI Stat SigFemale Population 3114 2673 86% 84-87% 2090 2042 98% 97-98%
Age ** **40-49 years 976 811 83% 80-85% 838 828 98% 97-99%50-64 years 1153 1027 89% 87-91% 737 728 99% 98-100%65 years and above 985 835 85% 82-87% 515 486 94% 91-96%
Race ^ ^White 2338 2001 85% 83-87% 1586 1552 98% 97-99%African American 648 560 86% 83-89% 414 402 96% 92-98%Other 128 112 91% 84-95% 90 88 99% 96-100%
Marital Status ** **Married or partner of unmarried couple 1638 1441 88% 86-90% 1147 1134 99% 98-99%Divorced or separated 562 470 83% 79-86% 373 366 98% 94-99%Widowed 662 554 82% 79-86% 369 350 95% 92-97%Never Married 239 196 82% 76-87% 192 184 93% 86-97%
Education ** **Less than high school 327 263 79% 73-84% 175 162 92% 84-96%High school grad or GED 971 832 86% 83-88% 599 581 96% 94-98%College 1-3 years 744 624 83% 80-86% 512 502 98% 97-99%College grad 600 527 88% 85-91% 448 446 100% 98-100%Advanced degree 456 413 92% 89-94% 346 342 99% 98-100%
Employment Status ** **Employed for wages 1403 1223 87% 85-89% 1062 1051 99% 98-100%Self-employed 173 149 85% 77-90% 128 126 98% 91-99%Retired 980 849 86% 84-89% 520 497 95% 92-97%Other 547 441 81% 77-85% 373 362 97% 93-99%
Household Income ** **<$25,000 656 513 79% 75-82% 382 362 94% 91-97%$25,000-<$35,000 328 280 84% 79-88% 221 219 99% 94-100%$35,000-<$50,000 428 379 86% 81-90% 289 283 98% 95-99%$50,000-<$75,000 428 383 89% 85-92% 308 305 98% 93-100%$75,000 or greater 710 637 90% 87-92% 546 545 100% 99-100%Don't Know/Not Sure 176 139 78% 71-85% 117 108 92% 84-96%Refused 388 342 88% 84-91% 227 220 97% 94-99%
Women reporting that a health care provider recommend they have a mammogram in the
last year~
Women reporting that a health care provider recommend they have a Pap smear in the last
year, among women who have not had a hysterectomy ~
~ Some data missing for marital status, education, and employment status.** Statistically significant, p-value < 0.05.^ Not statistically significant, p-value > 0.05. Maryland Cancer Survey, 2002

TABLE 6-2 WOMEN REPORTING TO HAVE EVER HAD A MAMMOGRAM, AMONG THOSE AGE 40 YEARS AND OLDER
Selected Characteristic N n wt % 95% CI Stat Sig N n wt % 95% CI Stat Sig N n wt % 95% CI Stat SigFemale Population 3114 2902 93% 92-94% 2102 1947 93% 92-94% 1012 955 94% 92-96%
Age ** ** **40-49 years 977 856 88% 85-90% 679 587 87% 84-90% 298 269 89% 85-93%50-64 years 1153 1114 97% 96-98% 779 753 97% 95-98% 374 361 97% 95-98%65 years and above 984 932 95% 94-97% 644 607 95% 93-97% 340 325 96% 94-98%
Race ^ ^ **White 2339 2193 94% 93-95% 1448 1347 93% 92-95% 891 846 95% 93-96%African American 647 591 92% 89-94% 557 509 91% 88-94% 90 82 92% 84-96%Other 128 118 91% 83-96% 97 91 93% 84-97% 31 27 73% 42-91%
Marital Status ** ** ^Married or partner of unmarried couple 1640 1546 95% 93-96% 1048 988 95% 93-96% 592 558 94% 92-96%Divorced or separated 562 516 90% 87-93% 410 369 89% 85-92% 152 147 97% 93-99%Widowed 660 620 94% 92-96% 430 404 94% 92-96% 230 216 94% 89-96%Never Married 239 208 85% 79-90% 203 176 85% 78-90% 36 32 86% 68-95%
Education ** ** ^Less than high school 325 293 89% 85-93% 200 178 88% 82-93% 125 115 92% 85-96%High school grad or GED 971 900 93% 91-95% 584 537 92% 90-94% 387 363 94% 91-96%College 1-3 years 745 685 92% 89-94% 495 448 91% 88-93% 250 237 95% 90-97%College grad 601 569 94% 92-96% 460 435 95% 92-97% 141 134 93% 86-97%Advanced degree 456 439 97% 95-98% 350 336 97% 94-98% 106 103 97% 89-99%
Employment Status ** ** **Employed for wages 1404 1311 94% 92-95% 970 902 93% 92-95% 434 409 94% 91-96%Self-employed 173 158 92% 85-95% 117 107 91% 83-96% 56 51 94% 83-98%Retired 979 933 96% 94-97% 641 606 95% 93-97% 338 327 97% 95-98%Other 547 489 88% 85-91% 365 323 88% 84-92% 182 166 89% 82-93%Household Income ** ** ^<$25,000 657 594 91% 88-93% 402 360 90% 87-93% 255 234 91% 86-94%$25,000-<$35,000 328 303 93% 89-95% 201 182 91% 86-94% 127 121 97% 93-99%$35,000-<$50,000 428 393 90% 86-93% 283 257 89% 85-93% 145 136 94% 88-97%$50,000-<$75,000 428 402 93% 90-96% 287 270 94% 89-97% 141 132 91% 83-96%$75,000 or greater 711 687 97% 95-98% 536 515 97% 95-98% 175 172 98% 93-99%Don't Know/Not Sure 173 157 88% 80-93% 107 94 86% 76-92% 66 63 96% 86-99%Refused 389 366 95% 92-97% 286 269 95% 92-97% 103 97 95% 88-98%
TOTAL ~ URBAN ~ RURAL ~
~ Some data missing for marital status, education, and employment status.** Statistically significant, p-value < 0.05.^ Not statistically significant, p-value > 0.05. Maryland Cancer Survey, 2002

TABLE 6-3 RESPONSES TO THE QUESTION "WHAT WAS THE MOST IMPORTANT REASON YOU HAVE NEVER HAD/NOT HAD A MAMMOGRAM IN THE LAST TWO YEARS?"*
Selected Characteristic wt %Doctor didn't order it/didn't say I needed it 14%No reason, never thought about it 15%Didn't need/ didn't know I needed this type of test 14%Haven't had any problems 11%Put it off/didn't get around to it 16%Too expensive/no insurance/cost of test 12%Too painful, unpleasant, or embarrassing 9%Don't have a doctor 7%Didn’t want to know I had cancer 2%Other 9%Have had mastectomy/radical surgery for breast cancer 3%Fear 1%* Asked of 500 female respondents, age 40 years or older, who have never had a mammogram or have not had a mammogram in the last two years. More than one response could be given per respondent
Maryland Cancer Survey, 2002

TABLE 6-4 WOMEN REPORTING TO HAVE EVER HAD A CLINICAL BREAST EXAM (CBE), AMONG THOSE AGE 40 YEARS AND OLDER
Selected Characteristic N n wt % 95% CI Stat Sig N n wt % 95% CI Stat Sig N n wt % 95% CI Stat SigFemale Population 3111 2926 94% 93-95% 2101 1981 94% 93-95 1010 945 94% 93-96%
Age ** ** **40-49 years 977 940 96% 94-97% 679 651 95% 93-97% 298 289 98% 95-99%50-64 years 1153 1096 95% 94-97% 779 745 96% 94-97% 374 351 95% 92-96%65 years and above 981 890 91% 89-93% 643 585 91% 89-93% 338 305 90% 86-93%
Race ^ ^ ^White 2336 2210 95% 94-96% 1446 1371 95% 93-96% 890 839 95% 93-96%African American 647 602 93% 91-95% 558 522 94% 91-96% 89 80 91% 84-96%Other 128 114 90% 80-95% 97 88 90% 79-95% 31 26 91% 76-97%
Marital Status ** ^ **Married or partner of unmarried couple 1639 1563 95% 94-96% 1047 1001 95% 93-96% 592 562 95% 93-97%Divorced or separated 562 534 95% 93-97% 411 389 95% 92-97% 151 145 96% 91-98%Widowed 658 599 92% 89-94% 429 397 93% 89-95% 229 202 88% 83-92%Never Married 239 219 91% 86-95% 203 185 91% 85-95% 36 34 94% 79-99%
Education ** ** **Less than high school 325 291 90% 86-93% 200 180 90% 85-94% 125 111 90% 83-94%High school grad or GED 971 893 92% 89-94% 585 536 91% 88-93% 386 357 93% 90-95%College 1-3 years 743 709 95% 93-97% 494 469 95% 92-97% 249 240 97% 94-98%College grad 600 576 97% 95-98% 459 442 97% 95-98% 141 134 97% 93-99%Advanced degree 456 444 98% 96-99% 350 344 98% 96-99% 106 100 94% 86-97%
Employment Status ** ** **Employed for wages 1404 1352 97% 96-98% 970 937 97% 95-98% 434 415 96% 94-98%Self-employed 173 165 95% 89-98% 117 112 94% 86-98% 56 53 97% 90-99%Retired 976 899 92% 90-94% 640 594 93% 90-95% 336 305 91% 86-93%Other 547 502 91% 88-94% 365 332 90% 86-94% 182 170 95% 90-97%Household Income ** ** **<$25,000 656 588 90% 87-92% 403 361 90% 86-93% 253 227 90% 85-93%$25,000-<$35,000 327 311 95% 91-97% 200 190 94% 88-97% 127 121 96% 92-98%$35,000-<$50,000 426 404 94% 90-96% 281 265 93% 88-96% 145 139 96% 91-98%$50,000-<$75,000 428 414 97% 94-98% 287 279 97% 93-99% 141 135 96% 91-98%$75,000 or greater 711 696 98% 97-99% 536 524 98% 96-99% 175 172 98% 95-100%Don't Know/Not Sure 176 151 87% 81-92% 110 97 89% 81-94% 66 54 83% 70-90%Refused 387 362 94% 90-96% 284 265 93% 90-96% 103 97 94% 87-97%
TOTAL ~ URBAN ~ RURAL ~
~ Some data missing for marital status, education, and employment status.** Statistically significant, p-value < 0.05.^ Not statistically significant, p-value > 0.05.
Maryland Cancer Survey, 2002
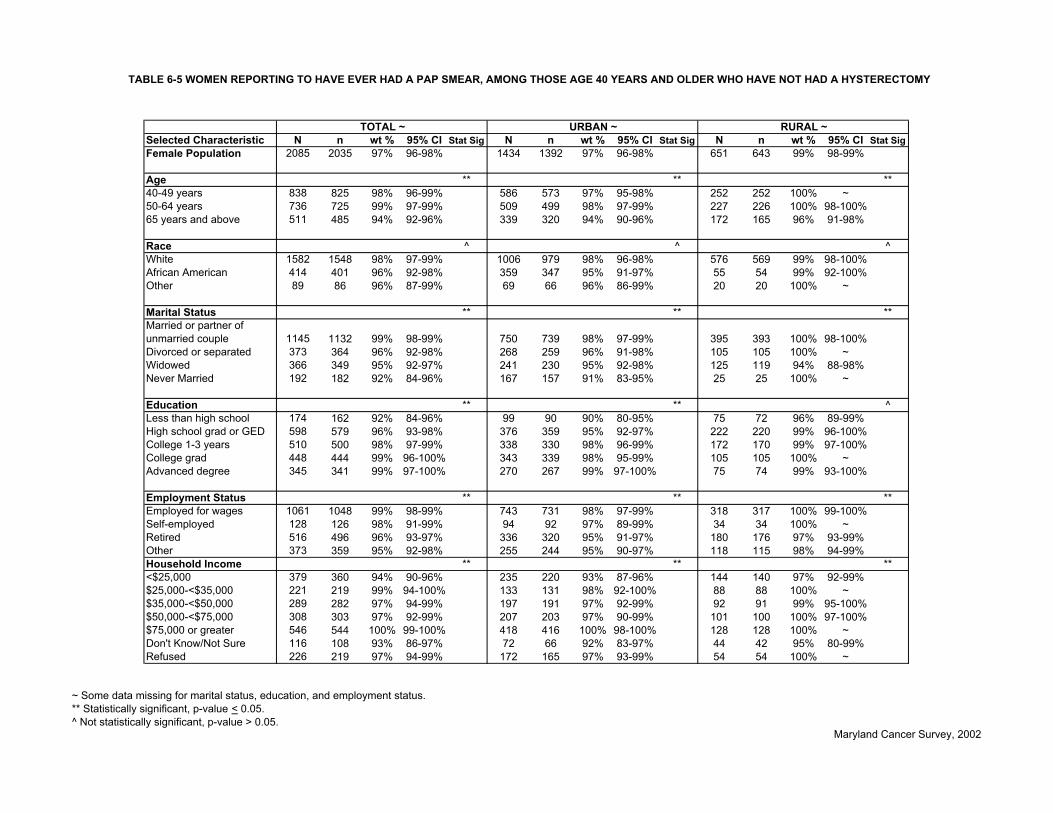
TABLE 6-5 WOMEN REPORTING TO HAVE EVER HAD A PAP SMEAR, AMONG THOSE AGE 40 YEARS AND OLDER WHO HAVE NOT HAD A HYSTERECTOMY
Selected Characteristic N n wt % 95% CI Stat Sig N n wt % 95% CI Stat Sig N n wt % 95% CI Stat SigFemale Population 2085 2035 97% 96-98% 1434 1392 97% 96-98% 651 643 99% 98-99%
Age ** ** **40-49 years 838 825 98% 96-99% 586 573 97% 95-98% 252 252 100% ~50-64 years 736 725 99% 97-99% 509 499 98% 97-99% 227 226 100% 98-100%65 years and above 511 485 94% 92-96% 339 320 94% 90-96% 172 165 96% 91-98%
Race ^ ^ ^White 1582 1548 98% 97-99% 1006 979 98% 96-98% 576 569 99% 98-100%African American 414 401 96% 92-98% 359 347 95% 91-97% 55 54 99% 92-100%Other 89 86 96% 87-99% 69 66 96% 86-99% 20 20 100% ~
Marital Status ** ** **Married or partner of unmarried couple 1145 1132 99% 98-99% 750 739 98% 97-99% 395 393 100% 98-100%Divorced or separated 373 364 96% 92-98% 268 259 96% 91-98% 105 105 100% ~Widowed 366 349 95% 92-97% 241 230 95% 92-98% 125 119 94% 88-98%Never Married 192 182 92% 84-96% 167 157 91% 83-95% 25 25 100% ~
Education ** ** ^Less than high school 174 162 92% 84-96% 99 90 90% 80-95% 75 72 96% 89-99%High school grad or GED 598 579 96% 93-98% 376 359 95% 92-97% 222 220 99% 96-100%College 1-3 years 510 500 98% 97-99% 338 330 98% 96-99% 172 170 99% 97-100%College grad 448 444 99% 96-100% 343 339 98% 95-99% 105 105 100% ~Advanced degree 345 341 99% 97-100% 270 267 99% 97-100% 75 74 99% 93-100%
Employment Status ** ** **Employed for wages 1061 1048 99% 98-99% 743 731 98% 97-99% 318 317 100% 99-100%Self-employed 128 126 98% 91-99% 94 92 97% 89-99% 34 34 100% ~Retired 516 496 96% 93-97% 336 320 95% 91-97% 180 176 97% 93-99%Other 373 359 95% 92-98% 255 244 95% 90-97% 118 115 98% 94-99%Household Income ** ** **<$25,000 379 360 94% 90-96% 235 220 93% 87-96% 144 140 97% 92-99%$25,000-<$35,000 221 219 99% 94-100% 133 131 98% 92-100% 88 88 100% ~$35,000-<$50,000 289 282 97% 94-99% 197 191 97% 92-99% 92 91 99% 95-100%$50,000-<$75,000 308 303 97% 92-99% 207 203 97% 90-99% 101 100 100% 97-100%$75,000 or greater 546 544 100% 99-100% 418 416 100% 98-100% 128 128 100% ~Don't Know/Not Sure 116 108 93% 86-97% 72 66 92% 83-97% 44 42 95% 80-99%Refused 226 219 97% 94-99% 172 165 97% 93-99% 54 54 100% ~
TOTAL ~ URBAN ~ RURAL ~
~ Some data missing for marital status, education, and employment status.** Statistically significant, p-value < 0.05.^ Not statistically significant, p-value > 0.05.
Maryland Cancer Survey, 2002

TABLE 6-6 RESPONSES TO THE QUESTION "WHAT WAS THE MOST IMPORTANT REASON YOU HAVE NEVER HAD/NOT HAD A PAP SMEAR IN THE LAST THREE YEARS?"*
Selected Characteristic wt %Doctor didn't order it/didn't say I needed it 13%No reason, never thought about it 19%Didn't need/ didn't know I needed this type of test 12%Haven't had any problems 14%Put it off/didn't get around to it 12%Too expensive/no insurance/cost of test 14%Too painful, unpleasant, or embarrassing 4%Don't have a doctor 12%Didn’t want to know I had cancer 1%Other 8%Fear 1%* Asked of 231 female respondents, age 40 years or older (who have not had a hysterectomy), who have never had a Pap smear or have not had a Pap smear in the last three years. More than one response could be given per respondent
Maryland Cancer Survey, 2002

Chart 6-1 Comparison of the results of the Maryland Cancer Survey, 2002 to national baselines and Healthy People 2010 target values; proportion of women age 40 years and older who have had a mammogram in the previous two years and had a Pap smear in the previous three years (among women that have not had a hysterectomy).
67% 70%
90%90%
79%84%
0%
20%
40%
60%
80%
100%
NHIS(1998)
2010Target
MCS,2002
NHIS(1998)
2010Target
MCS,2002
Mammography in the last 2 years Pap smear in the last 3years
percent
NHIS-National Health Interview Survey 2010 Target-Healthy People 2010 MCS, 2002-Maryland Cancer Survey, 2002

Chapter 7. Oral Cancer Screening Oral cancer is cancer that arises within the oral cavity and pharynx. In 1999, there were 539 new cases of oral cancer with 144 deaths among Maryland residents. Among the 50 states and the District of Columbia, Maryland ranks 8th highest for oral cancer mortality.1 The screening exam for oral cancer consists of inspection of the oral cavity and pharynx for lesions or discolorations and palpation (feeling) of oral structures (such as the tongue) for masses. A dentist or dental hygienist can perform this exam during a routine dental examination. A physician, nurse practitioner, physician assistant, or other trained healthcare provider can also perform the screening exam. Forty-five percent of Marylanders age 40 years and older report they have heard of the screening test for oral cancer (Table 7-1). Those in the younger age group (40-49 years) were less knowledgeable about the test, as were men, those people with less than a high school education, or those earning less than $25,000 or reporting “don’t know/not sure” to the income question.
Among Marylanders, 40 years and older, 43% report that they have ever had an oral cancer screening exam, with a statistically significantly higher rate in urban areas (44%) than rural areas (40%) (Table 7-2). Thirty-four percent of Marylanders had the exam within the preceding year, and 38% have had the exam within the last two years. Our numbers exceed the Healthy People 2010 goal to increase the proportion of adults who have had the exam in the last 12 months to 20% (Chart 7-1).2 White women had statistically significantly higher oral cancer screening rates (52%), followed by “other” females and white men (45% and 42%, respectively). People that were widowed or never married reported lower rates of screening. As annual household income or education level increased, so did the percentage of Marylanders who reported oral cancer screening. Eighty percent of those screened report the test was performed by a dentist, 8% by a dental hygienist, 8% by a physician, and the remainder by other health care providers.
Visits to the dentist for routine care are very important, since almost 90% of oral cancer
screening tests were performed by a dentist or dental hygienist. Seventy-six percent of Marylanders age 40 years and older report they had visited a dentist or dental clinic in the last year (Table 7-1). This compares to the Healthy People 2010 objective to increase the proportion of children and adults who use the oral health system each year to 56% (Chart 7-1).2 Dental visits decreased with increasing age, from 79% among those 40-49 years to 72% for those age 65 and older. A statistically significant lower percentage of African American men and women had visited a dentist or dental clinic in the last year than whites or people of “other” races. Having been to the dentist in the last year varied with marital status, education, employment, and income. People that were married or the partner of an unmarried couple were more likely to see a dentist in the last year, as were college graduates or people who had an advanced degree or people who were employed for wages. People with an annual household income of less than $50,000 were statistically significantly less likely to have visited a dentist in the last year. The percentage of people that ever had an oral cancer screening exam falls dramatically with the
1 Annual Cancer Report, Cigarette Restitution Fun Program, Department of Health and Mental Hygiene, September, 2002 2 Healthy People 2010, US Department of Health and Human Services, 2000

number years since the last dental visit. Fifty percent of people that visited the dentist in the last year reported ever having had an oral cancer screening exam, compared to 21% who saw a dentist in the previous 2-3 years, and 15% who saw the dentist five or more years ago.
Sixty-eight percent of Marylanders report having some form of dental insurance (Table
7-1). People in the oldest age group, 65 years and older, report statistically significantly lower rates of dental insurance (47%), than people 40-49 years (77%) or 50-64 years (73%). Significantly higher rates of dental insurance were reported among men, African Americans, people that are married or the partner of an unmarried couple, people with advanced educational degrees, people who are employed for wages, or those with annual household incomes greater than $50,000 per year. Having dental insurance was also statistically significantly associated with having an oral cancer screening exam. Forty-five percent of people with dental insurance reported having an oral screening exam compared to 38% of those without dental insurance.

TABLE 7-1 PEOPLE REPORTING DENTAL VISITS, DENTAL INSURANCE STATUS, AND AWARENESS OF ORAL CANCER SCREENING TESTS, AMONG THOSE AGE 40 YEARS AND OLDER
Selected Characteristic N n wt % 95% CI Stat Sig N n wt % 95% CI Stat Sig N n wt % 95% CI Stat SigTotal Population 5011 3797 76% 75-77% 4996 3249 68% 66-69% 4916 2273 45% 43-47%
Gender ^ ** **Male 1912 1418 74% 71-76% 1907 1301 71% 69-74% 1878 794 42% 39-45%Female 3099 2379 78% 76-80% 3089 1948 65% 63-67% 3038 1479 48% 46-50%
Age ** ** **40-49 years 1599 1280 79% 77-81% 1597 1210 77% 74-79% 1575 668 42% 39-45%50-64 years 1923 1465 76% 73-78% 1921 1369 73% 71-76% 1885 901 47% 45-50%65 years and above 1489 1052 72% 69-74% 1478 670 47% 44-50% 1456 704 47% 44-50%
Race ** ** ^White 3830 2992 79% 78-80% 3817 2420 66% 64-68% 3750 1741 46% 44-47%African American 975 649 66% 62-69% 974 692 73% 70-76% 963 437 44% 41-48%Other 206 156 79% 72-85% 205 137 68% 59-76% 203 95 42% 34-51%
Gender and Race ** ** **White Males 1502 1150 77% 74-79% 1497 986 69% 66-71% 1475 612 41% 39-44%African American Males 331 207 62% 56-68% 331 257 79% 74-84% 326 146 44% 38-50%Other Males 79 61 80% 68-89% 79 58 72% 57-83% 77 36 42% 29-56%White Females 2328 1842 81% 79-83% 2320 1434 63% 61-66% 2275 1129 49% 47-52%African American Females 644 442 69% 65-73% 643 435 68% 64-72% 637 291 44% 40-49%Other Females 127 95 78% 69-85% 126 79 65% 54-74% 126 59 42% 32-53%
People reporting they have visited a dentist or dental clinic in the last year ~
People reporting they have some form of dental insurance ~
People reporting they have heard of the oral cancer screening test ~
~ Some data missing for marital status, education, and employment status.** Statistically significant, p-value < 0.05.^ Not statistically significant, p-value > 0.05. Maryland Cancer Survey, 2002

TABLE 7-1 PEOPLE REPORTING DENTAL VISITS, DENTAL INSURANCE STATUS, AND AWARENESS OF ORAL CANCER SCREENING TESTS, AMONG THOSE AGE 40 YEARS AND OLDER
Selected Characteristic N n wt % 95% CI Stat Sig N n wt % 95% CI Stat Sig N n wt % 95% CI Stat Sig
People reporting they have visited a dentist or dental clinic in the last year ~
People reporting they have some form of dental insurance ~
People reporting they have heard of the oral cancer screening test ~
Marital Status ** ** ^Married or partner of unmarried couple 2973 2376 80% 78-81% 2966 2118 73% 71-75% 2912 1348 45% 43-47%Divorced or separated 844 594 69% 65-72% 843 536 64% 60-68% 828 378 45% 41-49%Widowed 795 525 65% 61-69% 787 351 45% 41-49% 779 370 47% 43-51%Never Married 378 287 73% 66-78% 378 230 61% 55-67% 375 165 44% 38-50%
Education ** ** **Less than high school 500 212 43% 38-48% 498 205 43% 38-48% 498 196 37% 32-42%High school grad or GED 1473 1047 71% 68-74% 1468 877 63% 60-66% 1453 650 44% 41-47%College 1-3 years 1125 882 79% 76-81% 1124 753 70% 67-73% 1106 543 48% 45-52%College grad 1031 885 86% 83-88% 1030 740 73% 70-76% 1005 470 45% 42-49%Advanced degree 861 755 87% 84-90% 854 660 80% 76-82% 832 401 46% 42-50%
Employment Status ** ** ^Employed for wages 2375 1919 80% 78-82% 2376 1931 83% 81-85% 2326 1074 45% 43-48%Self-employed 375 274 74% 69-79% 372 182 51% 45-57% 371 154 40% 34-46%Retired 1593 1145 72% 70-75% 1581 803 53% 50-56% 1554 745 47% 44-50%Other 653 447 69% 65-73% 650 324 52% 47-56% 647 287 42% 38-47%
Household Income ** ** **<$25,000 903 494 54% 50-58% 894 357 43% 39-47% 890 375 40% 36-44%$25,000-<$35,000 512 348 66% 61-71% 511 289 55% 50-60% 499 237 48% 43-53%$35,000-<$50,000 713 550 76% 72-79% 712 491 70% 66-74% 697 313 44% 40-48%$50,000-<$75,000 752 624 83% 80-86% 751 586 80% 76-83% 736 340 45% 41-49%$75,000 or greater 1320 1173 88% 86-90% 1318 1066 83% 80-85% 1286 611 47% 44-50%Don't Know/Not Sure 213 143 68% 60-75% 209 105 53% 45-61% 215 90 40% 33-48%Refused 598 465 77% 73-81% 601 355 62% 57-66% 593 307 49% 44-53%
~ Some data missing for marital status, education, and employment status.** Statistically significant, p-value < 0.05.^ Not statistically significant, p-value > 0.05. Maryland Cancer Survey, 2002

TABLE 7-2 PEOPLE REPORTING THEY HAVE EVER HAD AN ORAL CANCER SCREENING EXAM, AMONG THOSE AGE 40 YEARS AND OLDER
Selected Characteristic N n wt % 95% CI Stat Sig N n wt % 95% CI Stat Sig N n wt % 95% CI Stat SigTotal Population 4861 2120 43% 41-44% 3275 1463 44% 42-46% 1586 657 40% 37-42%
Gender ** ** **Male 1845 715 38% 36-41% 1244 503 40% 36-43% 601 212 34% 30-39%Female 3016 1405 47% 44-49% 2031 960 47% 45-50% 985 445 45% 41-48%
Age ^ ** ^40-49 years 1561 678 42% 39-45% 1083 467 42% 38-45% 478 211 42% 37-47%50-64 years 1861 847 46% 43-48% 1241 585 47% 44-50% 620 262 41% 37-45%65 years and above 1439 595 40% 38-43% 951 411 42% 38-45% 488 184 36% 31-40%
Race ** ** **White 3717 1758 48% 46-49% 2308 1156 50% 48-52% 1409 602 42% 39-44%African American 952 282 29% 25-32% 826 248 29% 26-33% 126 34 25% 17-34%Other 192 80 41% 32-50% 141 59 41% 32-51% 51 21 38% 23-56%
Gender and Race ** ** **White Males 1447 600 42% 39-45% 905 405 45% 41-48% 542 195 36% 32-41%African American Males 323 87 26% 21-32% 284 76 27% 21-33% 39 11 23% 12-38%Other Males 75 28 36% 24-51% 55 22 38% 24-53% 20 6 21% 9-43%White Females 2270 1158 52% 50-55% 1403 751 54% 52-57% 867 407 47% 43-50%African American Females 629 195 30% 27-35% 542 172 31% 27-35% 87 23 27% 17-38%Other Females 117 52 45% 34-56% 86 37 44% 32-56% 31 15 53% 31-74%
TOTAL ~ URBAN ~ RURAL ~
~ Some data missing for marital status, education, and employment status.** Statistically significant, p-value < 0.05.^ Not statistically significant, p-value > 0.05. Maryland Cancer Survey, 2002

TABLE 7-2 PEOPLE REPORTING THEY HAVE EVER HAD AN ORAL CANCER SCREENING EXAM, AMONG THOSE AGE 40 YEARS AND OLDER
Selected Characteristic N n wt % 95% CI Stat Sig N n wt % 95% CI Stat Sig N n wt % 95% CI Stat SigTOTAL ~ URBAN ~ RURAL ~
Marital Status ** ** ^Married or partner of unmarried couple 2889 1336 45% 43-47% 1869 904 47% 44-49% 1020 432 40% 37-43%Divorced or separated 820 348 40% 36-44% 586 255 41% 36-46% 234 93 38% 31-46%Widowed 764 281 34% 30-38% 503 175 32% 28-37% 261 106 41% 35-47%Never Married 367 148 38% 32-44% 301 122 38% 32-45% 66 26 37% 25-50%
Education ** ** **Less than high school 495 117 24% 20-29% 303 77 26% 21-32% 192 40 20% 15-27%High school grad or GED 1444 513 35% 32-38% 860 316 36% 33-40% 584 197 33% 28-37%College 1-3 years 1083 484 44% 41-48% 696 301 44% 40-48% 387 183 46% 40-52%College grad 994 541 51% 47-55% 753 411 51% 47-55% 241 130 50% 43-58%Advanced degree 825 455 54% 50-58% 646 349 53% 49-58% 179 106 59% 51-66%
Employment Status ^ ^ ^Employed for wages 2299 1049 44% 42-47% 1579 731 45% 42-48% 720 318 42% 38-46%Self-employed 364 150 40% 34-46% 242 96 39% 32-46% 122 54 41% 32-51%Retired 1541 655 42% 39-45% 1007 442 43% 40-46% 534 213 38% 34-43%Other 640 257 40% 36-45% 433 187 42% 37-48% 207 70 33% 26-41%
Household Income ** ** **<$25,000 883 251 28% 25-32% 545 161 29% 25-34% 338 90 24% 20-29%$25,000-<$35,000 496 187 37% 32-42% 300 112 38% 32-44% 196 75 36% 28-43%$35,000-<$50,000 691 290 40% 36-44% 439 188 40% 35-45% 252 102 38% 32-45%$50,000-<$75,000 725 332 43% 39-47% 489 221 43% 38-48% 236 111 43% 36-50%$75,000 or greater 1276 692 54% 51-57% 947 516 55% 51-58% 329 176 51% 45-57%Don't Know/Not Sure 211 88 39% 32-47% 131 56 40% 31-49% 80 32 37% 26-49%Refused 579 280 46% 41-50% 424 209 45% 40-50% 155 71 47% 39-56%
~ Some data missing for marital status, education, and employment status.** Statistically significant, p-value < 0.05.^ Not statistically significant, p-value > 0.05. Maryland Cancer Survey, 2002

Chart 7-1 Comparison of the results of the Maryland Cancer Survey, 2002 to national baselines and Healthy People 2010 target values; proportion of people age 40 years and older who have visited the dentist in the previous year and had an oral cancer screening test in the previous year.
13%20%
34%
76%
56%
44%
0%
20%
40%
60%
80%
100%
MEPS(1996)
2010Target
MCS,2002
NHIS(1998)
2010Target
MCS,2002
Dental visit in the last year Oral cancer screeningexam in the last year
percent
MEPS-Medical Expenditure Panel Survey NHIS-National Health Interview Survey 2010 Target-Healthy People 2010 MCS, 2002-Maryland Cancer Survey, 2002

Chapter 8. Methods to Prevent Sun Exposure
Skin cancer is the most common form of cancer in the United States.1 Excess exposure to ultra violet (UV) radiation has long been linked to both melanoma and nonmelanoma skin cancers.2 Exposure to the sun's UV rays appears to be the most important preventable factor in the development of skin cancer.3 Healthy People 2010 recommends four ways to protect the skin from sun exposure and to reduce the risk of skin cancer.4 These recommendations are to avoid the sun between the hours of 10 a.m. and 4 p.m., wear sun-protective clothing when exposed to sunlight, use sunscreen with a sun-protective factor (SPF) of 15 or higher, and avoid artificial sources of UV light. This survey assessed how frequently people report that they incorporated these recommendations into their lifestyle (Table 8-1).
Thirty-seven percent of people age 40 years and older report they always or nearly
always avoid the sun between the hours of 10 a.m. and 4 p.m. Women are more likely to avoid the sun than men (45% vs. 28%). This holds true for women of all races. People in the older age group (65 years and above) are more likely to avoid the sun during peak exposure hours.
To determine how often people protected their skin from the sun when outside, people
were asked about their use of sunscreen, hats, and other protective clothing. Thirty-three percent reported they always or nearly always use sunscreen with an SPF rating of at least 15 when outdoors for an hour or more on a sunny day. White females were more likely to use sunscreen than African American females, females of “other” races, and men of all races. Statistically significant differences were also observed by education, marital status, and income. People that are married or are the partner of an unmarried couple were more likely to use sunscreen as were those with a college education or advanced degree or who had higher annual incomes. There was almost no variation found between age groups.
African American males were more likely (32%) to always or nearly always wear a
protective hat when outdoors for an hour or more on a sunny day than any other gender/race group, while men of “other” races were the least likely to wear a hat. There was no difference by annual income. There was a statistically significant difference by educational level, but no trend was observed.
Only 25% of Marylanders age 40 years and older reported they always or nearly always
wear protective clothing, such as a long sleeved shirt or long pants, when outdoors for an hour or more on a sunny day. There was no significant difference by gender. However when both race and gender were examined together, African American men and women, and women of “other” races were most likely to wear protective clothing. Differences in wearing protective clothing when outdoors for an hour or more on a sunny day were also seen by age, marital status, and education. The percentage of people that used protective clothing increased with age. The use of 1 What you need to know about skin cancer. NIH Publication, 2002. No. 95-1564. http://www.cancer.gov/cancerinfo/wyntk/skin#1 2 Koh, HK et. al. Prevention and early detection strategies for melanoma and skin cancer: Current status. Archives of Dermatology. 1996 132(4):436-442. 3 Cancer Facts and Figures. American Cancer Society, 2003. http://www.cancer.org/downloads/STT/CAFF2003PWSecured.pdf 4 Healthy People 2010, US Department of Health and Human Services, 2000.

protective clothing decreased with increasing educational level or annual income. People that are retired or widowed were more likely to wear protective clothing.
One of the objectives of Healthy People 2010 is to increase the proportion of people who
use at least one form of sun protection to 75% of adults 18 years and older. The national baseline from the National Health Interview Survey, 1998 is 47%. 4 The MCS found 67% of Marylanders age 40 years and older always, or almost always, use at least one of the following methods; avoidance, sunscreen, wear a protective hat, or wear other protective clothing. Healthy People 2010 also recommends avoiding sources of artificial ultraviolet light. Only 4% of Marylanders, age 40 and above, reported they use artificial sources such as tanning beds or tanning lamps.

TABLE 8-1 PEOPLE WHO REPORT THAT THEY USE METHODS TO PREVENT SUN EXPOSURE, AMONG THOSE AGE 40 YEARS AND OLDER
Selected Characteristic N n wt % 95% CI Stat Sig N n wt % 95% CI Stat Sig N n wt % 95% CI Stat Sig N n wt % 95% CI Stat SigTotal Population 4658 1795 37% 35-39% 4784 1654 33% 31-34% 4803 1159 24% 23-25% 4772 1195 25% 24-27%
Gender ** ** ** ^Male 1823 498 28% 26-30% 1878 413 22% 20-24% 1885 505 26% 24-29% 1878 480 26% 23-28%Female 2835 1297 45% 43-47% 2906 1241 43% 40-45% 2918 654 22% 20-24% 2894 715 25% 24-27%
Age ** ^ ** **40-49 years 1548 527 34% 31-37% 1581 557 33% 30-35% 1579 256 16% 14-18% 1576 297 20% 17-22%50-64 years 1818 717 38% 36-41% 1865 636 33% 30-35% 1874 440 25% 23-27% 1864 439 25% 23-27%65 years and above 1292 551 40% 37-43% 1338 461 33% 30-36% 1350 463 35% 33-38% 1332 459 36% 33-39%
Race ^ ** ^ **White 3582 1344 36% 34-38% 3664 1454 39% 38-41% 3680 856 23% 21-25% 3653 824 22% 21-24%African American 890 373 40% 37-44% 925 152 15% 13-18% 929 258 28% 25-31% 927 308 34% 30-37%Other 186 78 39% 31-48% 195 48 23% 17-31% 194 45 20% 14-27% 192 63 31% 24-39%
Gender and Race ** ** ** **White Males 1435 377 27% 24-29% 1478 378 27% 25-30% 1485 388 25% 23-28% 1475 343 23% 20-25%African American Males 314 97 32% 26-38% 322 24 7% 5-11% 323 103 32% 27-38% 326 113 35% 30-41%Other Males 74 24 30% 19-43% 78 11 16% 8-29% 77 14 17% 9-28% 77 24 25% 16-37%White Females 2147 967 44% 42-47% 2186 1076 51% 48-53% 2195 468 21% 19-23% 2178 481 22% 20-24%African American Females 576 276 47% 42-51% 603 128 22% 18-26% 606 155 24% 21-28% 601 195 32% 28-36%Other Females 112 54 47% 36-58% 117 37 30% 21-41% 117 31 23% 16-33% 115 39 36% 26-48%
Marital StatusMarried or partner of unmarried couple 2811 998 35% 33-37% ** 2890 1088 35% 34-37% ** 2899 705 24% 22-26% ** 2887 650 23% 22-25% **Divorced or separated 790 325 41% 36-45% 803 232 26% 23-30% 808 153 19% 16-22% 804 212 27% 24-31%Widowed 682 321 46% 41-50% 703 222 29% 26-33% 709 223 34% 30-38% 698 227 34% 30-38%Never Married 356 144 39% 34-46% 367 107 27% 22-32% 366 73 19% 15-24% 363 103 29% 24-35%
Education ^ ** ** **Less than high school 417 166 36% 31-42% 442 83 16% 13-20% 445 112 25% 21-31% 444 138 31% 26-36%High school grad or GED 1361 520 37% 34-40% 1400 413 27% 25-30% 1399 273 20% 17-22% 1393 333 25% 23-28%College 1-3 years 1054 402 37% 34-41% 1083 374 33% 30-37% 1084 256 23% 21-27% 1078 272 25% 22-28%College grad 981 388 38% 35-42% 997 418 41% 37-44% 1007 263 25% 22-28% 996 254 26% 23-30%Advanced degree 825 309 36% 32-40% 841 359 40% 36-44% 847 249 29% 26-33% 841 193 22% 19-25%
People reporting they always or nearly always wear protective clothing like a long sleeved shirt or long pants when outdoors
for an hour or more on a sunny day ~
People reporting they always or nearly always wear a wide-brimmed hat or other hat that shades their face, ears, and neck when outdoors for an hour or more on a
sunny day ~
People reporting they always or nearly always use sunscreen with a SPF rating of 15 or higher when outdoors for an hour or
more on a sunny day ~
People reporting they always or nearly always avoid the sun between the hours of
10am and 4pm ~
~ Some data missing for marital status, education, and employment status.** Statistically significant, p-value < 0.05.^ Not statistically significant, p-value > 0.05. Maryland Cancer Survey, 2002

TABLE 8-1 PEOPLE WHO REPORT THAT THEY USE METHODS TO PREVENT SUN EXPOSURE, AMONG THOSE AGE 40 YEARS AND OLDER
Selected Characteristic N n wt % 95% CI Stat Sig N n wt % 95% CI Stat Sig N n wt % 95% CI Stat Sig N n wt % 95% CI Stat Sig
People reporting they always or nearly always wear protective clothing like a long sleeved shirt or long pants when outdoors
for an hour or more on a sunny day ~
People reporting they always or nearly always wear a wide-brimmed hat or other hat that shades their face, ears, and neck when outdoors for an hour or more on a
sunny day ~
People reporting they always or nearly always use sunscreen with a SPF rating of 15 or higher when outdoors for an hour or
more on a sunny day ~
People reporting they always or nearly always avoid the sun between the hours of
10am and 4pm ~
Employment Status ** ** ** **Employed for wages 2284 884 37% 35-40% 2328 811 33% 31-35% 2335 467 20% 18-22% 2326 485 21% 20-23%Self-employed 364 104 29% 24-35% 369 131 32% 27-38% 367 84 22% 18-27% 367 86 24% 19-30%Retired 1403 570 38% 35-41% 1460 494 33% 30-35% 1473 497 35% 32-38% 1454 481 34% 31-37%Other 593 232 39% 34-43% 610 215 34% 30-38% 611 106 17% 14-21% 609 138 24% 20-28%
Household Income ** ** ^ **<$25,000 779 333 40% 36-45% 818 224 25% 21-28% 823 212 26% 23-30% 809 259 34% 30-39%$25,000-<$35,000 476 197 42% 37-48% 486 135 26% 22-31% 488 118 24% 20-28% 487 125 28% 23-33%$35,000-<$50,000 671 264 36% 32-41% 683 208 28% 24-32% 688 152 22% 18-25% 686 166 24% 20-28%$50,000-<$75,000 719 267 36% 32-40% 733 256 33% 29-37% 735 159 22% 18-25% 732 179 24% 21-28%$75,000 or greater 1281 435 33% 30-36% 1303 544 39% 36-42% 1307 305 23% 21-26% 1299 251 19% 17-22%Don't Know/Not Sure 180 76 43% 35-52% 187 66 38% 30-47% 188 51 30% 23-39% 190 57 33% 25-41%Refused 552 223 40% 35-45% 574 221 37% 33-42% 574 162 27% 23-32% 569 158 28% 24-33%
~ Some data missing for marital status, education, and employment status.** Statistically significant, p-value < 0.05.^ Not statistically significant, p-value > 0.05. Maryland Cancer Survey, 2002

Chapter 9. Perceived Risk of Developing Cancer and Screening Behaviors
The MCS examined whether perception of cancer risk was associated with cancer screening behavior. Respondents were asked about how concerned they were about getting cancer, about their perceived risk of cancer, and about the amount of cancer in their family. They were also asked to rate their health status. The responses to these questions were examined in reference to screening practices and selected demographic variables.
Eighty-three percent of Marylanders said they were very or somewhat concerned about
getting cancer (Table 9-1). Concern about getting cancer was statistically significantly associated with all the demographic characteristics: women were more likely than men to be concerned about getting cancer (84% vs. 81%); those age 40-49 and 50-64 years were also more likely to be concerned than those 65 years and older (86%, 86% vs. 73%); widowed Marylanders, those with less than a high school education, retired individuals, or those earning less than $25,000 per year were less concerned about getting cancer. Whites and African Americans were more concerned about getting cancer than people of “other” races.
Those who were somewhat or very concerned about getting cancer in the future reported
higher screening rates for breast and oral cancer screening than those who were not concerned at all (Table 9-2). For colorectal, prostate, and cervical cancer screening, concern about getting cancer did not affect the proportions of people screened.
When people were asked about their risk of developing cancer, 63% reported that their
risk was medium to high (Table 9-1). There was no difference in perceived risk of getting cancer between men and women. Those 65 years and older were significantly less likely to perceive their risk to be medium to high when compared to people in the younger age groups. This is of note, because the incidence of cancer increases with age. A statistically significantly greater percentage of whites believed their risk was medium to high (66%) than either African Americans (59%) or those of “other” races (46%). People who were widowed or retired were less likely to believe their risk was medium to high than those with any other marital or employment status. There were no discernible trends of risk by educational level or income.
When this variable was examined by ever having one of six screening tests (Table 9-2),
there was a statistically significant difference only in the responses for oral cancer screening. For most of the screening tests, beliefs about personal risk of developing cancer were not associated with whether or not people were screened. Only for oral cancer were statistically significantly higher screening rates seen among those who believed they had an increased risk of developing cancer, compared to those who believed they had a low risk (of those believing they were at high to medium risk of cancer, 45% had been screened vs. 41% of those believing they were at low risk).
When people were asked to categorize the amount of cancer in their family (high,
medium, or low), 42% of Marylanders answered that the amount of cancer in their family was medium to high (Table 9-1). No significant difference was found for amount of cancer believed to be in the family by education, marital status, or income. Women were statistically

significantly more likely (45%) than men (38%) to believe that the amount of cancer in their family was medium to high. Older individuals (age 65 and older) were less likely to believe that they had a medium to high amount of cancer in their family in comparison to the younger age groups. African Americans, and those of “other” races were less likely to state that their family history risk of cancer was medium to high in comparison to whites (37%, 38% vs. 44%). Retired Marylanders were less likely to think that the amount of cancer in their family was medium to high than those of any other employment status.
When examining cancer screening practices, the only significant difference was found in
the responses of those who had an endoscopy (sigmoidoscopy or colonoscopy). (Table 9-2) Those who believed they had a high or medium amount of cancer in their family were more likely (61%) to have had an endoscopy than those who believed the amounts of cancer were low (56%).
With respect to self-perceived health status, 50% of Marylanders reported that their
health status was excellent or very good, 33% reported their health status as good, and 17% reported their health status as fair or poor (Table 9-3). There was no difference in perceived health status between men and women. Those who were younger, married or a partner of an unmarried couple, had higher education level, were employed or had higher income were more likely to report their health status as excellent or very good. A greater percentage of people 65 years and older, African Americans, those with less than a high school education, those earning less than $35,000 annually, or those who are retired or have an employment status of “other” report having fair to poor health.
The only significant differences found in the screening categories were for those who
had ever had a PSA, Pap smear, or oral cancer screening test (Table 9-2). Those who perceived their health to be excellent or very good were more likely (78%) to have had a PSA test (78%) than those who perceived their health as good (74%) or poor (69%). A similar pattern existed for those who had ever had a Pap smear or oral cancer screening test.

TABLE 9-1 RESPONSES TO QUESTIONS ABOUT PERCEIVED RISK OF DEVELOPING CANCER, AMONG THOSE AGE 40 YEARS AND OLDER
Selected Characteristic N n wt % 95% CI Stat Sig N n wt % 95% CI Stat Sig N n wt % 95% CI Stat SigTotal Population 4974 4095 83% 81-84% 4661 2934 63% 62-65% 4938 2126 42% 41-44%
Gender ** ^ **Male 1895 1524 81% 79-83% 1789 1110 63% 60-65% 1881 721 38% 36-41%Female 3079 2571 84% 82-85% 2872 1824 64% 62-66% 3057 1405 45% 43-48%
Age ** ** **40-49 years 1592 1379 86% 84-88% 1524 1036 68% 65-71% 1574 731 45% 43-48%50-64 years 1909 1640 86% 84-88% 1822 1224 67% 64-69% 1901 850 44% 41-46%65 years and older 1473 1076 73% 70-75% 1315 674 52% 48-55% 1463 545 36% 33-39%
Race ** ** **White 3812 3159 83% 82-85% 3613 2337 66% 64-68% 3787 1699 44% 43-46%African American 960 784 82% 79-84% 863 508 59% 55-63% 953 352 37% 34-41%Other 202 152 77% 69-83% 185 89 46% 37-55% 198 75 38% 29-46%
Gender and Race ** ** **White Males 1496 1205 81% 79-84% 1422 903 66% 63-68% 1483 601 41% 38-44%African American Males 323 258 81% 75-85% 296 177 60% 53-66% 322 95 32% 27-28%Other Males 76 61 81% 68-90% 71 30 34% 22-49% 76 25 33% 21-48%White Females 2316 1954 85% 83-87% 2191 1434 66% 64-69% 2304 1098 47% 45-50%African American Females 637 526 83% 79-86% 567 331 58% 54-63% 631 257 41% 37-45%Other Females 126 91 73% 63-82% 114 59 56% 45-67% 122 50 41% 31-52%
People reporting to believe the amount of cancer in their family is medium to
high ~People reporting to believe their risk of
getting cancer is medium to high ~
People reporting to be very or somewhat concerned about getting
cancer ~
~ Some data missing for marital status, education, and employment status.** Statistically significant, p-value < 0.05.^ Not statistically significant, p-value > 0.05.
Maryland Cancer Survey, 2002

TABLE 9-1 RESPONSES TO QUESTIONS ABOUT PERCEIVED RISK OF DEVELOPING CANCER, AMONG THOSE AGE 40 YEARS AND OLDER
Selected Characteristic N n wt % 95% CI Stat Sig N n wt % 95% CI Stat Sig N n wt % 95% CI Stat Sig
People reporting to believe the amount of cancer in their family is medium to
high ~People reporting to believe their risk of
getting cancer is medium to high ~
People reporting to be very or somewhat concerned about getting
cancer ~
Marital Status ** ** ^Married or partner of unmarried couple 2952 2505 84% 83-86% 2809 1807 64% 62-66% 2934 1256 42% 39-44%Divorced or separated 836 693 83% 80-86% 781 512 67% 63-70% 827 377 45% 41-49%Widowed 788 578 73% 69-77% 701 379 55% 50-59% 787 315 40% 36-44%Never Married 376 301 80% 75-85% 352 224 65% 59-71% 370 169 47% 41-54%
Education ** ** ^Less than high school 497 364 74% 69-78% 424 257 61% 56-66% 494 219 42% 37-47%High school grad or GED 1458 1196 82% 80-84% 1357 878 66% 63-68% 1454 633 43% 40-46%College 1-3 years 1119 935 85% 82-87% 1067 685 65% 62-68% 1111 489 44% 41-48%College grad 1024 856 84% 81-86% 972 593 61% 57-64% 1017 416 39% 35-42%Advanced degree 855 729 85% 81-87% 824 512 62% 58-66% 843 359 44% 40-48%
Employment Status ** ** **Employed for wages 2362 2044 86% 84-88% 2258 1500 66% 64-68% 2342 1024 43% 40-45%Self-employed 370 313 85% 81-89% 361 229 61% 55-67% 367 161 42% 36-48%Retired 1574 1192 76% 73-78% 1421 783 56% 53-59% 1567 620 39% 36-41%Other 651 535 84% 81-87% 606 415 71% 66-75% 646 315 48% 44-53%
Household Income ** ** ^<$25,000 893 689 78% 75-81% 790 474 63% 59-67% 891 394 44% 41-48%$25,000-<$35,000 504 419 84% 80-87% 476 304 65% 60-70% 509 223 43% 38-48%$35,000-<$50,000 706 594 84% 80-87% 670 446 67% 63-71% 709 305 42% 37-46%$50,000-<$75,000 746 624 83% 80-86% 713 461 63% 58-67% 740 295 39% 35-44%$75,000 or greater 1314 1143 87% 85-89% 1278 824 65% 62-68% 1299 581 44% 41-47%Don't Know/Not Sure 216 162 77% 69-83% 190 109 58% 50-66% 206 92 45% 37-53%Refused 595 464 77% 73-81% 544 316 57% 52-62% 584 236 38% 33-42%
~ Some data missing for marital status, education, and employment status.** Statistically significant, p-value < 0.05.^ Not statistically significant, p-value > 0.05.
Maryland Cancer Survey, 2002

TABLE 9-2 CANCER SCREENING PRACTICES AND SELF-PERCEIVED RISK AND HEALTH STATUS
Selected characteristic N n wt% 95%CIStat Sig N n wt% 95%CI
Stat Sig N n wt% 95%CI
Stat Sig
Concerned about getting Cancer ^ ^ ^Very or somewhat concerned 2701 1565 58% 56-60% 2697 1609 59% 57-61% 970 755 75% 72-78%Not at all concerned 664 355 55% 51-60% 660 345 55% 51-59% 263 189 74% 68-80%
Believe his/her future risk of getting cancer is ^ ^ ^Low 1234 706 57% 54-61% 1227 698 57% 54-60% 472 362 75% 70-80%Medium or High 1887 1062 57% 54-59% 1886 1117 59% 57-62% 682 513 74% 70-78%
Believe the amount of cancer in her/his family is high ^ ** ^Low 1960 1132 58% 55-60% 1959 1094 56% 53-59% 781 604 76% 72-79%Medium or High 1387 783 57% 54-60% 1387 850 61% 58-64% 445 336 74% 69-79%
Self Perceived Health Status ^ ^ **Excellent or Very good 1610 944 59% 56-62% 1607 931 57% 54-60% 586 469 78% 73-82%Good 1117 631 57% 54-61% 1120 651 58% 55-62% 422 320 74% 69-79%Fair or Poor 680 372 54% 49-58% 671 397 61% 56-65% 240 167 69% 62-76%
People reporting to have ever had a fecal occult blood test~
People reporting to have ever had sigmoidoscopy or colonoscopy~
Men reporting to have ever had a prostatic specific antigen Test~
~ age 50 years and older~~ age 40 years and older# among women with a uterus** Statistically significant, p-value < 0.05.^ Not statistically significant, p-value > 0.05.
Maryland Cancer Survey, 2002

TABLE 9-2 CANCER SCREENING PRACTICES AND SELF-PERCEIVED RISK AND HEALTH STATUS
Selected characteristicConcerned about getting CancerVery or somewhat concernedNot at all concerned
Believe his/her future risk of getting cancer isLowMedium or High
Believe the amount of cancer in her/his family is highLowMedium or High
Self Perceived Health StatusExcellent or Very goodGoodFair or Poor
N n wt% 95%CIStat Sig N n wt% 95%CI
Stat Sig N n wt% 95%CI
Stat Sig
** ^ **2568 2426 94% 93-95% 1732 1699 98% 96-98% 3961 1779 44% 42-46%506 440 88% 85-91% 330 313 96% 93-97% 840 324 39% 35-43%
^ ^ **1046 964 92% 90-94% 707 683 96% 94-98% 1655 695 41% 38-44%1822 1708 94% 92-95% 1220 1198 98% 96-99% 2845 1296 45% 43-47%
^ ^ ^1648 1523 92% 91-94% 1127 1095 97% 95-98% 2701 1142 42% 40-44%1404 1322 94% 93-95% 918 900 98% 96-99% 2064 942 44% 42-47%
^ ** **1569 1468 93% 92-95% 1135 1112 98% 97-99% 2423 1178 47% 45-50%959 895 94% 92-95% 615 601 97% 95-98% 1555 644 41% 38-44%578 532 91% 88-94% 331 318 94% 90-97% 871 296 33% 30-37%
People reporting to have ever had oral cancer screening ~~
Women reporting to have ever had a Pap smear #~~
Women reporting to have ever had a mammogram~~
~ age 50 years and older~~ age 40 years and older# among women with a uterus** Statistically significant, p-value < 0.05.^ Not statistically significant, p-value > 0.05.
Maryland Cancer Survey, 2002

TABLE 9-3 SELF REPORTED HEALTH STATUS, AMONG THOSE AGE 40 YEARS AND OLDER
Selected Characteristic N n wt % 95% CI n wt % 95% CI n wt % 95% CI Stat SigTotal Population 5026 2518 50% 49-52% 1603 33% 31-34% 905 17% 16-19%
Gender ^Male 1915 948 50% 47-52% 642 34% 31-36% 325 17% 15-19%Female 3111 1570 51% 49-53% 961 32% 30-33% 580 18% 16-19%
Age **40-49 years 1602 902 55% 52-58% 477 31% 29-34% 223 14% 12-16%50-64 years 1930 980 51% 48-54% 612 32% 29-34% 338 17% 15-19%65 years and older 1494 636 42% 39-45% 514 35% 33-38% 344 23% 20-25%
Race **White 3844 2039 54% 52-56% 1151 30% 28-32% 654 16% 15-17%African American 978 373 38% 34-41% 391 41% 37-44% 214 22% 19-25%Other 204 106 57% 48-65% 61 29% 22-37% 37 14% 10-20%
Gender and Race **White Males 1506 773 52% 49-55% 479 32% 29-34% 254 16% 14-19%African American Males 331 137 40% 34-46% 135 41% 35-47% 59 20% 15-25%Other Males 78 38 58% 45-71% 28 32% 21-45% 12 10% 5-18%White Females 2338 1266 56% 53-58% 672 29% 27-31% 400 16% 14-17%African American Females 647 236 36% 32-40% 256 41% 37-45% 155 23% 20-27%Other Females 126 68 55% 44-66% 33 26% 18-37% 25 18% 12-28%
People reporting health status as excellent or
very good ~People reporting health
status as good ~People reporting health status as fair or poor ~
~ Some data missing for marital status, education, and employment status.** Statistically significant, p-value < 0.05.^ Not statistically significant, p-value > 0.05.
Maryland Cancer Survey, 2002

Chapter 10. Access to Health Care and Cancer Screening
Research that has examined the effects of insurance status on (perceived or actual) access to screening has shown that people who are uninsured and underinsured are less likely to be screened for cancer.1 In the MCS, we sought to determine whether access to health care and having health insurance was associated with higher levels of cancer screening. Analysis of the MCS shows that people with health insurance are more likely to have received cancer screening.
The MCS found 94% of Marylanders age 40 years and older have some form of health
insurance (Table 10-1). This did not vary significantly by urban or rural area of residence or gender. Those in the younger age group (age 40-49 years) were less likely to have insurance than those in the older age groups (50-64 years and 65 years and older) (90% vs. 94% and 99%). African Americans and people of “other” races were less likely to have health insurance. Health insurance status also varied by marital status, education, employment status, and income. People who were divorced or separated or never married, had less than a high school education, were self-employed or had employment status of “other,” or earned less than $50,000 per year were less likely to have health insurance. While the health insurance rate among Maryland residents is generally high, rates among subgroups of the population are not. Among Marylanders, who were age 40-49 years old and earned less than $25,000 annually, 68% of whites and African Americans had health insurance, compared to 42% of people of “other” races. Among those people 50-64 years of age earning less than $25,000 per year, 75% of whites had health insurance, 71% of African Americans had health insurance and 95% of people of “other” races reported having health insurance.
Having health insurance was significantly associated with screening. For each screening
test (FOBT, endoscopy, PSA, mammogram, Pap smear, and oral exam), those with health insurance had higher screening rates than those without (Table 10-2). The contrast between those with and without health insurance was sharpest for those who had ever had the PSA test (76% vs. 42%), sigmoidoscopy or colonoscopy (59% vs. 29%), and FOBT (59% vs. 32%).
People that currently have health insurance were asked if there was a time in the last 12
months when they did not have insurance. Only 3% of this group answered “yes” to that question (Table 10-3). (Because survey responses in some cells are very small, these estimates may be unstable. Only results for the total population are presented.) People in the younger age groups (40-49 years and 50-64 years) were more likely to have been without health insurance sometime in the last year than those 65 years and over, as were African American women. Those that were never married or divorced or separated, had employment status of “other”, or earned less than $25,000 annually were also more likely to have been without health insurance sometime in the last 12 months. The percentage of those screened was lower among those without health insurance sometime in the last 12 months, compared to those that had insurance throughout the year (Table 10-2). This difference was significant for all types of cancer screening, but oral cancer screening.
1 Swan, J et. al. Progress in cancer screening practices in the United States: Results from the 2000 National Health Interview Survey. Cancer. 2003 Mar 15;97(6):1528-40.

Ninety-two percent of Marylanders over 40 years have one (or more than one) person they think of as their primary health care provider (Table 10-4). This did not vary by area of residence or education level. The percentage was statistically significantly higher among women and increased with age. African American males and males of “other” races had the lowest proportions. People that were divorced, separated or never married, were self-employed or had employment status of “other,” or had annual incomes of less than $25,000 also had lower percentages of having a primary health care provider.
Those who reported that they have one or more than one person they think of as their
health care provider were statistically significantly more likely to be screened (Table 10-2). The percent difference was largest for those who reported ever having had a PSA test (77% vs. 47%), sigmoidoscopy or colonoscopy (60% vs. 32%), and FOBT (59% vs. 35%).
We sought to determine whether regular visits to a primary care provider were associated
with being screened for cancer. Those persons who reported having seen a provider for a routine examination more recently were statistically significantly more likely to have ever been screened (Table 10-2). Only 5% of Marylanders age 40 years and older reported there was a time in the last 12 months when health care was needed, but was not accessible (Table 10-3). (Because of small numbers and unstable estimates, only results for the total population are shown.) People age 40-64 years, African American women, and women of “other” races were more likely to report a time when health care was not accessible. People that were divorced, separated, or never married, had less than a high school education, had employment status of “other”, or had annual incomes less than $25,000 were also more likely to report less access to needed health care. People who reported less access were less likely to be screened for prostate, breast, cervical, and oral cancer (Table 10-2).
Increasing the proportion of people under age 65 that have health insurance and increasing the proportion of Americans that have a usual primary care provider are two goals in Healthy People 20102 (Chart 10-1). One goal is to increase the number of insured from a national baseline of 83% (National Health Interview Survey, 1997) to 100%. In 1999, the Maryland Health Care Commission reported that 12% of Maryland residents between the ages of 45-64 years were uninsured.3 In the MCS, 94% of people age 40-64 years reported having current health insurance (Chart 10-1). According to the Medical Expenditure Panel Survey, in 1996, 77% reported having a usual primary care provider. The goal of Healthy People 2010 is to increase this number to 85%. In Maryland, 92% of adults, age 40 years or older reported having at least one person they think of as their primary care provider. Our estimates for both having health insurance and having a primary care provider may be high, as we only interviewed people living in residences, and did not survey the non-English speaking population or people without telephones.
2 Healthy People 2010, US Department of Health and Human Services, 2000. 3 Wilson, D.E. Maryland Health Insurance Coverage Through 1999: A Graphic Profile. State of Maryland, Maryland Health Care Commission.

TABLE 10-1 PEOPLE REPORTING TO HAVE HEALTH INSURANCE, AMONG THOSE AGE 40 YEARS AND OLDER
Selected Characteristic N n wt % 95% CI Stat Sig N n wt % 95% CI Stat Sig N n wt % 95% CI Stat SigTotal Population 5033 4726 94% 93-94% 3400 3193 94% 92-94% 1633 1533 94% 92-95%
Gender ^ ^ ^Male 1919 1809 94% 92-95% 1297 1220 94% 92-95% 622 589 94% 92-96%Female 3114 2917 93% 92-94% 2103 1973 93% 92-95% 1011 944 93% 92-95%
Age ** ** **40-49 years 1603 1446 90% 88-92% 1115 1003 90% 87-92% 488 443 91% 87-93%50-64 years 1930 1796 94% 92-95% 1296 1208 94% 92-95% 634 588 94% 91-95%65 years and above 1500 1484 99% 98-99% 989 982 99% 98-100% 511 502 98% 97-99%
Race ** ** **White 3847 3662 95% 94-96% 2396 2290 95% 94-96% 1451 1372 95% 93-96%African American 979 876 90% 88-92% 848 760 90% 87-92% 131 116 90% 83-94%Other 207 188 89% 82-94% 156 143 90% 82-95% 51 45 83% 62-94%
Gender and Race ** ** ^White Males 1508 1438 95% 94-96% 947 903 95% 93-97% 561 535 95% 92-97%African American Males 332 299 90% 86-93% 291 262 90% 85-93% 41 37 91% 79-97%Other Males 79 72 91% 78-96% 59 55 91% 77-97% 20 17 88% 67-97%White Females 2339 2224 95% 94-96% 1449 1387 95% 94-97% 890 837 94% 93-96%African American Females 647 577 90% 87-92% 557 498 90% 87-92% 90 79 89% 80-94%Other Females 128 116 88% 78-94% 97 88 89% 77-95% 31 28 79% 44-95%
TOTAL ~ URBAN ~ RURAL ~
~ Some data missing for marital status, education, and employment status.** Statistically significant, p-value < 0.05.^ Not statistically significant, p-value > 0.05.
Maryland Cancer Survey, 2002

TABLE 10-1 PEOPLE REPORTING TO HAVE HEALTH INSURANCE, AMONG THOSE AGE 40 YEARS AND OLDER
Selected Characteristic N n wt % 95% CI Stat Sig N n wt % 95% CI Stat Sig N n wt % 95% CI Stat SigTOTAL ~ URBAN ~ RURAL ~
Marital Status ** ** **Married or partner of unmarried couple 2982 2860 96% 95-97% 1938 1865 96% 95-97% 1044 995 95% 94-97%Divorced or separated 848 742 86% 82-88% 609 536 86% 82-89% 239 206 85% 78-89%Widowed 803 776 97% 95-98% 526 512 97% 94-98% 277 264 96% 92-97%Never Married 379 327 84% 79-88% 311 264 83% 78-88% 68 63 93% 83-97%
Education ** ** **Less than high school 510 433 83% 79-87% 313 265 83% 77-87% 197 168 84% 77-89%High school grad or GED 1478 1368 92% 90-94% 874 806 92% 89-94% 604 562 94% 91-96%College 1-3 years 1131 1062 94% 92-95% 735 688 94% 91-95% 396 374 94% 91-96%College grad 1030 995 96% 94-97% 783 752 95% 93-97% 247 243 99% 97-100%Advanced degree 862 846 98% 97-99% 677 664 98% 97-99% 185 182 99% 96-100%
Employment Status ** ** **Employed for wages 2381 2279 96% 95-97% 1643 1573 96% 94-97% 738 706 96% 94-97%Self-employed 374 307 83% 78-87% 250 211 84% 78-89% 124 96 78% 69-85%Retired 1603 1576 98% 97-99% 1046 1028 98% 97-99% 557 548 98% 97-99%Other 658 547 82% 78-85% 447 367 81% 76-85% 211 180 85% 78-89%
Household Income ** ** **<$25,000 910 773 83% 79-86% 565 473 81% 77-85% 345 300 86% 81-90%$25,000-<$35,000 513 462 89% 85-92% 308 279 90% 85-93% 205 183 88% 81-92%$35,000-<$50,000 715 673 93% 91-95% 455 423 92% 88-95% 260 250 97% 94-99%$50,000-<$75,000 753 731 97% 95-98% 512 494 97% 94-98% 241 237 98% 94-100%$75,000 or greater 1319 1304 99% 98-99% 982 974 99% 99-100% 337 330 98% 95-99%Don't Know/Not Sure 220 203 90% 83-94% 136 122 88% 80-93% 84 81 95% 82-99%Refused 603 580 96% 94-98% 442 428 97% 94-98% 161 152 95% 90-97%
~ Some data missing for marital status, education, and employment status.** Statistically significant, p-value < 0.05.^ Not statistically significant, p-value > 0.05.
Maryland Cancer Survey, 2002

TABLE 10-2 ACCESS TO HEALTH CARE AND CANCER SCREENING PRACTICES, AMONG THOSE 40 YEARS AND OLDER
Selected characteristic N n wt% 95%CI Stat Sig N n wt% 95%CI Stat Sig N n wt% 95%CI Stat SigDo you have Health Insurance? ** ** **Yes 3262 1901 59% 57-61% 3253 1936 59% 57-61% 1196 937 76% 73-79%No 150 50 32% 24-41% 150 43 29% 21-38% 54 20 42% 28-57%
Was there a time you were without health insurance in the last 12 months? ** ** **Yes 66 26 39% 27-53% 66 29 39% 27-52% 23 10 46% 26-68%No 3193 1873 59% 57-61% 3184 1905 60% 58-62% 1172 926 77% 74-80%
Was there a time in the last 12 months when you needed medical care, but could not get it? ^ ^ **Yes 140 70 54% 44-63% 139 73 50% 41-60% 35 21 58% 39-76%No 3244 1869 58% 56-60% 3237 1892 59% 57-61% 1202 927 76% 73-78%
Do you have one (or more than one) person you think of as your primary health care provider? ** ** **Yes 3222 1885 59% 57-61% 3213 1919 60% 58-62% 1160 915 77% 74-80%No 187 65 35% 27-43% 189 61 32% 25-40% 87 40 47% 35-59%
How long has it been since you last visited a doctor for a routine checkup? ** ** **Within the past year (less than one year) 2913 1759 61% 59-63% 2907 1769 61% 59-63% 1016 826 79% 76-82%Within at least one year but less than two 223 98 44% 37-52% 224 107 48% 41-55% 107 71 66% 55-75%Within at least two years, but less than five 111 45 38% 28-48% 108 56 50% 40-61% 52 30 58% 43-72%Within five years or more 110 24 24% 15-34% 111 23 23% 15-33% 57 20 37% 24-52%
People reporting to have ever had a fecal occult blood test~
People reporting to have ever had sigmoidoscopy or colonoscopy~
Men reporting to have ever had a prostatic specific antigen Test~
~ age 50 years and older~~ age 40 years and older# among women with a uterus** Statistically significant, p-value < 0.05.^ Not statistically significant, p-value > 0.05.
Maryland Cancer Survey, 2002

TABLE 10-2 ACCESS TO HEALTH CARE AND CANCER SCREENING PRACTICES, AMONG THOSE 40 YEARS AND OLDER
Selected characteristicDo you have Health Insurance?YesNo
Was there a time you were without health insurance in the last 12 months?YesNo
Was there a time in the last 12 months when you needed medical care, but could not get it?YesNo
Do you have one (or more than one) person you think of as your primary health care provider?YesNo
How long has it been since you last visited a doctor for a routine checkup?Within the past year (less than one year)Within at least one year but less than two Within at least two years, but less than fiveWithin five years or more
N n wt% 95%CI Stat Sig N n wt% 95%CI Stat Sig N n wt% 95%CI Stat Sig** ** **
2912 2745 94% 93-95% 1927 1891 98% 97-99% 4553 2055 44% 43-46%196 151 75% 67-82% 156 142 89% 82-94% 301 63 18% 14-24%
** ** ^84 76 86% 73-94% 60 57 91% 72-98% 124 45 39% 30-49%
2825 2666 95% 94-95% 1865 1832 98% 97-99% 4425 2010 45% 43-46%
** ** **189 171 88% 80-93% 137 129 93% 84-97% 255 90 32% 26-39%
2903 2710 93% 92-94% 1935 1894 98% 97-98% 4565 2012 43% 42-45%
** ** **2922 2751 94% 93-95% 1931 1891 98% 97-98% 4493 2015 44% 42-46%186 147 78% 71-85% 150 140 92% 86-96% 356 104 29% 24-35%
** ** **
2619 2479 95% 94-96% 1700 1669 98% 97-99% 3929 1757 44% 42-46%
229 213 92% 87-95% 171 170 99% 94-100% 420 180 46% 40-51%
105 86 82% 72-89% 88 83 93% 82-97% 208 78 32% 25-39%110 77 69% 57-78% 91 82 89% 76-95% 220 66 29% 22-36%
Women reporting to have ever had a mammogram~~
Women reporting to have ever had a Pap smear #~~
People reporting to have ever had oral cancer screening~~
~ age 50 years and older~~ age 40 years and older# among women with a uterus** Statistically significant, p-value < 0.05.^ Not statistically significant, p-value > 0.05.
Maryland Cancer Survey, 2002

TABLE 10-3 FACTORS AFFECTING HEALTHCARE ACCESS, AMONG THOSE AGE 40 AND ABOVE
Selected Characteristic N n wt % 95% CI Stat Sig N n wt % 95% CI Stat SigTotal Population 4721 131 3% 2-3% 4998 264 5% 5-6%
Gender ^ **Male 1808 46 2% 2-3% 1901 73 4% 3-5%Female 2913 85 3% 2-4% 3097 191 7% 6-8%
Age ** **40-49 years 1445 65 4% 3-6% 1596 123 8% 6-9%50-64 years 1795 50 3% 2-4% 1913 111 6% 5-7%65 years and above 1481 16 1% 1-2% 1489 30 2% 1-3%
Race ** **White 3659 81 2% 2-3% 3826 162 4% 4-5%African American 874 45 4% 3-6% 965 87 9% 7-11%Other 188 5 3% 1-7% 207 15 7% 4-14%
Gender and Race ** **White Males 1437 36 2% 2-3% 1499 53 4% 3-5%African American Males 299 9 2% 1-5% 323 19 6% 4-10%Other Males 72 1 2% 0-15% 79 1 1% 0-6%White Females 2222 45 2% 2-3% 2327 109 5% 4-6%African American Females 575 36 6% 4-9% 642 68 10% 8-13%Other Females 116 4 3% 1-8% 128 14 13% 7-24%
Marital Status ** **Married or partner of unmarried couple 2857 57 2% 1-3% 2960 116 4% 3-5%Divorced or separated 741 37 5% 4-8% 845 78 10% 8-12%Widowed 775 17 2% 1-4% 801 28 3% 2-5%Never Married 327 19 7% 4-11% 376 42 12% 8-16%Education ^ **Less than high school 431 19 5% 3-8% 503 62 13% 10-17%High school grad or GED 1367 43 3% 2-4% 1468 86 6% 5-8%College 1-3 years 1060 29 3% 2-5% 1127 49 4% 3-6%College grad 995 27 3% 2-4% 1025 42 4% 3-6%Advanced degree 846 13 2% 1-3% 862 24 3% 2-4%
Employment Status ** **Employed for wages 2279 62 3% 2-4% 2371 108 4% 4-5%Self-employed 306 15 4% 2-7% 373 27 7% 4-10%Retired 1574 18 1% 1-2% 1592 41 3% 2-4%Other 546 36 7% 5-10% 653 87 14% 11-18%
Household Income ** **<$25,000 771 44 6% 4-8% 906 110 14% 11-17%$25,000-<$35,000 462 11 3% 1-5% 511 34 6% 4-9%$35,000-<$50,000 673 28 5% 3-7% 714 34 5% 4-7%$50,000-<$75,000 730 18 3% 2-5% 752 17 2% 1-4%$75,000 or greater 1304 14 1% 0-2% 1317 30 2% 1-3%Don't Know/Not Sure 202 7 3% 1-8% 219 17 10% 5-16%Refused 579 9 1% 1-3% 579 22 4% 2-6%
People reporting there was a time they were without health insurance sometime
in the last 12 months ~
People reporting there was a time in the last 12 months they needed healthcare
but could not get it ~
~ Some data missing for marital status, education, employment status, and income.** Statistically significant, p-value < 0.05.^ Not statistically significant, p-value > 0.05.
Maryland Cancer Survey, 2002

TABLE 10-4 PEOPLE REPORTING TO HAVE ONE, OR MORE THAN ONE, PERSON THEY THINK OF AS THEIR PRIMARY HEALTH CARE PROVIDER, AMONG THOSE 40 YEARS AND OLDER
Selected Characteristic N n wt % 95% CI Stat Sig N n wt % 95% CI Stat Sig N n wt % 95% CI Stat SigTotal Population 5027 4660 92% 91-93% 3397 3143 92% 91-93% 1630 1517 93% 92-95%
Gender ** ** **Male 1914 1736 90% 89-92% 1294 1171 90% 88-92% 620 565 91% 89-94%Female 3113 2924 94% 93-95% 2103 1972 94% 93-95% 1010 952 95% 93-96%
Age ** ** **40-49 years 1601 1423 88% 86-90% 1114 978 87% 85-90% 487 445 91% 87-93%50-64 years 1928 1790 93% 92-95% 1295 1211 94% 92-95% 633 579 93% 90-95%65 years and above 1498 1447 97% 96-98% 988 954 97% 95-98% 510 493 97% 95-98%
Race ** ^ **White 3845 3594 93% 92-94% 2395 2237 93% 92-94% 1450 1357 94% 92-95%African American 976 878 90% 88-92% 847 763 90% 88-92% 129 115 88% 79-94%Other 206 188 90% 83-95% 155 143 91% 83-95% 51 45 87% 72-94%
Gender and Race ** ** **White Males 1506 1390 92% 90-94% 946 872 92% 89-94% 560 518 93% 90-95%African American Males 330 279 86% 81-89% 290 247 86% 81-90% 40 32 82% 65-91%Other Males 78 67 86% 73-94% 58 52 87% 72-95% 20 15 76% 51-91%White Females 2339 2204 94% 93-95% 1449 1365 94% 93-95% 890 839 95% 93-96%African American Females 646 599 93% 91-95% 557 516 93% 91-95% 89 83 94% 86-98%Other Females 128 121 94% 86-97% 97 91 94% 86-97% 31 30 96% 77-99%
TOTAL ~ URBAN ~ RURAL ~
~ Some data missing for marital status, education, and employment status.** Statistically significant, p-value < 0.05.^ Not statistically significant, p-value 0.05.>
Maryland Cancer Survey, 2002

TABLE 10-4 PEOPLE REPORTING TO HAVE ONE, OR MORE THAN ONE, PERSON THEY THINK OF AS THEIR PRIMARY HEALTH CARE PROVIDER, AMONG THOSE 40 YEARS AND OLDER
Selected Characteristic N n wt % 95% CI Stat Sig N n wt % 95% CI Stat Sig N n wt % 95% CI Stat SigTOTAL ~ URBAN ~ RURAL ~
Marital Status ** ** **Married or partner of unmarried couple 2979 2802 94% 93-95% 1937 1819 94% 92-95% 1042 983 95% 93-96%Divorced or separated 844 755 88% 85-90% 606 545 88% 85-91% 238 210 87% 80-91%Widowed 803 762 95% 92-96% 527 501 95% 92-96% 276 261 95% 92-97%Never Married 380 321 83% 78-87% 312 263 83% 77-87% 68 58 84% 71-92%
Education ^ ^ ^Less than high school 507 459 90% 86-93% 313 279 89% 84-92% 194 180 93% 89-96%High school grad or GED 1477 1360 92% 90-94% 873 800 92% 89-93% 604 560 93% 90-95%College 1-3 years 1131 1059 93% 91-94% 735 686 92% 90-94% 396 373 94% 90-96%College grad 1031 953 92% 90-94% 784 723 92% 89-94% 247 230 93% 88-96%Advanced degree 861 810 94% 92-96% 676 639 94% 92-96% 185 171 93% 87-96%
Employment Status ** ** **Employed for wages 2379 2200 92% 91-93% 1644 1511 92% 90-93% 735 689 94% 92-96%Self-employed 373 327 88% 84-91% 248 220 89% 84-93% 125 107 85% 75-91%Retired 1602 1529 96% 95-97% 1046 1001 96% 94-97% 556 528 96% 94-97%Other 657 589 88% 85-91% 446 398 88% 83-91% 211 191 91% 85-94%
Household Income ** ** ^<$25,000 909 805 88% 85-90% 565 497 87% 84-90% 344 308 90% 86-93%$25,000-<$35,000 511 477 93% 89-95% 307 287 93% 89-96% 204 190 92% 86-96%$35,000-<$50,000 715 671 94% 91-95% 455 421 93% 90-95% 260 250 97% 94-98%$50,000-<$75,000 753 697 93% 90-94% 512 471 92% 89-94% 241 226 94% 90-97%$75,000 or greater 1320 1244 94% 92-95% 983 929 94% 92-96% 337 315 93% 89-96%Don't Know/Not Sure 217 202 90% 82-94% 134 121 87% 78-93% 83 81 96% 82-99%Refused 602 564 93% 90-95% 441 417 93% 89-96% 161 147 92% 86-95%
~ Some data missing for marital status, education, and employment status.** Statistically significant, p-value < 0.05.^ Not statistically significant, p-value 0.05.>
Maryland Cancer Survey, 2002

Chart 10-1 Comparison of the results of the Maryland Cancer Survey, 2002 to National baselines and Healthy People 2010 target values; proportion of adults under the age of 65 years that have health insurance and the proportion of adults that have a usual primary care physician.
94%100%
83%77%
85%92%
0%
20%
40%
60%
80%
100%
NHIS(1997)
2010Target
MCS2000
MEPS (1996)
2010Target
MCS2000
People under age 65 with HealthInsurance
People with a Primary CareProvider
perc
ent
MEPS-Medical Expenditure Panel Survey NHIS-National Health Interview Survey 2010 Target-Healthy People 2010 MCS, 2002-Maryland Cancer Survey, 2002

Chapter 11. Lifestyle Factors and Cancer Screening
Physical activity and dietary habits are among the leading health indicators used by Healthy People 2010 to measure the health of the nation, and they are major health concerns in the United States. One of the Healthy People 2010 dietary goals is to increase the consumption of fruits and vegetables. With respect to physical activity, two Healthy People 2010 goals are (1) to increase to 30% the proportion of adults who engage regularly, preferably daily, in moderate physical activity for at least 30 minutes per day, and (2) to increase to 30% the proportion of adults who engage in vigorous physical activity three or more days per week for at least 20 minutes per occasion.1 Healthy People 2010 has also set goals for increasing the proportion of people who are at a healthy weight and for decreasing the number of adults, age 18 years and older, who smoke cigarettes.
Thirty-nine percent of Marylanders age 40 years and older reported that a doctor or other
health care provider had recommended that they begin or continue with exercise/physical activity (Table 11-1). No significant differences were found by race or employment status, among those who reported that their health care provider had recommended exercise/physical activity. A significantly greater percentage of women than men reported that physical activity had been recommended (41% vs. 37%). Significant differences were also seen by age, marital status, education, and income. More people age 50-64 years reported getting this recommendation from their provider than those in either the older or younger age groups. Those widowed reported the lowest percentage of providers recommending physical activity while those married or the partner of an unmarried couple reported the greatest. Provider recommendations also increased with increasing level of education. Those with incomes of $75,000 or more reported a significantly greater percentage of provider recommendations than those with lower incomes.
When asked if a health care provider had talked with them about diet or eating habits,
38% of Marylanders answered “yes” (Table 11-1). No significant differences for having a health care provider talk about diet were found by gender, marital status, education, employment status, or income. A significantly greater number of people age 50-64 years reported that a health care provider had talked with them about diet than those in either the younger or older age groups. Significantly more African Americans (43%) reported that diet was discussed with them than did either white Marylanders (37%) or those of “other” races (39%).
Only 15% of Marylanders reported eating five or more fruits and vegetables per day
(Table 11-1). A significant difference for those reporting that they eat five or more fruits and vegetables per day was found with respect to all of the demographic characteristics. More women than men reported eating five or more per day (20% vs. 10%). Fewer people age 40-49 years reported eating five or more a day than those age 50 years and older. Only 10% of African Americans reported eating five or more per day compared to 17% of whites and 19% of people from “other” races. Over 26% of “other” females and 22% of white females reported eating five or more a day compared to 11% of African American females. Males of any race had values similar to those reported by African American women (10-11%). As education level increased so did the percentage of individuals who said they ate five or more servings per day. The lowest percentage of those who ate five or more per day was among those divorced or separated (13%)
1 Healthy People 2010, US Department of Health and Human Services, 2002

compared to the highest among those widowed (18%). Eating five or more per day increased with increasing income.
Thirty-seven percent of Marylanders reported that they did vigorous physical activity at
least three times per week for 20 minutes or more (Table 11-2). Significant differences were found between vigorous physical activity and all demographic characteristics. The percentage of those who reported doing vigorous activity declined with increasing age from 46% in the youngest group to 27% in those 65 and over. More men than women reported doing vigorous activity (44% vs. 32%). African American women reported the least amount of vigorous physical activity. More married people or partners of an unmarried couple reported vigorous activity (41%) than those with any other marital status. The percentage that reported vigorous physical activity increased with increasing level of education and with increasing income. A higher percentage (51%) of self-employed individuals reported doing vigorous physical activity than those employed for wages, retired, or those who had an employment status of “other.”
In a second question about moderate physical activity for at least thirty minutes per day,
32% reported moderate activity 3-4 days per week and 33% reported moderate activity 5 or more days per week (Table 11-3). The percentage that reported doing no moderate physical activity increased with increasing age. More African Americans reported no moderate activity compared to whites and people of “other” races (22% vs. 13% and 12%). More of those people who were widowed than those of any other marital status reported they did not engage in moderate activity. People employed for wages or self-employed had lower proportions who engaged in no moderate physical activity compared to those who were retired or had an employment status of “other” (11%, 9% vs. 20%, 23%). As income and education level increased, the percentage reporting no moderate activity decreased.
When Marylanders who did not engage in vigorous or moderate physical activity 3 or
more days per week were asked the reason why they were not physically active, 33% reported a lack of motivation, 32% said it was because of a physical disability or “other” health limitation, and 27% reported lack of time. No place to exercise and cost were reported much less frequently. Forty-nine percent of those 65 and older who were not physically active stated this was due to physical disability or “other” health limitations.
Decreasing the percentage of Americans who are overweight or obese is among the leading health indicators used by HP 2010. Healthy people 2010 objectives are to increase the proportion of adults (20 years and older) who are at a healthy weight (as defined by a Body Mass Index (BMI) of 18.5 to less than 25) from 42% (US baseline) to 60% and to reduce the proportion of adults who are obese (BMI of 30 or greater) from 23% (US baseline) to 15%.1
Based on reported height and weight, 36% of Marylanders had a BMI in the “normal”
range (18.5-<25), 4% had a BMI less than 18.5, 35% had a BMI in the “overweight” range (25 to < 30) and 25% of Marylanders had a BMI in the “obese” range (≥ 30) (Table 11-4). This indicates that 60% of Marylanders are considered to be overweight or obese. Significant differences were found between BMI and all of the demographic characteristics. More women than men had a BMI of less than 18.5 and a BMI 18.5-<25 (normal range), while more men than women had BMI 25-<30 (overweight range); 25% of men and 26% of women reporting being
obese. Fewer people age 50-64 years had BMI in the normal range (18.5-<25) than those who were either younger or older. African Americans had a greater percentage with a BMI in the obese range than did either whites or those of “other” races (38%, 22%, and 15%). African Americans also had a smaller percentage in the normal BMI range compared to whites and those of “other” race (24%, vs. 40%, 45%). Fewer African American males and females and white males had BMI in the normal range compared to white females or those of “other” races. African American females had the greatest percentage with a BMI of 30 or greater (44%) while men and women of “other” races had the smallest percentage of obesity (15%, 14%). With regard to marital status, the highest percentage of obese Marylanders was found among those who were never married (32%). Those who had a college education or greater were more likely to be of normal weight and less likely to be obese than those Marylanders with less than a college degree. Fewer of those whose employment status was “other” were considered to be overweight. Obesity declined with increasing income.
Physical activity, diet, and BMI were examined in relation to each of the cancer
screening questions (Table 11-5). Those that performed vigorous physical activity were significantly more likely to have ever had oral cancer screening. No significant differences were found for vigorous activity and any of the other cancer screening questions. No significant differences were found for ever having an FOBT, endoscopy, or DRE and the number of days per week people reported performing moderate physical activity. As the number of days per week people exercised moderately increased so did the percentage of those who had ever had an oral screening exam. Significantly more people who had exercise/physical activity recommended by a provider in the past year had screenings than those whose providers did not recommend physical activity, with the exception of those who were ever screened with DRE or CBE.
For FOBT, endoscopy, mammogram, clinical breast exam (CBE), Pap smear, and oral
cancer screening, those who consumed a higher number of fruit and vegetable servings per day were more likely to have ever been screened. There was no difference in the percentage who ever had PSA testing or DRE with respect to fruit and vegetable servings per day.
Significantly more of those people whose providers had talked with them about their
eating habits reported they had ever had an FOBT, endoscopy, mammogram, or Pap smear compared to those whose providers had never discussed their eating habits with them.
Body mass index had little association with ever having been screened for most of the
cancer screening modalities. Only CBE and oral cancer screening show a significant difference in the percentage screened and BMI. The percentage screened decreased as BMI increased to 30 or greater. In general BMI does not appear to have an effect on whether or not people are screened for a variety of cancers.
Tobacco use is also among the leading health indicators targeted by Healthy People 2010.
The Healthy People 2010 goal is to reduce the proportion of adult smokers (persons 18 years and older) to 12% from the US 1998 baseline of 24%.1 Eighteen percent of Marylanders, age 40 years and older report that they currently smoke, 33% smoked in the past, and 48% never smoked (Table 11-6). Significant differences were found between smoking status and all of the

demographic characteristics. More women than men reported never smoking (55% vs. 40%), while more men smoked in the past or currently smoke. Only 7% of those age 65 years and older currently smoke compared to 24% of those 40-49 years and 20% of those 50-64 years. However, those age 65 years and older had the greatest percentage reporting being a previous smoker (43%) compared to those in the younger age groups. Those of “other” races had the largest percent of never smokers (65% vs. 47% for both whites and African Americans). The largest proportion of current smokers was found among African American males (27%) while the smallest proportion was found among “other” females (11%). Current smokers were more likely to be divorced, separated, or never married. As education level increased so did the percent of those who never smoked; the percent of those who currently smoke declined with increasing education level. The greatest percentage of current smokers was found among those with “other” employment status (27%), while only 12% of retirees were current smokers; however, the highest percentage of previous smokers was found among retirees (42%).
When smoking status was examined in relation to the various types of cancer screening,
no difference was found in the percent of those screened in relation to smoking status for CBE (Table 11-7). For all of the other screening modalities, including oral cancer screening, current smokers were significantly less likely to be screened than Marylanders who smoked in the past or had never smoked.

TABLE 11-1 PHYSICAL ACTIVITY AND DIET RECOMMENDATIONS, AMONG THOSE AGE 40 YEARS AND OLDER
Selected Characteristic N n wt % 95% CI Stat Sig N n wt % 95% CI Stat Sig N n wt % 95% CI Stat SigTotal Population 4865 1905 39% 38-41% 4866 1864 38% 37-40% 4820 781 15% 14-17%
Gender ** ^ **Male 1833 673 37% 35-40% 1833 725 40% 37-42% 1835 186 10% 9-12%Female 3032 1232 41% 39-43% 3033 1139 37% 35-39% 2985 595 20% 18-21%
Age ** ** **40-49 years 1541 574 37% 34-40% 1539 563 37% 34-40% 1555 223 13% 12-15%50-64 years 1861 800 43% 40-46% 1859 779 41% 39-44% 1856 318 17% 15-19%65 years and above 1463 531 38% 35-41% 1468 522 36% 33-39% 1409 240 17% 15-19%
Race ^ ** **White 3720 1415 38% 37-40% 3722 1361 37% 35-39% 3706 636 17% 15-18%African American 946 400 41% 37-45% 947 423 43% 39-46% 920 102 10% 8-13%Other 199 90 44% 36-53% 197 80 39% 31-48% 194 43 19% 14-26%
Gender and Race ^ ** **White Males 1440 526 37% 35-40% 1440 562 39% 37-42% 1449 146 11% 9-12%African American Males 316 115 37% 31-43% 316 125 39% 33-46% 310 30 10% 7-14%Other Males 77 32 39% 27-53% 77 38 45% 32-59% 76 10 11% 6-21%White Females 2280 889 39% 37-42% 2282 799 35% 32-37% 2257 490 22% 20-24%African American Females 630 285 44% 40-49% 631 298 45% 41-50% 610 72 11% 8-14%Other Females 122 58 49% 38-60% 120 42 33% 24-45% 118 33 26% 18-37%
People reporting a doctor or other health care professional recommend that they begin or continue exercise or physical
activity ~
People reporting a doctor or health care professional had talked with them about
diet or eating habits ~People reporting they eat 5 or more fruits
and vegetables per day ~
~ Some data missing for marital status, education, and employment status.** Statistically significant, p-value < 0.05.^ Not statistically significant, p-value > 0.05.
Maryland Cancer Survey, 2002

TABLE 11-1 PHYSICAL ACTIVITY AND DIET RECOMMENDATIONS, AMONG THOSE AGE 40 YEARS AND OLDER
Selected Characteristic N n wt % 95% CI Stat Sig N n wt % 95% CI Stat Sig N n wt % 95% CI Stat Sig
People reporting a doctor or other health care professional recommend that they begin or continue exercise or physical
activity ~
People reporting a doctor or health care professional had talked with them about
diet or eating habits ~People reporting they eat 5 or more fruits
and vegetables per day ~
Marital Status ** ^ **Married or partner of unmarried couple 2887 1175 41% 39-43% 2886 1103 39% 37-41% 2882 482 16% 14-17%Divorced or separated 816 316 38% 34-42% 822 325 39% 35-43% 817 112 13% 10-15%Widowed 786 263 32% 29-36% 784 285 36% 32-40% 752 127 18% 15-21%Never Married 361 149 40% 34-46% 358 147 39% 33-45% 354 59 14% 11-19%
Education ** ^ **Less than high school 483 171 35% 30-40% 484 199 41% 36-46% 471 44 9% 7-13%High school grad or GED 1427 501 36% 33-39% 1425 548 38% 35-41% 1398 159 10% 9-12%College 1-3 years 1100 443 40% 37-44% 1103 426 39% 36-42% 1091 178 16% 13-18%College grad 1004 409 41% 38-45% 1000 357 36% 33-40% 1002 184 17% 15-20%Advanced degree 839 377 43% 40-47% 842 328 39% 35-43% 847 214 24% 21-27%
Employment Status ^ ^ **Employed for wages 2305 941 40% 38-43% 2309 883 38% 36-41% 2310 360 15% 13-16%Self-employed 352 112 32% 27-38% 346 124 38% 32-44% 363 66 18% 14-23%Retired 1564 592 39% 36-42% 1568 599 38% 35-41% 1515 248 16% 14-18%Other 635 259 40% 35-44% 633 256 39% 35-44% 622 105 17% 13-20%
Household Income ** ^ **<$25,000 865 317 37% 33-41% 868 355 41% 37-45% 857 117 13% 11-16%$25,000-<$35,000 500 190 39% 34-44% 500 204 42% 37-48% 493 67 12% 9-15%$35,000-<$50,000 695 243 34% 30-39% 697 250 36% 32-41% 693 93 12% 10-15%$50,000-<$75,000 735 287 37% 33-41% 735 271 35% 32-40% 735 124 16% 13-19%$75,000 or greater 1291 589 45% 42-48% 1289 500 39% 36-42% 1304 263 19% 17-22%Don't Know/Not Sure 207 71 37% 30-46% 206 76 32% 25-39% 194 37 19% 14-27%Refused 572 208 38% 34-43% 571 208 37% 33-42% 544 80 14% 11-17%
~ Some data missing for marital status, education, and employment status.** Statistically significant, p-value < 0.05.^ Not statistically significant, p-value > 0.05.
Maryland Cancer Survey, 2002

TABLE 11-2 DEMOGRAPHIC CHARACTERISTICS AND ENGAGING IN VIGOROUS PHYSICAL ACTIVITY THREE OR MORE DAYS PER WEEK, AMONG THOSE AGE 40 YEARS AND OLDER
Selected Characteristic N n wt % 95% CI Stat SigTotal Population 4966 1795 37% 36-39%
Gender **Male 1890 838 44% 42-47%Female 3076 957 32% 30-34%
Age **40-49 years 1591 712 46% 43-49%50-64 years 1900 679 36% 34-39%65 years and above 1475 404 27% 24-29%
Race **White 3797 1423 39% 37-41%African American 965 296 32% 29-36%Other 204 76 41% 32-50%
Gender and Race **White Males 1488 664 44% 41-47%African American Males 324 140 44% 38-50%Other Males 78 34 47% 33-61%White Females 2309 759 34% 32-36%African American Females 641 156 23% 20-27%Other Females 126 42 36% 26-47%
Marital Status **Married or partner of unmarried couple 2940 1182 41% 39-43%Divorced or separated 844 287 34% 30-38%Widowed 792 194 24% 21-28%Never Married 373 127 34% 29-40%
Education **Less than high school 501 118 24% 20-29%High school grad or GED 1453 475 35% 32-38%College 1-3 years 1121 366 33% 30-36%College grad 1022 436 43% 40-47%Advanced degree 856 395 48% 44-52%
Employment Status **Employed for wages 2355 961 42% 39-44%Self-employed 370 182 51% 45-57%Retired 1579 468 30% 27-32%Other 652 180 30% 26-35%
Household Income **<$25,000 900 227 25% 22-29%$25,000-<$35,000 509 143 30% 25-35%$35,000-<$50,000 706 258 36% 32-40%$50,000-<$75,000 749 300 43% 39-48%$75,000 or greater 1311 600 46% 43-49%Don't Know/Not Sure 214 61 29% 22-36%Refused 577 206 36% 31-40%
People reporting they engage in vigorous physical activity for 3 or more days per week for 20 or more
minutes per occasion? ~
~ Some data missing for marital status, education, and employment status.** Statistically significant, p-value < 0.05.^ Not statistically significant, p-value > 0.05.
Maryland Cancer Survey, 2002

TABLE 11-3 DEMOGRAPHIC CHARACTERISTICS AND LEVEL OF MODERATE PHYSICAL ACTIVITY, AMONG THOSE AGE 40 YEARS AND ABOVE
Selected Characteristic N n wt % 95% CI n wt % 95% CI n wt % 95% CI n wt % 95% CI Stat SigTotal Population 4867 748 15% 14-16% 922 19% 18-21% 1564 32% 31-34% 1633 33% 31-35%
Gender **Male 1860 251 14% 12-16% 363 20% 18-23% 576 31% 29-34% 670 35% 32-37%Female 3007 497 16% 15-18% 559 19% 17-20% 988 34% 32-36% 963 31% 29-33%
Age **40-49 years 1575 178 11% 10-13% 325 20% 18-23% 544 35% 32-37% 528 34% 31-36%50-64 years 1880 267 15% 13-17% 388 22% 19-24% 600 32% 29-34% 625 32% 30-34%65 years and above 1412 303 22% 19-24% 209 15% 13-17% 420 30% 27-33% 480 33% 31-36%
Race **White 3725 512 13% 12-14% 695 19% 18-21% 1227 33% 32-35% 1291 34% 32-36%African American 941 207 22% 19-26% 186 20% 17-23% 282 30% 27-33% 266 28% 25-32%Other 201 29 12% 8-18% 41 21% 15-29% 55 31% 23-40% 76 37% 29-45%
Gender and Race **White Males 1465 183 12% 11-14% 290 21% 18-23% 461 32% 29-34% 531 35% 32-38%African American Males 318 63 21% 16-26% 55 18% 13-23% 95 29% 24-35% 105 32% 27-38%Other Males 77 5 4% 2-11% 18 25% 15-40% 20 30% 18-46% 34 40% 28-54%White Females 2260 329 14% 12-15% 405 18% 16-20% 766 35% 33-37% 760 33% 31-36%African American Females 623 144 23% 20-27% 131 21% 18-25% 187 30% 26-35% 161 25% 22-29%Other Females 124 24 19% 12-29% 23 16% 11-25% 35 31% 22-42% 42 33% 24-45%
People reporting they engage in moderate
physical activity for at least 30 minutes a day, 5-
7 days per week ~
People reporting they do not engage in moderate physical activity for at
least 30 minutes a day ~
People reporting they engage in moderate
physical activity for at least 30 minutes a day, 1-
2 days per week ~
People reporting they nngage in moderate
physical activity for at least 30 minutes a day, 3-
4 days per week ~
~ Some data missing for marital status, education, and employment status.** Statistically significant, p-value < 0.05.^ Not statistically significant, p-value > 0.05.
Maryland Cancer Survey, 2002
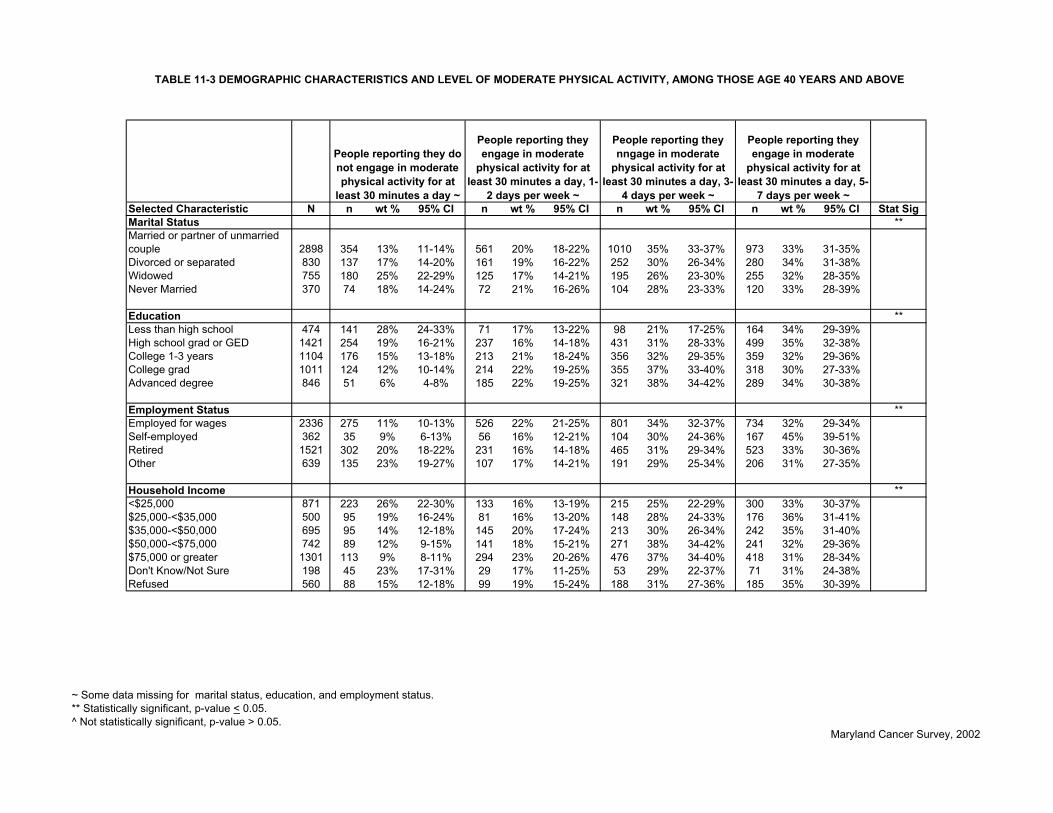
TABLE 11-3 DEMOGRAPHIC CHARACTERISTICS AND LEVEL OF MODERATE PHYSICAL ACTIVITY, AMONG THOSE AGE 40 YEARS AND ABOVE
Selected Characteristic N n wt % 95% CI n wt % 95% CI n wt % 95% CI n wt % 95% CI Stat Sig
People reporting they engage in moderate
physical activity for at least 30 minutes a day, 5-
7 days per week ~
People reporting they do not engage in moderate physical activity for at
least 30 minutes a day ~
People reporting they engage in moderate
physical activity for at least 30 minutes a day, 1-
2 days per week ~
People reporting they nngage in moderate
physical activity for at least 30 minutes a day, 3-
4 days per week ~
Marital Status **Married or partner of unmarried couple 2898 354 13% 11-14% 561 20% 18-22% 1010 35% 33-37% 973 33% 31-35%Divorced or separated 830 137 17% 14-20% 161 19% 16-22% 252 30% 26-34% 280 34% 31-38%Widowed 755 180 25% 22-29% 125 17% 14-21% 195 26% 23-30% 255 32% 28-35%Never Married 370 74 18% 14-24% 72 21% 16-26% 104 28% 23-33% 120 33% 28-39%
Education **Less than high school 474 141 28% 24-33% 71 17% 13-22% 98 21% 17-25% 164 34% 29-39%High school grad or GED 1421 254 19% 16-21% 237 16% 14-18% 431 31% 28-33% 499 35% 32-38%College 1-3 years 1104 176 15% 13-18% 213 21% 18-24% 356 32% 29-35% 359 32% 29-36%College grad 1011 124 12% 10-14% 214 22% 19-25% 355 37% 33-40% 318 30% 27-33%Advanced degree 846 51 6% 4-8% 185 22% 19-25% 321 38% 34-42% 289 34% 30-38%
Employment Status **Employed for wages 2336 275 11% 10-13% 526 22% 21-25% 801 34% 32-37% 734 32% 29-34%Self-employed 362 35 9% 6-13% 56 16% 12-21% 104 30% 24-36% 167 45% 39-51%Retired 1521 302 20% 18-22% 231 16% 14-18% 465 31% 29-34% 523 33% 30-36%Other 639 135 23% 19-27% 107 17% 14-21% 191 29% 25-34% 206 31% 27-35%
Household Income **<$25,000 871 223 26% 22-30% 133 16% 13-19% 215 25% 22-29% 300 33% 30-37%$25,000-<$35,000 500 95 19% 16-24% 81 16% 13-20% 148 28% 24-33% 176 36% 31-41%$35,000-<$50,000 695 95 14% 12-18% 145 20% 17-24% 213 30% 26-34% 242 35% 31-40%$50,000-<$75,000 742 89 12% 9-15% 141 18% 15-21% 271 38% 34-42% 241 32% 29-36%$75,000 or greater 1301 113 9% 8-11% 294 23% 20-26% 476 37% 34-40% 418 31% 28-34%Don't Know/Not Sure 198 45 23% 17-31% 29 17% 11-25% 53 29% 22-37% 71 31% 24-38%Refused 560 88 15% 12-18% 99 19% 15-24% 188 31% 27-36% 185 35% 30-39%
~ Some data missing for marital status, education, and employment status.** Statistically significant, p-value < 0.05.^ Not statistically significant, p-value > 0.05.
Maryland Cancer Survey, 2002

TABLE 11-4 BODY MASS INDEX BY DEMOGRAPHIC FACTORS
Selected Characteristic N n wt % 95% CI n wt % 95% CI n wt % 95% CI n wt % 95% CI Stat SigTotal Population 4813 171 4% 4-Mar 1769 36% 35-38 1678 35% 33-36% 1195 25% 24-27%
Gender **Male 1882 29 2% 1-3% 587 32% 29-34% 789 41% 39-44% 477 25% 23-28%Female 2931 142 5% 4-6% 1182 40% 38-42% 889 29% 27-31% 718 26% 24-27%
Age **40-49 years 1547 58 4% 3-5% 593 38% 35-41% 516 33% 30-36% 380 25% 23-28%50-64 years 1818 53 3% 2-4% 597 32% 30-35% 651 36% 34-39% 517 28% 26-31%65 years and above 1448 60 4% 3-6% 579 39% 37-42% 511 35% 32-38% 298 21% 19-24%
Race **White 3686 136 4% 3-4% 1456 40% 38-41% 1290 34% 33-36% 804 22% 21-24%African American 933 18 2% 1-4% 228 24% 21-27% 328 36% 32-40% 359 38% 34-41%Other 194 17 7% 4-13% 85 45% 36-54% 60 33% 25-42% 32 15% 9-22%
Gender and Race **White Males 1483 22 2% 1-3% 481 33% 30-36% 618 41% 38-44% 362 24% 22-27%African American Males 323 2 7% 1-5% 76 25% 20-31% 141 43% 37-49% 101 30% 25-36%Other Males 76 2 2% 0-9% 30 40% 27-55% 30 43% 29-57% 14 15% 8-27%White Females 2203 114 6% 5-7% 975 46% 43-48% 672 29% 27-31% 442 20% 18-22%African American Females 610 13 3% 2-5% 152 23% 20-27% 187 30% 26-34% 258 44% 39-48%Other Females 118 15 12% 7-21% 55 49% 38-60% 30 25% 17-35% 18 14% 7-25%
BMI 18.5 < 25 BMI 25 to < 30 BMI > 30BMI < 18.5
~ Some data missing for marital status, education, and employment status.** Statistically significant, p-value < 0.05.^ Not statistically significant, p-value > 0.05.
Maryland Cancer Survey, 2002

TABLE 11-4 BODY MASS INDEX BY DEMOGRAPHIC FACTORS
Selected Characteristic N n wt % 95% CI n wt % 95% CI n wt % 95% CI n wt % 95% CI Stat SigBMI 18.5 < 25 BMI 25 to < 30 BMI > 30BMI < 18.5
Marital Status **Married or partner of unmarried couple 2834 92 3% 3-4% 1030 36% 34-38% 1038 36% 34-38% 674 24% 22-26%Divorced or separated 820 24 3% 2-4% 294 35% 31-39% 285 35% 32-39% 217 27% 23-31%Widowed 787 38 5% 4-7% 310 38% 35-42% 250 30% 27-34% 189 26% 23-30%Never Married 358 15 5% 3-9% 129 36% 30-42% 99 27% 22-33% 115 32% 26-38%
Education **Less than high school 495 19 4% 2-6% 155 30% 26-35% 155 33% 28-38% 166 33% 29-38%High school grad or GED 1412 45 3% 2-5% 462 33% 30-36% 495 34% 31-37% 410 29% 27-32%College 1-3 years 1078 33 3% 2-5% 370 33% 30-37% 395 35% 32-39% 280 28% 25-31%College grad 991 46 5% 4-7% 417 41% 37-45% 334 34% 31-37% 194 20% 17-23%Advanced degree 829 27 3% 2-4% 360 43% 39-47% 298 37% 34-41% 144 17% 15-21%
Employment Status **Employed for wages 2283 63 3% 2-4% 833 36% 34-38% 810 36% 34-39% 577 25% 23-27%Self-employed 357 15 5% 3-8% 129 35% 29-41% 130 36% 30-42% 83 25% 20-31%Retired 1551 56 4% 3-5% 586 37% 34-40% 559 35% 33-38% 350 24% 22-27%Other 616 36 6% 4-8% 218 37% 33-42% 177 28% 24-32% 185 29% 25-34%
Household Income **<$25,000 880 24 2% 2-4% 282 31% 28-35% 300 33% 30-37% 274 33% 29-37%$25,000-<$35,000 502 19 4% 2-7% 159 31% 27-36% 185 36% 32-41% 139 28% 24-33%$35,000-<$50,000 701 20 3% 2-5% 246 35% 31-40% 250 34% 30-38% 185 28% 24-32%$50,000-<$75,000 731 13 2% 1-3% 280 38% 34-42% 257 36% 32-40% 181 25% 21-28%$75,000 or greater 1277 47 4% 3-6% 511 39% 36-42% 453 36% 33-39% 266 21% 19-24%Don't Know/Not Sure 209 14 6% 4-10% 87 42% 34-50% 70 34% 26-42% 38 19% 13-26%Refused 513 34 7% 5-10% 204 38% 34-43% 163 32% 28-37% 112 23% 19-27%
~ Some data missing for marital status, education, and employment status.** Statistically significant, p-value < 0.05.^ Not statistically significant, p-value > 0.05.
Maryland Cancer Survey, 2002

TABLE 11-5 PHYSICAL ACTIVITY, DIET, AND CANCER SCREENING PRACTICES
Selected characteristic N n wt% 95%CI Stat Sig N n wt% 95%CI Stat Sig N n wt% 95%CI Stat Sig N n wt% 95%CI Stat SigDo you engage in vigorous physical activity for 3 or more days per week for 20 or more minutes per occasion? ^ ^ ^ ^Yes 1079 623 59% 55-62% 1077 641 60% 56-63% 497 392 78% 73-82% 506 450 90% 87-93%No 2277 1301 57% 55-60% 2272 1319 58% 56-60% 729 548 74% 70-77% 754 665 89% 86-91%In a typical 7 day week, how many days do you engage in moderate physical activity for at least 30 minutes a day? ^ ^ ** ^0 days/week 566 308 55% 50-59% 563 303 55% 50-60% 183 128 68% 60-76% 189 162 87% 81-91%1-2 days/week 594 349 57% 52-61% 593 353 58% 53-62% 226 177 76% 69-82% 234 211 91% 86-94%3-4 days/week 1016 598 60% 57-64% 1017 630 62% 59-66% 364 295 81% 75-85% 370 334 92% 89-95%5 -7 days/week 1101 633 58% 55-61% 1097 629 58% 54-61% 430 321 73% 67-77% 443 388 87% 83-91%Has a doctor or other HCP recommended that you begin or continue any type of exercise or physical activity in the past year? ** ** ** ^Yes 1325 848 65% 62-68% 1326 844 64% 61-67% 462 387 83% 79-87% 475 432 91% 88-94%No 1982 1063 53% 51-56% 1974 1103 56% 53-58% 740 544 71% 67-75% 762 666 88% 86-91%How many total servings of fruits and vegetables do you eat each day? ** ** ^ ^0-2 1510 780 52% 50-55% 1501 829 56% 53-59% 692 515 75% 71-78% 712 620 88% 85-90%3-4 fruits/vegetables /day 1180 739 63% 59-66% 1184 713 59% 56-63% 378 315 80% 74-85% 389 356 92% 89-95%5 or more 557 360 66% 61-70% 555 361 65% 60-69% 121 92 68% 57-77% 125 114 93% 86-96%Has a doctor or other HCP talked with you about your diet and eating habits in the past year? ** ** ^ ^Yes 1298 809 63% 59-66% 1289 800 62% 59-65% 483 384 79% 74-83% 498 448 91% 88-93%No 2011 1104 55% 53-58% 2013 1149 57% 55-60% 719 549 75% 71-78% 738 650 89% 86-91%Body Mass Index ^ ^ ^ ^< 18.5 113 68 59% 49-69% 111 62 58% 47-68% 19 13 68% 41-87% 20 19 97% 79-100%18.5-<25 1168 681 58% 55-62% 1170 697 60% 57-63% 379 297 76% 70-81% 385 345 90% 86-93%25-<30 1156 674 59% 55-62% 1154 679 58% 55-62% 517 409 77% 72-81% 529 476 91% 87-93%> 30 811 433 54% 50-58% 807 453 57% 53-61% 308 217 71% 65-76% 323 274 87% 83-91%
People reporting to have ever had a fecal occult blood test~
People reporting to have ever had sigmoidoscopy or colonoscopy~
Men reporting to have ever had a prostatic specific antigen test~ Men reporting to have ever had DRE~
~ Reported for people age 50 years and older~~ Reported for people age 40 years and older** Statistically significant with P-value of < 0.05.^ Not statistically significant with a P-value greater than 0.05.
Maryland Cancer Survey, 2002

TABLE 11-5 PHYSICAL ACTIVITY, DIET, AND CANCER SCREENING PRACTICES
Selected characteristicDo you engage in vigorous physical activity for 3 or more days per week for 20 or more minutes per occasion?YesNoIn a typical 7 day week, how many days do you engage in moderate physical activity for at least 30 minutes a day?0 days/week1-2 days/week3-4 days/week5 -7 days/weekHas a doctor or other HCP recommended that you begin or continue any type of exercise or physical activity in the past year?YesNoHow many total servings of fruits and vegetables do you eat each day?0-23-4 fruits/vegetables /day5 or moreHas a doctor or other HCP talked with you about your diet and eating habits in the past year?YesNoBody Mass Index < 18.518.5-<2525-<30> 30
N n wt% 95%CI Stat Sig N n wt% 95%CI Stat Sig N n wt% 95%CI Stat Sig N n wt% 95%CI Stat Sig
^ ^ ^ **957 898 94% 91-95% 954 916 96% 94-97% 692 681 98% 96-99% 1738 842 47% 44-50%2113 1965 93% 92-94% 2113 1974 94% 92-95% 1362 1326 97% 95-98% 3053 1247 40% 38-42%
** ** ** **496 451 90% 87-93% 495 442 90% 86-92% 299 284 94% 90-97% 712 240 32% 29-36%558 517 92% 89-94% 557 533 95% 92-97% 373 364 97% 93-99% 891 392 43% 39-46%987 949 97% 95-98% 987 957 98% 96-98% 671 664 99% 97-99% 1516 730 47% 44-50%963 883 92% 90-93% 962 901 94% 91-95% 680 665 98% 96-99% 1577 698 44% 41-46%
** ^ ** **1232 1182 96% 95-97% 1231 1172 95% 93-96% 801 793 98% 97-99% 1831 866 46% 43-49%1795 1649 92% 90-93% 1793 1679 94% 92-95% 1218 1182 96% 95-97% 2861 1192 41% 39-43%
** ** ** **1219 1112 91% 88-92% 1217 1135 93% 91-95% 816 788 95% 93-97% 2224 831 37% 34-39%1167 1096 94% 92-95% 1164 1097 94% 93-96% 787 777 99% 98-100% 1676 790 46% 43-49%595 571 96% 94-98% 595 572 97% 95-98% 399 395 99% 97-100% 754 422 56% 52-60%
** ^ ** ^1139 1084 95% 93-96% 1139 1080 94% 92-96% 718 713 99% 98-100% 1801 794 44% 41-47%1888 1749 93% 91-94% 1885 1773 94% 93-95% 1299 1262 97% 95-98% 2891 1263 42% 40-44%
^ ** ^ **141 127 91% 84-95% 142 131 92% 85-95% 110 104 95% 89-98% 165 78 44% 36-53%1180 1090 92% 90-94% 1179 1113 95% 94-96% 852 830 97% 95-98% 1699 816 47% 44-50%887 830 93% 91-95% 886 841 96% 94-97% 566 556 98% 97-99% 1619 676 40% 38-43%718 677 94% 92-96% 716 664 92% 89-94% 432 423 97% 94-99% 1160 439 38% 35-42%
Women reporting to have ever had a mammogram
Women reporting to have ever had a clinical breast exam
Women reporting to have ever had a Pap smear #~~
People reporting to have ever had oral cancer screening
~ Reported for people age 50 years and older~~ Reported for people age 40 years and older** Statistically significant with P-value of < 0.05.^ Not statistically significant with a P-value greater than 0.05.
Maryland Cancer Survey, 2002

TABLE 11-6 SMOKING STATUS AND DEMOGRAPHIC CHARACTERISTICS, AMONG THOSE AGE 40 YEARS AND OLDER
Selected Characteristic N n wt % 95% CI n wt % 95% CI n wt % 95% CI Stat SigTotal Population 4946 2405 48% 47-50% 1680 33% 32-35% 861 18% 17-20%
Gender **Male 1883 758 40% 38-43% 775 39% 37-42% 350 20% 18-23%Female 3063 1647 55% 53-57% 905 28% 27-30% 511 17% 15-18%
Age **40-49 years 1585 794 50% 48-53% 416 26% 23-29% 375 24% 21-26%50-64 years 1898 877 45% 42-48% 647 35% 32-37% 374 20% 18-23%65 years and above 1463 734 50% 47-53% 617 43% 40-46% 112 7% 6-9%
Race **White 3788 1813 47% 46-49% 1345 36% 34-38% 630 17% 16-18%African American 956 465 47% 44-51% 287 29% 26-33% 204 24% 20-27%Other 202 127 65% 56-73% 48 22% 16-30% 27 13% 8-20%
Gender and Race **White Males 1482 603 41% 38-44% 621 40% 38-43% 258 19% 16-21%African American Males 324 117 36% 30-42% 125 37% 31-43% 82 27% 22-33%Other Males 77 38 51% 38-65% 29 34% 22-48% 10 15% 7-28%White Females 2306 1210 53% 51-55% 724 32% 30-34% 372 15% 14-17%African American Females 632 348 56% 52-61% 162 23% 20-27% 122 21% 17-25%Other Females 125 89 77% 67-85% 19 12% 7-20% 17 11% 6-19%
Never Smoked ~ Previous Smoker ~ Current Smoker ~
~ Some data missing for marital status, education, and employment status.** Statistically significant, p-value < 0.05.^ Not statistically significant, p-value > 0.05.
Maryland Cancer Survey, 2002

TABLE 11-6 SMOKING STATUS AND DEMOGRAPHIC CHARACTERISTICS, AMONG THOSE AGE 40 YEARS AND OLDER
Selected Characteristic N n wt % 95% CI n wt % 95% CI n wt % 95% CI Stat SigNever Smoked ~ Previous Smoker ~ Current Smoker ~
Marital Status **Married or partner of unmarried couple 2937 1484 50% 48-52% 1030 35% 33-37% 423 15% 14-17%Divorced or separated 835 344 39% 36-43% 274 31% 27-35% 217 30% 26-34%Widowed 788 387 50% 46-54% 284 35% 31-39% 117 15% 12-18%Never Married 371 182 47% 41-53% 88 22% 18-28% 101 31% 25-37%
Education **Less than high school 494 188 36% 31-41% 162 31% 26-35% 144 34% 29-39%High school grad or GED 1453 644 42% 39-45% 484 33% 30-36% 325 25% 22-27%College 1-3 years 1119 514 46% 42-49% 401 36% 33-40% 204 18% 15-21%College grad 1014 577 58% 55-62% 324 30% 27-33% 113 12% 9-14%Advanced degree 854 478 57% 53-60% 304 36% 32-39% 72 8% 6-10%
Employment Status **Employed for wages 2348 1190 50% 48-53% 695 30% 27-32% 463 20% 18-22%Self-employed 368 163 45% 39-52% 141 40% 34-46% 64 15% 11-19%Retired 1573 742 46% 43-49% 667 42% 39-45% 164 12% 10-14%Other 647 304 47% 43-52% 176 26% 23-30% 167 27% 23-31%
Household Income **<$25,000 897 398 44% 40-48% 284 29% 26-33% 215 27% 23-31%$25,000-<$35,000 504 233 46% 41-51% 160 31% 27-36% 111 23% 19-27%$35,000-<$50,000 702 333 45% 40-49% 228 33% 29-37% 141 23% 19-27%$50,000-<$75,000 750 351 46% 42-50% 277 38% 34-42% 122 16% 13-19%$75,000 or greater 1313 683 52% 49-55% 457 34% 31-37% 173 14% 12-16%Don't Know/Not Sure 211 111 52% 44-60% 72 34% 27-42% 28 14% 9-20%Refused 569 296 54% 49-59% 202 35% 30-39% 71 11% 9-15%
~ Some data missing for marital status, education, and employment status.** Statistically significant, p-value < 0.05.^ Not statistically significant, p-value > 0.05.
Maryland Cancer Survey, 2002

TABLE 11-1 PHYSICAL ACTIVITY AND DIET RECOMMENDATIONS, AMONG THOSE AGE 40 YEARS AND OLDER
Selected Characteristic N n wt % 95% CI Stat Sig N n wt % 95% CI Stat Sig N n wt % 95% CI Stat SigTotal Population 4865 1905 39% 38-41% 4866 1864 38% 37-40% 4820 781 15% 14-17%
Gender ** ^ **Male 1833 673 37% 35-40% 1833 725 40% 37-42% 1835 186 10% 9-12%Female 3032 1232 41% 39-43% 3033 1139 37% 35-39% 2985 595 20% 18-21%
Age ** ** **40-49 years 1541 574 37% 34-40% 1539 563 37% 34-40% 1555 223 13% 12-15%50-64 years 1861 800 43% 40-46% 1859 779 41% 39-44% 1856 318 17% 15-19%65 years and above 1463 531 38% 35-41% 1468 522 36% 33-39% 1409 240 17% 15-19%
Race ^ ** **White 3720 1415 38% 37-40% 3722 1361 37% 35-39% 3706 636 17% 15-18%African American 946 400 41% 37-45% 947 423 43% 39-46% 920 102 10% 8-13%Other 199 90 44% 36-53% 197 80 39% 31-48% 194 43 19% 14-26%
Gender and Race ^ ** **White Males 1440 526 37% 35-40% 1440 562 39% 37-42% 1449 146 11% 9-12%African American Males 316 115 37% 31-43% 316 125 39% 33-46% 310 30 10% 7-14%Other Males 77 32 39% 27-53% 77 38 45% 32-59% 76 10 11% 6-21%White Females 2280 889 39% 37-42% 2282 799 35% 32-37% 2257 490 22% 20-24%African American Females 630 285 44% 40-49% 631 298 45% 41-50% 610 72 11% 8-14%Other Females 122 58 49% 38-60% 120 42 33% 24-45% 118 33 26% 18-37%
People reporting a doctor or other health care professional recommend that they begin or continue exercise or physical
activity ~
People reporting a doctor or health care professional had talked with them about
diet or eating habits ~People reporting they eat 5 or more fruits
and vegetables per day ~
~ Some data missing for marital status, education, and employment status.** Statistically significant, p-value < 0.05.^ Not statistically significant, p-value > 0.05.
Maryland Cancer Survey, 2002

TABLE 11-1 PHYSICAL ACTIVITY AND DIET RECOMMENDATIONS, AMONG THOSE AGE 40 YEARS AND OLDER
Selected Characteristic N n wt % 95% CI Stat Sig N n wt % 95% CI Stat Sig N n wt % 95% CI Stat Sig
People reporting a doctor or other health care professional recommend that they begin or continue exercise or physical
activity ~
People reporting a doctor or health care professional had talked with them about
diet or eating habits ~People reporting they eat 5 or more fruits
and vegetables per day ~
Marital Status ** ^ **Married or partner of unmarried couple 2887 1175 41% 39-43% 2886 1103 39% 37-41% 2882 482 16% 14-17%Divorced or separated 816 316 38% 34-42% 822 325 39% 35-43% 817 112 13% 10-15%Widowed 786 263 32% 29-36% 784 285 36% 32-40% 752 127 18% 15-21%Never Married 361 149 40% 34-46% 358 147 39% 33-45% 354 59 14% 11-19%
Education ** ^ **Less than high school 483 171 35% 30-40% 484 199 41% 36-46% 471 44 9% 7-13%High school grad or GED 1427 501 36% 33-39% 1425 548 38% 35-41% 1398 159 10% 9-12%College 1-3 years 1100 443 40% 37-44% 1103 426 39% 36-42% 1091 178 16% 13-18%College grad 1004 409 41% 38-45% 1000 357 36% 33-40% 1002 184 17% 15-20%Advanced degree 839 377 43% 40-47% 842 328 39% 35-43% 847 214 24% 21-27%
Employment Status ^ ^ **Employed for wages 2305 941 40% 38-43% 2309 883 38% 36-41% 2310 360 15% 13-16%Self-employed 352 112 32% 27-38% 346 124 38% 32-44% 363 66 18% 14-23%Retired 1564 592 39% 36-42% 1568 599 38% 35-41% 1515 248 16% 14-18%Other 635 259 40% 35-44% 633 256 39% 35-44% 622 105 17% 13-20%
Household Income ** ^ **<$25,000 865 317 37% 33-41% 868 355 41% 37-45% 857 117 13% 11-16%$25,000-<$35,000 500 190 39% 34-44% 500 204 42% 37-48% 493 67 12% 9-15%$35,000-<$50,000 695 243 34% 30-39% 697 250 36% 32-41% 693 93 12% 10-15%$50,000-<$75,000 735 287 37% 33-41% 735 271 35% 32-40% 735 124 16% 13-19%$75,000 or greater 1291 589 45% 42-48% 1289 500 39% 36-42% 1304 263 19% 17-22%Don't Know/Not Sure 207 71 37% 30-46% 206 76 32% 25-39% 194 37 19% 14-27%Refused 572 208 38% 34-43% 571 208 37% 33-42% 544 80 14% 11-17%
~ Some data missing for marital status, education, and employment status.** Statistically significant, p-value < 0.05.^ Not statistically significant, p-value > 0.05.
Maryland Cancer Survey, 2002

TABLE 11-3 DEMOGRAPHIC CHARACTERISTICS AND LEVEL OF MODERATE PHYSICAL ACTIVITY, AMONG THOSE AGE 40 YEARS AND ABOVE
Selected Characteristic N n wt % 95% CI n wt % 95% CI n wt % 95% CI n wt % 95% CI Stat SigTotal Population 4867 748 15% 14-16% 922 19% 18-21% 1564 32% 31-34% 1633 33% 31-35%
Gender **Male 1860 251 14% 12-16% 363 20% 18-23% 576 31% 29-34% 670 35% 32-37%Female 3007 497 16% 15-18% 559 19% 17-20% 988 34% 32-36% 963 31% 29-33%
Age **40-49 years 1575 178 11% 10-13% 325 20% 18-23% 544 35% 32-37% 528 34% 31-36%50-64 years 1880 267 15% 13-17% 388 22% 19-24% 600 32% 29-34% 625 32% 30-34%65 years and above 1412 303 22% 19-24% 209 15% 13-17% 420 30% 27-33% 480 33% 31-36%
Race **White 3725 512 13% 12-14% 695 19% 18-21% 1227 33% 32-35% 1291 34% 32-36%African American 941 207 22% 19-26% 186 20% 17-23% 282 30% 27-33% 266 28% 25-32%Other 201 29 12% 8-18% 41 21% 15-29% 55 31% 23-40% 76 37% 29-45%
Gender and Race **White Males 1465 183 12% 11-14% 290 21% 18-23% 461 32% 29-34% 531 35% 32-38%African American Males 318 63 21% 16-26% 55 18% 13-23% 95 29% 24-35% 105 32% 27-38%Other Males 77 5 4% 2-11% 18 25% 15-40% 20 30% 18-46% 34 40% 28-54%White Females 2260 329 14% 12-15% 405 18% 16-20% 766 35% 33-37% 760 33% 31-36%African American Females 623 144 23% 20-27% 131 21% 18-25% 187 30% 26-35% 161 25% 22-29%Other Females 124 24 19% 12-29% 23 16% 11-25% 35 31% 22-42% 42 33% 24-45%
People reporting they engage in moderate
physical activity for at least 30 minutes a day, 5-
7 days per week ~
People reporting they do not engage in moderate physical activity for at
least 30 minutes a day ~
People reporting they engage in moderate
physical activity for at least 30 minutes a day, 1-
2 days per week ~
People reporting they nngage in moderate
physical activity for at least 30 minutes a day, 3-
4 days per week ~
~ Some data missing for marital status, education, and employment status.** Statistically significant, p-value < 0.05.^ Not statistically significant, p-value > 0.05.
Maryland Cancer Survey, 2002

TABLE 11-3 DEMOGRAPHIC CHARACTERISTICS AND LEVEL OF MODERATE PHYSICAL ACTIVITY, AMONG THOSE AGE 40 YEARS AND ABOVE
Selected Characteristic N n wt % 95% CI n wt % 95% CI n wt % 95% CI n wt % 95% CI Stat Sig
People reporting they engage in moderate
physical activity for at least 30 minutes a day, 5-
7 days per week ~
People reporting they do not engage in moderate physical activity for at
least 30 minutes a day ~
People reporting they engage in moderate
physical activity for at least 30 minutes a day, 1-
2 days per week ~
People reporting they nngage in moderate
physical activity for at least 30 minutes a day, 3-
4 days per week ~
Marital Status **Married or partner of unmarried couple 2898 354 13% 11-14% 561 20% 18-22% 1010 35% 33-37% 973 33% 31-35%Divorced or separated 830 137 17% 14-20% 161 19% 16-22% 252 30% 26-34% 280 34% 31-38%Widowed 755 180 25% 22-29% 125 17% 14-21% 195 26% 23-30% 255 32% 28-35%Never Married 370 74 18% 14-24% 72 21% 16-26% 104 28% 23-33% 120 33% 28-39%
Education **Less than high school 474 141 28% 24-33% 71 17% 13-22% 98 21% 17-25% 164 34% 29-39%High school grad or GED 1421 254 19% 16-21% 237 16% 14-18% 431 31% 28-33% 499 35% 32-38%College 1-3 years 1104 176 15% 13-18% 213 21% 18-24% 356 32% 29-35% 359 32% 29-36%College grad 1011 124 12% 10-14% 214 22% 19-25% 355 37% 33-40% 318 30% 27-33%Advanced degree 846 51 6% 4-8% 185 22% 19-25% 321 38% 34-42% 289 34% 30-38%
Employment Status **Employed for wages 2336 275 11% 10-13% 526 22% 21-25% 801 34% 32-37% 734 32% 29-34%Self-employed 362 35 9% 6-13% 56 16% 12-21% 104 30% 24-36% 167 45% 39-51%Retired 1521 302 20% 18-22% 231 16% 14-18% 465 31% 29-34% 523 33% 30-36%Other 639 135 23% 19-27% 107 17% 14-21% 191 29% 25-34% 206 31% 27-35%
Household Income **<$25,000 871 223 26% 22-30% 133 16% 13-19% 215 25% 22-29% 300 33% 30-37%$25,000-<$35,000 500 95 19% 16-24% 81 16% 13-20% 148 28% 24-33% 176 36% 31-41%$35,000-<$50,000 695 95 14% 12-18% 145 20% 17-24% 213 30% 26-34% 242 35% 31-40%$50,000-<$75,000 742 89 12% 9-15% 141 18% 15-21% 271 38% 34-42% 241 32% 29-36%$75,000 or greater 1301 113 9% 8-11% 294 23% 20-26% 476 37% 34-40% 418 31% 28-34%Don't Know/Not Sure 198 45 23% 17-31% 29 17% 11-25% 53 29% 22-37% 71 31% 24-38%Refused 560 88 15% 12-18% 99 19% 15-24% 188 31% 27-36% 185 35% 30-39%
~ Some data missing for marital status, education, and employment status.** Statistically significant, p-value < 0.05.^ Not statistically significant, p-value > 0.05.
Maryland Cancer Survey, 2002

TABLE 11-4 BODY MASS INDEX BY DEMOGRAPHIC FACTORS
Selected Characteristic N n wt % 95% CI n wt % 95% CI n wt % 95% CI n wt % 95% CI Stat SigTotal Population 4813 171 4% 4-Mar 1769 36% 35-38 1678 35% 33-36% 1195 25% 24-27%
Gender **Male 1882 29 2% 1-3% 587 32% 29-34% 789 41% 39-44% 477 25% 23-28%Female 2931 142 5% 4-6% 1182 40% 38-42% 889 29% 27-31% 718 26% 24-27%
Age **40-49 years 1547 58 4% 3-5% 593 38% 35-41% 516 33% 30-36% 380 25% 23-28%50-64 years 1818 53 3% 2-4% 597 32% 30-35% 651 36% 34-39% 517 28% 26-31%65 years and above 1448 60 4% 3-6% 579 39% 37-42% 511 35% 32-38% 298 21% 19-24%
Race **White 3686 136 4% 3-4% 1456 40% 38-41% 1290 34% 33-36% 804 22% 21-24%African American 933 18 2% 1-4% 228 24% 21-27% 328 36% 32-40% 359 38% 34-41%Other 194 17 7% 4-13% 85 45% 36-54% 60 33% 25-42% 32 15% 9-22%
Gender and Race **White Males 1483 22 2% 1-3% 481 33% 30-36% 618 41% 38-44% 362 24% 22-27%African American Males 323 2 7% 1-5% 76 25% 20-31% 141 43% 37-49% 101 30% 25-36%Other Males 76 2 2% 0-9% 30 40% 27-55% 30 43% 29-57% 14 15% 8-27%White Females 2203 114 6% 5-7% 975 46% 43-48% 672 29% 27-31% 442 20% 18-22%African American Females 610 13 3% 2-5% 152 23% 20-27% 187 30% 26-34% 258 44% 39-48%Other Females 118 15 12% 7-21% 55 49% 38-60% 30 25% 17-35% 18 14% 7-25%
BMI 18.5 < 25 BMI 25 to < 30 BMI > 30BMI < 18.5
~ Some data missing for marital status, education, and employment status.** Statistically significant, p-value < 0.05.^ Not statistically significant, p-value > 0.05.
Maryland Cancer Survey, 2002

TABLE 11-4 BODY MASS INDEX BY DEMOGRAPHIC FACTORS
Selected Characteristic N n wt % 95% CI n wt % 95% CI n wt % 95% CI n wt % 95% CI Stat SigBMI 18.5 < 25 BMI 25 to < 30 BMI > 30BMI < 18.5
Marital Status **Married or partner of unmarried couple 2834 92 3% 3-4% 1030 36% 34-38% 1038 36% 34-38% 674 24% 22-26%Divorced or separated 820 24 3% 2-4% 294 35% 31-39% 285 35% 32-39% 217 27% 23-31%Widowed 787 38 5% 4-7% 310 38% 35-42% 250 30% 27-34% 189 26% 23-30%Never Married 358 15 5% 3-9% 129 36% 30-42% 99 27% 22-33% 115 32% 26-38%
Education **Less than high school 495 19 4% 2-6% 155 30% 26-35% 155 33% 28-38% 166 33% 29-38%High school grad or GED 1412 45 3% 2-5% 462 33% 30-36% 495 34% 31-37% 410 29% 27-32%College 1-3 years 1078 33 3% 2-5% 370 33% 30-37% 395 35% 32-39% 280 28% 25-31%College grad 991 46 5% 4-7% 417 41% 37-45% 334 34% 31-37% 194 20% 17-23%Advanced degree 829 27 3% 2-4% 360 43% 39-47% 298 37% 34-41% 144 17% 15-21%
Employment Status **Employed for wages 2283 63 3% 2-4% 833 36% 34-38% 810 36% 34-39% 577 25% 23-27%Self-employed 357 15 5% 3-8% 129 35% 29-41% 130 36% 30-42% 83 25% 20-31%Retired 1551 56 4% 3-5% 586 37% 34-40% 559 35% 33-38% 350 24% 22-27%Other 616 36 6% 4-8% 218 37% 33-42% 177 28% 24-32% 185 29% 25-34%
Household Income **<$25,000 880 24 2% 2-4% 282 31% 28-35% 300 33% 30-37% 274 33% 29-37%$25,000-<$35,000 502 19 4% 2-7% 159 31% 27-36% 185 36% 32-41% 139 28% 24-33%$35,000-<$50,000 701 20 3% 2-5% 246 35% 31-40% 250 34% 30-38% 185 28% 24-32%$50,000-<$75,000 731 13 2% 1-3% 280 38% 34-42% 257 36% 32-40% 181 25% 21-28%$75,000 or greater 1277 47 4% 3-6% 511 39% 36-42% 453 36% 33-39% 266 21% 19-24%Don't Know/Not Sure 209 14 6% 4-10% 87 42% 34-50% 70 34% 26-42% 38 19% 13-26%Refused 513 34 7% 5-10% 204 38% 34-43% 163 32% 28-37% 112 23% 19-27%
~ Some data missing for marital status, education, and employment status.** Statistically significant, p-value < 0.05.^ Not statistically significant, p-value > 0.05.
Maryland Cancer Survey, 2002

TABLE 11-5 PHYSICAL ACTIVITY, DIET, AND CANCER SCREENING PRACTICES
Selected characteristic N n wt% 95%CI Stat Sig N n wt% 95%CI Stat Sig N n wt% 95%CI Stat Sig N n wt% 95%CI Stat SigDo you engage in vigorous physical activity for 3 or more days per week for 20 or more minutes per occasion? ^ ^ ^ ^Yes 1079 623 59% 55-62% 1077 641 60% 56-63% 497 392 78% 73-82% 506 450 90% 87-93%No 2277 1301 57% 55-60% 2272 1319 58% 56-60% 729 548 74% 70-77% 754 665 89% 86-91%In a typical 7 day week, how many days do you engage in moderate physical activity for at least 30 minutes a day? ^ ^ ** ^0 days/week 566 308 55% 50-59% 563 303 55% 50-60% 183 128 68% 60-76% 189 162 87% 81-91%1-2 days/week 594 349 57% 52-61% 593 353 58% 53-62% 226 177 76% 69-82% 234 211 91% 86-94%3-4 days/week 1016 598 60% 57-64% 1017 630 62% 59-66% 364 295 81% 75-85% 370 334 92% 89-95%5 -7 days/week 1101 633 58% 55-61% 1097 629 58% 54-61% 430 321 73% 67-77% 443 388 87% 83-91%Has a doctor or other HCP recommended that you begin or continue any type of exercise or physical activity in the past year? ** ** ** ^Yes 1325 848 65% 62-68% 1326 844 64% 61-67% 462 387 83% 79-87% 475 432 91% 88-94%No 1982 1063 53% 51-56% 1974 1103 56% 53-58% 740 544 71% 67-75% 762 666 88% 86-91%How many total servings of fruits and vegetables do you eat each day? ** ** ^ ^0-2 1510 780 52% 50-55% 1501 829 56% 53-59% 692 515 75% 71-78% 712 620 88% 85-90%3-4 fruits/vegetables /day 1180 739 63% 59-66% 1184 713 59% 56-63% 378 315 80% 74-85% 389 356 92% 89-95%5 or more 557 360 66% 61-70% 555 361 65% 60-69% 121 92 68% 57-77% 125 114 93% 86-96%Has a doctor or other HCP talked with you about your diet and eating habits in the past year? ** ** ^ ^Yes 1298 809 63% 59-66% 1289 800 62% 59-65% 483 384 79% 74-83% 498 448 91% 88-93%No 2011 1104 55% 53-58% 2013 1149 57% 55-60% 719 549 75% 71-78% 738 650 89% 86-91%Body Mass Index ^ ^ ^ ^< 18.5 113 68 59% 49-69% 111 62 58% 47-68% 19 13 68% 41-87% 20 19 97% 79-100%18.5-<25 1168 681 58% 55-62% 1170 697 60% 57-63% 379 297 76% 70-81% 385 345 90% 86-93%25-<30 1156 674 59% 55-62% 1154 679 58% 55-62% 517 409 77% 72-81% 529 476 91% 87-93%> 30 811 433 54% 50-58% 807 453 57% 53-61% 308 217 71% 65-76% 323 274 87% 83-91%
People reporting to have ever had a fecal occult blood test~
People reporting to have ever had sigmoidoscopy or colonoscopy~
Men reporting to have ever had a prostatic specific antigen test~ Men reporting to have ever had DRE~
~ Reported for people age 50 years and older~~ Reported for people age 40 years and older** Statistically significant with P-value of < 0.05.^ Not statistically significant with a P-value greater than 0.05.
Maryland Cancer Survey, 2002

TABLE 11-5 PHYSICAL ACTIVITY, DIET, AND CANCER SCREENING PRACTICES
Selected characteristicDo you engage in vigorous physical activity for 3 or more days per week for 20 or more minutes per occasion?YesNoIn a typical 7 day week, how many days do you engage in moderate physical activity for at least 30 minutes a day?0 days/week1-2 days/week3-4 days/week5 -7 days/weekHas a doctor or other HCP recommended that you begin or continue any type of exercise or physical activity in the past year?YesNoHow many total servings of fruits and vegetables do you eat each day?0-23-4 fruits/vegetables /day5 or moreHas a doctor or other HCP talked with you about your diet and eating habits in the past year?YesNoBody Mass Index < 18.518.5-<2525-<30> 30
N n wt% 95%CI Stat Sig N n wt% 95%CI Stat Sig N n wt% 95%CI Stat Sig N n wt% 95%CI Stat Sig
^ ^ ^ **957 898 94% 91-95% 954 916 96% 94-97% 692 681 98% 96-99% 1738 842 47% 44-50%2113 1965 93% 92-94% 2113 1974 94% 92-95% 1362 1326 97% 95-98% 3053 1247 40% 38-42%
** ** ** **496 451 90% 87-93% 495 442 90% 86-92% 299 284 94% 90-97% 712 240 32% 29-36%558 517 92% 89-94% 557 533 95% 92-97% 373 364 97% 93-99% 891 392 43% 39-46%987 949 97% 95-98% 987 957 98% 96-98% 671 664 99% 97-99% 1516 730 47% 44-50%963 883 92% 90-93% 962 901 94% 91-95% 680 665 98% 96-99% 1577 698 44% 41-46%
** ^ ** **1232 1182 96% 95-97% 1231 1172 95% 93-96% 801 793 98% 97-99% 1831 866 46% 43-49%1795 1649 92% 90-93% 1793 1679 94% 92-95% 1218 1182 96% 95-97% 2861 1192 41% 39-43%
** ** ** **1219 1112 91% 88-92% 1217 1135 93% 91-95% 816 788 95% 93-97% 2224 831 37% 34-39%1167 1096 94% 92-95% 1164 1097 94% 93-96% 787 777 99% 98-100% 1676 790 46% 43-49%595 571 96% 94-98% 595 572 97% 95-98% 399 395 99% 97-100% 754 422 56% 52-60%
** ^ ** ^1139 1084 95% 93-96% 1139 1080 94% 92-96% 718 713 99% 98-100% 1801 794 44% 41-47%1888 1749 93% 91-94% 1885 1773 94% 93-95% 1299 1262 97% 95-98% 2891 1263 42% 40-44%
^ ** ^ **141 127 91% 84-95% 142 131 92% 85-95% 110 104 95% 89-98% 165 78 44% 36-53%1180 1090 92% 90-94% 1179 1113 95% 94-96% 852 830 97% 95-98% 1699 816 47% 44-50%887 830 93% 91-95% 886 841 96% 94-97% 566 556 98% 97-99% 1619 676 40% 38-43%718 677 94% 92-96% 716 664 92% 89-94% 432 423 97% 94-99% 1160 439 38% 35-42%
Women reporting to have ever had a mammogram
Women reporting to have ever had a clinical breast exam
Women reporting to have ever had a Pap smear #~~
People reporting to have ever had oral cancer screening
~ Reported for people age 50 years and older~~ Reported for people age 40 years and older** Statistically significant with P-value of < 0.05.^ Not statistically significant with a P-value greater than 0.05.
Maryland Cancer Survey, 2002

TABLE 11-6 SMOKING STATUS AND DEMOGRAPHIC CHARACTERISTICS, AMONG THOSE AGE 40 YEARS AND OLDER
Selected Characteristic N n wt % 95% CI n wt % 95% CI n wt % 95% CI Stat SigTotal Population 4946 2405 48% 47-50% 1680 33% 32-35% 861 18% 17-20%
Gender **Male 1883 758 40% 38-43% 775 39% 37-42% 350 20% 18-23%Female 3063 1647 55% 53-57% 905 28% 27-30% 511 17% 15-18%
Age **40-49 years 1585 794 50% 48-53% 416 26% 23-29% 375 24% 21-26%50-64 years 1898 877 45% 42-48% 647 35% 32-37% 374 20% 18-23%65 years and above 1463 734 50% 47-53% 617 43% 40-46% 112 7% 6-9%
Race **White 3788 1813 47% 46-49% 1345 36% 34-38% 630 17% 16-18%African American 956 465 47% 44-51% 287 29% 26-33% 204 24% 20-27%Other 202 127 65% 56-73% 48 22% 16-30% 27 13% 8-20%
Gender and Race **White Males 1482 603 41% 38-44% 621 40% 38-43% 258 19% 16-21%African American Males 324 117 36% 30-42% 125 37% 31-43% 82 27% 22-33%Other Males 77 38 51% 38-65% 29 34% 22-48% 10 15% 7-28%White Females 2306 1210 53% 51-55% 724 32% 30-34% 372 15% 14-17%African American Females 632 348 56% 52-61% 162 23% 20-27% 122 21% 17-25%Other Females 125 89 77% 67-85% 19 12% 7-20% 17 11% 6-19%
Never Smoked ~ Previous Smoker ~ Current Smoker ~
~ Some data missing for marital status, education, and employment status.** Statistically significant, p-value < 0.05.^ Not statistically significant, p-value > 0.05.
Maryland Cancer Survey, 2002

TABLE 11-6 SMOKING STATUS AND DEMOGRAPHIC CHARACTERISTICS, AMONG THOSE AGE 40 YEARS AND OLDER
Selected Characteristic N n wt % 95% CI n wt % 95% CI n wt % 95% CI Stat SigNever Smoked ~ Previous Smoker ~ Current Smoker ~
Marital Status **Married or partner of unmarried couple 2937 1484 50% 48-52% 1030 35% 33-37% 423 15% 14-17%Divorced or separated 835 344 39% 36-43% 274 31% 27-35% 217 30% 26-34%Widowed 788 387 50% 46-54% 284 35% 31-39% 117 15% 12-18%Never Married 371 182 47% 41-53% 88 22% 18-28% 101 31% 25-37%
Education **Less than high school 494 188 36% 31-41% 162 31% 26-35% 144 34% 29-39%High school grad or GED 1453 644 42% 39-45% 484 33% 30-36% 325 25% 22-27%College 1-3 years 1119 514 46% 42-49% 401 36% 33-40% 204 18% 15-21%College grad 1014 577 58% 55-62% 324 30% 27-33% 113 12% 9-14%Advanced degree 854 478 57% 53-60% 304 36% 32-39% 72 8% 6-10%
Employment Status **Employed for wages 2348 1190 50% 48-53% 695 30% 27-32% 463 20% 18-22%Self-employed 368 163 45% 39-52% 141 40% 34-46% 64 15% 11-19%Retired 1573 742 46% 43-49% 667 42% 39-45% 164 12% 10-14%Other 647 304 47% 43-52% 176 26% 23-30% 167 27% 23-31%
Household Income **<$25,000 897 398 44% 40-48% 284 29% 26-33% 215 27% 23-31%$25,000-<$35,000 504 233 46% 41-51% 160 31% 27-36% 111 23% 19-27%$35,000-<$50,000 702 333 45% 40-49% 228 33% 29-37% 141 23% 19-27%$50,000-<$75,000 750 351 46% 42-50% 277 38% 34-42% 122 16% 13-19%$75,000 or greater 1313 683 52% 49-55% 457 34% 31-37% 173 14% 12-16%Don't Know/Not Sure 211 111 52% 44-60% 72 34% 27-42% 28 14% 9-20%Refused 569 296 54% 49-59% 202 35% 30-39% 71 11% 9-15%
~ Some data missing for marital status, education, and employment status.** Statistically significant, p-value < 0.05.^ Not statistically significant, p-value > 0.05.
Maryland Cancer Survey, 2002

TABLE 11-7 SMOKING STATUS AND CANCER SCREENING PRACTICES.
Selected characteristic N wt% 95%CI N n wt% 95%CI Stat Sig N n wt% 95%CI Stat SigSmoking Status ** **Never Smoked 2405 48% 47-50% 1604 935 59% 56-62% 1599 948 59% 56-62%Previous smoker 1680 33% 32-35% 1253 787 63% 60-66% 1252 803 64% 61-67%Current smoker 861 18% 17-20% 485 192 40% 35-46% 483 195 42% 37-48%
Total respondentsPeople reporting to have ever had sigmoidoscopy or colonoscopy~
People reporting to have ever had a fecal occult blood test~
~ age 50 years and older~~ age 40 years and older# among women with a uterus** Statistically significant, p-value < 0.05.^ Not statistically significant, p-value > 0.05.
Maryland Cancer Survey, 2002

TABLE 11-7 SMOKING STATUS AND CANCER SCREENING PRACTICES.
Selected characteristicSmoking StatusNever SmokedPrevious smokerCurrent smoker
N n wt% 95%CI Stat Sig N n wt% 95%CI Stat Sig N n wt% 95%CI Stat Sig** ** **
449 362 79% 74-84% 461 407 90% 87-93% 1643 1545 94% 92-95%583 479 80% 76-84% 604 549 91% 89-94% 905 860 95% 93-96%189 98 52% 44-61% 192 155 82% 75-87% 510 444 87% 83-90%
Women reporting to have ever had a mammogram~~
Men reporting to have ever had a DRE~
Men reporting to have ever had a prostatic specific antigen Test~
~ age 50 years and older~~ age 40 years and older# among women with a uterus** Statistically significant, p-value < 0.05.^ Not statistically significant, p-value > 0.05.
Maryland Cancer Survey, 2002

TABLE 11-7 SMOKING STATUS AND CANCER SCREENING PRACTICES.
Selected characteristicSmoking StatusNever SmokedPrevious smokerCurrent smoker
N n wt% 95%CI Stat Sig N n wt% 95%CI Stat Sig N n wt% 95%CI Stat Sig^ ** **
1639 1545 94% 93-95% 1108 1082 98% 96-98% 2327 1050 44% 42-47%904 857 95% 94-97% 584 577 99% 98-100% 1614 724 44% 41-47%511 473 92% 89-95% 357 345 95% 90-97% 831 310 37% 33-41%
People reporting to have ever had oral cancer screening~~
Women reporting to have ever had a Pap smear #~~
Women reporting to have ever had a clinical breast exam~~
~ age 50 years and older~~ age 40 years and older# among women with a uterus** Statistically significant, p-value < 0.05.^ Not statistically significant, p-value > 0.05.
Maryland Cancer Survey, 2002
Chapter 12. Summary of the Maryland Cancer Survey, 2002
Maryland adults compare favorably to national baseline levels for several types of cancer screening. According to data from the MCS, 2002, Maryland currently exceeds the national baseline averages reported in Healthy People 2010 for colorectal cancer (CRC) screening (both for having done an FOBT within the last two years and ever having an endoscopic examination) and having had a mammogram in the last two years, Pap smear in the last three years, and oral cancer screening in the last year. People in Maryland have already met or exceeded Healthy People 2010 targets for CRC endoscopic examinations, mammograms, Pap smear screening, and oral examinations. Marylanders fall below the Healthy People 2010 target for having an FOBT within the last two years (44% among those age 50 years and above compared to the Healthy People target of 50%), but this may be explained by the high percentage of people having colonoscopic exams, which is the more complete screening test. The United States Preventive Services Task Force has not recommended prostate cancer screening, and PSA and DRE recommendations are not part of the Healthy People 2010 objectives.1 The national baseline screening rates from the 2001 BRFSS, published by the American Cancer Society2, shows 57% of men, age 50 years and older, have had a PSA test and 56% have had a DRE, within the past year. This compares to 61% for the PSA and 62% for DRE among Maryland men within the last year, according to data from the MCS, 2002. Differences were seen by gender, race, and age for the various screening tests. Differences were noted between men and women for colorectal and oral cancer screening. A higher percentage of men had endoscopic examinations, whereas women were more likely to have performed FOBT testing and undergone oral cancer screening. As age increases, the percentage of people who report having a mammogram, colorectal exam, and prostate screening increases. Women in the younger age groups (40-49 years and 50-64 years) had a higher percentage of ever having had a Pap smear and CBE. Generally, there were no differences by race for women who reported that they ever had a mammogram, CBE, and Pap smear. Fecal occult blood testing was also performed less often in people of “other” races. Endoscopic screening was reported less often in African Americans and people of “other” races. African Americans also had much less oral cancer screening than other race groups. Generally, cancer screening increased with higher educational levels and higher annual incomes. People that were self-employed reported lower rates of colorectal cancer screening. People that reported employment status of “other” generally had lower rates of mammogram, CBE, PSA, and DRE screening. This may be because lower rates of health insurance are seen among those that have less education, lower income, and those people that are self-employed or have an employment status of “other.” People who had health insurance reported higher rates of screening for all tests. Those who reported being without health insurance sometime within the past year had lower screening rates, with all but oral cancer screening being statistically significant. Screening was higher among people who reported having at least one person they think of as their primary health care
1 Screening-Prostate USPSTF Update, 2002 release-http://www.ahcpr.gov/clinic/uspstf/uspsprca.htm 2 Cancer Detection and Early Prevention, Facts and Figures 2003, American Cancer Society http://www.cancer.org/downloads/STT/CPED2003PWSecured.pdf

provider and, and generally, among people who have had a physical exam within the last two years.
Clearly, receiving a recommendation from a health care provider for cancer screening is a very important factor in whether a cancer screening test is done. For every screening test, except mammogram, where a woman can schedule the appointment without a provider’s order, the test is either ordered or performed by a health care provider. When a health care provider recommended a test, the rates for colorectal, prostate, breast, and cervical cancer screening were much higher than when no recommendation was made. When asked why a screening test was not done, the response that “the doctor did not order the test” was always a prominent reason.
Marylanders have been less successful in reaching the Healthy People 2010 objectives for
some behavioral and lifestyle goals. When asked the question, “How many fruits and vegetables do you eat per day,” only 15% answered five or more. This falls far below the Healthy People 2010 goals of increasing fruit consumption to at least 2 servings per day to 75% of the population and vegetable consumption of at least 3 servings per day to 50%. The MCS, 2002 found that 18% of Marylanders currently smoke cigarettes, which is above the Healthy People 2010 target of 12%. However, with respect to both moderate and vigorous physical activity, Marylanders have exceeded the Healthy People 2010 targets of 30%. In this survey, 37% of those 40 and older report engaging in vigorous physical activity at least 3 days a week and 33% report moderate physical activity 5-7 days per week.
There are limitations to the methods of this study. The data are based entirely on self-
report, so there may be some recall bias or information bias. Respondents must live in a household residence with land-line telephones. People who live in institutions or use only cellular telephones are not eligible. Because the survey does not reach people who are not English-speaking and do not have telephones, it may not accurately assess the screening behaviors of lower income residents, and statewide estimates may be over-estimated. In addition, we do not interview those who cannot respond to a telephone survey because of a physical or mental impairment or those who refuse to be interviewed. The bivariate nature of the statistical analyses does not take the correlation between variables into account. This is better handled with multivariable analysis.
In conclusion, based on the MCS, 2002, Marylanders are knowledgeable about cancer
screening tests and are being tested at rates comparable to, or better than, the national baselines. Our data suggest screening rates for some tests differ by gender and/or race, and other demographics, such as age, marital status, education, employment status, and income. Other factors also have an influence on screening, such as whether or not the health care provider recommends that the test be done, health insurance status, and whether or not people have a primary health care provider. Using this year’s survey as the baseline for current cancer screening practices in Maryland, comparisons can be made with future surveys in order to monitor the impact of the policies and programs instituted as a result of programs such as the Maryland Cigarette Restitution Fund program, the Breast and Cervical Cancer program, and the implementation of the Maryland Comprehensive Cancer Plan.
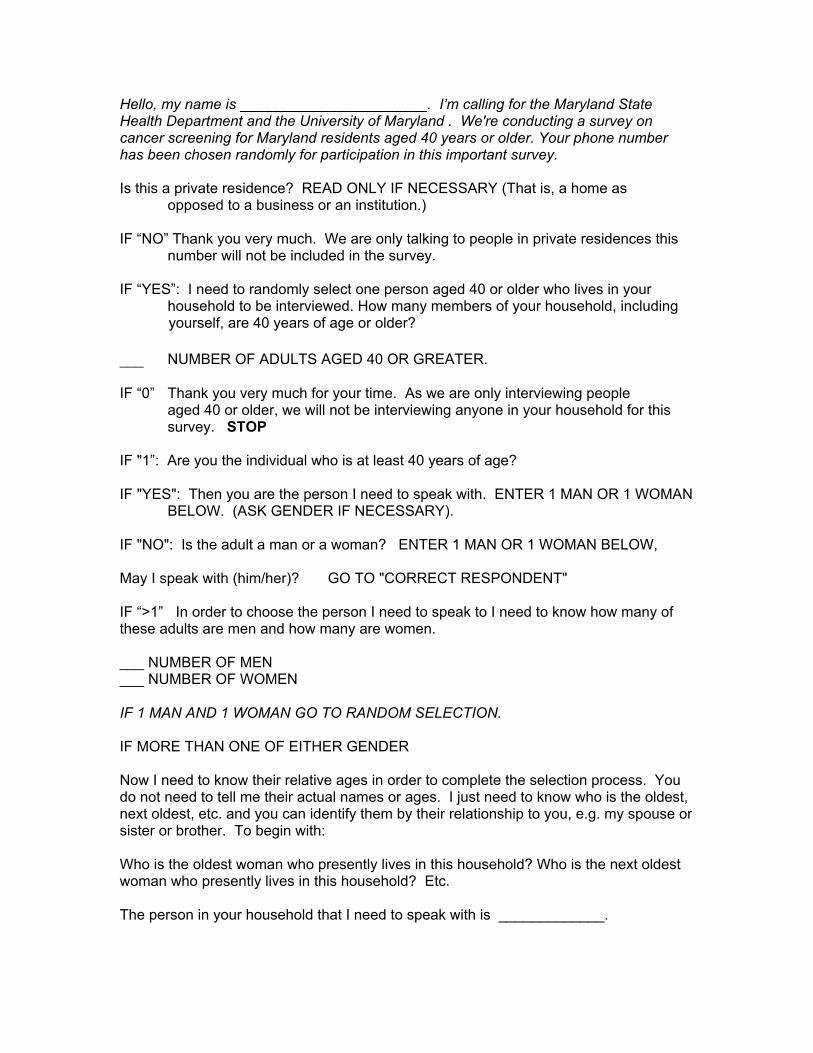
Hello, my name is _______________________. I’m calling for the Maryland State Health Department and the University of Maryland . We're conducting a survey on cancer screening for Maryland residents aged 40 years or older. Your phone number has been chosen randomly for participation in this important survey. Is this a private residence? READ ONLY IF NECESSARY (That is, a home as
opposed to a business or an institution.) IF “NO” Thank you very much. We are only talking to people in private residences this
number will not be included in the survey. IF “YES”: I need to randomly select one person aged 40 or older who lives in your household to be interviewed. How many members of your household, including yourself, are 40 years of age or older? ___ NUMBER OF ADULTS AGED 40 OR GREATER. IF “0” Thank you very much for your time. As we are only interviewing people
aged 40 or older, we will not be interviewing anyone in your household for this survey. STOP
IF "1”: Are you the individual who is at least 40 years of age? IF "YES": Then you are the person I need to speak with. ENTER 1 MAN OR 1 WOMAN BELOW. (ASK GENDER IF NECESSARY). IF "NO": Is the adult a man or a woman? ENTER 1 MAN OR 1 WOMAN BELOW, May I speak with (him/her)? GO TO "CORRECT RESPONDENT" IF “>1” In order to choose the person I need to speak to I need to know how many of these adults are men and how many are women. ___ NUMBER OF MEN ___ NUMBER OF WOMEN IF 1 MAN AND 1 WOMAN GO TO RANDOM SELECTION. IF MORE THAN ONE OF EITHER GENDER Now I need to know their relative ages in order to complete the selection process. You do not need to tell me their actual names or ages. I just need to know who is the oldest, next oldest, etc. and you can identify them by their relationship to you, e.g. my spouse or sister or brother. To begin with: Who is the oldest woman who presently lives in this household? Who is the next oldest woman who presently lives in this household? Etc. The person in your household that I need to speak with is _____________.

QUESTIONNAIRE FOR THE
MARYLAND CANCER SURVEY, 2002

TO CORRECT RESPONDENT: Hello, my name is _______________________. I’m calling for the Maryland State Health Department and the University of Maryland. We're conducting a survey on cancer screening for Maryland residents aged 40 years or older. Your phone number has been chosen randomly for participation in this important survey. The information collected in this survey will assist the health department in designing cancer education and screening programs for Maryland residents. I won’t ask for your name, address, or other personal information that can identify you. You don’t have to answer any question you don’t want to, and you can end the interview at any time. The survey takes about 15 minutes and any information you give us will be confidential. If you have any questions about this survey, I will provide a toll free telephone number for you to call to get more information.

RECORD NUMBER ___ ___ ___ ___ ___ SECTION 1: PERCEIVED RISK I’d like to start with some general questions about cancer. 1.1 How concerned are you about getting cancer in the future: Would you say you are . .
(FOR A CANCER SURVIVOR, THIS MEANS GETTING ANOTHER CANCER IN THE FUTURE DEFINED AS A NEW CANCER IN A DIFFERENT ORGAN.IT CAN ALSO MEAN A NEW CANCER IN ANOTHER PART OF THE SAME ORGAN, SUCH AS ANOTHER PRIMARY BREAST CANCER IN THE OPPOSITE BREAST).
1 Very concerned 2 Somewhat concerned 3 Not at all concerned 7 DON'T KNOW/NOT SURE 9 REFUSED
1.2. Would you say your risk of getting cancer in the future is low, medium, or high?
1 Low 2 Medium 3 High 7 DON'T KNOW/NOT SURE 9 REFUSED
1.3. Thinking only of your blood relatives, do you feel that the amount of cancer in your family is low, medium, or high? (DO NOT INCLUDE FAMILY MEMBERS RELATED ONLY THROUGH MARRIAGE SUCH AS STEPFATHER, STEPSISTER ETC..OR FAMILY MEMBERS WHO WERE ADOPTED).
1 Low 2 Medium 3 High 7 DON'T KNOW/NOT SURE 9 REFUSED
SECTION 2: HEALTH STATUS Now I’d like to ask you about your general health and health habits. 2.1. Would you say that in general your health is:
1 Excellent 2 Very good 3 Good 4 Fair 5 Poor 7 DON'T KNOW/NOT SURE 9 REFUSED

SECTION 3: HEALTH CARE ACCESS Now I’ll ask you some questions about how you get your health care. 3.1. Do you have any kind of health care coverage, including health insurance, prepaid plans such as HMOs, or government plans such as Medicare or Medical Assistance? 1 YES 2 NO
GO TO 3.3 7 DON'T KNOW/NOT SURE 9 REFUSED
3.2. During the past 12 months, was there any time that you did not have any health insurance or coverage? 1 YES 2 NO GO TO 3.4 7 DON'T KNOW/NOT SURE 9 REFUSED 3.3. About how long has it been since you had health insurance or coverage? READ ONLY IF NECESSARY
1 Within the past 6 months (ANYTIME < 6 MONTHS AGO) 2 Within the past year (>6 MONTHS BUT < 12 MONTHS AGO) 3 Within the past 2 years (>1 YEAR BUT < 2 YEARS) 4 Within the past 5 years (>2 YEARS BUT <5 YEARS) 5 5 or more years ago 7 DON’T KNOW 9 REFUSED
3.4 Do you have one person you think of as your personal doctor or primary health care provider? (If “no” ask “Is there more than one or is there no person who you think of?”)
1 Yes, only one 2 More than one 3 No 7 DON’T KNOW 9 REFUSED
SECTION 4: COLON CANCER SCREENING Now some questions about different kinds of cancer. We’ll start with colon cancer. 4.1 Do you have a brother, sister, parent or child of yours who had been diagnosed with
colon cancer?
1 YES 2 NO 7 DON’T KNOW/NOT SURE
9 REFUSED 4.2 Did you know that there are screening tests for colon cancer?
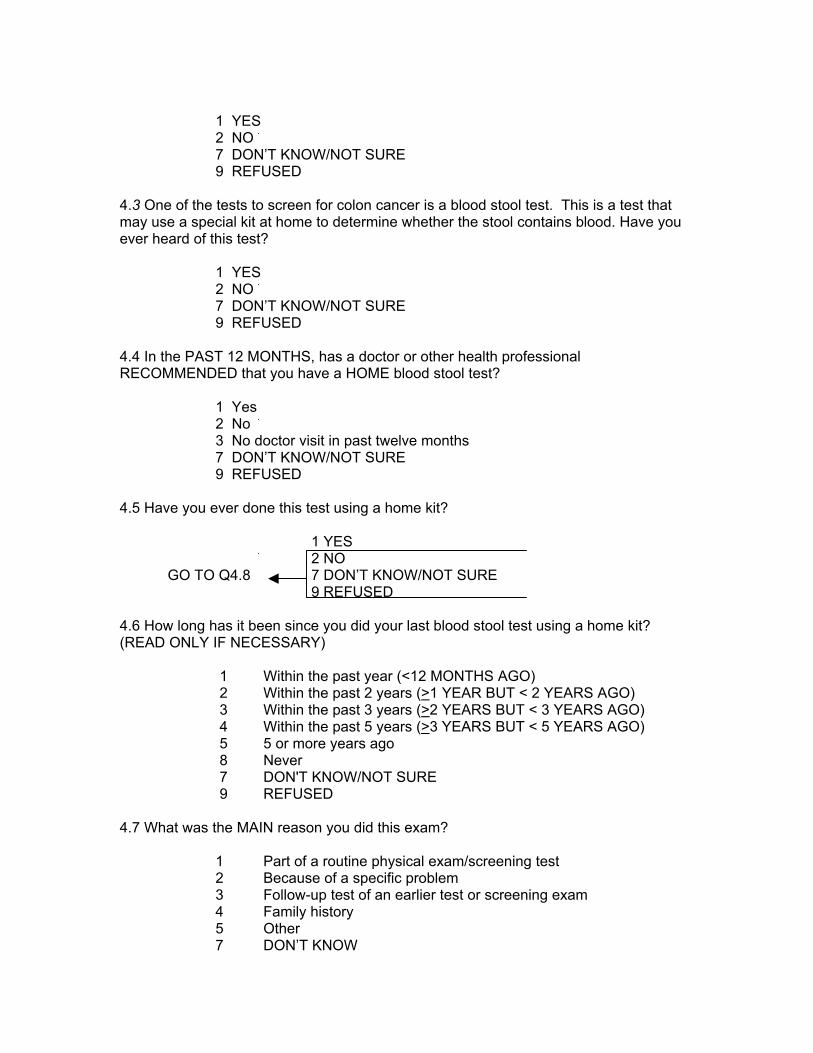
1 YES
2 NO 7 DON’T KNOW/NOT SURE
9 REFUSED 4.3 One of the tests to screen for colon cancer is a blood stool test. This is a test that may use a special kit at home to determine whether the stool contains blood. Have you ever heard of this test?
1 YES 2 NO 7 DON’T KNOW/NOT SURE
9 REFUSED 4.4 In the PAST 12 MONTHS, has a doctor or other health professional RECOMMENDED that you have a HOME blood stool test?
1 Yes 2 No
3 No doctor visit in past twelve months 7 DON’T KNOW/NOT SURE
9 REFUSED 4.5 Have you ever done this test using a home kit? 1 YES 2 NO GO TO Q4.8 7 DON’T KNOW/NOT SURE
9 REFUSED 4.6 How long has it been since you did your last blood stool test using a home kit? (READ ONLY IF NECESSARY) 1 Within the past year (<12 MONTHS AGO) 2 Within the past 2 years (>1 YEAR BUT < 2 YEARS AGO) 3 Within the past 3 years (>2 YEARS BUT < 3 YEARS AGO) 4 Within the past 5 years (>3 YEARS BUT < 5 YEARS AGO) 5 5 or more years ago 8 Never 7 DON'T KNOW/NOT SURE 9 REFUSED 4.7 What was the MAIN reason you did this exam?
1 Part of a routine physical exam/screening test 2 Because of a specific problem 3 Follow-up test of an earlier test or screening exam 4 Family history 5 Other 7 DON’T KNOW

9 REFUSED IF RESPONSE TO 4.6 WAS “WITHIN PAST YEAR “ SKIP TO Q 4.9 4.8 What is the most important reason you have {NEVER done /NOT done a HOME blood stool test in the PAST YEAR}? (READ ONLY IF NECESSARY – RECORD ALL RESPONSES NOTED BY RESPONDENT).
01 No reason/never thought about it 02 Didn't need it/didn’t know I needed this type of test 03 Doctor didn't order it/didn’t say I needed it 04 Haven ’t had any problems 05 Put it off/didn't get around to it 06 Too expensive/no insurance/cost 07 Too painful, unpleasant, or embarrassing 08 Had another type of colorectal exam like a colonoscopy,
sigmoidoscopy or Barium enema. 09 Don't have doctor 10 Didn’t want to know if I had cancer 11 Other , SPECIFY: _________________ 77 DON'T KNOW/NOT SURE 99 REFUSED
4.9 Sigmoidoscopy and colonoscopy are two other tests to screen for colon cancer. Both tests examine the bowel. A narrow, lighted tube is inserted in the rectum to look for growths in the colon. Sigmoidoscopy uses a shorter tube that just reaches the lower part of the colon. Colonoscopy uses a long tube and examines the entire colon. Before a colonoscopy is done, you are usually given medication through a needle in your arm to make you sleepy. Have you ever heard of these exams?
1 YES 2 NO 7 DON’T KNOW/NOT SURE
9 REFUSED 4.10 Has a doctor or other health professional ever RECOMMENDED that you have a sigmoidoscopy or colonoscopy?
1 YES 2 NO 7 DON’T KNOW/NOT SURE
9 REFUSED 4.11 Have you ever had a sigmoidoscopy or colonoscopy?
1 YES 2 NO GO TO 4.15 7 DON’T KNOW/NOT SURE 9 REFUSED 4.12 What was this MOST RECENT exam called: a sigmoidoscopy or a

colonoscopy, or something else?
1 Sigmoidoscopy 2 Colonoscopy 3 Something else: Specify ___________ 7 DON’T KNOW/NOT SURE 9 REFUSED
4.13 How long has it been since you had your last sigmoidoscopy or colonoscopy? (READ ONLY IF NECESSARY)
1 Within the past year (<12 MONTHS AGO) 2 Within the past 2 years (>1 YR BUT < 2 YRS AGO)
3 Within the past 5 years (>2 YRS BUT < 5 YRS AGO) 4 Within the past 10 years (>5 YRS BUT < 10 YRS AGO) 5 10 or more years ago 7 DON'T KNOW/NOT SURE
9 REFUSED 4.14 What was the MAIN reason you had this exam?
1 Part of a routine physical exam/screening test 2 Because of a specific problem 3 Follow-up test of an earlier test or screening exam (Fecal Occult
Blood Test or sigmoidoscopy) 4 Family history 5 Other 7 DON'T KNOW/NOT SURE
9 REFUSED IF RESPONDENT HAS HAD TEST WITHIN PAST 5 YEARS SKIP TO Q 4.16. 4.15 What is the most important reason you have [NEVER had/NOT had} one of these exams in the LAST 5 YEARS ]? (READ ONLY IF NECESSARY– RECORD ALL RESPONSES NOTED BY RESPONDENT).
01 No reason/never thought about it 02 Didn't need it/didn’t know I needed this type of test 03 Doctor didn't order it/didn’t say I needed it 04 Haven ’t had any problems 05 Put it off/didn't get around to it 06 Too expensive/no insurance/cost 07 Too painful, unpleasant, or embarrassing 08 Had another type of colorectal exam 09 Don't have doctor 10 Didn’t want to know if I had cancer 11 Didn’t have childcare or respite care if adult caregiver 12 Other , SPECIFY: _________________ 77 DON'T KNOW/NOT SURE 99 REFUSED

4.16 Have you seen or heard colon cancer screening being promoted on TV or radio, at a health care facility or in magazine or newspaper or some other place?
1 YES 2 NO 7 DON’T KNOW/NOT SURE
9 REFUSED 4.17 Are you aware that most health departments in Maryland have a no cost colon cancer screening program for low income individuals?
1 YES 2 NO 7 DON’T KNOW/NOT SURE
9 REFUSED IF RESPONDENT IS FEMALE, GO TO NEXT SECTION SECTION 5: PROSTATE CANCER SCREENING Now I’m going to ask you about prostate cancer screening. 5.1 A Prostate-Specific Antigen test, also called a PSA test, is a blood test used to check men for prostate cancer. Have you ever heard of this test?
1 YES 2 NO 7 DON’T KNOW/NOT SURE
9 REFUSED 5.2 Has a doctor or other health care professional ever recommended that you have a PSA test?
1 YES 2 NO 7 DON’T KNOW/NOT SURE
9 REFUSED 5.3 Have you ever had a PSA test?
1 YES 2 NO GO TO Q5.7 7 DON’T KNOW/NOT SURE
9 REFUSED 5.4 How long has it been since you had your last PSA test? (READ ONLY IF NECESSARY) 1 Within the past year (<12 MONTHS AGO) 2 Within the past 2 years (>1 YEAR BUT < 2 YEARS AGO)

3 Within the past 3 years (>2 YEARS BUT < 3 YEARS AGO) 4 Within the past 5 years (>3 YEARS BUT < 5 YEARS AGO) 5 5 or more years ago 8 Never 7 DON'T KNOW/NOT SURE 9 REFUSED 5.5 What was the main reason you had this PSA test?
1 Part of a routine physical exam/screening test 2 Because of a specific problem 3 Follow-up test for an earlier exam 4 Family history 5 Other 7 DON’T KNOW 9 REFUSED
IF RESPONDENT HAS HAD TEST IN PAST YEAR SKIP TO Q 5.7. 5.6 What is the most important reason you have [NEVER had/NOT had} one of these exams in the last 12 months ]? (READ ONLY IF NECESSARY- RECORD ALL RESPONSES NOTED BY RESPONDENT).
01 No reason/never thought about it 02 Didn't need it/didn’t know I needed this type of test 03 Doctor didn't order it/didn’t say I needed it 04 Haven ’t had any problems 05 Put it off/didn't get around to it 06 Too expensive/no insurance/cost 07 Didn’t want to know the results 08 Don't have doctor 09 Other , SPECIFY: _________________ 77 DON'T KNOW/NOT SURE 99 REFUSED
5.7 A digital rectal exam is an exam in which a doctor, nurse, or other health professional places a gloved finger into the rectum to feel the size, shape, and hardness of the prostate gland. Have you ever had a digital rectal exam?
1 YES 2 NO GO TO Q 7.1 7 DON’T KNOW/NOT SURE
9 REFUSED 5.8 How long has it been since your last digital rectal exam? 1 Within the past year (<12 MONTHS AGO) 2 Within the past 2 years (>1 YEAR BUT < 2 YEARS AGO) 3 Within the past 3 years (>2 YEARS BUT < 3 YEARS AGO) 4 Within the past 5 years (>3 YEARS BUT < 5 YEARS AGO)

5 5 or more years ago 8 Never 7 DON'T KNOW/NOT SURE 9 REFUSED IF RESPONDENT IS MALE, GO TO NEXT SECTION SECTION 6: WOMEN’S HEALTH Now for some questions about screening tests for women. 6.1 In the PAST YEAR, has a doctor or other health professional RECOMMENDED that you have a mammogram?
1 Yes 2 No
3 No doctor visit in past twelve months 7 DON’T KNOW/NOT SURE 9 REFUSED
6.2 Have you ever had a mammogram? 1 YES 2 NO GO TO Q6.5 7 DON’T KNOW/NOT SURE
9 REFUSED 6.3 How long has it been since you had your last mammogram? (READ ONLY IF NECESSARY) 1 Within the past year (<12 MONTHS AGO) 2 Within the past 2 years (>1 YEAR BUT < 2 YEARS AGO) 3 Within the past 3 years (>2 YEARS BUT < 3 YEARS AGO) 4 Within the past 5 years (>3 YEARS BUT < 5 YEARS AGO) 5 5 or more years ago 8 Never 7 DON'T KNOW/NOT SURE 9 REFUSED 6.4 Was your last mammogram done as part of a routine checkup, because of a breast problem other than cancer, or because you've already had breast cancer?
1 ROUTINE CHECKUP 2 BREAST PROBLEM OTHER THAN CANCER 3 HAD BREAST CANCER 4 OTHER REASON ___________________ 7 DON'T KNOW/NOT SURE 9 REFUSED
IF RESPONDENT HAS HAD TEST IN PAST TWO YEARS SKIP TO Q6.6.

6.5 What it the most important reason why you have {NEVER had /NOT had a mammogram in the past two years? (READ ONLY IF NECESSARY– RECORD ALL RESPONSES NOTED BY RESPONDENT.)
01 No reason/never thought about it 02 Didn't need it/didn’t know I needed this type of test 03 Doctor didn't order it/didn’t say I needed it 04 Haven ’t had any problems 05 Put it off/didn't get around to it 06 Too expensive/no insurance/cost 07 Too painful, unpleasant, or embarrassing 08 Don't have doctor 09 Didn’t want to know if I had cancer 10 Other , SPECIFY: _________________ 77 DON'T KNOW/NOT SURE
99 REFUSED 6.6 A clinical breast exam is when a doctor, nurse, or other health professional feels the breast for lumps. Have you ever had a clinical breast exam? 1 YES 2 NO GO TO Q6.9 7 DON’T KNOW/NOT SURE
9 REFUSED 6.7 How long has it been since your last breast exam? (READ ONLY IF NECESSARY) 1 Within the past year (<12 MONTHS AGO) 2 Within the past 2 years (>1 YEAR BUT < 2 YEARS AGO) 3 Within the past 3 years (>2 YEARS BUT < 3 YEARS AGO) 4 Within the past 5 years (>3 YEARS BUT < 5 YEARS AGO) 5 5 or more years ago 8 Never 7 DON'T KNOW/NOT SURE 9 REFUSED 6.8 Was your last breast exam done as part of a routine checkup, because of a breast problem other than cancer, or because you've already had breast cancer?
1 ROUTINE CHECKUP 2 BREAST PROBLEM OTHER THAN CANCER 3 HAD BREAST CANCER 4 OTHER REASON __________________ 7 DON'T KNOW/NOT SURE 9 REFUSED
6.9 A Pap smear is a routine test for cancer of the cervix in which the doctor examines the cervix, takes a cell sample from the cervix with a small stick or brush, and sends it to the lab. Have you ever heard of this test?

1 YES 2 NO 7 DON’T KNOW/NOT SURE
9 REFUSED 6.10 In the PAST YEAR, has a doctor or other health professional RECOMMENDED that you have a Pap smear?
1 Yes 2 No
3 No doctor visit in past twelve months 7 DON’T KNOW/NOT SURE
9 REFUSED 6.11 A. Have you ever had a Pap smear? 1 YES 2 NO GO TO Q6.14 7 DON’T KNOW/NOT SURE
9 REFUSED 6.12 How long has it been since you had your last Pap smear? (READ ONLY IF NECESSARY) 1 Within the past year (<12 MONTHS AGO) 2 Within the past 2 years (>1 YEAR BUT < 2 YEARS AGO) 3 Within the past 3 years (>2 YEARS BUT < 3 YEARS AGO) 4 Within the past 5 years (>3 YEARS BUT < 5 YEARS AGO) 5 5 or more years ago 8 Never 7 DON'T KNOW/NOT SURE 9 REFUSED 6.13 Was your last Pap smear done as part of a routine exam, or to check a current or previous problem? 1 ROUTINE EXAM 2 CHECK CURRENT OR PREVIOUS PROBLEM 3 OTHER 7 DON'T KNOW/NOT SURE 9 REFUSED IF RESPONDENT HAS HAD PAP IN PAST 3 YEARS SKIP TO Q6.15. 6.14 What is the most important reason you have {NEVER had a Pap smear /NOT had a Pap smear in the last 3 years}? (READ ONLY IF NECESSARY– RECORD ALL RESPONSES NOTED BY RESPONDENT.)
01 No reason/never thought about it. 02 Didn't need/didn’t know I needed this type of test

03 Doctor didn't order it/didn’t say I needed it 04 Haven ’t had any problems 05 Put it off/didn't get around to it 06 Too expensive/no insurance/cost 07 Too painful, unpleasant, or embarrassing
08 Had hysterectomy 09 Don't have doctor
10 Didn’t want to know if I had cancer 11 Other , SPECIFY: ________________
77 DON ’T KNOW /NOT SURE 99 REFUSED 6.15 Have you had a hysterectomy, that is an operation to remove the uterus (womb).
1 YES 2 NO 7 DON'T KNOW/NOT SURE 9 REFUSED SECTION 7: SKIN CANCER Now I’m going to ask you some questions about skin cancer. 7.1 How often do you avoid the sun between the hours of 10:00 and 4:00 p.m.?
1 always 2 nearly always 3 sometimes 4 seldom 5 never 6 don't go out in sun 7 DON’T KNOW 9 REFUSED
7.2 When outdoors for an hour or more on a sunny day, how often do you use a sunscreen lotion with a SPF rating of 15 or higher?
1 always 2 nearly always 3 sometimes 4 seldom 5 never 6 don't go out in sun 7 DON’T KNOW 9 REFUSED
7.3 When outdoors for an hour or more on a sunny day, how often do you wear a wide- brimmed hat or any other hat that shades your face, ears, and neck from the sun? BASEBALL CAPS DON’T COUNT.
1 always

2 nearly always 3 sometimes 4 seldom 5 never 6 don't go out in sun 7 DON’T KNOW 9 REFUSED
7.4 When outdoors for an hour or more on a sunny day, how often do you wear protective clothing like a long sleeved shirt and long pants?
1 always 2 nearly always 3 sometimes 4 seldom 5 never 6 don't go out in sun 7 DON’T KNOW 9 REFUSED
7.5 This next question is about sunburns. Including times when even a small part of you skin was red for more than 12 hours, how many times in the PAST YEAR have you had a sunburn?
___ ___ TIMES IN PAST YEAR 7 7 DON'T KNOW/NOT SURE
9 9 REFUSED 7.6 Have you used any sort of artificial tanning device that emits UV radiation, such as a tanning lamp or a tanning bed, in the past year?
1 YES 2 NO 7 DON’T KNOW/NOT SURE
9 REFUSED SECTION 8 : ORAL HEALTH/ORAL CANCER Next we’ll talk about your dental care and oral cancer. 8.1 How long has it been since you last visited a dentist or a dental clinic for any reason? (READ ONLY IF NECESSARY) INCLUDE VISITS TO DENTAL SPECIALISTS SUCH AS ORTHODONTISTS GO TO Q8.3 1 Within the past year (<12 MONTHS AGO) 2 Within the past 2 years (>1 YEAR BUT < 2 YEARS AGO) 3 Within the past 3 years (>2 YEARS BUT < 3 YEARS AGO) 4 Within the past 5 years (>3 YEARS BUT < 5 YEARS AGO) 5 5 or more years ago

8 Never 7 DON'T KNOW/NOT SURE 9 REFUSED 8.2. What is the main reason you have not visited the dentist in the past year? (READ ONLY IF NECESSARY– RECORD ALL RESPONSES NOTED BY RESPONDENT).
0 1 Fear, apprehension, nervousness, pain, dislike going 0 2 Cost 0 3 Do not have/know a dentist 0 4 Cannot get to the office/clinic (too far away, no transportation, no
appointments available) 0 5 No reason to go (no problems, no teeth) 0 6 Other priorities 0 7 Have not thought of it 0 8 Other 7 7 Don't know/Not sure 9 9 Refused
8.3 Do you have any kind of insurance coverage that pays for some or all of your routine dental care, including dental insurance, prepaid plans such as HMOs, or government plans such as Medicaid?
1 YES 2 NO 7 DON'T KNOW/NOT SURE 9 REFUSED
8.4 Have your ever heard of a test or exam for oral or mouth cancer?
1 YES 2 NO 7 DON'T KNOW/NOT SURE 9 REFUSED
8.5 Have you ever had a test or exam for oral or mouth cancer in which the doctor or dentist pulls on your tongue, sometimes with gauze wrapped around it, and feels under the tongue and inside the cheeks?
1 I THINK SO 2 YES 3 NO
GO TO Q 9.1 7 DON'T KNOW/NOT SURE 9 REFUSED
8.6 When did you have your most recent oral or mouth cancer exam?
1 Within the past year (<12 MONTHS AGO) 2 Within the past 2 years (>1 YEAR BUT < 2 YEARS AGO) 3 Within the past 3 years (>2 YEARS BUT < 3 YEARS AGO)

4 Within the past 5 years (>3 YEARS BUT < 5 YEARS AGO) 5 5 or more years ago 8 Never 7 DON'T KNOW/NOT SURE 9 REFUSED
8.7 What was the main reason for this test or exam? Was it for a . . . . .
1 Specific problem 2 Follow-up to a previous oral problem 3 Part of a routine physical exam 4 Part of a routine dental exam 5 Health fair or free screening program 6 Other, (SPECIFY _____________) 7 DON'T KNOW/NOT SURE 9 REFUSED
8.8 What type of medical care person examined you when you had your last check-up for oral cancer?
1 Doctor/physician 2 Nurse/Nurse Practitioner 3 Dentist 4 Dental Hygienist 5 Other, (SPECIFY ____________) 7 DON'T KNOW/NOT SURE 9 REFUSED
SECTION 9: DEMOGRAPHICS 9.1 What is your age?
___ ___ ___(Code age in years) 0 0 7 DON’T KNOW/NOT SURE 0 0 9 REFUSED 9.2 Are you Hispanic and/or Latino?
1 YES 2 NO 7 DON’T KNOW/NOT SURE 9 REFUSED
9.3 Which one or more of the following would you say is your race? (MARK ALL THAT APPLY).
1 White 2 Black or African American 3 Asian 4 Native Hawaiian or Other Pacific Islander

5 American Indian, Alaska Native or 6 Other (SPECIFY ________________) 7 DON’T KNOW/NOT SURE 9 REFUSED IF MORE THAN ONE RESPONSE TO Q9.3, CONTINUE. OTHERWISE, GO TO Q9.5 9.4 Which one of these groups would you say best represents your race?
1 White 2 Black or African American 3 Asian 4 Native Hawaiian or Other Pacific Islander 5 American Indian, Alaska Native or
6 Other (SPECIFY ________________) 8 NO ADDITIONAL CHOICES 7 DON’T KNOW/NOT SURE 9 REFUSED 9.5 Are you:
1 Married 2 Divorced 3 Widowed 4 Separated
5 Never Married 6 A partner of an unmarried couple 9 REFUSED 9.6 How many members of your household, including yourself, are 18 years of age or older?
___ ___ NUMBER OF ADULTS 9 9 REFUSED 9.7 How many children less than 18 years of age live in your household ?
___ ___ NUMBER OF CHILDREN 8 8 NONE 9 9 REFUSED 9.8 What is the highest grade or year of school you completed? (READ ONLY IF NECESSARY)
1 Never attended school or only attended kindergarten 2 Grades 1 through 8 (Elementary) 3 Grades 9 through 11 (Some high school) 4 Grade 12 or GED (High school graduate) 5 College 1 year to 3 years (Some college or technical school)

6 College 4 years (College graduate) 7 Master’s Degree 8 Advanced professional or doctoral degree 9 REFUSED
9.9 Are you currently:
1 Employed for wages 2 Self-employed 3 Out of work for more than 1 year 4 Out of work for less than 1 year 5 A Homemaker 6 A Student 7 Retired or 8 Unable to work 9 REFUSED
9.10 Is your annual household income from all sources: READ AS APPROPRIATE
0 4 Less than $25,000 [IF "NO," ASK 05; IF "YES," ASK 03] ($20,000 TO LESS THAN $25,000)
0 3 Less than $20,000 [IF "NO," CODE 04; IF "YES," ASK 02] ($15,000 TO LESS THAN $20,000)
0 2 Less than $15,000 [IF "NO," CODE 03; IF "YES," ASK 01] ($10,000 TO LESS THAN $15,000)
0 1 Less than $10,000 [IF "NO," CODE 02]
0 5 Less than $35,000 [IF "NO," ASK 06] ($25,000 TO LESS THAN $35,000)
0 6 Less than $50,000 [IF "NO," ASK 07] ($35,000 TO LESS THAN $50,000)
0 7 Less than $75,000 [IF "NO," CODE 08] ($50,000 TO LESS THAN $75,000)
0 8 $75,000 or more 7 7 DON’T KNOW/NOT SURE 9 9 REFUSED
9.11 About how much do you weigh without shoes? ROUND FRACTIONS UP
__ __ __ WEIGHT POUNDS
7 7 7 DON’T KNOW/NOT SURE 9 9 9 REFUSED 9.12 About how tall are you without shoes? ROUND FRACTIONS DOWN
__ __/__ __ Height ft/inches

7 7 7 DON’T KNOW/NOT SURE 9 9 9 REFUSED 9.13 What county do you live in? __________________ CODE ___ ___ ___ IF RESPONSE IS “BALTIMORE” PROBE FOR COUNTY OR CITY.
7 7 7 DON’T KNOW/NOT SURE 9 9 9 REFUSED
9.14 Do you have more than one telephone number in your household? Do not include cell phones or numbers that are only used by a computer or fax machine. 1 YES 2 NO GO TO Q9.16 7 DON’T KNOW/NOT SURE
9 REFUSED 9.15 How many of these are residential numbers?
__ RESIDENTIAL TELEPHONE NUMBERS [6=6 OR MORE] 7 DON’T KNOW/NOT SURE 9 REFUSED
9.16 INDICATE GENDER OF RESPONDENT. ASK ONLY IF NECESSARY
1 MALE 2 FEMALE
SECTION 10: HEALTH CARE ACCESS CONTINUED Now I just have a few more questions about your health care and health habits and we’ll be done. 10.1 Was there a time during the last 12 months when you needed medical care, but could not get it? 1 YES
2 NO GO TO 10.3 7 DON'T KNOW/NOT SURE
9 REFUSED 10.2 What is the main reason you did not get medical care? READ ONLY IF NECESSARY 01 Cost (INCLUDE NO INSURANCE) 02 Distance 03 Office wasn’t open when I could get there 04 Too long a wait for an appointment 05 Too long a wait in the waiting room 06 No child care

07 No transportation 08 No access for people with disabilities 09 The medical provider didn’t speak my language
10 Other: SPECIFY ________________________ 7 7 DON'T KNOW/NOT SURE 9 9 REFUSED
10.3 What kind of place do you go to most often when your are sick or your need advice about your health? : is it . . .
1 A doctor's office or HMO 2 A clinic or health center 3 A hospital outpatient department 4 A hospital emergency room 5 An urgent care center, or 8 Some other kind of place 7 DON’T KNOW 9 REFUSED
10.4 About how long has it been since you last visited a doctor for a routine checkup? A routine checkup is a general physical exam, not an exam for a specific injury, illness or condition. READ ONLY IF NECESSARY
1 Within the past year (ANYTIME <12 MONTHS AGO) 2 Within the past 2 years (>1 YEAR BUT < 2 YEARS) 3 Within the past 5 years (>2 YEARS BUT < 5 YEARS) 4 5 or more years ago 7 DON’T KNOW 9 REFUSED
SECTION 11: EXERCISE/PHYSICAL ACTIVITY The next series of questions are about exercise and physical activities IF "EMPLOYED" OR "SELF-EMPLOYED" TO Q9.9, CONTINUE. OTHERWISE GO TO Q11.2 11.1 When you are at work, which of the following best describes what you do? Would you say . . . (IF RESPONDENT HAS MULTIPLE JOBS, INCLUDE ALL JOBS.)
1 Mostly sitting or standing 2 Mostly walking or 3 Mostly heavy labor or physically demanding work 7 DON’T KNOW/NOT SURE 9 REFUSED
11.2 Vigorous physical activity is any activity that causes large increases in breathing or heart rate such as running, aerobics or heavy yard work. Do you do vigorous physical activity for three or more days per week for 20 or more minutes per occasion?

1 YES 2 NO 7 DON’T KNOW/NOT SURE 9 REFUSED
11.3 Moderate physical activity is any activity that causes small increases in breathing or heart rate such as brisk walking, bicycling, vacuuming or gardening. In a typical seven day week, how many days do you do you engage in moderate physical activity for at least 30 minutes a day? (IF RESPONSE IS LESS THAN ONCE/WEEK OR NEVER CODE AS 00.)
_0__ ___ NUMBER OF DAYS/WEEK
77 DON’T KNOW/NOT SURE
99 REFUSED IF YES TO 11.2 OR THREE OR MORE DAYS TO 11.3, SKIP TO 11.5 11.4 I’m going to read you a list of reasons people give for not being physically active. Please tell me what is the main thing which prevents you most from doing a total of 30 minutes of physical activity at least 5 days a week?
1 A lack of motivation 2 A lack of time 3 A physical disability or other health limit 4 There’s no place to exercise 5 The cost is too high 6 Some other reason. (SPECIFY: ______________) 7 DON’T KNOW/NOT SURE 9 REFUSED
11.5 During the PAST 12 MONTHS, did a doctor or other health care professional RECOMMEND that you BEGIN or CONTINUE to do any type of exercise or physical activity?
1 YES 2 NO
3 No doctor visit in past twelve months 7 DON’T KNOW/NOT SURE
9 REFUSED SECTION 12: FRUITS AND VEGETABLES Now I’m going to ask you about your eating habits. 12.1 During the PAST 12 MONTHS, has a doctor or health care professional talked with you about your diet and eating habits?
1 YES

2 NO 3 DID NOT SEE A DOCTOR IN THE PAST 12 MONTHS 7 REFUSED 9 DON ’T KNOW
The next questions are about the foods you usually eat and drink. Please tell me how often you eat or drink each one, for example, twice a day, twice a week, three times a month, and so forth. Include all foods you eat, both at home and away from home. 12.2 How often do you drink fruit juices such as orange, grapefruit, or tomato?
1 ___ ___ PER DAY 2 ___ ___ PER WEEK 3 ___ ___ PER MONTH 4 4 4 LESS THAN ONCE PER MONTH 5 5 5 NEVER 7 7 7 DON'T KNOW/NOT SURE 9 9 9 REFUSED
12.3 Not counting juice, how often do you eat fruit?
1 ___ ___ PER DAY 2 ___ ___ PER WEEK 3 ___ ___ PER MONTH 4 4 4 LESS THAN ONCE PER MONTH 5 5 5 NEVER 7 7 7 DON'T KNOW/NOT SURE 9 9 9 REFUSED
12.4 How often do you eat green salad?
1 ___ ___ PER DAY 2 ___ ___ PER WEEK 3 ___ ___ PER MONTH 4 4 4 LESS THAN ONCE PER MONTH 5 5 5 NEVER 7 7 7 DON'T KNOW/NOT SURE 9 9 9 REFUSED
12.5 How often do you eat potatoes not including french fries, fried potatoes, or potato chips?
1 ___ ___ PER DAY 2 ___ ___ PER WEEK 3 ___ ___ PER MONTH 4 4 4 LESS THAN ONCE PER MONTH 5 5 5 NEVER 7 7 7 DON'T KNOW/NOT SURE 9 9 9 REFUSED
12.6 How often do you eat carrots?

1 ___ ___ PER DAY 2 ___ ___ PER WEEK 3 ___ ___ PER MONTH 4 4 4 LESS THAN ONCE PER MONTH 5 5 5 NEVER 7 7 7 DON'T KNOW/NOT SURE 9 9 9 REFUSED
12.7 Not counting carrots, potatoes, or green salad, how many servings of vegetables do you usually eat? (Example: A serving of vegetables at both lunch and dinner would be two servings.)
1 ___ ___ PER DAY 2 ___ ___ PER WEEK 3 ___ ___ PER MONTH 4 4 4 LESS THAN ONCE PER MONTH 5 5 5 NEVER 7 7 7 DON'T KNOW/NOT SURE 9 9 9 REFUSED
12.8 How many total servings of fruits and vegetables do you eat each day?
|___|___| ENTER NUMBER OF SERVINGS/DAY 0 0 NEVER 7 7 DON’T KNOW/NOT SURE 9 9 REFUSED
SECTION 13: FOLIC ACID 13.1 Do you currently take any vitamin pills or supplements? (Include liquid supplements).
1 YES GO TO Q14.1 2 NO
7 DON'T KNOW/NOT SURE 9 REFUSED
13.2 Are any of these a multivitamin? GO TO Q13.4 1 YES 2 NO
7 DON'T KNOW/NOT SURE 9 REFUSED
13.3 Do any of the vitamin pills or supplements you take contain folic acid?
1 YES 2 NO
GO TO Q14.1 7 DON'T KNOW/NOT SURE

9 REFUSED 13.4 How often do you take this vitamin pill or supplement?
1 ___ ___ Times per day 2 ___ ___ Times per week 3 ___ ___ Times per month 7 7 7 DON'T KNOW/NOT SURE 9 9 9 REFUSED
SECTION 14: ALCOHOL CONSUMPTION 14.1 A drink of alcohol is 1 can or bottle of beer, 1 glass of wine, 1 can or bottle of wine cooler, 1 cocktail, or 1 shot of liquor. During the past 30 days, how often have you had at least one drink of any alcoholic beverage?
1 __ __ Days per week 2 __ __ Days in past 30
8 8 8 NO DRINKS IN PAST 30 DAYS
GO TO Q 15.1 7 7 7 DON'T KNOW/NOT SURE 9 9 9 REFUSED
14.2 On the days when you drank, about how many drinks did you drink on the average?
___ ___ Number of drinks 7 7 DON'T KNOW/NOT SURE 9 9 REFUSED
14.3 Considering all types of alcoholic beverages, how many times during the past 30 days did you have 5 or more drinks on an occasion?
___ ___ Number of times 8 8 NONE 7 7 DON'T KNOW/NOT SURE 9 9 REFUSED
SECTION 15: TOBACCO USE 15.1 Have you smoked at least 100 cigarettes in your entire life?
(5 Packs = 100 cigarettes) 1 YES 2 NO
GO TO Q16.1 7 DON’T KNOW/NOT SURE 9 REFUSED
15.2 Do you now smoke cigarettes every day, some days, or not at all?

1 EVERY DAY
2 SOME DAYS 3 NOT AT ALL
GO TO Q 16.1 7 DON’T KNOW/NOT SURE 9 REFUSED
15.3. In the past 12 months, did a doctor, nurse, or other health professional advise you to quit smoking?
1 YES 2 NO 7 DON’T KNOW/NOT SURE 9 REFUSED
SECTION 16: OTHER TOBACCO PRODUCTS 16.1. Have you ever used or tried any smokeless tobacco products such as chewing tobacco or snuff?
1 YES
2 NO GO TO Q 16.3 7 DON’T KNOW/NOT SURE
9 REFUSED 16.2 Do you currently use chewing tobacco or snuff every day, some days, or not at all?
1 EVERY DAY 2 SOME DAYS 3 NOT AT ALL 7 DON’T KNOW/NOT SURE
16.3 Have you ever smoked a cigar, even one or two puffs?
1 YES
2 NO GO TO END 7 DON’T KNOW/NOT SURE
9 REFUSED 16.4 Do you now smoke cigars every day, some days, or not at all?
1 EVERY DAY 2 SOME DAYS 3 NOT AT ALL 7 DON’T KNOW/NOT SURE 9 REFUSED

CLOSING STATEMENT That completes the interview. Everyone’s answers will be combined to give us information about the health practices of people aged 40 and over in the state of Maryland. Thank you very much for participating in this important survey.