a pom asg1 11007 aseem
TRANSCRIPT
8/3/2019 A POM Asg1 11007 Aseem
http://slidepdf.com/reader/full/a-pom-asg1-11007-aseem 1/25
2011
[
]
SDMIMD
SUBMITTED BY:
ASEEM A KABIRPGDM NO: 11007SECTION APGDM 2011-13
SUBMITTED TO:
Dr. R. JAGADEESH
8/3/2019 A POM Asg1 11007 Aseem
http://slidepdf.com/reader/full/a-pom-asg1-11007-aseem 2/25
1
TABLE OF CONTENTS
INTRODUCTION ....................................................................................................................................... 2
HISTORY: ............................................................................................................................................. 2PROMOTERS AND OWNERS: ............................................................................................................... 4
NESTLÉ INDIA: ..................................................................................................................................... 6
PRESENCE ACROSS INDIA: ................................................................................................................... 6
PRODUCTS IN INDIA: ........................................................................................................................... 7
PERFORMANCE: .................................................................................................................................. 7
ACHIEVEMENTS: .................................................................................................................................. 8
OPERATIONS STRATEGY ........................................................................................................................ 10
THE TEN PRINCIPLES OF BUSINESS OPERATIONS: ............................................................................ 10
SUPPLY CHAIN: .................................................................................................................................. 11
THE FOUNDATION FOR SUSTAINABILITY AND CREATING SHARED VALUE: ...................................... 12
PROBLEMS FACED & MEASURES TAKEN: .......................................................................................... 13
PRODUCTIVITY ...................................................................................................................................... 14
SECTOR TRENDS: ............................................................................................................................... 14
Industry Expectations ....................................................................................................................... 14
Analysts/market expectations : ........................................................................................................ 14
Outlook: ............................................................................................................................................ 15
COMPETITIVENESS ................................................................................................................................ 16
INDUSTRY - FOOD AND DAIRY PRODUCTS – MULTINATIONAL ........................................................ 16
Issues and Challenges: ...................................................................................................................... 16
Consistency in Ranking: .................................................................................................................... 17
FORECASTING ........................................................................................................................................ 18
NAÏVE APPROACH: ............................................................................................................................ 18
MOVING AVERAGE METHOD: ........................................................................................................... 19
WEIGHTED MOVING AVERAGE: ........................................................................................................ 19
EXPONENTIAL SMOOTHING: ............................................................................................................. 20
TRENDLINE ANALYSIS: ....................................................................................................................... 22
COMPARING THE METHODS APPLIED: ............................................................................................. 22
QUALITY CHECK OF THE REPORT .......................................................................................................... 23
REFERENCES .......................................................................................................................................... 24
8/3/2019 A POM Asg1 11007 Aseem
http://slidepdf.com/reader/full/a-pom-asg1-11007-aseem 3/25
2
INTRODUCTION
Nestle is the world's leading Nutrition, Health and Wellness company. The mission of "Good
Food, Good Life" is to provide consumers with the best tasting, most nutritious choices in a
wide range of food and beverage categories and eating occasions, from morning to night.
Nestle believes that leadership is about behaviour, and we recognise that trust is earned
over a long period of time by consistently delivering on our promises. It is only possible to
create long-term sustainable value for our shareholders if the behaviour, strategies and
operations also create value for the communities where we operate, for the business
partners and of course, for the consumers. Nestle calls this principle as 'creating shared
value'.
The Nestlé Corporate Business Principles are at the basis of the company’s culture,
developed over 140 years, which reflects the ideas of fairness, honesty and long-term
thinking.
The Company was founded in 1866 by Henri Nestlé in Vevey, Switzerland, where the
headquarters are still located today. Nestle employs around 280 000 people and have
factories or operations in almost every country in the world. Nestlé sales for 2010 were
almost CHF 110bn.
HISTORY:
The company dates to 1867, when two separate Swiss enterprises were founded that would
later form the core of Nestlé. In the succeeding decades, the two competing enterprises
aggressively expanded their businesses throughout Europe and the United States.
In August 1867, Charles and George Page, two brothers from Lee County, Illinois, USA,
established the Anglo-Swiss Condensed Milk Company in Cham. Their first British operation
was opened at Chippenham, Wiltshire, in 1873.
In September 1867, in Vevey, Henri Nestlé developed a milk-based baby food, and soonbegan marketing it. The following year, 1868, saw Daniel Peter begin seven years of work
perfecting his invention, the milk chocolate manufacturing process; Nestlé's was the crucial
cooperation that Peter needed to solve the problem of removing all the water from the milk
added to his chocolate, and thus preventing the product from developing mildew. Henri
Nestlé retired in 1875, but the company, under new ownership, retained his name as Farine
Lactée Henri Nestlé.
In 1877, Anglo-Swiss added milk-based baby foods to its products, and in the following year
the Nestlé Company added condensed milk, so that the firms became direct and fierce
rivals.
8/3/2019 A POM Asg1 11007 Aseem
http://slidepdf.com/reader/full/a-pom-asg1-11007-aseem 4/25
3
In 1905, the companies merged to become the Nestlé and Anglo-Swiss Condensed Milk
Company, retaining that name until 1947, when the name Nestlé Alimentana SA was taken
as a result of the acquisition of Fabrique de Produits Maggi SA (founded 1884) and its
holding company, Alimentana SA of Kempttal, Switzerland. Maggi was a major manufacturer
of soup mixes and related foodstuffs. The company’s current name was adopted in 1977. Bythe early 1900s, the company was operating factories in the United States, United Kingdom,
Germany and Spain. The First World War created new demand for dairy products in the
form of government contracts, and by the end of the war, Nestlé's production had more
than doubled.
After the war, government contracts dried up, and consumers switched back to fresh milk.
However, Nestlé's management responded quickly, streamlining operations and reducing
debt. The 1920s saw Nestlé's first expansion into new products, with chocolate-
manufacture becoming the company's second most important activity.
Nestlé felt the effects of the Second World War immediately. Profits dropped from US$20
million in 1938, to US$6 million in 1939. Factories were established in developing countries,
particularly in Latin America. Ironically, the war helped with the introduction of the
company's newest product, Nescafé ("Nestlé's Coffee"), which became a staple drink of the
US military. Nestlé's production and sales rose in the wartime economy.
The end of World War II was the beginning of a dynamic phase for Nestlé. Growth
accelerated and companies were acquired. In 1947 came the merger with Maggi, a well-
known manufacturer of seasonings and soups. Crosse & Blackwell followed in 1950, as did
Findus (1963), Libby's (1971) and Stouffer's (1973). Diversification came with a shareholdingin L'Oréal in 1974. In 1977, Nestlé made its second venture outside the food industry, by
acquiring Alcon Laboratories Inc.
In 1984, Nestlé's improved bottom line allowed the company to launch a new round of
acquisitions, notably American food giant Carnation and the British confectionery company
Rowntree Mackintosh in 1988, which brought the Willy Wonka brand to Nestlé.
The first half of the 1990s proved to be favourable for Nestlé. Trade barriers crumbled, and
world markets developed into more or less integrated trading areas. Since 1996, there have
been various acquisitions, including San Pellegrino (1997), Spillers Petfoods (1998), and
Ralston Purina (2002). There were two major acquisitions in North America, both in 2002 –
in June, Nestlé merged its U.S. ice cream business into Dreyer's, and in August a US$2.6
billion acquisition was announced of Chef America, the creator of Hot Pockets. In the same
time-frame, Nestlé came close to purchasing the iconic American company Hershey's, one
of its fiercest confectionery competitors, although the deal eventually fell through. Another
recent purchase included the Jenny Craig weight-loss program, for US$600 million.
In December 2005, Nestlé bought the Greek company Delta Ice Cream for €240 million. In
January 2006, it took full ownership of Dreyer's, thus becoming the world's largest ice creammaker, with a 17.5% market share.
8/3/2019 A POM Asg1 11007 Aseem
http://slidepdf.com/reader/full/a-pom-asg1-11007-aseem 5/25
4
In November 2006, Nestlé purchased the Medical Nutrition division of Novartis
Pharmaceutical for $2.5B, also acquiring, in 2007, the milk-flavouring product known as
Ovaltine.
In April 2007, returning to its roots, Nestlé bought US baby-food manufacturer Gerber for
$5.5 billion. In December 2007, Nestlé entered into a strategic partnership with a Belgian
chocolate maker, Pierre Marcolini. Nestlé agreed to sell its controlling stake in Alcon to
Novartis on 4 January 2010. The sale was to form part of a broader US$39.3 billion offer, by
Novartis, for full acquisition of the world’s largest eye-care company.
On March 1, 2010, Nestlé concluded the purchase of Kraft's North American frozen pizza
business for $3.7 billion. In July 2011, Nestlé SA agreed to buy 60 percent of Hsu Fu Chi
International Ltd. for about $1.7 billion.
PROMOTERS AND OWNERS:
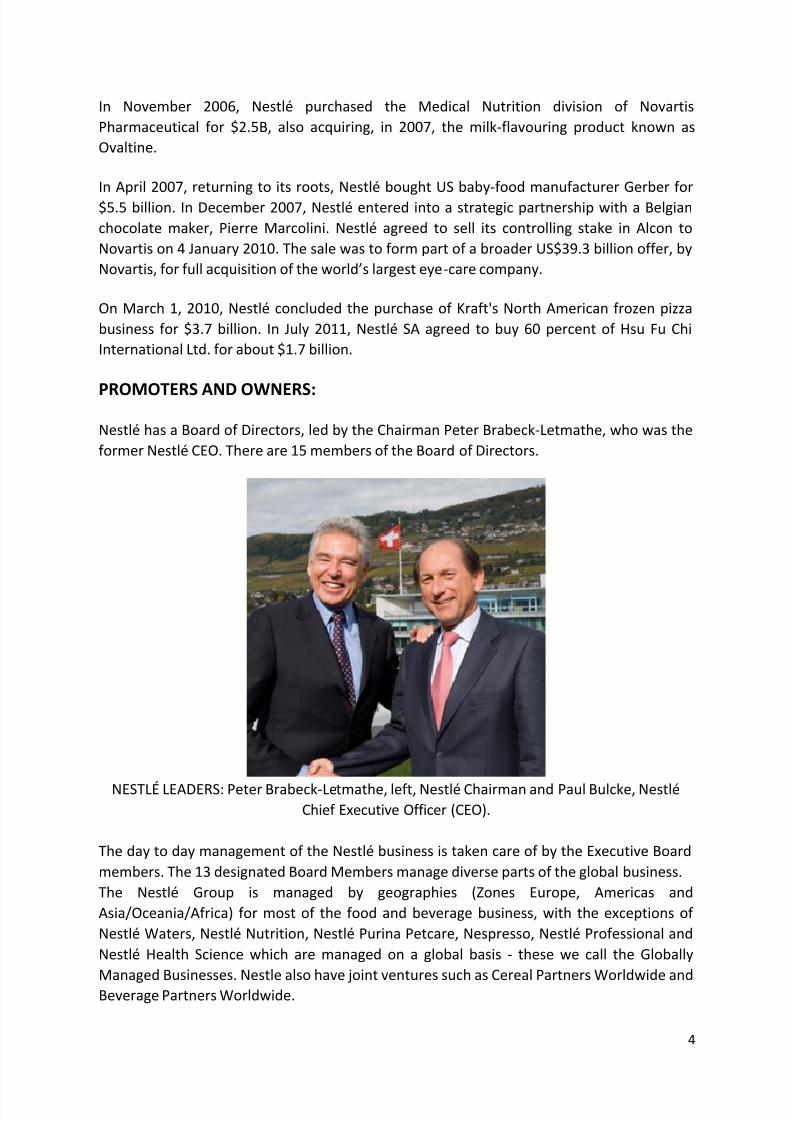
Nestlé has a Board of Directors, led by the Chairman Peter Brabeck-Letmathe, who was the
former Nestlé CEO. There are 15 members of the Board of Directors.
NESTLÉ LEADERS: Peter Brabeck-Letmathe, left, Nestlé Chairman and Paul Bulcke, NestléChief Executive Officer (CEO).
The day to day management of the Nestlé business is taken care of by the Executive Board
members. The 13 designated Board Members manage diverse parts of the global business.
The Nestlé Group is managed by geographies (Zones Europe, Americas and
Asia/Oceania/Africa) for most of the food and beverage business, with the exceptions of
Nestlé Waters, Nestlé Nutrition, Nestlé Purina Petcare, Nespresso, Nestlé Professional and
Nestlé Health Science which are managed on a global basis - these we call the Globally
Managed Businesses. Nestle also have joint ventures such as Cereal Partners Worldwide andBeverage Partners Worldwide.
8/3/2019 A POM Asg1 11007 Aseem
http://slidepdf.com/reader/full/a-pom-asg1-11007-aseem 6/25
5
PRODUCTS AND SERVICES OFFERED WORLDWIDE:
Nestlé has some 6,000 brands, with a wide range of products across a number of markets,
including coffee (Nescafé, Nespresso, etc.), bottled water (Buxton, Perrier, etc.), milkshakes
and other beverages (Nesquik, Milo, Carnation, etc.), chocolate (Milky Bar, After Eight, and
many others), ice cream (Häagen-Dazs, Skinny Cow, etc.), breakfast cereals (Cheerios,
Golden Nuggets, Shreddies, etc.), infant foods (now including Gerber products),
performance and healthcare nutrition (Nesvita, PowerBar, etc.), seasonings, soups and
sauces (Maggi, Buitoni, etc.), frozen and refrigerated foods (Findus, Lean Cuisine, etc.),
confectionery (Rowntree products, Caramac, Wonka products, etc.), and pet food (Winalot,
Felix, etc.).
Baby Foods - Cerelac, Gerber, Gerber Graduates, NaturNes, Nestum..
Bottled Water - Nestlé Pure Life, Perrier, Poland Spring, S.Pellegrino
Cereals - Chocapic, Cini Minis, Cookie Crisp, Estrelitas, Fitness, Nesquik
Chocolates & Confectionery - Aero, Butterfinger, Cailler, Crunch, Kit Kat.
Coffee - Nescafé 3 in 1, Wonka, Nescafé, Nescafé Classic, Nescafé Decaff, Nescafé Dolce
Gusto, Nescafé Gold, Nespresso.
Culinary, Chilled & Frozen Food - Buitoni, Herta, Hot Pockets, Lean Cuisine, Maggi,
Stouffer's, Thomy.
Diary - Carnation, Coffee-mate, La Laitiere, Nido
Drinks - Juicy Juice, Milo, Nesquik, Nestea
Food Service - Chef, Chef-mate, Lean Cuisine, Minor's, Sjora, Stouffer's
Healthcare Nutrition - Boost, Nutren Junior, Peptamen, Resource.
IceCream - Dreyer's, Extreme, Haagen-Dazs, Movenpick, Nestle icecream.
Petcare - Alpo, Bakers Complete, Beneful, Cat Chow, Chef Michael’s Canine Creations,
DogChow,Fancy Feast, Friskies, Gourmet, Purina, Purina ONE, Purina Pro Plan
Sports nutrition - PowerBar
Weight Management - Jenny Craig
8/3/2019 A POM Asg1 11007 Aseem
http://slidepdf.com/reader/full/a-pom-asg1-11007-aseem 7/25
6
GLOBAL PRESENCE:
Nestlé's unmatched geographic presence is one of its competitive advantages. From Swiss
beginnings, the company grew to establish a presence in almost every country in the world.
Today, Nestlé's presence in most markets, including emerging markets, dates back many
generations, and in some cases more than a century.
This has created very close relationships between the brands and consumers, as well as a
deep understanding of local needs and trends wherever Nestlé operates. Local management
teams, manufacturing, R&D have all been developed, as well as long-term relationships with
farmers and other suppliers.
NESTLÉ INDIA:
Nestlé India is a subsidiary of Nestlé S.A. of Switzerland. With seven factories and a largenumber of co-packers, Nestlé India is a vibrant Company that provides consumers in India
with products of global standards and is committed to long-term sustainable growth and
shareholder satisfaction.
The Company insists on honesty, integrity and fairness in all aspects of its business and
expects the same in its relationships. This has earned it the trust and respect of every strata
of society that it comes in contact with and is acknowledged amongst India's 'Most
Respected Companies' and amongst the 'Top Wealth Creators of India'.
PRESENCE ACROSS INDIA:
After nearly a century-old association with the country, today, Nestlé India has presence
across India with 7 manufacturing facilities and 4 branch offices spread across the region.
With an employee-strength of over 3000 and turnover of US$ 497 million in 2003, Nestle
India is one of the leading companies in the FMCG space in India. The company is
acknowledged amongst India’s ‘Most Respected Companies’ and amongst the ‘Top Wealth
Creators of India’.
Nestlé India’s first production facility, set up in 1961 at Moga (Punjab), was followed soon
after by its second plant, set up at Choladi (Tamil Nadu), in 1967. Consequently, Nestlé India
set up factories in Nanjangud (Karnataka), in 1989, and Samalkha (Haryana), in 1993. This
was succeeded by the commissioning of two more factories - at Ponda and Bicholim, Goa, in
1995 and 1997 respectively. The seventh factory was set up at Pantnagar, Uttarakhand, in
2006.
The 4 branch offices in the country help facilitate the sales and marketing of its products.
They are in Delhi, Mumbai, Chennai and Kolkata. The Nestlé India head office is located in
Gurgaon, Haryana.
8/3/2019 A POM Asg1 11007 Aseem
http://slidepdf.com/reader/full/a-pom-asg1-11007-aseem 8/25
7
During the first half 2004, the company registered a total income of US$ 257.8 million and
net profit of US$ 23.73 million. Nestlé India is a 61.85 per cent subsidiary of Ne s t l e S .A.
Switzerland and was incorporated as a limited company in 1959. It produces a wide range of
products including beverages, prepared dishes and cooking aids, milk products and
nutrition, chocolate and confectionery. Milk products and nutrition account for around 45per cent of Nestlé India’s total revenues. The company’s beverage products generate 22 per
cent of the company’s total revenues, while prepared dishes and cooking aids generate 18
per cent, and chocolate and confectionery 15 per cent.
PRODUCTS IN INDIA:
Milk Products & Nutrition:
NESTLÉ EVERYDAY Dairy Whitener, EVERYDAY Ghee, Milk, Slim Milk, Dahi,Slim
Dahi,Bhuna Jeera Raita,NESVITA Dahi,Real Fruit Yoghurts, Creamy Vanilla,MILKMAID,NESLAC, ACTIPLUS, NESTLÉ Start Healthy Stay Healthy.
Beverages:
Nescafé Classic, Nescafé Sunrise Premium, Nescafé Sunrise Special, Nescafé Cappuccino,
Nestea Iced Tea With Green Tea, Nestea Iced Tea, Nestea Instant Hot Tea Mixes, Nescafé
3in1.
Prepared Dishes & Cooking Aids:
Maggi 2-Minute Noodles, Maggi Vegetable Atta, Maggi Noodles, Maggi Cuppa Mania, Maggi
Healthy Soups, Maggi Masala-ae-Magic, Maggi Sauces, Maggi Pichkoo, Maggi Pizza
Mazza, Maggi Magic Cubes, Maggi Vegetable Multigrainz Noodles, Maggi Bhuna Masala,
Maggi Coconut Milk Powder, Maggi Pazzta, Maggi Sanjeevni Cup Soup, Maggi Imli Pichkoo,
Maggi Noodletz.
Chocolates & Confectionery:
Nestlé Kit Kat, Nestlé Munch, Nestlé Munch Pop Choc, Nestlé Milkybar,Nestlé Milkybar
Choo, Nestlé Bar-One, Nestlé Milk Chocolate, Polo, Nestlé Eclairs, Nestlé Milkybar Eclairs,Nestlé Milkybar Crispy Wafer, Polo - Hole New Fashion, Nestlé Dark Chocolate.
PERFORMANCE:
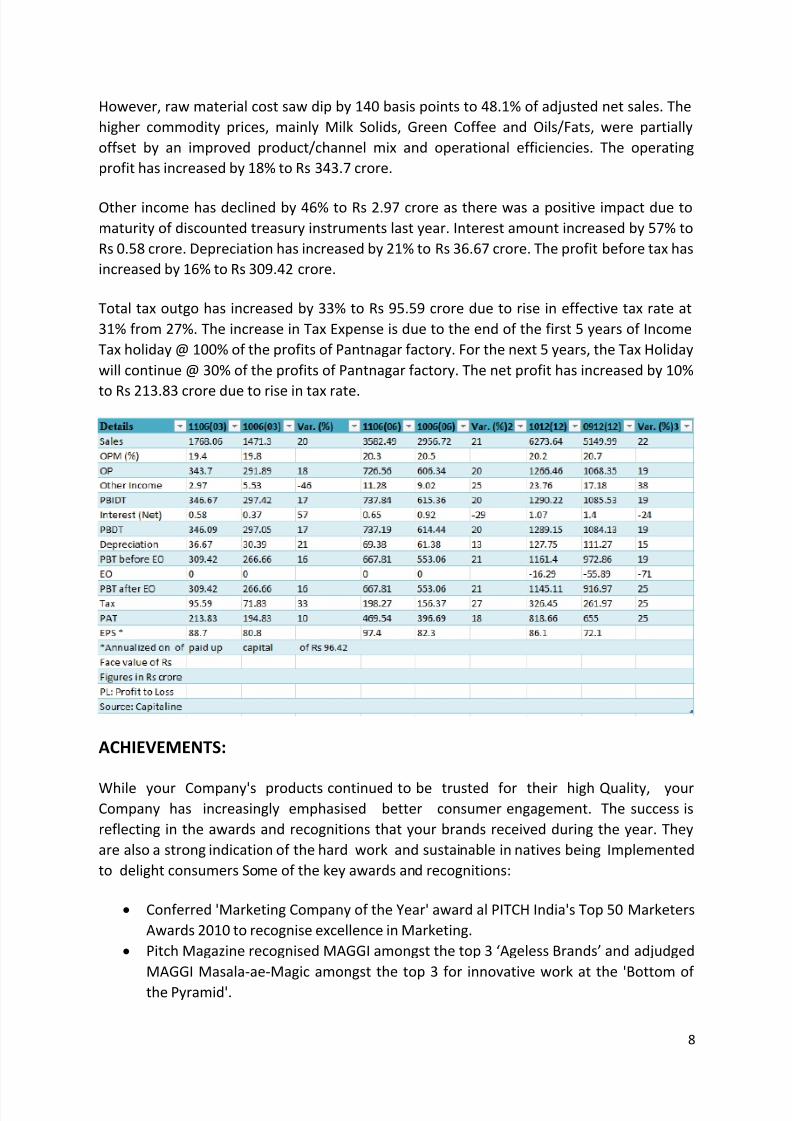
The net sales has increased by 20% to Rs 1768.06 crore. Net domestic sales increased by
21% to Rs 1643.48 crore on back of volume and selling price growth. The export sales
inclined by 11% to Rs 119.57 crore. Export growth has been adversely impacted by the ban
on export of milk powder.
The OPM has declined by 40 basis points to 19.4% due to rise in other expenditure by 80basis points to 23% and employee expenses by 50 basis points to 7.7% of adjusted net sales.
8/3/2019 A POM Asg1 11007 Aseem
http://slidepdf.com/reader/full/a-pom-asg1-11007-aseem 9/25
8
However, raw material cost saw dip by 140 basis points to 48.1% of adjusted net sales. The
higher commodity prices, mainly Milk Solids, Green Coffee and Oils/Fats, were partially
offset by an improved product/channel mix and operational efficiencies. The operating
profit has increased by 18% to Rs 343.7 crore.
Other income has declined by 46% to Rs 2.97 crore as there was a positive impact due to
maturity of discounted treasury instruments last year. Interest amount increased by 57% to
Rs 0.58 crore. Depreciation has increased by 21% to Rs 36.67 crore. The profit before tax has
increased by 16% to Rs 309.42 crore.
Total tax outgo has increased by 33% to Rs 95.59 crore due to rise in effective tax rate at
31% from 27%. The increase in Tax Expense is due to the end of the first 5 years of Income
Tax holiday @ 100% of the profits of Pantnagar factory. For the next 5 years, the Tax Holiday
will continue @ 30% of the profits of Pantnagar factory. The net profit has increased by 10%
to Rs 213.83 crore due to rise in tax rate.
ACHIEVEMENTS:
While your Company's products continued to be trusted for their high Quality, yourCompany has increasingly emphasised better consumer engagement. The success is
reflecting in the awards and recognitions that your brands received during the year. They
are also a strong indication of the hard work and sustainable in natives being Implemented
to delight consumers Some of the key awards and recognitions:
Conferred 'Marketing Company of the Year' award al PITCH India's Top 50 Marketers
Awards 2010 to recognise excellence in Marketing.
Pitch Magazine recognised MAGGI amongst the top 3 ‘Ageless Brands’ and adjudged
MAGGI Masala-ae-Magic amongst the top 3 for innovative work at the 'Bottom of
the Pyramid'.
8/3/2019 A POM Asg1 11007 Aseem
http://slidepdf.com/reader/full/a-pom-asg1-11007-aseem 10/25
9
NESTEA Voted 'Product of the Year' in the powdered beverages category by Nielsen's
Consumer Survey of product innovation 2010.
KIT KAT adjudged 'Master Brand' by the World Brand Congress.
MAGGi Masala-ae-Magic recognised amongst 'The Chartbusters' of 2010 by The
Economic Times. 'NESCAFE Know Your Neighbours' campaign amongst Top 5 'Most Liked' Digital
Campaigns of 2010 listing by AFAQS.
MAGGI again rated the No. 1 Food Brand in India by an ICMR consumer study.
'Me and Meri MAGGI' campaign recognised by Campaign India Digital Media
Awards-Silver for Best Website' (FVCG) and Bronze for Best Loyalty Campaign'.
MAGGI rated amongst India's Top 10 Buzziest Brands by AFAQS Survey 2010.
'Me and Meri MAGGI' advertising campaign received Silver and Bronze Awards at
2010 ABBV'S.
Coffee Board Awards for Best Exporter of Coffee to Russia and CIS, and Second Best
Exporter of instant Coffee, (2009-2010). In a survey by Business Today and indicus Analytics to understand external
perceptions Nestle India amongst the section toppers for FMCG on Best Companies
to Work for 2010.
8/3/2019 A POM Asg1 11007 Aseem
http://slidepdf.com/reader/full/a-pom-asg1-11007-aseem 11/25
8/3/2019 A POM Asg1 11007 Aseem
http://slidepdf.com/reader/full/a-pom-asg1-11007-aseem 12/25
11
Nestle is committed to preventing accidents, injuries and illness related to work, and to
protect employees, contractors and others involved along the value chain.
SUPPLIERS AND CUSTOMERS
7. Supplier and customer relations
We require our suppliers, agents, subcontractors and their employees to demonstrate
honesty, integrity and fairness, and to adhere to our non-negotiable standards. In the
same way, we are committed to our own customers.
8. Agriculture and rural development
Nestle contributes to improvements in agricultural production, the social and economic
status of farmers, rural communities and in production systems to make them more
environmentally sustainable.
9. Environmental sustainability
Nestle commits themselves to environmentally sustainable business practices. At all
stages of the product life cycle Nestle strives to use natural resources efficiently, favour
the use of sustainably-managed renewable resources, and target zero waste.
10. Water
We are committed to the sustainable use of water and continuous improvement in
water management. We recognise that the world faces a growing water challenge and
that responsible management of the world’s resources by all water users is an absolute
necessity.
SUPPLY CHAIN:
The current volatile and complex economic environment requires efficient and cost
effective processes. During 2010 your Company has ensured timely and efficient supply of
materials to run the factories, accelerating the development of local suppliers. Thedistribution of finished goods to consumers across the country continues to be cost
effective and more environmental friendly with increasing share of rail deliveries.
During the year, the Company also delivered sustainable coat optimisation initiatives
as part of Nestle Continuous Excellence (NCE) to eliminate waste and manage input costs.
This year the NCE programme will be expanded further to cover all supply chain
processes and select distribution centres.
In line with the philosophy of Creating Shared value, Nestle India rolled out its Responsible
Sourcing programme in 2010. All the key vendors were engaged on this Initiative through
8/3/2019 A POM Asg1 11007 Aseem
http://slidepdf.com/reader/full/a-pom-asg1-11007-aseem 13/25
12
procurement led vendor meets at the Company's Head office and factories Vendors wore
supported through a pre-assessment process, consultant visits, dedicated help desk and
continuous engagement and education All vendors were registered on the SEDEX platform
and independent Audits by internationally approved agencies were conducted on the key
vendors shortlisted All these vendors were found compliant with minor gaps for which roadmaps have been agreed mutually.
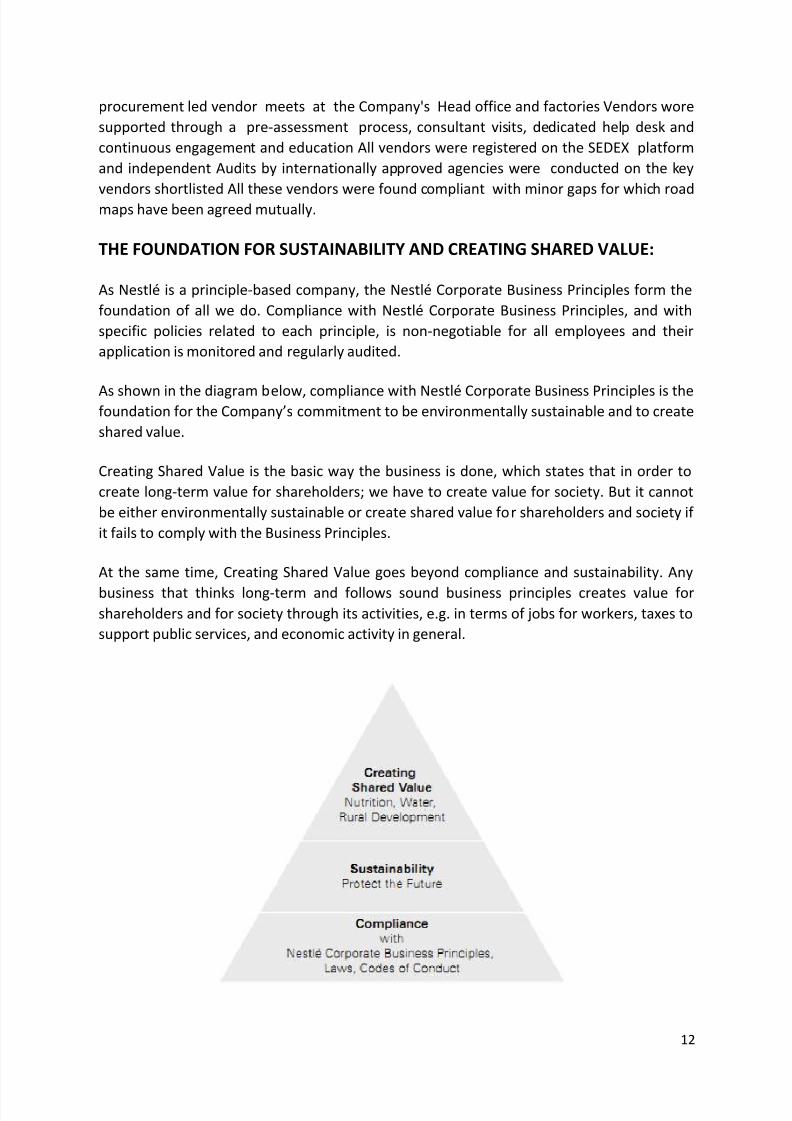
THE FOUNDATION FOR SUSTAINABILITY AND CREATING SHARED VALUE:
As Nestlé is a principle-based company, the Nestlé Corporate Business Principles form the
foundation of all we do. Compliance with Nestlé Corporate Business Principles, and with
specific policies related to each principle, is non-negotiable for all employees and their
application is monitored and regularly audited.
As shown in the diagram below, compliance with Nestlé Corporate Business Principles is thefoundation for the Company’s commitment to be environmentally sustainable and to create
shared value.
Creating Shared Value is the basic way the business is done, which states that in order to
create long-term value for shareholders; we have to create value for society. But it cannot
be either environmentally sustainable or create shared value for shareholders and society if
it fails to comply with the Business Principles.
At the same time, Creating Shared Value goes beyond compliance and sustainability. Any
business that thinks long-term and follows sound business principles creates value forshareholders and for society through its activities, e.g. in terms of jobs for workers, taxes to
support public services, and economic activity in general.
8/3/2019 A POM Asg1 11007 Aseem
http://slidepdf.com/reader/full/a-pom-asg1-11007-aseem 14/25
13
But Creating Shared Value goes one step further. A company consciously identifies areas of
focus, where: a) shareholders’ interest and society’s strongly intersect, and b) where value
creation can be optimised for both. As a result, the company invests resources, both in
terms of talent and capital, in those areas where the potential for joint value creation is the
greatest, and seeks collaborative action with relevant stakeholders in society.
Nestlé have analysed the value chain and determined that the areas of greatest potential for
joint value optimisation with society are Nutrition, Water and Rural Development. These
activities are core to the business strategy and vital to the welfare of the people in the
countries where it operates.
Nestle actively seek engagement and partnerships with outside stakeholders that optimise
positive impact in these areas of focus. However, Creating Shared Value is not about
philanthropy. It is about leveraging core activities and partnerships for the joint benefit of
the people in the countries where we operate.
In doing so, Nestlé maintains a very long-term perspective on business development and
welcomes dialogue with external stakeholders who are committed to principled behaviour
and constructive engagement. This includes government and regulatory authorities,
intergovernmental organisations, non-governmental organisations, academic and
professional bodies, and local communities.
PROBLEMS FACED & MEASURES TAKEN:
Battle for market share starts eating into revenues and margins of Nestle. As there isintense competition in the FMCG sector, companies are battling for market shares.
This has resulted in the reduction of shares of the companies.
The year 2011 saw some near term challenges like inflation and irregular monsoon,
which impacted its margin and profitability harder. The rise in raw material costs
took a toll on the operating margins across companies. The increasing competition
among players also resulted in greater Advertising & Promotion (A&P) expenses of
majority FMCG companies barring a few. To tackle the input cost pressure, the have
already taken price hikes or are planning to rise prices to protect margins from
erosion. Fast Moving Consumer goods has a tough time in calendar 2011. The slowdown in
the economy has led to shrinking disposable incomes, leading to degrowth in various
segments of the industry. As a result, the industry is bogged down by down trading,
wherein users move to low priced inferior products, to satisfy their basic needs
within their shrinking budget.
8/3/2019 A POM Asg1 11007 Aseem
http://slidepdf.com/reader/full/a-pom-asg1-11007-aseem 15/25
14
PRODUCTIVITY
SECTOR TRENDS:
The FMCG sector saw new launches, re-launches and acquisitions in 2010 contributing to
the sector's phenomenal top-line growth of 15% led largely by volumes. But the year also
saw some near term challenges like inflation and irregular monsoon, which impacted its
margin and profitability harder. The rise in raw material costs took a toll on the operating
margins across companies, with margins contracting by approx. 200 bps to 500 bps. The
increasing competition among players also resulted in greater Advertising & Promotion
(A&P) expenses of majority FMCG companies barring a few. To tackle the input cost
pressure, the have already taken price hikes or are planning to rise prices to protect margins
from erosion. FMCG sector also saw lots of acquisitions in other emerging as well as
developed markets, which would also be earnings accretive in the long run. The sector islikely to perform in medium to long term as favourable demand scenario.
Industry Expectations
Focus on the rural areas to continue. Sustained focus on agriculture growth. Direct
subsidy to farmers to be reviewed.
Continued thrust and higher allocations to social and developmental programs –
especially MGNREGA.
Increase in tax slabs for personal income tax
No change in Cenvat rate, considering the high inflation and rising input prices
No increase in excise duties for cigarettes, given strong increase last year.
Full exemption from excise duty for packaged water from current 8% and biscuit,
which has currently 4% duty. Also full exemption on sanitary napkin from 10% level.
Reduction in excise duty on sugar confectionary from 10% to 4% and condensed milk
from 10% to 4% - 8%.
Increase in service tax from 10% to 12%
Reduction of MAT rate – currently applicable at 18%
Reduction in dividend distribution tax from currently 15% (1.66% surcharge +
education cess) to 10%. Roadmap for FDI in retail sector
Roadmap for implementation of DTC and GST
Analysts/market expectations :
Higher allocations to social and development programs targeted for rural India – like
Indira Gandhi Vikas Yojana, NREGA, Bharat Nirman, Indira Awas Yojana and Krishi
Vikas Yojana
8/3/2019 A POM Asg1 11007 Aseem
http://slidepdf.com/reader/full/a-pom-asg1-11007-aseem 16/25
15
We believe the excise duty on cigarettes may remain unchanged or may be
marginally rise in this Budget after a 15% increase in the effective excise rate in the
last Budget.
Cenvat rate to increase from 10% to 12% - full rollback of fiscal stimulus granted in
FY09-10. MAT increase may happen as it could be a step towards direct tax code.
Outlook:
The Indian fast moving consumer goods (FMCG) sector with a market size of Rs 130000
crore is the fourth largest sector in the Indian economy. The sector has grown at a CAGR of
11% over the last decade and is expected to sustain the strong growth on the back of strong
domestic consumption in the long run. Robust GDP growth estimated at 8.75% in FY11,
increased income in rural areas, growing urbanisation and changing lifestyle of consumers
would be key growth drivers for companies. However, the high food inflation and thesurging input cost are likely to affect its growth in the near term. Hence, we expect the
government to provide some support to the sector in the upcoming budget.
8/3/2019 A POM Asg1 11007 Aseem
http://slidepdf.com/reader/full/a-pom-asg1-11007-aseem 17/25
16
COMPETITIVENESS
INDUSTRY - FOOD AND DAIRY PRODUCTS – MULTINATIONAL
India is the world's second largest producer of food next to China, and has the potential of
being the biggest with the food and agricultural sector. The total food production in India is
likely to double in the next ten years and there is an opportunity for large investments in
food and food processing technologies, skills and equipment, especially in areas of Canning,
Dairy and Food Processing, Specialty Processing, Packaging, Frozen Food/Refrigeration and
Thermo Processing. Fruits & Vegetables, Fisheries, Milk & Milk Products, Meat & Poultry,
Packaged/Convenience Foods, Alcoholic Beverages & Soft Drinks and Grains are important
sub-sectors of the food processing industry.
Nestle India is ranked No. 1 in the Indian food and dairy products industry. The competitors
of Nestle in India are Britannia Industries, Cadbury India, GlaxoSmith C H L, Perfetti Van Mel,
Heinz India and Jubilant foods.
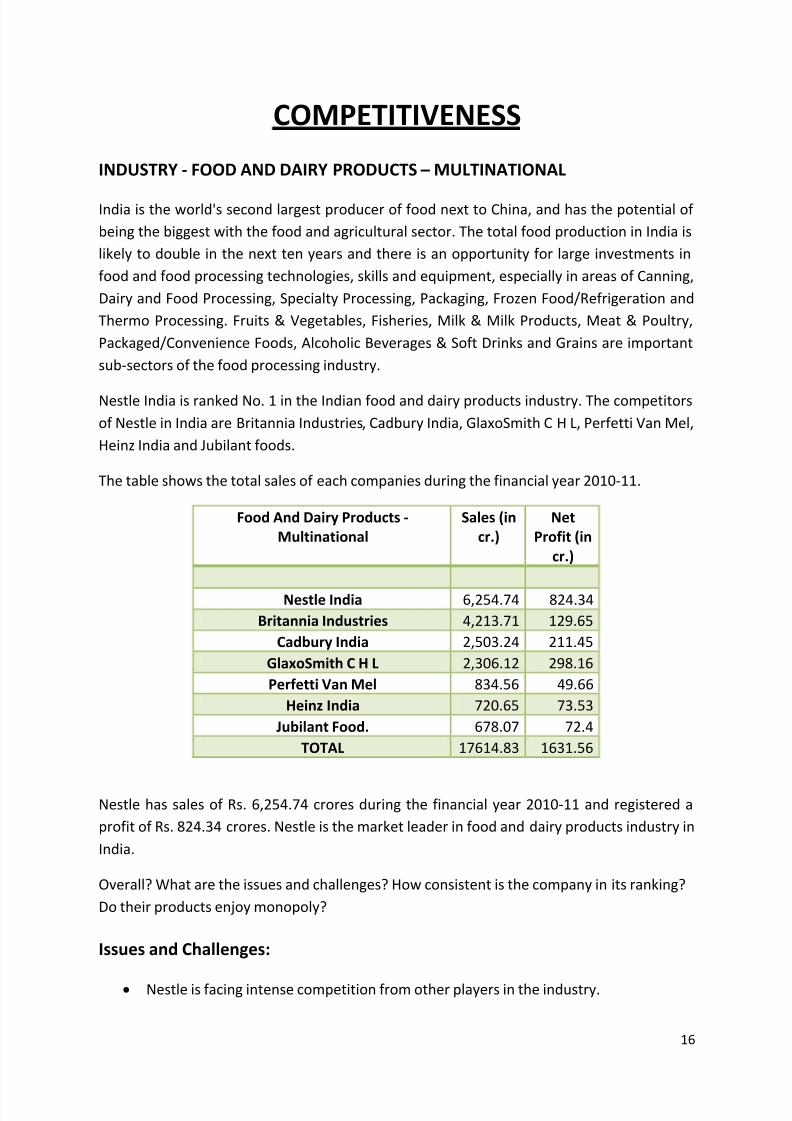
The table shows the total sales of each companies during the financial year 2010-11.
Food And Dairy Products -Multinational
Sales (incr.)
NetProfit (in
cr.)
Nestle India 6,254.74 824.34
Britannia Industries 4,213.71 129.65
Cadbury India 2,503.24 211.45
GlaxoSmith C H L 2,306.12 298.16
Perfetti Van Mel 834.56 49.66
Heinz India 720.65 73.53
Jubilant Food. 678.07 72.4
TOTAL 17614.83 1631.56
Nestle has sales of Rs. 6,254.74 crores during the financial year 2010-11 and registered a
profit of Rs. 824.34 crores. Nestle is the market leader in food and dairy products industry in
India.
Overall? What are the issues and challenges? How consistent is the company in its ranking?
Do their products enjoy monopoly?
Issues and Challenges:
Nestle is facing intense competition from other players in the industry.
8/3/2019 A POM Asg1 11007 Aseem
http://slidepdf.com/reader/full/a-pom-asg1-11007-aseem 18/25
17
Other players are utilising the different possibilities prevalent in the market and
registering good growth.
Even Indian diary players like AMUL are giving good competition to Nestle in the
diary sector.
Nestle has to launch innovative products in the market to maintain its market leaderposition.
Also, Nestle can consider more diversification in the Indian industry.
Consistency in Ranking:
Nestle is consistently the market leader for the past few years in India. Nestle has improved
productivity and operations to maintain its market leader position throughout in the
industry. Nestle has undergone many changes in its production and operations to maintain
its position. Also, Nestle has made many product changes and modifications to maintain itsposition.
Nestle products like Nescafe, Maggi, Milkybar, etc. are having major share in their own
segment. Maggi has almost a monopoly in the market.
8/3/2019 A POM Asg1 11007 Aseem
http://slidepdf.com/reader/full/a-pom-asg1-11007-aseem 19/25
18
FORECASTING
Forecasting is the process of making statements about events whose actual outcomes
(typically) have not yet been observed. A commonplace example might be estimation for
some variable of interest at some specified future date.
Qualitative forecasting techniques are subjective, based on the opinion and judgment of
consumers, experts; appropriate when past data is not available. It is usually applied to
intermediate-long range decisions.
Quantitative forecasting models are used to estimate future demands as a function of past
data; appropriate when past data is available. It is usually applied to short-intermediate
range decisions.
Example of Quantitative forecasting methods:
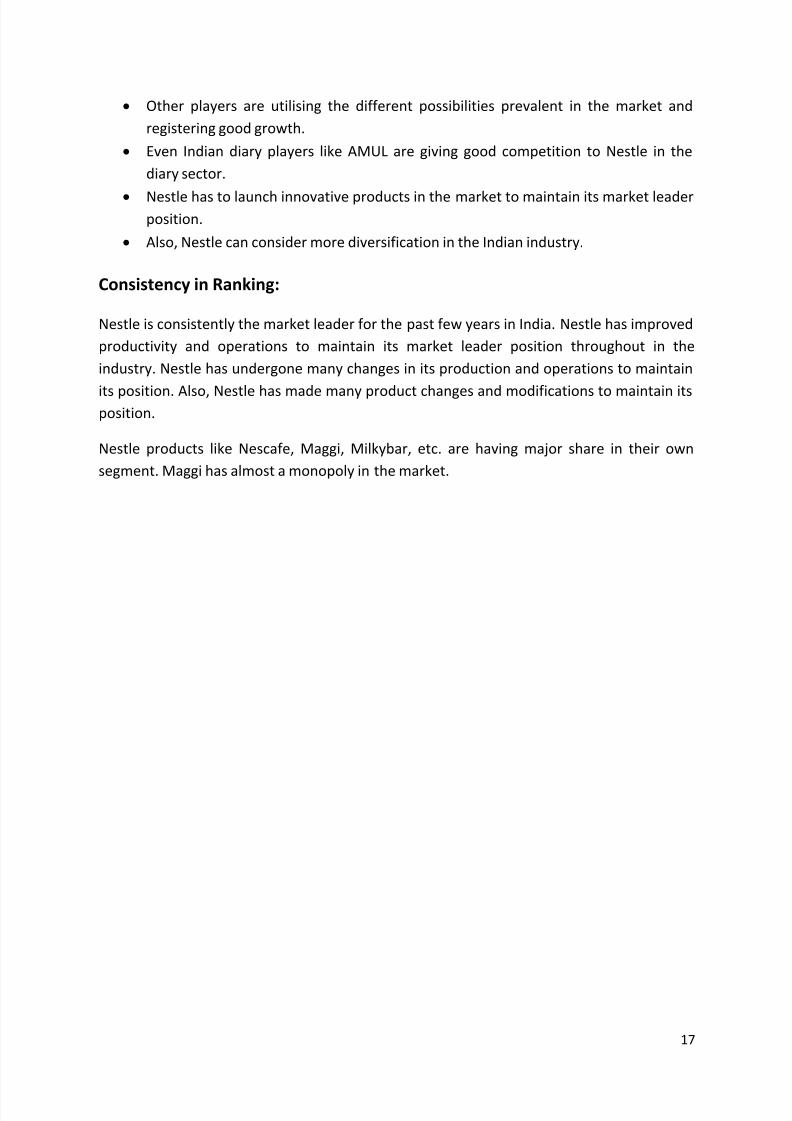
NAÏVE APPROACH:
Naive approach looks at no data past the present
Forecast for the next period is the same for the last period
Does not work with data that is trended or has a clear pattern
In Naïve Approach, forecasting is done considering the data for the last period only.
YearNetSales
2001 1820.48
2002 1935.822003 2140.56
2004 2229.072005 2475.01
2006 2819.16
2007 3500.652008 4327.672009 5129.38
2010 6254.74Forecast for year2011 6254.74
The Net Sales Forecast for the year 2011 using moving average method is Rs. 6254.74
crores.
8/3/2019 A POM Asg1 11007 Aseem
http://slidepdf.com/reader/full/a-pom-asg1-11007-aseem 20/25
19
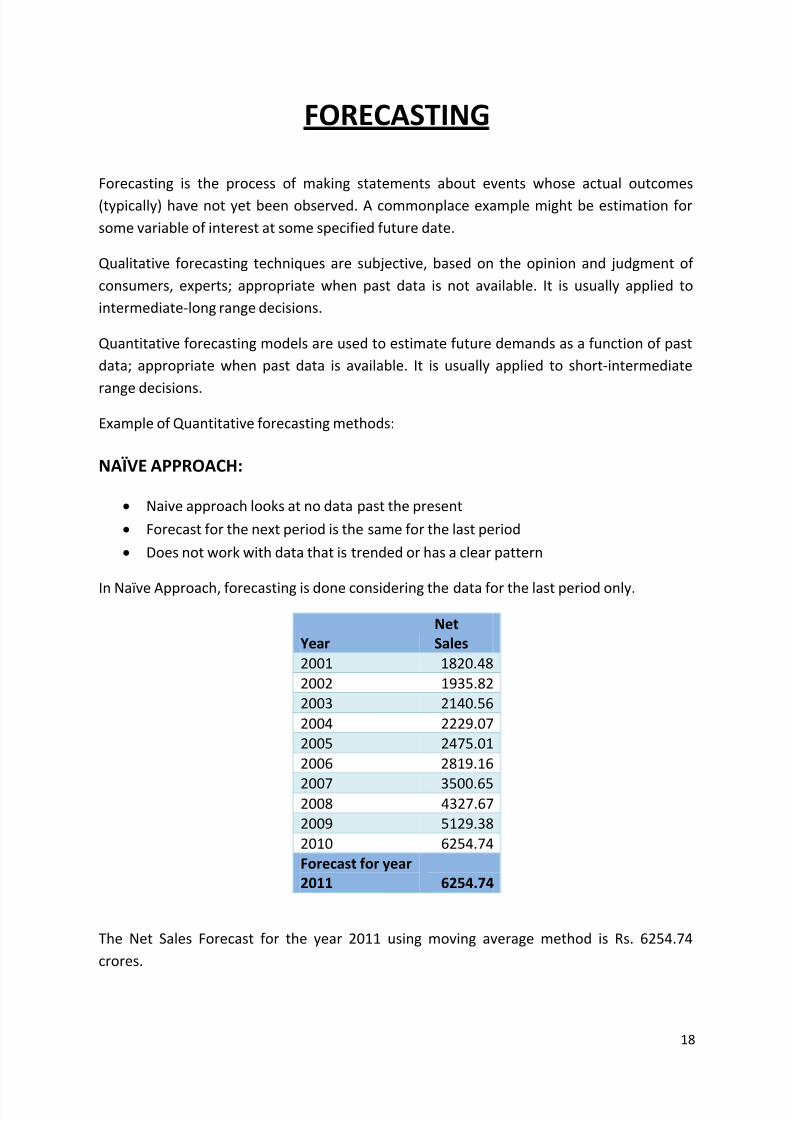
MOVING AVERAGE METHOD:
This simplest forecasting method is the moving average forecast. The method simply
averages of the last m observations. It is useful for time series with a slowly changing mean.
Applying moving average method to forecast the Net Sales of Nestle India in 2011:
Year Net Sales 3 yr. M A Error Abs . Dev Sqr. Error APE
2001 1820.48
2002 1935.82
2003 2140.56
2004 2229.07 1965.62 263.45 263.45 69405.903 0.118188
2005 2475.01 2101.816667 373.1933 373.19333 139273.26 0.150785
2006 2819.16 2281.546667 537.6133 537.61333 289028.1 0.1907
2007 3500.65 2507.746667 992.9033 992.90333 985857.03 0.283634
2008 4327.67 2931.606667 1396.063 1396.0633 1948992.8 0.32259
2009 5129.38 3549.16 1580.22 1580.22 2497095.2 0.308072
2010 6254.74 4319.233333 1935.507 1935.5067 3746186.1 0.309446Forecast for year2011 5237.263333 7078.95 7078.95 9675838.4 1.683415
The Net Sales Forecast for the year 2011 using moving average method is Rs. 5237.263
crores.
The error calculation in this forecast is given below:
Error Values
CFE 7078.95
Mean Error 1011.279
MAD 1011.279Mean squareerror 1382263
MAPE 24.04879
WEIGHTED MOVING AVERAGE:
Weighted moving average is a moving average where each historical demand may be
weighted differently.
Average: At = W1 Dt + W2 Dt-1 + W3 Dt-2 + ... + WN Dt-N+1
8/3/2019 A POM Asg1 11007 Aseem
http://slidepdf.com/reader/full/a-pom-asg1-11007-aseem 21/25
20
where:
N = total number of periods in the average
Wt = weight applied to period t's demand
Sum of all the weights = 1
forecast: Ft+1 = At = forecast for period t+1
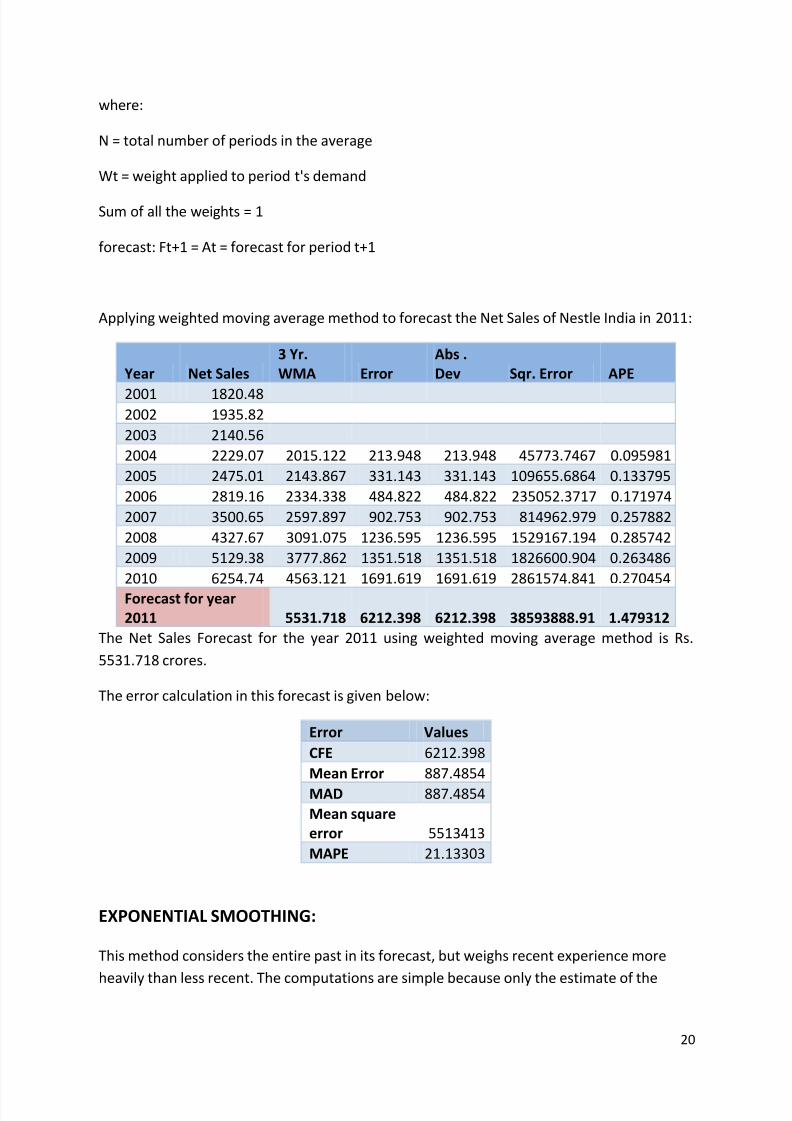
Applying weighted moving average method to forecast the Net Sales of Nestle India in 2011:
Year Net Sales3 Yr.WMA Error
Abs .Dev Sqr. Error APE
2001 1820.482002 1935.82
2003 2140.56
2004 2229.07 2015.122 213.948 213.948 45773.7467 0.095981
2005 2475.01 2143.867 331.143 331.143 109655.6864 0.133795
2006 2819.16 2334.338 484.822 484.822 235052.3717 0.171974
2007 3500.65 2597.897 902.753 902.753 814962.979 0.257882
2008 4327.67 3091.075 1236.595 1236.595 1529167.194 0.285742
2009 5129.38 3777.862 1351.518 1351.518 1826600.904 0.263486
2010 6254.74 4563.121 1691.619 1691.619 2861574.841 0.270454
Forecast for year2011 5531.718 6212.398 6212.398 38593888.91 1.479312
The Net Sales Forecast for the year 2011 using weighted moving average method is Rs.
5531.718 crores.
The error calculation in this forecast is given below:
Error Values
CFE 6212.398
Mean Error 887.4854
MAD 887.4854Mean squareerror 5513413
MAPE 21.13303
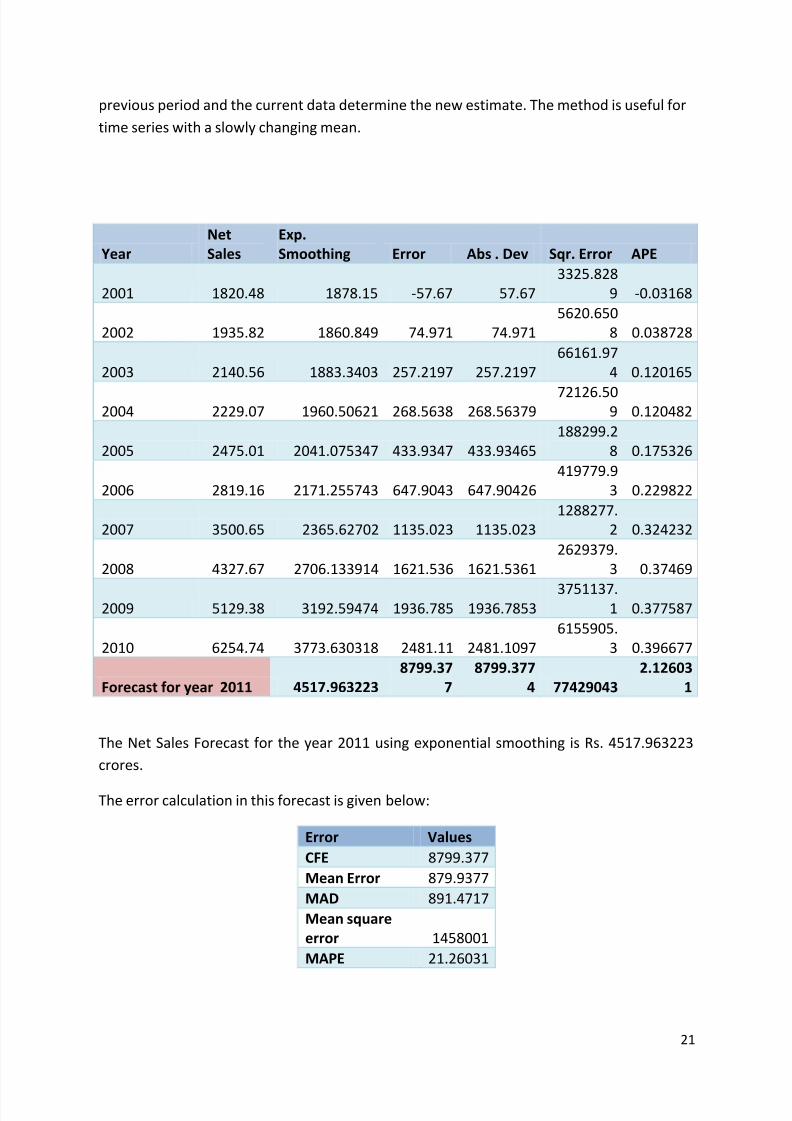
EXPONENTIAL SMOOTHING:
This method considers the entire past in its forecast, but weighs recent experience more
heavily than less recent. The computations are simple because only the estimate of the
8/3/2019 A POM Asg1 11007 Aseem
http://slidepdf.com/reader/full/a-pom-asg1-11007-aseem 22/25
21
previous period and the current data determine the new estimate. The method is useful for
time series with a slowly changing mean.
YearNetSales
Exp.Smoothing Error Abs . Dev Sqr. Error APE
2001 1820.48 1878.15 -57.67 57.673325.828
9 -0.03168
2002 1935.82 1860.849 74.971 74.9715620.650
8 0.038728
2003 2140.56 1883.3403 257.2197 257.219766161.97
4 0.120165
2004 2229.07 1960.50621 268.5638 268.5637972126.50
9 0.120482
2005 2475.01 2041.075347 433.9347 433.93465188299.2
8 0.175326
2006 2819.16 2171.255743 647.9043 647.90426419779.9
3 0.229822
2007 3500.65 2365.62702 1135.023 1135.0231288277.
2 0.324232
2008 4327.67 2706.133914 1621.536 1621.53612629379.
3 0.37469
2009 5129.38 3192.59474 1936.785 1936.78533751137.
1 0.377587
2010 6254.74 3773.630318 2481.11 2481.10976155905.
3 0.396677
Forecast for year 2011 4517.9632238799.37
78799.377
4 774290432.12603
1
The Net Sales Forecast for the year 2011 using exponential smoothing is Rs. 4517.963223
crores.
The error calculation in this forecast is given below:
Error Values
CFE 8799.377
Mean Error 879.9377
MAD 891.4717
Mean squareerror 1458001
MAPE 21.26031
8/3/2019 A POM Asg1 11007 Aseem
http://slidepdf.com/reader/full/a-pom-asg1-11007-aseem 23/25
22
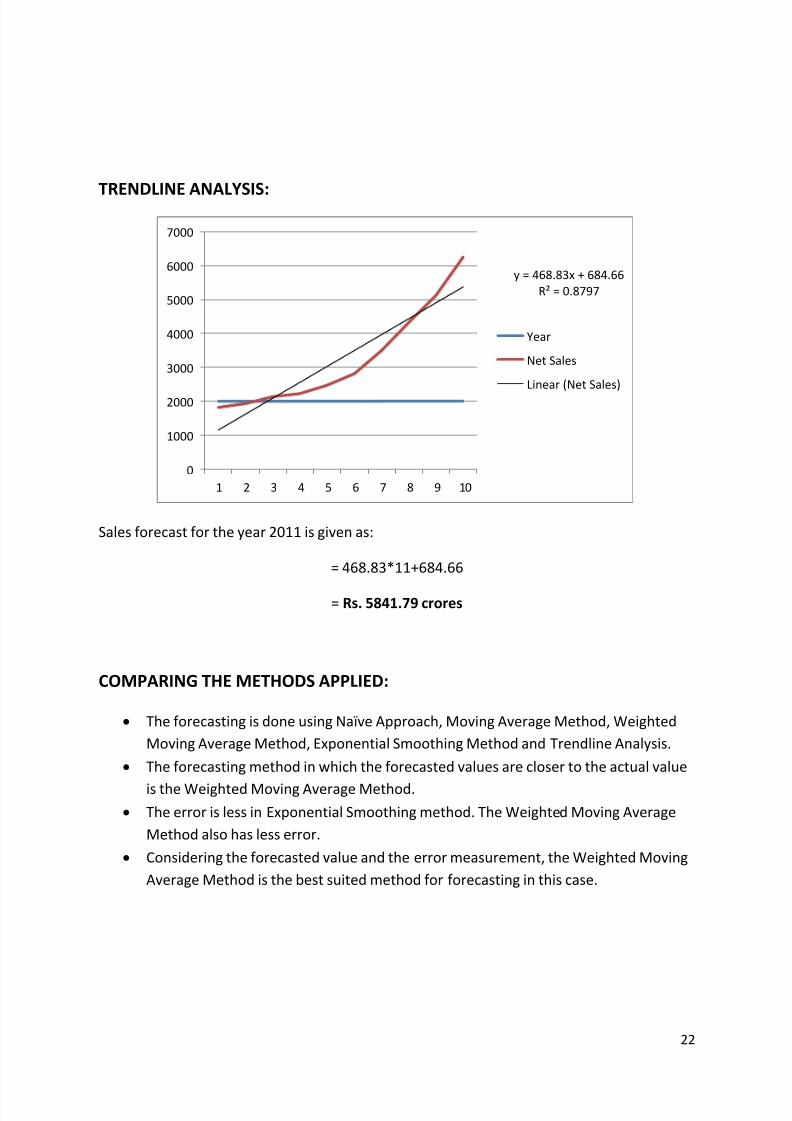
TRENDLINE ANALYSIS:
Sales forecast for the year 2011 is given as:
= 468.83*11+684.66
= Rs. 5841.79 crores
COMPARING THE METHODS APPLIED:
The forecasting is done using Naïve Approach, Moving Average Method, Weighted
Moving Average Method, Exponential Smoothing Method and Trendline Analysis.
The forecasting method in which the forecasted values are closer to the actual value
is the Weighted Moving Average Method. The error is less in Exponential Smoothing method. The Weighted Moving Average
Method also has less error.
Considering the forecasted value and the error measurement, the Weighted Moving
Average Method is the best suited method for forecasting in this case.
y = 468.83x + 684.66R² = 0.8797
0
1000
2000
3000
4000
5000
6000
7000
1 2 3 4 5 6 7 8 9 10
Year
Net Sales
Linear (Net Sales)
8/3/2019 A POM Asg1 11007 Aseem
http://slidepdf.com/reader/full/a-pom-asg1-11007-aseem 24/25
23
QUALITY CHECK OF THE REPORT
All data collected for the report are from reliable sources and utmost care is taken
while framing the report.
The operations management concepts are applied to the best of my knowledge in
the report.
All important details are included in the report.
The details included in the report are:
o History of the company, Promoters and owners, Segment or sector, Products
and services offered, Location and capital structure, Performance, Significant
achievements – awards, milestones.o Operations Strategy - The Ten Principles of Business Operations, Supply
Chain, The Foundation for Sustainability and Creating Shared Value, Problems
Faced & Measures taken.
o Productivity - Sector Trends, Industry Expectations, Analysts/market
expectations, Outlook.
o Competitiveness -Industry-Food and Dairy Products Multinational, Issues and
Challenges, Consistency in Ranking, Forecasting.
o Forecasting Techniques - Naïve Approach, Moving Average Method,
Weighted Moving Average, Exponential Smoothing, Trendline Analysis,Comparing the Methods Applied.
The operations management of the company is discussed in detail in the report
including the forecasting techniques which can be applied.
8/3/2019 A POM Asg1 11007 Aseem
http://slidepdf.com/reader/full/a-pom-asg1-11007-aseem 25/25
REFERENCES
http://www.nestle.com/Pages/Nestle.aspx
http://nestle.in/nestle_india_landing.aspx
Lee J, Krajewski and Larry P Ritzman. Operations Mangement: Strategy and Analysis ,
6th Edition. - New Delhi: Pearson Education Asia.xxv. 882p.
Lee J, Krajewski and Larry P Ritzman, Manoj K Malhotra., Operations Management:Processes and Supply Chains, 9th Edition. - New Delhi: Pearson Education Asia.
http://web.ebscohost.com/ehost/results?sid=2f98c8b2-a0be-4722-96ea-
804d1aac4969%40sessionmgr10&vid=3&hid=8&bquery=(nestle)&bdata=JmRiPWJza
CZkYj1id2gmZGI9bHhoJmRiPThnaCZ0eXBlPTAmc2l0ZT1laG9zdC1saXZl