a polymer model of bacterial supercoiled dna including
TRANSCRIPT

HAL Id: hal-02283136https://hal.archives-ouvertes.fr/hal-02283136
Submitted on 10 Sep 2019
HAL is a multi-disciplinary open accessarchive for the deposit and dissemination of sci-entific research documents, whether they are pub-lished or not. The documents may come fromteaching and research institutions in France orabroad, or from public or private research centers.
L’archive ouverte pluridisciplinaire HAL, estdestinée au dépôt et à la diffusion de documentsscientifiques de niveau recherche, publiés ou non,émanant des établissements d’enseignement et derecherche français ou étrangers, des laboratoirespublics ou privés.
A polymer model of bacterial supercoiled DNAincluding structural transitions of the double helix
Thibaut Lepage, Ivan Junier
To cite this version:Thibaut Lepage, Ivan Junier. A polymer model of bacterial supercoiled DNA including structuraltransitions of the double helix. Physica A: Statistical Mechanics and its Applications, Elsevier, 2019,527, pp.121196. �10.1016/j.physa.2019.121196�. �hal-02283136�

A polymer model of bacterial supercoiled DNAincluding structural transitions of the double helix
Thibaut Lepage, Ivan Junier
CNRS, TIMC-IMAG, F-38000 Grenoble, France
Univ. Grenoble Alpes, TIMC-IMAG, F-38000 Grenoble, France
Abstract
DNA supercoiling, the under or overwinding of DNA, is a key physical mecha-nism both participating to compaction of bacterial genomes and making genomicsequences adopt various structural forms. DNA supercoiling may lead to theformation of braided superstructures (plectonemes), or it may locally destabi-lize canonical B-DNA to generate denaturation bubbles, left-handed Z-DNA andother functional alternative forms. Prediction of the relative fraction of thesestructures has been limited because of a lack of predictive polymer models thatcan capture the multiscale properties of long DNA molecules. In this work, weaddress this issue by extending the self-avoiding rod-like chain model of DNAso that every site of the chain is allocated with an additional structural de-gree of freedom reflecting variations of DNA forms. Efficient simulations of themodel reveal its relevancy to capture multiscale properties of long chains (hereup to 21 kb) as reported in magnetic tweezers experiments. Well-controlled ap-proximations further lead to accurate analytical estimations of thermodynamicproperties in the high force regime, providing, in combination with experiments,a simple, yet powerful framework to infer physical parameters describing alter-native forms. In this regard, using simulated data, we find that extension curvesat forces above 2 pN may lead, alone, to erroneous parameter estimations as aconsequence of an underdetermination problem. We thus revisit published datain light of these findings and discuss the relevancy of previously proposed setsof parameters for both denatured and left-handed DNA forms. Altogether, ourwork paves the way for a scalable quantitative model of bacterial DNA.
Keywords: DNA polymer modeling, DNA supercoiling, Multiscale polymermodels, DNA structural transitions
1. Introduction
In bacteria, and probably in numerous eukaryotes, genome-wide coordinationof transcription primarily relies on the physics of DNA in interaction with RNApolymerases [1, 2]. Understanding bacterial transcription coordination there-fore requires understanding the physics of DNA, more specifically the physics
Preprint submitted to Physica A April 26, 2019
arX
iv:1
904.
1145
3v1
[ph
ysic
s.bi
o-ph
] 2
5 A
pr 2
019

of under and over-wound DNA [3, 4, 5, 6, 7, 8], also known as DNA supercoil-ing. DNA is indeed continually processed in cells by topoisomerases [9], whoseactivity allows relaxing the transient constraints generated by replication andby transcription itself, both processes tending to overwind DNA downstreamand to underwind it upstream [10, 11]. As a result, bacterial DNA is gener-ally underwound, which is commonly referred to as the negative supercoilingof bacterial genomes. In model organisms, and probably in most bacteria [12],this negative supercoiling is further partitioned into approximately 10 kb longtopologically independent domains [13, 14].
Although supercoiling is produced at specific sites (e.g. at the target sites ofgyrases), it may impact DNA globally as a consequence of the conservation ofthe linking number. This linking number, Lk, is equal to the sum of the twist(Tw), the cumulative helicity of the molecule, plus the writhe (Wr), the globalintricacy of the molecule [15]. Thus, for topologically constrained DNA as inthe case of circular molecules (e.g. plasmids), of topologically constrained lineardomains [10], or when DNA molecules are manipulated by magnetic tweezers [16,17, 18], any local variation of the twist results in a global variation of thewrithe, and reciprocally. As a consequence, negative DNA supercoiling leadsto both superstructuring participating to the global compaction of bacterialchromosomes (through e.g. the formation of so-called plectonemes) and to localmodifications of the double helix structure. The latter can induce the formationof functionally important DNA forms different from B-DNA [19, 20], includingdenaturation bubbles [21], cruciforms [22], left-handed Z-DNA [23] and left-handed L-DNA [24, 25, 26, 27].
One of the most important challenges raised by the biophysical and func-tional characterizations of bacterial genomes thus consists in predicting the mul-tiscale distribution of supercoiling constraints. Such prediction nevertheless re-mains challenging, with often no other solution than to resort to numericalsimulations [28]. In this regard, two main types of DNA polymer models havebeen proposed. On one hand, explicit polymer models have allowed investi-gating supercoiling-induced phenomena on the basis of numerical simulationsof single DNA chains [29, 30, 31, 32]. On the other hand, phenomenologicalmodels [33, 34] have led to bona fide analytical solutions of thermodynamicproperties. These have been particularly useful to infer microscopic parametersof alternative DNA forms [25, 34], whose knowledge is crucial to both addressthe exact nature of these forms and parametrize explicit polymer models.
Explicit polymer models can be further divided into two types. Dependingon the addressed question, structural details can indeed be coarse-grained atthe scale of a single nucleotide [32, 35] or at a larger scale of a few tens basepairs [29, 30, 31, 36]. Single nucleotide resolution models have thus been usefulto investigate properties of small (i.e. a few hundreds base pairs) DNA moleculesas provided by cryo-electron microscopy [28, 37] and cyclization data [20], withthe possibility to investigate sequence effects in detail (see e.g. [38] and referencestherein). Tens base pairs resolution models have instead been useful to addressboth mechanical and conformational properties of long (i.e. a few kb or tens kb)B-DNA molecules, taking advantage of much less time-consuming simulations
2

and of the possibility to use parsimonious sets of parameters that can capturebending, torsional and self-avoidance properties of molecules [15, 20]. Alongthis line, the self-avoiding rod-like chain (sRLC) model [29] has been paramountto analyze folding properties of positively supercoiled molecules (see below fordetails of the model). These include molecular extensions [39], torques [40,41, 42] and conformation details of superstructures [29, 43, 42] as measured bymagnetic tweezers and cryo-electron microscopy, as well as dynamical properties(see [44] and references therein) and sequence-dependent phenomena [45, 46].
The sRLC model has thus provided a solid framework to infer physical pa-rameters of B-DNA [15, 31]. To the best of our knowledge, it has however notyet been adapted to the co-existence of multiple DNA forms, precluding itsuse to investigate functional properties of bacterial genomes in vivo and leav-ing open several important biophysical questions. These include the balancebetween the global and local relaxations of supercoiling constraints, the exactnature of alternative forms (see e.g. [27] for a recent discussion about the exper-imental identification and characterization of denatured DNA (D-DNA) withrespect to L-DNA) and, related to this, the inference of associated mechanicalparameters. Namely, while some of the parameters, such as the free energyformation of left-handed DNA forms and of their associated junctions with B-DNA, have been estimated early on in bulk studies [22, 23, 47, 48, 49, 50, 51],the estimation of, e.g., the torsional and bending moduli of D-DNA and left-handed forms, has thus far relied exclusively on phenomenological models inthe context of single molecule studies [33, 25, 26, 52, 34]. These models, whichare based on bona fide free energy landscape descriptions of the co-existence ofmultiple DNA forms, have however never been quantitatively assessed, whichmay explain the existence of strong discrepancies in the prediction of some ofthe parameters [25, 34].
In this work, we aim at filling these gaps by extending the sRLC modelso that it includes the possibility to have multiple DNA forms. To this end,we follow an approach initially proposed to tackle the problem of the largeflexibility of small DNA molecules [53]. Namely, as proposed in [54, 55, 56], thesoftening of sharply bent DNA can be rationalized by considering a structuraldegree of freedom allowing the appearance of alternative forms more flexiblethan B-DNA, with a free energy cost reflecting the destabilization of the doublehelix. More elaborated models including torsional energies, but still neglectingDNA self-avoidance, have then been proposed to investigate the statistics ofDNA denaturation [57] and the behavior of stretched DNA molecules [58] undertorsional constraints. Models based on torsional energies alone have also beenstudied in the context of the statistics of DNA denaturation [59, 60] as well asto model properties of specific DNA sequences [26].
Following these studies, here we consider a version of the sRLC model, here-after referred to as the 2sRLC model, which includes an additional structuraldegree of freedom. Using numerical simulations, we first demonstrate the abil-ity of the 2sRLC model to reproduce magnetic tweezers experiments of longmolecules (up to 21 kb) for a wide range of stretching forces and supercoilinglevels typical of bacterial genomes in vivo. We next tackle the inference prob-
3

lem of parameters associated with alternative DNA forms. To this end, wecircumvent the use of time-consuming simulations by deriving semi-analyticalsolutions of the thermodynamics when the writhe is negligible and we showthat these can be used for any value of supercoiling level and stretching forcewhere plectonemic superstructures are absent. As an application, we discussthe validity of the commonly used phenomenological model proposed by JohnMarko [33] and highlight a previously overlooked underdetermination problemrelated to the question of parameter inference, which is immanent to the highforce analysis of single molecule extension curves. We provide, in this context,our best estimates of parameters associated with D-DNA and L-DNA.
2. Theory
2.1. The discrete sRLC model
In the sRLC framework, a double-stranded DNA molecule, usually in theform of B-DNA, is modeled as a continuous self-avoiding chain characterized byfive fundamental parameters: i) a bending modulus (K) defining an associatedpersistence length (`p = K/kBT ), ii) a torsional modulus (C) measured in unitsof twist persistence length, iii) a winding angle at rest (ψ) of the implicitlyembedded helix, iv) the distance (a) between any two consecutive base pairs,thus defining the number of base pairs per `p, and v) an effective radius (re)reflecting the hard-core simplification of the electrostatic repulsion of the DNAbackbone [61]. For B-DNA in physiological conditions ([NaCl] ∼ 100 mM), `ptypically lies in [40−60 nm] [62, 63] (in the following, we use 50 nm), C is on theorder of 100 nm [64, 24], while a = 0.34 nm, ψ = 0.6 rad/bp and re ≈ 2 nm [61].
To simulate the folding of a DNA molecule, a discrete version of the modelis used, for which the continuous formulation is a good approximation if the dis-cretization is sufficiently fine (see hereafter for further details). Specifically, thechain is divided into identical impenetrable cylinders and an additional param-eter, n, specifies the number of base pairs per cylinder used in the simulationsuch that the length of every cylinder is equal to na (Fig. 1A) – in this work,we use n ≤ 10 such that one cylinder corresponds at most to one B-DNA helix.The energy of any conformation C of a self-avoiding linear chain in the presenceof a stretching force, f , then reads:
EsRLC(C) = EB(C) + ET (C)− fz, (1)
where z is the extension of the chain along the axis of the force, while EB(C) =kBT2
∑Ni=1
`pnaθ
2i and ET (C) = kBT
2
∑Ni=1
nCa (φi − ψ)2 respectively stand for the
bending and torsional energies. In these equalities, the index i indicates a sitearound which two consecutive cylinders are articulated, while θi is the bendingangle associated with the n base pairs of the site and φi is the winding angleper base pair (Fig. 1A); this means that nφi is the torsional counterpart of θifor the site i. Note that at the end of the molecule, two additional sites (ati = 0 and i = N + 1) set the boundary conditions, which here correspond toa situation where the orientation of the external cylinders is kept fixed along
4

A
B
Figure 1: A. Discrete version of the sRLC: two complete cylinders surrounding a site i arerepresented along with their local frames (~t, ~u,~v) used to compute the bending angle θi andthe schematically depicted twist angle per bp φi. B. Extension of the model by allocatinga variable s specifying the DNA form of every site. In this case, for symmetry reasons, thelength of a cylinder located between sites k − 1 and k is equal to n(ask−1 + ask )/2, meaningthat cylinders may have different lengths because of the different values of as characterizingthe different forms. Here, we depict the case where sites i − 1 and i are under the B form(chain in blue), while sites i+ 1 and i+ 2 are denatured (chain in red). We also indicate by agray disk the domain wall penalty, J , associated with the structural cost for transiting fromone form to the next.
the force axis. Altogether, a linear chain made of Nbp base pairs thus containsN + 1 sites and N segments (N = Nbp/n = L/na where L is the contour lengthof the molecule). A circular chain (e.g. a plasmid) would contain N sites andN segments, the first site joining the last and first segments together.
Importantly, just as θi, φi can be explicitly written as a function of the localframes associated with the surrounding cylinders [65] (Fig. 1A). Using Tw ≡(2π)−1
∑Ni=1 nφi, this ensures that the linking number, Lk = Tw + Wr, remains
strictly constant for any deformation of a circular chain, provided the chain nevercrosses itself. Lk then reflects the topological status of the DNA molecule, forinstance a supercoiling constraint if it is different from the corresponding valueat rest, Lk0. For a linear chain, conservation of the linking number furtherrequires the ends of the chain to be attached to two impenetrable walls [39, 66].These respectively play the role of the fixed surface and of the magnetic beadin single-molecule experiments.
2.2. The discrete 2sRLC model: including multiple DNA forms
In order to include varying DNA forms at every site i of the sRLC, we followthe lines of denaturation studies [59, 54, 55, 56, 57, 58] and associate a statevariable s with every site (s = B, D, L or Z if one considers for instance B-DNA,
5

D-DNA, L-DNA and Z-DNA) specifying the associated mechanical parameters:Ks (persistence length `s), Cs, as and ψs – for simplicity, here we consider aform-independent electrostatic radius re. In this context, the length of cylindersmay vary as a result of both a varying value for as and a fixed number of basepairs per cylinder (n); here, for symmetry reasons, we consider the length of acylinder surrounded by two sites with forms s and s′ to be equal to n(as+as′)/2(Fig. 1B).
In addition to form-dependent mechanical parameters, alternative DNAforms come along with free energy formation costs on the order of one kBTper bp [67, 68], reflecting the internal deformation of base pairing and base pairstacking. Here, we denote this cost by γ0s and set γ0B = 0 (reference form).Finally, a domain wall penalty, J , must be considered between any two siteshaving different states. This penalty accounts for the internal free energy costto transit from one DNA form to another one [69, 57, 52] (Fig. 1B) – in effect, itconstrains alternative forms to gather in as few domains as possible. This wallpenalty is in principle associated with two consecutive base pairs and thereforeincludes an entropic contribution on the order of ln(n) coming from the n possi-ble choices of these base pairs. For simplicity, here we consider this contributionas already included in the values of J .
Altogether, the energy of a self-avoiding 2sRLC conformation C having anarbitrary sequence {si}i=1..N of DNA forms reads:
E2sRLC(C) = Eγ(C) + EB(C) + ET (C) + EJ(C)− fz, (2)
where Eγ(C) = n∑Ni=1 γ
0si is the total free energy formation costs coming from
alternative forms, EB(C) = kBT2
∑Ni=1
`sinasi
θ2i is the bending energy, ET (C) =
kBT2
∑Ni=1
nCsi
asi(φi − ψsi)
2 is the torsional energy and EJ(C) = J∑N−1i=1 (1 −
δsi,si+1) is the total wall penalty, with δsi,si+1
= 1 if si = si+1, 0 otherwise.
3. Results and discussion
3.1. Effective 2sRLC model
Solving the thermodynamics of the 2sRLC model is challenging because ofthe self-avoidance constraints. Yet, following upon previous studies on singleDNA forms [70] and on the statistics of DNA denaturation [59, 60], it is possibleto integrate out the torsional degrees of freedom (the φi’s) under the constraintof a fixed Lk. This leads to an equivalent effective model that has the benefit tooffer much better simulation performances [39, 42] and further analytic treat-ment (see below). In the case of the 2sRLC model, the resulting conformationalenergy can be decomposed as in Eq. 2, but with an effective free energy of forma-tion and an effective torsional energy that respectively read (see Supplementary
6

methods inSupplementary material for details):
Eeffγ (C) = n
N∑
i=1
γsi where γsi = γ0si −1
2nlnasiCsi
(3)
EeffT (C) =kBT
2
[Nbp
χ(C)
(2π
Tw(C)Nbp
− ψ(C))2
+ ln(χ (C))]
(4)
where, again, Nbp = nN is the length of the molecule in base pairs, ψ(C) ≡∑Ni=1 ψsi
/N and χ(C) ≡∑N
i=1asiCsi
/N are conformation-dependent average quan-
tities, namely, the average twist angle per bp at rest and the average torsionalsusceptibility per bp.
Eq. 4 thus generalizes to the case of any number of different DNA forms thepossibility, for topologically constrained DNA molecules, to obtain an equivalenteffective model with a torsional energy quadratic in Tw. Note, nevertheless, thathere the associated parameters depend on the composition of the molecule inthese DNA forms. In the particular case of a single (B-DNA) form, one forinstance recovers ψ(C) = ψB and χ(C) = aB/CB for all conformations, such
that EeffT (C) =kBTCBNbp
2aB
(2πTw(C)
Nbp− ψB
)2as demonstrated in [70].
3.2. Capturing the phenomenology of negatively supercoiled DNA
To demonstrate the ability of the 2sRLC model to capture the phenomenol-ogy of negatively supercoiled DNA, we performed Monte-Carlo simulations oflong chains using the above effective energies. To this end, we have adapted thestandard Monte-Carlo procedure used to simulate the equilibrium folding of thesRLC model [31] in order to include the possibility for mechanical parametersto change at any site of the chain, at any iteration of the simulation (see [66]for details). In practice, it involves a new transition type so that for any site iindependently of the other sites, the value of the variable si may change underthe constraint of detailed balance. Corresponding variations of cylinder lengths(Fig. 1B) are thus managed as other elementary Monte-Carlo moves. In partic-ular, if they lead to a collision, the transition is rejected. More generally, lengthvariation of a cylinder always requires an adjustment of the positions and orien-tations of the surrounding cylinders to preserve the continuity of the chain. Asexplained in [66], this is realised by performing specific random rotations thatare constrained by the geometry of the chain.
Using this Monte-Carlo method, we could quantitatively reproduce exten-sions of several kilo base pairs long molecules as obtained in magnetic tweezersexperiments for a wide range of forces and supercoiling densities σ = (Lk −Lk0)/Lk0. As an example, we report in Fig. 2 both our simulation results andthe experimental results of Cees Dekker’s lab [27] for a 21 kb molecule, forσ ∈ [−0.05, 0.05], f = 0.5 pN and f = 4.5 pN, providing as a bonus a predic-tion of the equilibrium fraction of alternative forms present along the molecule(top panel). DNA denaturation being expected to be the most likely alternativeform at these forces and supercoiling densities [26, 27], here we considered the
7

Figure 2: Extension of a 21 kb molecule as a function of σ, for different forces, obtainedexperimentally (in red and blue, data from [27]) and numerically using a 2sRLC model thatincludes the possibility to have B-DNA plus an alternative DNA form along the chain (seemain text for values of the microscopic parameters). Error bars and colored areas representone standard deviation due to thermal fluctuations. At low forces, the curves are symmetricalwith respect to σ, with the formation of branched plectonemic structures at large values of |σ|as indicated by the typical conformations observed in the simulations (leftmost and rightmostpanels). At high forces, the buckling transition toward the plectonemic regime occurs only forpositive supercoiling. For negative supercoiling, denaturation bubbles appear instead (upperleft panel, in red). Upper panel: corresponding estimation of the equilibrium fraction λ∗ ofthe alternative form as a function of σ.
situation where only B-DNA and D-DNA could form, with the following pa-rameters leading to good agreement with experimental curves: aD = 0.45 nm,`D = 15 nm, CD = 10 nm and γD = 2kBT (see below for discussion of these val-ues) – we intentionally used a `D much larger than the 4 nm diameter of the chainbecause smaller values would lead, in any case, to larger effective persistencelengths [71]. We used J = 10kBT , in accord with previous analyses [69, 26, 52],and considered a discretization level of n = 10, leading to ' 3.3 cylinders per `Dand 15 cylinders per `B(= 50 nm), a value that both offers reasonable computa-tional times and ensures properties of B-DNA superstructuring to be insensitiveto discretization procedures [42, 66]. Finally, the quantitative reproduction ofthe buckling transition at σ > 0 (right part of the curves in Fig. 2) required usto use C = 80 nm at f = 4.5 pN and C = 100 nm at f = 0.5 pN (Fig. S1). Thisis in accord with the observed systematic discrepancies occurring at low forcesbetween sRLC and experimental extensions [72], a consequence of a couplingbetween torsional and bending deformations stemming from the asymmetry ofthe DNA helix [73].
8
Our simulations corroborate well-known results of magnetic tweezers exper-iments, with notably the presence of two regimes (Fig. 2): i) a low force regime(f . 0.5 pN) that is symmetric under the transformation σ → −σ and wheretorsional stress is partially relaxed through the formation of plectonemes, someof them being branched, and ii) a σ-asymmetric high force regime (f & 2 pN)where negative torsional stress is partially relaxed by forming denaturation bub-bles. For intermediate forces at σ < 0, both conformations with denaturationbubbles and plectonemic conformations become locally stable, being separatedby high free energy barriers (Fig. S2). This is in accord with the experimen-tal findings, in this regime, of large equilibrium fluctuations of the extension[74, 34], which have been shown, in the case of a 2.4 kb long molecule, toreflect a two-state behavior between plectonemic conformations and conforma-tions with D-DNA bubbles [34]. In our simulations of comparable 2.4 kb longmolecules, this manifests through an hysteresis cycle in the force-extension di-agram (Fig. S2), with the drawback that specific numerical methods, such asmetadynamics [75], must be developed in this regime to get access to thermo-dynamic properties, including the height of the free energy barriers.
Our simulations also corroborate the existence of conformations where de-naturation bubbles locate at the apex of plectonemes (Fig. S3). These havebeen predicted to occur using a polymer model of DNA coarse-grained at thenucleotide level [76]. Here, we observe that these tip-bubble conformations, ascoined in [76], are all the more favored that the system is close to the ”spin-odal” point associated with the plectonemic state – the force at which the freeenergy barrier separating pure plectonemic states from states with denaturationbubbles becomes on the order of kBT .
Most importantly, while trying to reproduce previously published experi-mental extensions, we have found that different sets of parameters could leadto similar results. For instance, the D-DNA persistence length used in Fig. 2 istypically 5 times larger than that previously estimated [33, 25], while previousworks have led to values of the torsional modulus that may differ by more than20-fold [25, 34]. Overall, this raises the question of the extent to which it is pos-sible to infer mechanical parameters of alternative forms using extension curvesalone as obtained in magnetic tweezers experiments, what we discuss now indetail.
3.2.1. Zero writhe approximation in the high force regime
One could in principle use the above numerical simulations to search for setsof parameters that best reproduce extension curves. However, independently ofthe efficiency of simulations, an exhaustive exploration of the 5 parameters (`D,CD, aD, ψD and γ0D) and the domain wall penalty J is extremely challenging.Moreover, the high free energy barriers separating plectonemic conformationsfrom conformations with D-DNA bubbles precludes obtaining the relative frac-tion of each state at equilibrium using standard Monte-Carlo methods. Curvesat intermediate forces between 0.5 pN and 2 pN cannot thus be currently ex-ploited to further constrain parameters as previously done in the context ofphenomenological models [34].
9

To partially circumvent these problems, we focus on the regime of high forces,for which the thermodynamics can be solved in the approximation of both a neg-ligible writhe, i.e. when Lk = Tw, and negligible self-avoidance properties (seebelow for the range of forces where this approximation holds). In this approx-imation, it is indeed possible to obtain an explicit formula for the free energyprofile of the system, Ff,σ({λi}), as a function of the fraction of each of thepossible alternative forms at a given stretching force f and supercoiling densityσ. In the following, for simplicity we discuss the case of two forms, with inmind B-DNA plus a certain fraction λ of an alternative form, hereafter denotedas X-DNA – the generalization to more than two forms is straightforward (seeSupplementary methods).
Calling J (λ) the free energy associated with the multiple possibilities todistribute the λN sites of the alternative form into distinct domains (see SI forits derivation), gs,f (Ls) the free energy of the WLC at force f associated withthe form s with contour length Ls, and using the notations χs = as/Cs andχ/ψ(λ) = (1− λ)χB/ψB + λχs/ψs, we obtain (Supplementary methods):
Ff,σ(λ) = λNbpγX + J (λ)︸ ︷︷ ︸free energy formationof alternative domains
+ gX,f (λNbpaX) + gB,f ((1− λ)NbpaB)︸ ︷︷ ︸bending+stretching
+kBT
2
[Nbp
χ(λ)
(1 + σ − ψ(λ)
ψB
)2
+ ln (χ(λ))
]
︸ ︷︷ ︸torsion
(5)
Using this free energy profile, equilibrium properties of the 2sRLC modelin the zero writhe approximation can be computed by performing numericalintegration over λ of Boltzmann-weighted observables (see Eq. 10 in Supple-mentary methods and subsequent explanations) with, here, a particular in-terest in equilibrium values of the extension, z∗ = −〈∂fFf,σ(λ)〉λ, the torqueΓ∗ = (2πTw0)−1〈∂σFf,σ(λ)〉λ (see Supplementary methods for derivation andfurther details), and the fraction of alternative form, λ∗ = 〈λ〉λ, where 〈•〉λ ≡∫dλ • exp [−Ff,σ(λ)/kBT ]
/ ∫dλ exp [−Ff,σ(λ)/kBT ]. We also compute the
equilibrium number of domains, X∗, using a free energy surface in the (λ,X)space (Eq. 6 in Supplementary methods).
3.2.2. Validity domain of the zero writhe approximation
To assess the validity domain of the zero-writhe approximation, we comparethe above Boltzmann-weighted equilibrium values to those obtained in Monte-Carlo simulations of the corresponding 2sRLC model. As a case study, weinvestigate a 1 kb long molecule with an alternative form characterized by `X =15 nm, aX = 0.54 nm, ψX = 0, CX = 10 nm and γX = 1.6kT , having in mind aform close to D-DNA; just as in the analysis of Fig. 2, the relatively high value of`X compared to previous estimations for D-DNA (3− 4 nm [33, 25]) was chosenfor practical purposes, that is, to avoid potential artifacts that may occur inthe simulations when the persistence length is smaller or on the order of re [66]and to avoid considering (longer) effective persistence lengths in our analytical
10

Figure 3: Comparison between numerical simulations, the zero writhe approximation andMarko’s phenomenological approach for the equilibrium value of different quantities of inter-est as a function of the negative supercoiling: the fraction λ∗ of denatured alternative form, thenumber X∗ of alternative domains, the torque Γ∗ and the extension of the molecule (relativeto its contour length under the single B form). Error bars represent one standard deviationdue to thermal fluctuations; in particular, this reveals that torque fluctuations are large. Forreadability, the green points (2 pN) and red points (10 pN) have respectively been slightlyshifted left and right with respect to the exact values of σ: 0,−0.1,−0.2,−0.3,−0.4,−0.5(−0.015,−0.02,−0.025,−0.03 in the inset of X∗). The transition between fully stretched con-formations and plectonemic conformations (where the approximation does not hold anymore)occurs between 1 and 2 pN. For all panels: the apparent absence of error bars implies thatthey are smaller than symbols.
approximations [71]. We also used a fine discretization level of n = 4 to geta large number of cylinders per `D (' 7) so that to prevent any discrepancycoming from the discretization procedure of the rod-like chain.
Regarding λ∗ and the extension, we observe an excellent agreement betweensimulation results and the zero-writhe approximation for any force above 2 pN(left panels in Fig. 3), with a relative error lower than 5% (Fig. S4). For thenumber of domains the error is on the order of 20% (a higher error is expectedas a consequence of the discrete nature of X), and up to 30% for the torque(side effect of the error in X∗). Most remarkably, this agreement is observedfor a wide range of supercoiling densities, from the transition point at physio-logical σ ' −0.025 associated with the onset of the first denaturation bubble(see inset in upper right panel of Fig. 3) to large non-physiological negativevalues of σ = −0.5, and for forces down to the onset of plectonemic superstruc-tures. The strong deviation observed at 1 pN is indeed the result of a buckling
11

transition that occurs in the simulations, which is not captured by the zerowrithe approximation. In other words, the zero writhe approximation providesa good description of the system whenever plectonemic superstructures are ab-sent, paving the way for an efficient method for the quantitative inference ofphysical properties of alternative DNA forms in the high force regime (see be-low). In this regard, we note that the inclusion of finite size corrections [77] forcomputing the WLC terms gX,f and gB,f leads to very similar results (Fig. S5),suggesting the possibility to use the classical infinite length approximation ofthe WLC [78], although the fraction of alternative form may be large.
We finally used the same simulations to assess the validity of the commonlyused phenomenological approach proposed by John Marko a decade ago [33].In a nutshell, Marko proposed a model with two separated phases (B-DNA andX-DNA), each of them being allocated with a certain supercoiling density anda free energy that is quadratic in the latter; the two supercoiling densities arecoupled because of the conservation of the linking number. Then, supposing alinear relationship between the fraction λ of X-DNA and the total supercoilingdensity (σ) and considering the torques to be equal in both phases, Markoused a free energy minimization procedure to compute the supercoiling densitiesspecific to each phase, leading back to the computation of the free energy as afunction of σ. Here, our analysis shows that this phenomenological approachprovides as well a remarkable description of the 2sRLC equilibrium properties(Fig. 3), excluding the number of domains, X, which is not a variable of themodel [33].
3.3. Inferring mechanical parameters of alternative forms from extension curves
Alternative DNA forms mostly occur in presence of B-DNA. Estimation oftheir parameters, which ultimately reflect statistical properties of the dynam-ics of strands, has thus been a matter of debate. Both bulk [67] and single-molecule [68] measurements have nevertheless converged to free energy forma-tions of D-DNA on the order of one kBT per bp. Cyclization measurements ofsmall circular DNA molecules have also revealed an independence of D-DNAstrands, suggesting to use φD = 0 [79]. A zero-writhe phenomenological mod-eling of these experiments have then led to aD = 0.54 nm, `D ' 2 to 3 nm andCD = 1 nm [79]. In contrast, investigation of the co-existence of D-DNA withB-DNA at forces . 1 pN and |σ| . 0.06, using a phenomenological model ofthe coexistence of twisted B-DNA, plectonemic B-DNA, and D-DNA, has ledto CD = 28 nm [34]. Regarding left-handed DNA forms, static and dynamiclaser light scattering experiments of Z-DNA solutions led to `Z ' 200 nm [80],whereas a best fitting procedure using Marko’s phenomenological model revealeda flexible L-DNA form, with aL = 0.48 nm and `L = 3 nm [25], and a torsionalmodulus CL lying between 10 and 20 nm. Similar values of CL were found byinvestigating the collapse of pure L-DNA molecules [26]. Finally, location ofthe buckling transition of such ”pure” L-DNA molecules at high forces led toψL = −0.5 rad/bp [26, 27].
Here, we aim at using the predictive power of our zero writhe approxima-tion of the 2sRLC model (Fig. 3) in order to infer some of the parameters of
12

alternative forms. Specifically, we discuss the possibility, as proposed in [25], toestimate parameters of D-DNA and L-DNA using σ-extension curves, alone, inthe high force regime. To this end, we first test our capacity to recover originalparameters using simulated data and, then, discuss estimations from real data.
3.3.1. Simulated data: assessing parameter inference in an underdeterminationcontext
To test our capacity to recover original parameters (hereafter indicated bya hat, e.g., aX) from simulated σ-extension data, we use as a generative modelthe 2sRLC model under the zero writhe approximation (Eq. 5) and questionthe possibility to recover original parameters using the same generative model.Regarding the inference method, we follow the procedure of [25], which consistsin determining optimal parameters such that extensions of the model best fitexperimental extensions over a wide range of forces and supercoiling densities(Supplementary methods).
First, compared to the other parameters, we find that aX and `X (or equiv-alently KX) have a more systematic impact on σ-extension curves. More pre-cisely, using a large random set of parameters, the various σ-extension curvesappear to be sorted according to the values of both aX and `X , whereas theyappear to be randomized with respect to the values of the other parameters(Fig. 4A, Fig. S6) – we nevertheless note that best fits correspond to valuesof ψX that are distant from ψB (Fig. S6). The goodness of fit can be furtherquantified by computing the root-mean-square deviation (RMSD) of each testedcurve with respect to the original curve. Reporting these RMSDs in the plane(aX , `X) at a given force then reveals the existence of a well-defined continu-ous set of parameters with similar locally optimal solutions and going through(aX , ˆ
X), hereafter called a crest of solutions (Fig. 4B) – note that these so-lutions are always suboptimal with respect to the original set of parameters.The overall shape of this crest reflects the existence of two types of solutions:1) solutions corresponding to almost straight pieces of X-DNA (large `X , theexact value being irrelevant); 2) solutions corresponding to more disordered do-mains (small `X) with longer double helices (larger aX). Most importantly, an
analysis of solutions in the vicinity of (aX , ˆX) corroborates the existence of a
large spectrum of possible values for J , γX , ψX and CX (Fig. S8), meaningthat these parameters cannot be estimated using a single extension curve, i.e.,a single force. Moreover, the presence of the crest implies the existence of somedegeneracy that precludes the unambiguous determination of aX and ˆ
X , too.In principle, the value of CX could be addressed using torque measure-
ments [26], yet only if one has access to λ(σ) (see Supplementary methods).
For aX and ˆX , one might expect that the underdetermination problem akin
to a single force could be resolved by considering multiple forces. However, wefind that, without fixing any other parameters, the crest gets blurrier as theforce increases (blue points in Fig. 4C). To understand this intriguing result,we performed the same analyses but by setting one arbitrary parameter to itsright value. We found that fixing either J or γX leads to the same underdeter-
13

Figure 4: Test of the possibility to recover parameters of an alternative X-DNA co-existingwith B-DNA, using simulated extension curves (red curves in panel A). To this end, wefirst generated σ-extension curves using the zero writhe approximation model of Eq. 5 with aspecifically predefined X-DNA (see main text for parameters). We next performed an inferenceprocedure using the same generative model by producing 10 000 different curves correspondingto a random combination of the 6 parameters of X-DNA. A: σ-extension curves at f = 2 pNwhere the color of each curve is given by the value of one of the parameters: aX (left), `X(center) and γX (right). See Fig. S6 for the other parameters. We can see that, comparedto γX , aX and `X have a well-defined, strong influence on extension curves. In these cases,the curves indeed appear to be sorted as a function of the values of the parameters. B: Eachpoint corresponds to a random set of parameter values, with x- and y-axes corresponding tothe values of aX and `X , respectively. The opacity is inversely correlated (using an arbitrarilyscale) to the root-mean-square deviation (RMSD) of the curves in A with respect to the redone, so that only the best fits are visible. We observe a crest of small RMSD values thatgo through the original parameters (aX , ˆX) (black cross). C: At a higher force (12 pN), thefront is much less visible and the original set of solutions becomes isolated among a broadcloud of RMSD values (in blue). The crest becomes clearer again by setting ψX = ψX(= 0)
and CX = CX(= 10 nm) (in red). The intersection between crests obtained at different forces
then allows for an accurate estimation of aX and ˆX (Fig. S7).
14

mination problem. In contrast, fixing either ψX or CX makes a crest of locallysuboptimal solutions re-appear. However, setting ψX to the right value ψX = 0results in a crest that is off the right solution (aX , ˆ
X) (Fig. S9), a shift thatdisappears only by setting CX = CX (red points in Fig. 4C).
Overall, these results show that inference of aX and ˆX from extension curves
requires to have some prior knowledge about the nature of the alternative form,more particularly about its torsional parameters (ψX and CX). This may beexplained by the fact that the (effective) torsional energy is quadratic in σ, suchthat any parameter that affects this energy is expected to have a large impacton any curve plotted as a function of σ. When the values of ψX and CX areknown, a minimization over all forces then lead to a fair estimation of both aXand ˆ
X which is all the more accurate that the range of available forces is large(the crossing of the different crests of solutions becoming well-defined as shownin Fig. S7).
3.3.2. Experimental data: estimation of D-DNA and L-DNA parameters
To estimate a and ˆp for both D-DNA and L-DNA, we use the data of Sheinin
et al. [25] obtained for 2.2 kb long molecules, which consist of extension curvesmeasured over a wide range of values of σ (from -2.3 to +0.1) and f (from 2.5to 36 pN). In accord with the findings of [27], we further consider that L-DNAoccurs for σ . −1 and, hence, estimate D-DNA and L-DNA parameters usingan optimization procedure of the extension curves for σ lying in [−0.6,−0.1] andin [−1.8,−1.3], respectively. As discussed above, we lift the underdeterminationproblem by setting, on one hand, ψD = 0 and ψL = −0.5 rad/bp and we test,on the other hand, CD = 1 nm as discussed in [25], CD = 28 nm as proposedin [34] and CL = 10 nm in accord with previous estimations [25, 26].
Similar to the case of simulated data, optimizations over forces from 2.5to 12 pN reveals the existence of small islands of optimal solutions, which weconsider as our best estimations of parameters (Fig. 5). For D-DNA (Fig. 5A),CD = 1 nm leads to aD > 0.6 nm and `D close to 1 nm, which are different,although being qualitatively similar, from previous estimations according towhich aD = 0.54 nm and `D ∈ [2−3 nm] (see [25] and references therein). WhenCD = 28 nm, we find aD ∈ [0.45 − 0.5 nm] and `D ∈ [2 − 5 nm]. Note, here,that we used the finest level of chain discretization (n = 1) and we checked thatour results remain identical for rougher coarse-graining up to n = 4 (Fig. S10).The effect of n is indeed expected to affect the exact value of the domain wallpenalty J (see above) and the entropic contribution to the free energy associatedwith the multiple possible positions of the denaturation bubbles (the term J (λ)in Eq. 5, see Supplementary methods). However, as discussed using simulateddata, the former is expected to play only a marginal role in the determination ofaD and ˆ
D, while in the case of a fixed, small number of denaturation bubblesas here (typically one), the latter scales as ln(n).
For L-DNA (Fig. 5B), we find aL ∈ [0.5 − 0.6 nm], which is slightly largerthan previous estimations [25], and `L ∈ [1−2 nm], which is slightly smaller. Inall cases, the small value of `L corroborates that L-DNA is not a pure left-handedstructural form but made of denatured DNA [25, 26].
15

Figure 5: A: Inference of D-DNA parameters using experimental data from [25]. Each pointrepresents the cumulative (over several forces ) RMSD resulting from a best fit procedure ofexperimental extension curves using numerical curves of the 2sRLC model generated underthe zero-writhe approximation (see Eq. 5) and for a given set of parameters. Points are allthe darker that the cumulative RMSD is small (arbitrary scale). For each set of parameters,the cumulative RMSD was computed for σ varying in [−0.6,−0.1] and over 6 different forcesranging from 2.5 to 12 pN. To mitigate underdetermination problems, we set ψD = 0 andtested two values of CD, which are representative of values discussed in the literature [25, 34].For CD = 1 nm (red points), we find an island of optimal solutions characterized by aD >0.6 nm and `D close to 1 nm. For CD = 28 nm, we find aD ∈ [0.45−0.5 nm] and `D ∈ [2−5 nm].The dashed horizontal line in the figure indicates `D = 2 nm. B: Same analysis but for L-DNA.Here, we set ψL = −0.5 rad/bp and test CL = 10 nm [25, 26]. We find aL ∈ [0.5 − 0.6 nm]and `L ∈ [1− 2 nm].
16

To summarize, our results question the compatibility of previously used aD =0.54 nm with reported torsional parameters. They also show the importance ofhaving precise knowledge of a certain number of parameters to be able to fullyexploit magnetic tweezers experiments in the high force regime. In absenceof such prior information (as it is usually the case for real molecules), severalstrategies can be contemplated. For instance, working with an optimizationprocedure that is constrained by both torque curves and extension curves shouldnarrow down the set of parameters leading to good fits. Even in this case,yet, having access to the fraction of the alternative form seems mandatory (seeSupplementary methods). Potential development along this line might comefrom the use of DNA binding proteins sensitive to alternative forms. Additionalconstraints on model parameters could also be imposed using cyclization dataand conformation statistics from cryo-electron microscopy experiments.
3.3.3. Extension of the model by including sequence effects
In effect, our 2sRLC model bridges ”kinkable” worm-like chain models andself-avoiding rod like chain models, which have been developed to respectivelyaddress the high flexibility of sharply bent DNA [53] and the superstructuringproperties of supercoiled B-DNA molecules [15, 20]. By doing so, it opens novelperspectives in the field of supercoiled DNA, not only to better rationalize mag-netic tweezers experiments but also to predict behaviors of bacterial genomesin vivo. In this regard, including sequence effects, such as the tendency of AT-tracks and CpG-tracks to respectively favor DNA denaturation and left-handedforms [81], can be easily realized by using sequence dependent free energy forma-tion costs of alternative forms (the γsi in Eq. 3). As an example, we simulatedthe folding of a 1 kb long molecule where one single site (iAT ) had a much lowerγ0D than the other sites, thus mimicking the presence of an AT-track. Just aspreviously found in a more detailed, base resolution polymer model of DNA [76],we find that for a force f = 1 pN and a supercoiling density σ = −0.06, thesite iAT is systematically denatured and serves as both nucleation and anchorpoints for a plectoneme (Fig. S11).
4. Conclusion
More elaborate 2sRLC models can be contemplated by e.g. including se-quence effects at the level of DNA bending [82, 38]. In particular, by properlydistinguishing intrinsic curvature from stiffness [38], one can expect to quanti-tatively address the structuring properties of bacterial sequences, including thepossible pinning of pure B-DNA plectonemes [83]. In all cases, our ability todevelop truly predictive models of supercoiled DNA depends on our capacity toprecisely infer mechanical parameters of alternative forms, which itself relies onthe derivation of analytical expressions of thermodynamic quantities as a func-tion of system parameters, at least for some range of forces and supercoilingdensities [25, 26, 34]. Here, we have derived simple analytical expressions thataccurately describe the free energy landscape of the 2sRLC model in the approx-imation of zero writhe, providing a powerful alternative to phenomenological
17

approaches. It would then be interesting to compare our analytical results toother exact analytical results obtained in models devoid of self-avoidance [58].It would also be interesting to further expand the free energy landscape inpower series of the writhe. This would allow including additional constraintscoming from data at lower forces where alternative forms co-exist with super-structures [34].
This latter possibility appears to be crucial for unambiguously estimatingparameters of alternative DNA forms. We have indeed shown that the properestimation of a specific parameter may critically depend on the knowledge ofother parameters or, equivalently, on their independent estimation – see e.g. theimpact of the torsional modulus on the estimation of both the distance betweenconsecutive base pairs and the persistence length in Fig. 5B. A systematic par-allel analysis of extension curves together with torque curves (which is par-ticularly adapted to highlight torsional properties) seems therefore necessary.In addition, sequences of interest, like GC or AAT repeats as implemented in[26, 52], could be systematically used to channel the formation of alternativeforms, which would have two main advantages. On one hand, this would allow”controlling” the fraction of the alternative form (λ in Eq. 5), thus lifting animportant unknown of the problem. On the other hand, this would sharpen sig-nals because of stronger cooperative transitions (see e.g. [52]) and, hence, shouldconstrain further model predictions – just as for the co-existence of plectonemicconformations and strecthed conformations with alternative forms (Figs. 2 andS2), this may also require specific numerical methods to efficiently sample thedifferent states at equilibrium. For more general sequences, DNA binding pro-teins sensitive to alternative forms, as used e.g. in [27], might offer solutions tocompute the fraction λ.
Acknowledgements
We thank Ruggero Cortini and Marc Joyeux for their early input in thisproject, Bahram Houchmandzadeh for useful suggestions, Daniel Jost for crit-ical reading of the manuscript and Olivier Rivoire for helpful comments. Wealso thank Cees Dekker and John van Noort for providing us with their experi-mental data. I.J. is supported by an ATIP-Avenir grant (Centre National de laRecherche Scientifique).
Appendix A. Supplementary Material
The supplementary material is a single pdf file consisting of two sections: I)the ”Supplementary methods” section provides details related to the analyticsand simulation of the 2sRLC model and II) the ”Supplementary figures” sectioncontains 11 figures.
18
Author Contributions
I.J and T.L. performed research; T.L. implemented simulation tools; I.J. andT.L. analyzed data; I.J. wrote the article.
References
References
[1] I. Junier, O. Rivoire, Conserved Units of Co-Expression in BacterialGenomes: An Evolutionary Insight into Transcriptional Regulation., PLoSONE 11 (5) (2016) e0155740.
[2] I. Junier, E. B. Unal, E. Yus, V. Llorens-Rico, L. Serrano, Insights intothe Mechanisms of Basal Coordination of Transcription Using a Genome-Reduced Bacterium., Cell Systems 2 (6) (2016) 391–401.
[3] C. J. Dorman, 1995 Flemming Lecture. DNA topology and the global con-trol of bacterial gene expression: implications for the regulation of virulencegene expression., Microbiology (Reading, England) 141 ( Pt 6) (6) (1995)1271–1280.
[4] G. W. Hatfield, C. J. Benham, DNA topology-mediated control of globalgene expression in Escherichia coli., Annual review of genetics 36 (2002)175–203.
[5] A. Travers, G. Muskhelishvili, DNA supercoiling - a global transcriptionalregulator for enterobacterial growth?, Nature Reviews Microbiology 3 (2)(2005) 157–169.
[6] A. Valenti, G. Perugino, M. Rossi, M. Ciaramella, Positive supercoiling inthermophiles and mesophiles: of the good and evil, Biochemical SocietyTransactions 39 (1) (2011) 58–63.
[7] J. Ma, M. Wang, Interplay between DNA supercoiling and transcriptionelongation., Transcription 5 (3) (2014) e28636.
[8] M. C. Lagomarsino, O. Espeli, I. Junier, From structure to function ofbacterial chromosomes: Evolutionary perspectives and ideas for new ex-periments., FEBS Letters 589 (20 Pt A) (2015) 2996–3004.
[9] J. C. Wang, DNA topoisomerases: why so many?, The Journal of biologicalchemistry 266 (11) (1991) 6659–6662.
[10] L. F. Liu, J. C. Wang, Supercoiling of the DNA template during transcrip-tion., Proc Natl Acad Sci U S A 84 (20) (1987) 7024–7027.
[11] L. Postow, N. Crisona, B. Peter, C. Hardy, N. Cozzarelli, Topological chal-lenges to DNA replication: conformations at the fork, Proceedings of theNational Academy of Sciences 98 (15) (2001) 8219–8226.
19

[12] I. Junier, P. Fremont, O. Rivoire, Universal and idiosyncratic characteristiclengths in bacterial genomes., Physical biology 15 (3) (2018) 035001.
[13] L. Postow, C. D. Hardy, J. Arsuaga, N. R. Cozzarelli, Topological domainstructure of the Escherichia coli chromosome, Genes & Development 18 (14)(2004) 1766–1779.
[14] S. Deng, R. A. Stein, N. P. Higgins, Organization of supercoil domains andtheir reorganization by transcription, Molecular Microbiology 57 (6) (2005)1511–1521.
[15] R. Strick, M.-N. Dessinges, G. Charvin, N. H. Dekker, J.-F. Allemand,D. Bensimon, V. Croquette, Stretching of macromolecules and proteins,Reports on Progress in Physics 66 (2003) 1–45.
[16] Z. Bryant, F. C. Oberstrass, A. Basu, Recent developments in single-molecule DNA mechanics., Current opinion in structural biology 22 (3)(2012) 304–312.
[17] T. Lionnet, J.-F. Allemand, A. Revyakin, T. R. Strick, O. A. Saleh, D. Ben-simon, V. Croquette, Single-molecule studies using magnetic traps., ColdSpring Harbor protocols 2012 (1) (2012) 34–49.
[18] F. Kriegel, N. Ermann, J. Lipfert, Probing the mechanical properties, con-formational changes, and interactions of nucleic acids with magnetic tweez-ers., Journal of Structural Biology.
[19] X. Du, D. Wojtowicz, A. A. Bowers, D. Levens, C. J. Benham, T. M.Przytycka, The genome-wide distribution of non-B DNA motifs is shapedby operon structure and suggests the transcriptional importance of non-BDNA structures in Escherichia coli., Nucleic Acids Research 41 (12) (2013)5965–5977.
[20] A. Vologodskii, Biophysics of DNA, Cambridge University Press, 2015.
[21] C. J. Benham, Torsional stress and local denaturation in supercoiled DNA,Proceedings of the National Academy of Sciences 76 (8) (1979) 3870–3874.
[22] C. J. Benham, Stable cruciform formation at inverted repeat sequences insupercoiled DNA., Biopolymers 21 (3) (1982) 679–696.
[23] A. Rich, A. Nordheim, A. H. Wang, The chemistry and biology of left-handed Z-DNA., Annual review of biochemistry 53 (1) (1984) 791–846.
[24] Z. Bryant, M. D. Stone, J. Gore, S. B. Smith, N. R. Cozzarelli, C. Busta-mante, Structural transitions and elasticity from torque measurements onDNA., Nature 424 (6946) (2003) 338–341.URL http://dx.doi.org/10.1038/nature01810
20

[25] M. Y. Sheinin, S. Forth, J. F. Marko, M. D. Wang, Underwound DNAunder Tension: Structure, Elasticity, and Sequence-Dependent Behaviors,Physical Review Letters 107 (1) (2011) 108102.
[26] F. C. Oberstrass, L. E. Fernandes, Z. Bryant, Torque measurements revealsequence-specific cooperative transitions in supercoiled DNA., Proceedingsof the National Academy of Sciences 109 (16) (2012) 6106–6111.
[27] R. Vlijm, A. Mashaghi, S. Bernard, M. Modesti, C. Dekker, Experimen-tal phase diagram of negatively supercoiled DNA measured by magnetictweezers and fluorescence., Nanoscale 7 (7) (2015) 3205–3216.
[28] R. N. Irobalieva, J. M. Fogg, D. J. Catanese, T. Sutthibutpong, M. Chen,A. K. Barker, S. J. Ludtke, S. A. Harris, M. F. Schmid, W. Chiu,L. Zechiedrich, Structural diversity of supercoiled DNA., Nature commu-nications 6 (2015) 8440.
[29] A. V. Vologodskii, S. D. Levene, K. V. Klenin, M. Frank-Kamenetskii, N. R.Cozzarelli, Conformational and thermodynamic properties of supercoiledDNA, Journal of Molecular Biology 227 (4) (1992) 1224 – 1243.
[30] K. Klenin, H. Merlitz, J. Langowski, A Brownian dynamics program forthe simulation of linear and circular DNA and other wormlike chain poly-electrolytes, Biophysical Journal 74 (2 Pt 1) (1998) 780–788.
[31] A. Vologodskii, Simulation of equilibrium and dynamic properties of largeDNA molecules, Computational Studies of DNA and RNA, Springer, Berlin(2006) 579–604.
[32] T. E. Ouldridge, A. A. Louis, J. P. K. Doye, Structural, mechanical, andthermodynamic properties of a coarse-grained DNA model., Journal ofChemical Physics 134 (8) (2011) 085101.
[33] J. F. Marko, Torque and dynamics of linking number relaxation in stretchedsupercoiled DNA, Physical Review E 76 (2007) 21926.
[34] H. Meng, J. Bosman, T. vanderHeijden, J. vanNoort, Coexistence ofTwisted, Plectonemic, and Melted DNA in Small Topological Domains,Biophysical Journal 106 (5) (2014) 1174–1181.
[35] M. Manghi, N. Destainville, Physics of base-pairing dynamics in DNA,Physics Reports 631 (2016) 1–41.
[36] B. A. Krajina, A. J. Spakowitz, Large-Scale Conformational Transitionsin Supercoiled DNA Revealed by Coarse-Grained Simulation., BiophysicalJournal 111 (7) (2016) 1339–1349.
[37] Q. Wang, R. N. Irobalieva, W. Chiu, M. F. Schmid, J. M. Fogg,L. Zechiedrich, B. M. Pettitt, Influence of DNA sequence on the struc-ture of minicircles under torsional stress., Nucleic Acids Research 45 (13)(2017) 7633–7642.
21

[38] J. S. Mitchell, J. Glowacki, A. E. Grandchamp, R. S. Manning, J. H. Mad-docks, Sequence-Dependent Persistence Lengths of DNA., Journal of chem-ical theory and computation 13 (4) (2017) 1539–1555.
[39] A. V. Vologodskii, J. F. Marko, Extension of torsionally stressed DNA byexternal force, Biophysical Journal 73 (1) (1997) 123–132.
[40] J. Lipfert, J. W. J. Kerssemakers, T. Jager, N. H. Dekker, Magnetic torquetweezers: measuring torsional stiffness in DNA and RecA-DNA filaments.,Nat Methods 7 (12) (2010) 977–980.
[41] R. Schopflin, H. Brutzer, O. Muller, R. Seidel, G. Wedemann, Probing theElasticity of DNA on Short Length Scales by Modeling Supercoiling underTension, Biophysical Journal 103 (2) (2012) 323–330.
[42] T. Lepage, F. Kepes, I. Junier, Thermodynamics of Long SupercoiledMolecules: Insights from Highly Efficient Monte Carlo Simulations., Bio-physical Journal 109 (1) (2015) 135–143.
[43] J. Bednar, P. Furrer, A. Stasiak, J. Dubochet, E. H. Egelman, A. D. Bates,The twist, writhe and overall shape of supercoiled DNA change duringcounterion-induced transition from a loosely to a tightly interwound super-helix. Possible implications for DNA structure in vivo., Journal of molecularbiology 235 (3) (1994) 825–847.
[44] I. D. Ivenso, T. D. Lillian, Simulation of DNA Supercoil Relaxation, Bio-physical Journal 110 (10) (2016) 2176–2184.
[45] K. V. Klenin, M. D. Frank-Kamenetskii, J. Langowski, Modulation ofintramolecular interactions in superhelical DNA by curved sequences: aMonte Carlo simulation study., Biophysical Journal 68 (1) (1995) 81–88.
[46] G. Chirico, J. Langowski, Brownian dynamics simulations of supercoiledDNA with bent sequences., Biophysical Journal 71 (2) (1996) 955–971.
[47] C. K. Singleton, J. Klysik, S. M. Stirdivant, R. D. Wells, Left-handed Z-DNA is induced by supercoiling in physiological ionic conditions., Nature299 (5881) (1982) 312–316.
[48] L. J. Peck, J. C. Wang, Energetics of B-to-Z transition in DNA., Proceed-ings of the National Academy of Sciences of the United States of America80 (20) (1983) 6206–6210.
[49] D. B. Haniford, D. E. Pulleyblank, Facile transition of poly[d(TG) x d(CA)]into a left-handed helix in physiological conditions., Nature 302 (5909)(1983) 632–634.
[50] A. V. Vologodskii, M. D. Frank-Kamenetskii, Left-handed z form in su-perhelical dna: A theoretical study, Journal of Biomolecular Structure andDynamics 1 (6) (1984) 1325–1333.
22

[51] W. R. Bauer, C. J. Benham, The free energy, enthalpy and entropy of na-tive and of partially denatured closed circular DNA., Journal of molecularbiology 234 (4) (1993) 1184–1196.
[52] F. C. Oberstrass, L. E. Fernandes, P. Lebel, Z. Bryant, Torque Spectroscopyof DNA: Base-Pair Stability, Boundary Effects, Backbending, and Breath-ing Dynamics, Physical Review Letters.
[53] P. Cong, J. Yan, Recent progress on the mechanics of sharply bent DNA,Science China Physics 59 (8) (2016) 99.
[54] J. Yan, J. F. Marko, Localized single-stranded bubble mechanism for cy-clization of short double helix DNA., Physical Review Letters 93 (10) (2004)108108.
[55] P. A. Wiggins, R. Phillips, P. C. Nelson, Exact theory of kinkable elas-tic polymers., Physical review. E, Statistical, nonlinear, and soft matterphysics 71 (2 Pt 1) (2005) 021909.
[56] P. Ranjith, P. B. S. Kumar, G. I. Menon, Distribution functions, loopformation probabilities, and force-extension relations in a model for shortdouble-stranded DNA molecules., Physical Review Letters 94 (13) (2005)138102.
[57] M. Manghi, J. Palmeri, N. Destainville, Coupling between denaturationand chain conformations in DNA: stretching, bending, torsion and finitesize effects., Journal of physics. Condensed matter : an Institute of Physicsjournal 21 (3) (2009) 034104.
[58] A. K. Efremov, R. S. Winardhi, J. Yan, Transfer-matrix calculations ofDNA polymer micromechanics under tension and torque constraints., Phys-ical Review E 94 (3-1) (2016) 032404.
[59] R. M. Fye, C. J. Benham, Exact method for numerically analyzing a modelof local denaturation in superhelically stressed DNA, Physical Review E.
[60] D. Jost, A. Zubair, R. Everaers, Bubble statistics and positioning in super-helically stressed DNA., Physical Review E 84 (3 Pt 1) (2011) 031912.
[61] V. V. Rybenkov, A. V. Vologodskii, N. R. Cozzarelli, The effect of ionicconditions on DNA helical repeat, effective diameter and free energy ofsupercoiling., Nucleic Acids Research 25 (7) (1997) 1412–1418.
[62] C. G. Baumann, S. B. Smith, V. A. Bloomfield, C. Bustamante, Ionic effectson the elasticity of single DNA molecules, Proceedings of the NationalAcademy of Sciences 94 (12) (1997) 6185–6190.
[63] J. R. Wenner, M. C. Williams, I. Rouzina, V. A. Bloomfield, Salt De-pendence of the Elasticity and Overstretching Transition of Single DNAMolecules, Biophys J 82 (6) (2002) 3160–3169.
23

[64] T. Strick, D. Bensimon, V. Croquette, Micro-mechanical measure-ment of the torsional modulus of DNA, Genetica 106 (1999) 57–62,10.1023/A:1003772626927.
[65] P. Carrivain, M. Barbi, J.-M. Victor, In Silico Single-Molecule Manipula-tion of DNA with Rigid Body Dynamics, PLoS Comput Biol 10 (2) (2014)e1003456.
[66] T. Lepage, I. Junier, Modeling Bacterial DNA: Simulation of Self-AvoidingSupercoiled Worm-Like Chains Including Structural Transitions of the He-lix., Methods in molecular biology (Clifton, N.J.) 1624 (1) (2017) 323–337.
[67] J. SantaLucia, A unified view of polymer, dumbbell, and oligonucleotideDNA nearest-neighbor thermodynamics., Proceedings of the NationalAcademy of Sciences of the United States of America 95 (4) (1998) 1460–1465.
[68] J. M. Huguet, C. V. Bizarro, N. Forns, S. B. Smith, C. Bustamante, F. Ri-tort, Single-molecule derivation of salt dependent base-pair free energies inDNA., Proceedings of the National Academy of Sciences 107 (35) (2010)15431–15436.
[69] L. J. Peck, J. C. Wang, Energetics of B-to-Z transition in DNA., Proceed-ings of the National Academy of Sciences of the United States of America80 (20) (1983) 6206–6210.
[70] J. A. Gebe, S. A. Allison, J. B. Clendenning, J. M. Schurr, Monte Carlosimulations of supercoiling free energies for unknotted and trefoil knottedDNAs., Biophysical Journal 68 (2) (1995) 619–633.
[71] J. L. Barrat, J. F. Joanny, Persistence length of polyelectrolyte chains, EPL(Europhysics Letters) 24 (5) (1993) 333–338.
[72] S. K. Nomidis, F. Kriegel, W. Vanderlinden, J. Lipfert, E. Carlon, Twist-Bend Coupling and the Torsional Response of Double-Stranded DNA.,Physical Review Letters 118 (21) (2017) 217801.
[73] J. F. Marko, E. D. Siggia, Bending and twisting elasticity of dna, Macro-molecules 27 (4) (1994) 981–988. doi:10.1021/ma00082a015.
[74] D. Salerno, A. Tempestini, I. Mai, D. Brogioli, R. Ziano, V. Cassina,F. Mantegazza, Single-Molecule Study of the DNA Denaturation PhaseTransition in the Force-Torsion Space, Phys. Rev. Lett. 109 (2012) 118303.
[75] A. Laio, F. L. Gervasio, Metadynamics: a method to simulate rare eventsand reconstruct the free energy in biophysics, chemistry and material sci-ence, Reports on Progress in Physics 71 (1) (2008) 126601.
[76] C. Matek, T. E. Ouldridge, J. P. K. Doye, A. A. Louis, Plectoneme tip bub-bles: Coupled denaturation and writhing in supercoiled DNA., ScientificReports 5 (2015) 7655.
24
[77] Y. Seol, J. Li, P. Nelson, T. Perkins, M. Betterton, Elasticity of ShortDNA Molecules: Theory and Experiment for Contour Lengths of 0.6-7µm,Biophysical Journal 93 (12) (2007) 4360–4373.
[78] C. Bouchiat, M. D. Wang, J. Allemand, T. Strick, S. M. Block, V. Cro-quette, Estimating the persistence length of a worm-like chain moleculefrom force-extension measurements., Biophys J 76 (1 Pt 1) (1999) 409–413.
[79] J. D. Kahn, E. Yun, D. M. Crothers, Detection of localized DNA flexibility.,Nature 368 (6467) (1994) 163–166.
[80] T. J. Thomas, V. A. Bloomfield, Chain flexibility and hydrodynamics ofthe B and Z forms of poly(dG-dC).poly(dG-dC)., Nucleic Acids Research11 (6) (1983) 1919–1930.
[81] S. M. Mirkin, Discovery of alternative DNA structures: a heroic decade(1979-1989)., Frontiers in bioscience : a journal and virtual library 13(2008) 1064–1071.
[82] S. Geggier, A. Vologodskii, Sequence dependence of DNA bending rigidity.,Proceedings of the National Academy of Sciences 107 (35) (2010) 15421–15426.
[83] S. H. Kim, M. Ganji, J. van der Torre, E. Abbondanzieri, C. Dekker, DNAsequence encodes the position of DNA supercoils, biorxiv.orgdoi:http://dx.doi.org/10.1101/180414.
25

Supplemental material: A polymer model of bacterial supercoiled
DNA including structural transitions of the double helix
Thibaut Lepage and Ivan Junier
CNRS, TIMC-IMAG, F-38000 Grenoble, France
Univ. Grenoble Alpes, TIMC-IMAG, F-38000 Grenoble, France
1

CONTENTS
I. Supplementary methods 2
A. Derivation of the effective model with a global torsional energy 2
B. Free energy profiles in the zero writhe approximation 4
C. Generalization to an arbitrarily number of alternative forms 5
D. Torques 6
1. Measurement in numerical simulations 6
2. Expression in the zero writhe approximation and access to the torsional modulus6
E. Inference of parameters by testing a large number of parameters 7
References 7
II. Supplementary figures 9
I. SUPPLEMENTARY METHODS
In the following, parameters are uniform along the DNA molecule. Sequence effects will
be treated in subsequent works.
A. Derivation of the effective model with a global torsional energy
We start by writing down the equilibrium probability of a configuration C with DNA-form
profile {si}i=1..N in the context of an imposed linking number Lk. To this end, we divide the
conformational energy into two terms: the torsional energy ET (C) = kBT2
∑Ni=1
nCsi
asi(φi−ψsi)2
that depends on the torsional angles {φi}i=1..N and the rest, ET (C), which does not. In this
context, denoting β = 1/kBT , we have:
P (C) = Z−1 exp
[−βET (C)−
∑
i
nCsi2asi
(φi − ψsi)2
]δ (Tw(C)− TwLk(C)) (1)
with Z the partition function such that∑C P (C) = 1. The δ(x) function, which is equal to 1
if x = 0 and 0 otherwise, imposes the conservation of Lk, that is, it only retains conformations
for which the total twist of the molecule, Tw(C), is equal to TwLk(C) ≡ Lk−Wr(C).
2

Using Tw(C) = (2π)−1∑
i nφi and defining t(C) = TwLk(C)/Nbp = TwLk(C)/nN , Eq. 1
can be rewritten as:
P (C) = Z−1 exp
[−βET (C)−
∑
i
nCsi2asi
(φi − ψsi)2
]δ
(∑
i
φi − 2πtN
)(2)
The integration over the φi’s then results in evaluating the following term (for clarity, we
drop the C’s):
I =
∫ ∏
k
dφk exp
[−∑
i
nCsi2asi
(φi − ψsi)2
]δ
(∑
i
φi − 2πtN
)=
(using the Fourier transform of δ)∫dx∏
k
∫dφk exp
[−nCsk
2ask(φk − ψsk)2 − 2πix(2πt− φk)
]=
∫dx∏
k
∫dφk exp
[−nCsk
2ask
(φk − ψsk −
2πiasknCsk
x
)2]
exp
[−2π2asknCsk
x2 − 2πix(2πt− ψsk)
]=
[∏
k
∫dφk exp
[−nCsk
2ask
(φk − ψsk −
2πiasknCsk
x
)2]]∫
dx exp
[−∑
j
(2π2askjnCsj
x2 + 2πix(2πt− ψsj))](3)
Defining the conformation-dependent average torsional susceptibility per base pair χ(C) ≡∑N
i=1
asiCsi
/N , the conformation-dependent average twist angle at rest ψ(C) ≡ ∑N
i=1 ψsi/N ,
we obtain (still dropping the C’s):
I = (2π)N/2√∏
k
asknCsk
∫dx exp
[−2π2Nχ
n
(x2 + i
n
πχ(2πt− ψ)x
)]
= (2π)N/2√∏
k
asknCsk
∫dx exp
[−2π2Nχ
n
((x+ i
n
2πχ(2πt− ψ)
)2
+n2
4π2χ2 (2πt− ψ)2
)]
= (2π)N/2√∏
k
asknCsk
exp
[−nN
2χ(2πt− ψ)2
] ∫dx exp
[−2π2Nχ
n
(x+ i
n
2πχ(2πt− ψ)
)2]
=(2π)(N−1)/2
N1/2
√∏
k
askχCsk
exp
[−nN
2χ(2πt− ψ)2
]
=(2π)(N−1)/2
N1/2exp
[−1
2
(Nbp
2χ(2πt− ψ)2 + ln(χ)−
∑
i
ln
(asiCsi
))], (4)
which, after redistribution of the terms ln(χ) and ln(asiCsi
)in the torsional energy and the
free energy of formation, respectively, leads to the effective energies of the main text (Eqs. 3
and 4). Note also that in Eq. 4 of the main text, we have used the fact that Tw(C) = TwLk(C)in the simulated polymer model.
3

B. Free energy profiles in the zero writhe approximation
In the case of the co-existence of two forms, here B-DNA and X-DNA (any alternative
DNA form), using Eqs. 2, 3 and 4 of the main text, the effective energy, U(λ,X), of a con-
formation where X-DNA occupies λN sites (corresponding to λNbp base pairs) distributed
in X domains reads:
U(λ,X) = λNbpγX + 2XJ + EXB − fzX + EB
B − fzB
+kBT
2
[Nbp
χ(λ)
(2π
Tw
Nbp
− ψ(λ)
)2
+ ln (χ(λ))
](5)
where EsB indicates the total bending energy of the form s and where we have used the
notations χs = as/Cs and χ/ψ(λ) = (1−λ)χB/ψB +λχs/ψs – note that ψ(λ) represents the
average twist angle at rest of the molecule with a fraction λ of alternative forms. Next, con-
sidering that the supercoiling density, σ, is totally converted into twist in the approximation
of zero writhe, we can replace 2π TwNbp
by (1 + σ)ψB. Finally, integrating the corresponding
partition function over the bending angles of each site leads to a free energy where the
terms EsB− fzs are replaced by gs,f (X), the free energy associated with the WLC at force f
with bending modulus Ks and contour length X. The resulting bi-dimensional free energy
surface, Sf,σ(λ,X) therefore reads:
Sf,σ(λ,X) = λNbpγX + 2XJ + gX,f (λNbpaX) + gB,f ((1− λ)NbpaB) +
kBT
2
[ψ2BNbp
χ(λ)
(1 + σ − ψ(λ)
ψB
)2
+ ln (χ(λ))
](6)
The unidimensional free energy profile Ff,σ(λ) (Eq. 5 in the main text) can be obtained
by summing (with Boltzmann weights) over the values of X, leading to:
Ff,σ(λ) = λNbpγX + J (λ) + gX,f (λNbpaX) + gB,f ((1− λ)NbpaB) +
kBT
2
[ψ2BNbp
χ(λ)
(1 + σ − ψ(λ)
ψB
)2
+ ln (χ(λ))
](7)
with:
J (λ) = −kBT ln
(∑
X
AN,XλN exp [−2XJ/kBT ]
)(8)
where we have defined
AN,XY =
(Y − 1
X − 1
)(N − Y + 1
X
), (9)
4

the number of ways to distribute Y sites in X different domains among N possible sites.
Using Eq. 6, one can then compute the equilibrium number of domains in the zero writhe
approximation by numerically determining:
X∗ =
∫dXdλ X exp [−Sf,σ(λ,X)/kBT ]
/∫dXdλ exp [−Sf,σ(λ,X)/kBT ] (10)
In addition, using Eq. 7 and 〈•〉λ ≡∫dλ • exp [−Ff,σ(λ)/kBT ]
/ ∫dλ exp [−Ff,σ(λ)/kBT ],
one can derive the other equilibrium quantities as follows (see below for torques):
λ∗ = 〈λ〉λ, (11)
z∗ = −〈∂fFf,σ(λ)〉λ = λ∗εX + (1− λ∗)εB (12)
with εs the WLC extension associated with the form s of DNA, which depends only on as
and `s [1].
Note finally that numerical integration is performed by circumventing numerical problems
coming from the generation of large combinatorial quantities when λN becomes large (as in
the case e.g. of Eq. 9). Recalling that λ = K/N where K is the number of sites occupied by
the alternative form, the integration thus consists of a discrete sum over restricted values
of K and X for which Boltzmann weights are maximal. To this end, we first localise the
saddle-point of Sf,σ(λ,X) and then perform the sum over values of K and X lying in the
rectangle that contains the saddle-point and outside of which relative Boltzmann weights
with respect to the saddle-point are smaller than 10−4. We further checked that our result
did not depend on the choice of this cut-off.
C. Generalization to an arbitrarily number of alternative forms
In the situation of k possible DNA forms (one B-DNA plus k − 1 alternative forms),
denoting the vector of fraction of each of these forms by λ ≡ {λi}i=1..k , with∑k
i=1 λi = 1,
the free energy landscape becomes:
Ff,σ(λ) = Nbp
k∑
i=1
λiγi + I(λ) +k∑
i=1
gi,f (λiNbpai)
+kBT
2
ψ2
BNbp∑ki=1 λiχi
(1 + σ −
k∑
i=1
λiψiψB
)2
+ ln
(k∑
i=1
λiχi
) (13)
5

where here the index i always indicates the different forms and where I(λ) indicates the
free energy associated with the multiple possibilities to distribute the different alternative
sites into distinct domains.
D. Torques
1. Measurement in numerical simulations
To measure the torque exerted by a molecule in our simulations, we use the same method
as in our previous work [2] where we adapted a commonly used experimental method [3, 4]
to the case of rod-like chain models with global torsional energy. It consists in attaching the
ends of the molecule to a reservoir of twists with which this can exchange helix turns. The
reservoir, also called a magnetic trap, is characterized by a stiffness kR such that any variation
of the twist within it, δTwR, with respect to a reference twist (see below) is associated with
an energy cost 2π2kBTkRδTw2R. Similarly to the measurements in magnetic torque tweezers,
the equilibrium torque exerted by the molecule is then given by Γ∗ = −2πkR(Tw∗ − Tw∗0),
where Tw∗ and Tw∗0 are respectively the equilibrium twists of the supercoiled molecule and
of the corresponding relaxed molecule, both measured in the presence of the magnetic trap.
Note here, that the linking number in the reservoir is further calibrated such that Tw∗0 is
equal to the number of helices of the molecule at rest, Tw0.
2. Expression in the zero writhe approximation and access to the torsional modulus
The equilibrium torque exerted by the molecule is defined by Γ∗ = 〈∂ΘFf,σ(λ)〉λ where Θ
is the rotation angle of the tip of the molecule around the stretching direction (the direction
perpendicular to the magnetic field used to add helical turns to the molecule). In magnetic
tweezers experiments, Θ is a control parameter related to the linking number: Θ = 2πLk.
As a consequence, Γ∗ = (2π)−1〈∂LkFf,σ(λ)〉λ, which becomes Γ∗ = (2πTw0)−1〈∂σFf,σ(λ)〉λ in
the approximation of zero writhe, where Lk = Tw and σ = (Tw− Tw0)/Tw0. Using Eq. 7,
we thus obtain for the case of the co-existence of X- and B-DNA:
Γ∗ = kBTψB
⟨1 + σ − ψ(λ)
ψB
χ(λ)
⟩
λ
(14)
6
We then note that whenever the fraction λ of X-DNA is fixed (and known), Eq. 14 can
be used to estimate CX (appearing in χ(λ)) by computing the slope of the σ-torque curve
since in this case Γ∗ = Cte + kBTψBχ(λ)
σ. This has been used by Bryant’s group in the context
of small, specifically designed bubble of alternative forms [5, 6].
E. Inference of parameters by testing a large number of parameters
In the absence of a priori knowledge about the mechanical parameters of alternative
forms, we used a ”blind” approach consisting in i) drawing a large number of points (typi-
cally thousands) in the space of parameters according to a uniform distribution, ii) comput-
ing σ-extension curves using the zero-writhe approximation and iii) comparing the generated
curves to the original data (either simulated data as in Figure 4 of the main text or experi-
mental data as in Figure 5 of the main text). To limit the space of parameters, we made a
vary between 0.34 nm (B-DNA) and 0.7 nm (approximately the largest value measured for
denatured DNA before breaking [7]), ` vary between 1 nm (lowest estimate for denatured
DNA [8]) and 15 nm (at least 5 times larger than any previous estimations for either D-
DNA or L-DNA), C vary between 1 nm (lowest estimate of both D-DNA and L-DNA [8])
and 100 nm (typical value for B-DNA), ψ vary between -0.6 and 0.6 rad/bp (helicity of
B-DNA), γ vary between 1 kBT and 3 kBT (the average free energy formation cost of al-
ternative forms is estimated to be around 2 kBT [9]) and J vary between 2 kBT (leading to
several domains in our simulations) and 20 kBT (single domain).
[1] R. Strick, M.-N. Dessinges, G. Charvin, N. H. Dekker, J.-F. Allemand, D. Bensimon, and
V. Croquette, “Stretching of macromolecules and proteins,” Reports on Progress in Physics
66, 1–45 (2003).
[2] Thibaut Lepage, Francois Kepes, and Ivan Junier, “Thermodynamics of Long Supercoiled
Molecules: Insights from Highly Efficient Monte Carlo Simulations.” Biophysical Journal 109,
135–143 (2015).
[3] Laszlo Oroszi, Peter Galajda, Huba Kirei, Sandor Bottka, and Pal Ormos, “Direct measure-
ment of torque in an optical trap and its application to double-strand DNA.” Physical Review
Letters 97, 058301 (2006).
7

[4] Jan Lipfert, Jacob W J. Kerssemakers, Tessa Jager, and Nynke H. Dekker, “Magnetic torque
tweezers: measuring torsional stiffness in DNA and RecA-DNA filaments.” Nat Methods 7,
977–980 (2010).
[5] Florian C Oberstrass, Louis E Fernandes, and Zev Bryant, “Torque measurements reveal
sequence-specific cooperative transitions in supercoiled DNA.” Proceedings of the National
Academy of Sciences 109, 6106–6111 (2012).
[6] F C Oberstrass, L E Fernandes, P Lebel, and Z Bryant, “Torque Spectroscopy of DNA: Base-
Pair Stability, Boundary Effects, Backbending, and Breathing Dynamics,” Physical Review
Letters (2013).
[7] D. Bensimon, A. J. Simon, V. Croquette, and A. Bensimon, “Stretching DNA with a Receding
Meniscus: Experiments and Models,” Phys. Rev. Lett. 74, 4754–4757 (1995).
[8] Maxim Y Sheinin, Scott Forth, John F Marko, and Michelle D Wang, “Underwound DNA
under Tension: Structure, Elasticity, and Sequence-Dependent Behaviors,” Physical Review
Letters 107, 108102 (2011).
[9] J SantaLucia, “A unified view of polymer, dumbbell, and oligonucleotide DNA nearest-neighbor
thermodynamics.” Proceedings of the National Academy of Sciences of the United States of
America 95, 1460–1465 (1998).
8
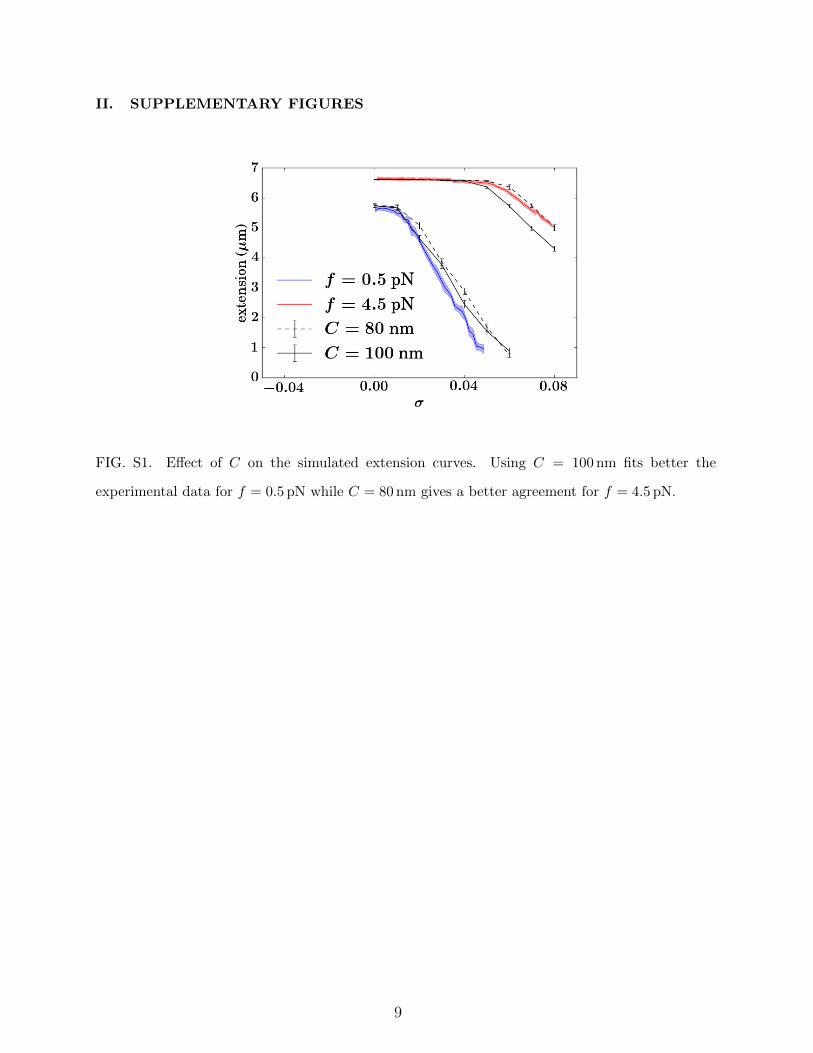
II. SUPPLEMENTARY FIGURES
FIG. S1. Effect of C on the simulated extension curves. Using C = 100 nm fits better the
experimental data for f = 0.5 pN while C = 80 nm gives a better agreement for f = 4.5 pN.
9

FIG. S2. Hysteresis cycles around the plectonemic-denatured transition. Simulations of a 2.4 kb
molecule were performed (σ = −0.05) during which the force was continuously increased (as indi-
cated by the lower left arrow) and decreased (upper right arrow arrow) at constant speed from 0.3
to 1.8 pN. For each of the three speeds reported here (from the fastest to the slowest: red, green
and blue curves), 12 cycles were performed, revealing in each case a strong hysteresis pattern in
the force-extension diagram.
FIG. S3. Snapshot of a simulation close to the plectoneme-denaturation transition (in the figure S2).
A denaturation bubble (red) appears at the apex of a plectoneme.
10

FIG. S4. Relative difference between the zero-writhe approximation and our simulations and
between Marko’s model and our simulations, corresponding to Fig. 3 in the main text.
FIG. S5. FInite-size effects on the zero-writhe approximation: extension as a function of σ for
2 different forces, including finite-size effects (squares) or not (circles). The points are actually
almost exactly superimposed; they were slightly offset along the x-axis for readability.
11

FIG. S6. Rainbow plots of the extension with respect to the varying parameters not shown in Fig.3
of the main text, namely, CX , ψX and J . CX and J have no effect on the extension. For ψX ,
values away from ψB = 0.6 rad/bp tend to yield better fits.
FIG. S7. In a situation where ψ = ψX and C = CX , combining RMSDs for multiple forces
(2, 2.5, 3, 3.5, 6, 8.5 and 12 pN), the best solutions resulting from the intersection of the crests shown
in Fig. 2 of the main text are located around (aX , ˆX) (black cross).
12

FIG. S8. Typical values of parameters for best fit solutions. Within the slice aX ∈ [0.52, 0.56 nm]
centered around aX (see Fig. 4 in the main article), we selected the 100 best fits to the fake data
and plotted the histogram of values for the other parameters (dashed lines represent ˆX , CX , J and
γX). Contrary to the other parameters that spread across all their allowed range, the values of `X
are concentrated around ˆX (top left).
13

FIG. S9. Setting only ψX = ψX (= 0), at high force (12 pN) we find a crest of sub-optimal fits
that go off the original parameters (aX , ˆX) (black cross).
14

FIG. S10. Effect of the coarse-graining on the zero-writhe approximation. The results of Fig. 5 of
the main text are unchanged when using a different level of discretization (here n = 4).
15

FIG. S11. Snapshot of a simulation of a 1 kb-long molecule (100 cylinders, f = 1 pN, σ = −0.06)
where the cylinder at the center (number 50) has no denaturation penalty (γD,i=50 = 0). The
denaturation bubble (red) appears and stays at the center during the whole simulation.
16