a policy analysis of hawaii’s solar tax credit incentive · a policy analysis of hawaii’s solar...
TRANSCRIPT

Working Paper No. 2013-11November 2013
A Policy Analysis of Hawaii’s Solar Tax Credit Incentive
by
Makena Coffman, Sherilyn Wee, Carl Bonham & Germaine Salim
University of Hawai‘ i at Manoa
2424 Maile way, rooM 540 • HonolUlU, Hawai‘ i 96822
www.UHero.Hawaii .edU
working papers are preliMinary Materials circUlated to stiMUlate
discUssion and critical coMMent. tHe views expressed are tHose of
tHe individUal aUtHors.

1
A Policy Analysis of Hawaii’s Solar Tax Credit Incentive
Makena Coffman*
Associate Professor, Urban and Regional Planning Research Fellow, University of Hawaii Economic Research Organization
2424 Maile Way, Saunders 107F Honolulu, HI 96822
(808) 956-2890 [email protected]
Sherilyn Wee
PhD Student, Department of Economics Research Assistant, University of Hawaii Economic Research Organization
2424 Maile Way, Saunders 540 Honolulu, HI 96822
(808) 956-2325 [email protected]
Carl Bonham
Professor, Economics Director, University of Hawaii Economic Research Organization
2424 Maile Way, Saunders 540 Honolulu, HI 96822
(808) 956-2325 [email protected]
Germaine Salim
MA, Urban and Regional Planning University of Hawaii at Manoa
2424 Maile Way, Saunders 107F Honolulu, HI 96822
(808) 956-2890 [email protected]
* Corresponding Author

2
Abstract This study uses Hawaii as an illustrative case study in state level tax credits for PV. We examine the role of Hawaii’s tax credit policy in PV deployment, including distributional and tax payer impacts. Hawaii is interesting because its electricity rates are nearly four times the national average as well as has a 35% tax credit for PV, capped at $5,000 per system. We find that PV is an excellent investment for Hawaii’s homeowners, even without the state tax credit. For the typical household, the internal rate of return with the state tax credit is about 14% and, without it, 10%. Moreover, the vast majority of installations are demanded by households with the median income and higher. We estimate that single-family home-owner’s in Hawaii may demand as much as 1,100 MW of PV. There are, however, significant grid constraints. Policy currently limits PV generation to no more than 15% of peak load for any given circuit, or approximately 3% of aggregate electricity demand. Tax credits are therefore not likely to increase the overall deployment of PV, but rather spread the cost of installation from homeowners to taxpayers and accelerate the rate at which Hawaii reaches grid restrictions.
3
1. Introduction Concern over human-induced climate change and the volatility of fossil fuel prices have lead to large-scale development of renewable energy (Solangi et al., 2011). Policies supporting renewable energy adoption are a second-best greenhouse gas reduction mechanism because they indirectly reduce greenhouse gas emissions by generating technological change (Jaffe et al., 2005). Solar photovoltaic (PV) could potentially contribute large quantities of renewable energy but it is relatively costly. There is a wide array of policies used to incentivize PV adoption and such incentives are largely credited for its uptake (Lüthi and Wüstenhagen, 2012; Shrimali and Kniefel, 2011). In the U.S., States are actively engaged in promoting renewable energy. Twenty-eight States, Puerto Rico and the District of Columbia have adopted a renewable portfolio standard (RPS) (EPA, 2012). Several states, such as New Jersey, mandate that PV meet a specific portion of the overall target. These “solar carve outs” aim to level-the-playing-field with other renewable technologies due to the high levelized cost of PV and assist the sector in its infancy (Sivaraman and Moore, 2012). A few states, like California, have additionally adopted a feed-in-tariff (FIT). Though both the RPS and FIT promote PV, twenty-eight states also directly subsidize PV system installations (DSIRE, 2012a). Subsidies range from sales tax exemptions to rebate programs and tax credits. This is in addition to the Federal Residential Renewable Energy Tax Credit covering 30% of the cost of PV systems. Direct subsidies for PV installation provide households an incentive to participate in the market and therefore contribute to the overall deployment of PV through otherwise underused rooftops. The State of Hawaii has one of the most generous PV subsidies. In 2003, Hawaii enacted HRS 235-12.5, allowing individual and corporate taxpayers to claim a 35% tax credit for eligible renewable energy technology (including PV). The credit was capped at $5000 per system (State of Hawaii, 2003). The law has been amended a number of times, for example, to allow rebates to households with income under $40,000 annually, and to allow excess credit to be carried forward to future tax years. The future of the Hawaii PV tax credits is at the center of heated public debate. The controversy stems largely from unforeseen budgetary impacts and equitable distribution of benefits. According to the State Department of Business, Economic Development and Tourism (DBEDT, 2012), by FY 2012, the state spent a total of $360M for both residential and commercial PV tax credits. Much of the controversy surrounds the difference between the legislative intent and implementation of the PV tax credits. Because the law did not clearly define what constitutes a “system,” or restrict the number of systems per roof, many homeowners have claimed tax credits for multiple systems on a single property (receiving the full 35% tax credit and thus far exceeding the intended $5,000 cap). To address this discrepancy, the State Tax Department released new administrative rules in November 2012 defining a PV system as an installation with output capacity of at least 5 kilowatts (kW) for a single-family residential property. The rules allow tax credits for only one sub-5 kW system (Department of Taxation, 2012a). Although households can still install and claim credits for multiple systems, the size constraint effectively reduces the tax credit rate to approximately
4
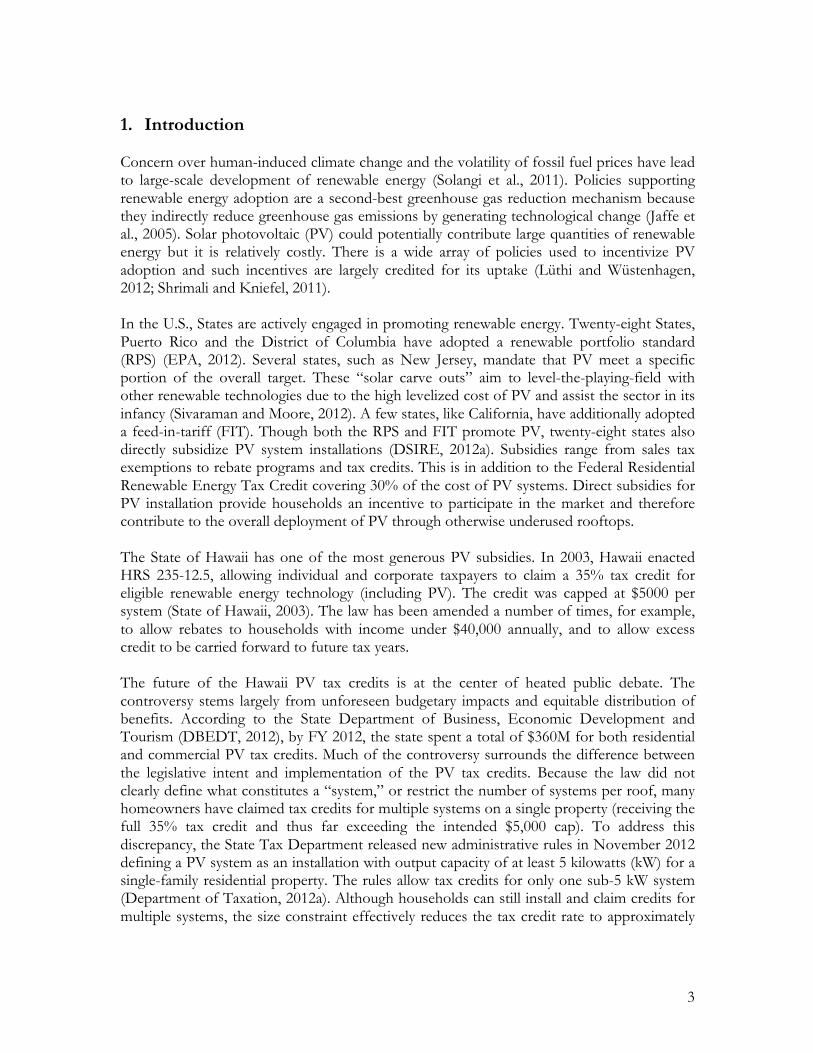
20% (at current PV prices). Hawaii has adopted other incentives for PV installation, including both net energy metering (NEM) and FIT. Hawaii’s policies to incentivize PV provide an excellent case study because of their relative generosity. Moreover, Hawaii has the highest electricity rates in the nation – three to four times the national average (EIA, 2012). This combination, along with rapidly declining installation costs, has led to extremely fast deployment of PV in Hawaii, as illustrated in figures 1 and 2.
Figure 1. Hawaii and U.S. Electricity Rates & PV Costs, 2005-2012
0
1
2
3
4
5
6
7
8
9
0
5
10
15
20
25
30
35
40
2005 2006 2007 2008 2009 2010 2011
$/w
att
cent
s/kW
h
Hawaii Elec Rate US Elec Rate PV System Cost
Elec Rate PV Cost
5
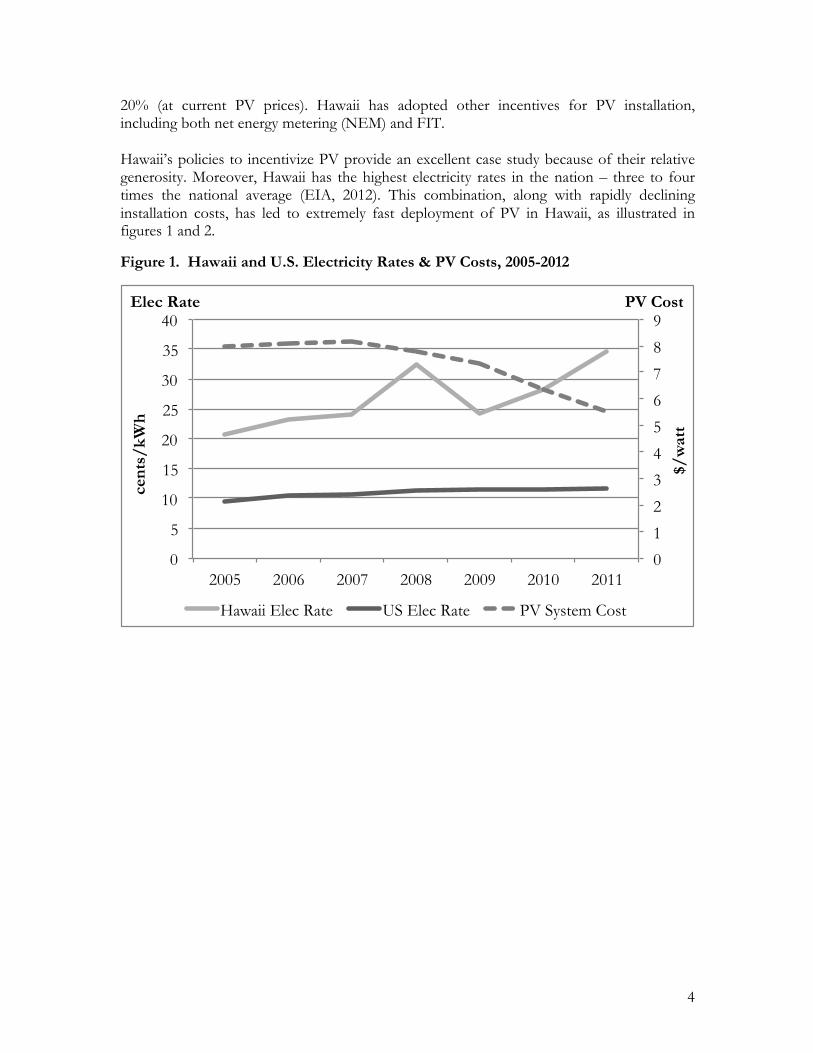
Figure 2. Annual PV Installations in Hawai‘i in MW, 2004-2012
In 2003, when the renewable energy tax credit was first enacted, there was only about 1 MW of PV (for HEI Industries; HECO, 2013a). This did not change dramatically until 2007-2008, when electricity rates began to rise. Between 2007 and 2008, annual installation jumped from 2.3 MW to 6.8 MW, and total installed capacity reached 11 MW. Since then, PV installations have approximately doubled each year. There are over 300 commercial PV providers in Hawaii (Shimogawa, 2013).
In this relatively favorable environment for PV, we study the impact of PV subsidies on residential PV adopters and taxpayers. Our purpose is to assess the impact of policy in Hawaii’s PV market as well as the potential impact to tax revenues from tax expenditures. We estimate the incentive for a typical Hawaii household to install PV by calculating 1) the household “payback” period for a typical PV installation and 2) the internal rate of return (IRR) for household PV installation. We also calculate 3) the maximum amount of PV capacity that might be installed on owner-occupied single-family homes by county and income bracket. These estimates are provided for a range of income groups as well as by county. We also look historically at PV system prices and electricity rates to isolate the impact of policy on the IRR for the median income 3-person household over time. This allows us to see how IRR has changed since the state PV policy went into effect and the driving forces of relative prices. We find that PV is an excellent investment for Hawaii’s homeowners. For the representative household (3-person, $75,000 household income), the rate of return (under current tax rules) is between 14% and 18%. Under the “old rule,” the rate of return was between 19% and 24%. Even with no state tax incentives, the rate of return from installing PV is between 10% and 13%. In all cases, the payback period (assuming a 5% discount rate) is under 12 years, and in some cases, under 4. In other words, state policy has converted a generous 10-13%
0
10
20
30
40
50
60
70
80
90
100
2004 2005 2006 2007 2008 2009 2010 2011 2012
MW
6
rate of return on PV investment into a 14-18% return. And, policy is boosting returns on investment for the highest income earners in the state because relatively high-income home-owners tend to take advantage of the subsidies. Moreover, the favorable change in relative prices, from declining PV prices and rising electricity rates dominate potential changes in tax policy. We find that the IRR for the typical PV consumer in 2011 with no state tax credit is higher than it would have been in 2010 even with the state tax credit. We estimate that single-family home-owner’s in Hawaii may demand as much as 1,100 MW of PV. Under the “old rules,” this implies a total of $2.1 billion in foregone tax revenues. Under the “new rules,” it amounts to $1.4 billion. While this is clearly an upper bound, as not everyone will install PV, it illustrates that relatively small changes in interpretation of the tax rules can result in large changes to tax credit costs. With no constraints on the electric grid’s ability to accept intermittent sources of energy, and at current levels of electricity demand, 1,100 MW of PV would account for 17% of statewide electricity demand. The NEM, however, limits PV-based generation to less than 3% of electricity demand. This means that the ability of the grid to accept intermittent sources of energy (or at least current policies restrictions) is a major binding constraint. In other words, the state tax credits only serve to speed up the rate of PV installation in Hawaii, and are not likely to increase the overall adoption of PV in the long-run. This paper is organized as follows. Section 2 discusses literature on the role of government in promoting PV. Section 3 details policies relating to PV in Hawaii. Section 4 explains the estimation methodology, key assumptions and data. Section 5 highlights key findings. Section 6 offers discussion and concluding remarks. 2. PV Support Policies and Adoption PV is attractive because of its’ relatively long expected economic life, nearly negligible maintenance costs (Singh and Singh, 2010), its distributed nature (i.e. reducing transmission and distribution costs) and relative ease of siting (on otherwise unused rooftops). Yet the levelized cost of PV still exceeds that of other renewable sources of energy. Zweibel (2010) suggests that a 100-year time horizon might make the levelized cost of PV comparable to that of wind. There is strong argument for supporting infant technologies such as PV as a market-building strategy. Increasing deployment through subsidies allows the industry to take advantage of economies of scale, which in turn lowers cost, and reduces the need for subsidy (Sandén, 2005). As worldwide installations grow, PV costs have fallen by more than 3% per year since 1998 (Feldman et al., 2012). Shrimali and Kneifel (2011) suggest that the RPS can encourage PV deployment, and Sarzyknski et al. (2012) argue that the a “solar carve-out” provision enhances the effectiveness of RPS.. States with cash incentives also experience more (and more rapid) PV deployment, though this is not the case for income tax credits, possibly because of insufficient tax liabilities and the limited size of many state tax credits (Sarzyknski et al., 2012).

7
State subsidies vary widely. California and Arizona have the largest amount of PV deployed (GTM Research and SEIA, 2013). The California Solar Initiative rebates vary by utility, system size, customer class, performance, and installation factors. Two performance-based options are available: either a monthly payment based on actual energy produced over a period of five years or a lump-sum based on expected performance. The expected performance incentive is more common on residential systems (California Energy Commission and California Public Utilities Commission, 2013). At the city level, California rebate policies vary widely. San Francisco, for example, offers a rebate of at least $2000, while Marin County provides a $500 rebate. Arizona, has a policy more similar to Hawaii’s (though less generous). It offers the lesser of a 25% tax credit or up to $1,000. Sarzynski et al. (2012) compare Hawaii and Arizona incentives and notes that the combination of higher electric rates, a larger (35%) income tax credit, and higher maximum credit, makes PV more cost-effective for Hawaii consumers. Overall, many states have ambitious PV programs, and some states have spent as much as $20,000 per installation (Sarzynski et al., 2012). In a summary of ten state’s incentives and PV deployment, Sarzynski (2010) finds that states with larger population, higher average income, and higher electricity or natural gas prices have greater concentrations of installed PV. States that are dependent on imported energy have greater PV deployment, as do states with better solar resources and a more liberal citizenry. Other factors such as consumer attitudes additionally play a role in the adoption of PV. For alternative energy customers, their primary motive may be to avoid fossil fuel energy sources, contribute to climate protection and renewable energy growth (Wüstenhagen and Bilharz, 2006). Apart from the disincentive of the upfront cost of PV installation, human capital and social resources contribute to households’ awareness of financial incentives and transaction costs associated with purchasing PV. Households with higher levels of education and employed in higher skilled occupations have an easier time accessing information on residential PV, evaluating the long-term cost savings, and acquiring relevant information from their social networks (Macintosh & Wilkinson, 2011). While incentives and falling cost of PV systems have resulted in more widespread adoption, the impact to government budgets can be daunting. In a case study of Australia’s residential rebate program, Macintosh and Wilkinson (2011) find that the program was a major driver of a six-fold increase in PV capacity in the 2000s. It initially provided rebates of approximately 50% of the cost of installation, set at $5.50 per watt and capped at $8,250 per household. The government terminated the program after substantial cost overruns (despite reducing the subsidy over time). Government expenditures were estimated at $1.1 billion ($2009) over the ten-year life of the program. 3. Solar PV Policies and Programs in Hawaii Hawaii is the most oil-dependent U.S. state and has electricity rates ranging between $0.32 and $0.44/kWh in 2012?. There are two electric utilities in Hawaii, the larger utility that

8
operates on Oahu, Maui County and Hawaii Island (Hawaiian Electric Industries, HEI), and another operating on Kauai (Kauai Island Utility Cooperative, KIUC). Renewable Portfolio Standard Hawaii’s current RPS law was adopted in 2009. It mandates that the two electric utilities meet 40% of their electricity sales through renewable sources by the year 2030. In addition to the RPS, an efficiency standard mandates 4,300 GWh of electricity savings by the year 2030. Net Energy Metering (NEM) Hawaii’s NEM law allows households with PV systems to receive full retail credit for electricity provided to the grid. Net excess generation is credited to future electric bills, but excess generation credits are zeroed out every twelve months. Households with systems that do not over produce electricity are buying and selling electricity at the retail rate. As a result, the utility is paying more for electricity under NEM than it would under power purchase agreements for other sources of electricity. In other states, many net metering agreements are based on wholesale rates (Talavera et al., 2010). The NEM law applies to systems up to 100 kW for HEI Industries and 50 kW for KIUC. There is an aggregate capacity limit of 15% of peak load per distribution circuit that, if exceeded, requires the NEM applicant to pay for an interconnection study. More recently HEI Industries announced that permits for net metering can be issued for circuits with PV operating under 100% of daytime minimum load, but may similarly be subject to additional studies (HECO, 2013b). Feed-in-Tariff (FIT) Hawaii’s FIT provides a fixed rate 20-year contract for eligible technology systems up to 5 MW. For PV, the rate is set at $0.218/kWh for systems less than or equal to 20 kW, $0.189 for systems between 20 and 500 kW, and $0.197 for systems greater than 500 kW and less than 5 MW. These rates were established under the assumption that PV providers will receive the 35% state renewable energy tax credit. An alternative (higher) set of rates were negotiated in the case that the tax credit is no longer available. Because Hawaii’s electric rates are substantially higher than the FIT rates, the NEM provides better returns and is chosen by most households (DBEDT, 2013a). Low Interest Loans Assuming that roof space is available, the primary barrier to PV adoption is the upfront cost. If customers do not have the ability to pay outright, many Hawaii-based financial institutions offer low interest, unsecured energy/green loans, with no interest during the initial term (usually a year), no application fees, no closing costs, and no pre-payment penalty. Solar Leasing

9
An alternative to a loan is to lease the system from a private provider. Typically, the lease companies have investors who absorb the tax credits and pass some of the savings along to the consumer in the form of lower lease payments. Customers generally have three options: 1) a "pre-paid" lease, with a one-time lump sum payment, 2) a "partial-pay" lease with some upfront payment and monthly payments over the contract period, or 3) a "month to month" lease with no upfront payment and a monthly payment over the contract period. The attractiveness of leasing depends on avoiding large upfront expenses and a reduction in total monthly outlays for electricity consumption. The third option has the lowest return on investment, while pre-paying the entire lease will result in the greatest total savings. At the end of the lease period, the customer can either have the system removed at no cost to them, purchase the system, or enter into another lease (NREL, 2010). Purchasing a system outright tends to have the best return on investment. Green Financing Another option to reduce the high capital cost and address the challenge some customers face in qualifying for loans (which generally require a credit score above 700), is a green infrastructure loan program. Revenue bonds issued by the state and backed by a public benefits fund can raise money for loans that customers then use to install PV systems. Customers repay the loans from the savings on their electric bill. The framework for a green financing program was established during the 2013 State of Hawaii legislative session. 4. Methodology Our goal is to estimate potential demand for residential solar PV systems in Hawaii. Using data from the U.S. Census Bureau’s 2007-2011 American Community Survey (ACS), we develop a simple framework to estimate a household’s electricity demand based on household size, typical electricity demand per capita, gross household income and the assumed income elasticity of electricity demand. We assume that households maximize their PV system such that they are “net-zero” (i.e. their entire electricity bill is covered by their PV installation and the NEM agreement). Using ACS data on federal and state tax liabilities, we estimate the cost of state PV tax credit expenditures. We use this framework to estimate the typical household payback period and IRR from investing in PV, as well as the cost of state tax credits under three different policy rules. To study the potential tax credit cost savings from the newly adopted 5 kW system rule, we consider both the 1) “old rule” – effectively unlimited state tax credits for PV and 2) the “current rule,” where a system is defined as an installation with total output capacity of 5 kW. We also estimate payback periods and IRR under the assumption of 3) “no state credit.”
Data and Assumptions
Census Data
We use the ACS data to estimate the number of owner-occupied single-family homes by county, household size and income bracket. We make the assumption that PV is installed

10
only on owner-occupied single-family homes. Apartments generally have insufficient rooftop space per resident and the state PV tax credit is much lower for multi-family residential properties—a maximum of $350 per unit per system (State of Hawaii, 2003). While landlords renting single-family or multi-family homes may chose to install PV systems, their financial incentive for doing so is much different from that of single-family home owners.1 By limiting our study to single-family owner occupants, we are likely to underestimate the total demand for PV.
The ACS data has information on the number of owner-occupied residences by household size (from 1 to 7+) at the tract level. It also has median household income at the tract level. We can link this information by using the geo-identifiers at the tract level. This gives us owner-occupied residences by household size and income group. To estimate the number of single-family owner-occupied residences, we assume that owner-occupied residences with four or more rooms are single-family homes. This rather crude assumption allows us to estimate the number of owner-occupied single-family homes, by household size and income group at the tract level. As a consistency check, we compare our estimate of the total number of single-family owner-occupied homes statewide with the 2007-2011 Public Use Microdata Sample (PUMS) (DBEDT, 2012). We find that our estimate is within 4% of the actual PUMS data. We do not use the PUMS data for our analysis because it is not available at the tract level, and we are interested in estimating PV demand by county.
Tax Data
To calculate household tax liability by household size and income group, we use 2012 Federal and State tax tables. We use household size as a proxy for dependents, and assume that a one-person household will file as a single person and a two-person household will file as married. A three-person household is assumed to file as married with one dependent. Because the ACS data reports household size up to a seven-person household, we assume households have a maximum of five dependents. In other words, we are under-counting the total number of people in some census tracts, because we assume that a 7-or-more person household is actually a 7-person household for the sake of calculating tax liability (and electricity consumption).
Electricity Rates & PV Prices
Electricity rates by county are from the Department of Business, Economic Development and Tourism, Hawaiian Electric Company, and Kauai Island Utility Cooperative (DBEDT, 2013b; HECO, 2013c; KIUC, 2012). The installed PV system price of $5.50 per watt is based on quotes from local PV providers. We use historic residential PV installed price data for 2005 to 2011 from a study prepared by National Renewable Energy Laboratory and Lawrence Berkeley National Laboratory (Feldman et al., 2012). We use the ratio of Hawaii’s 2011 residential PV system prices (per watt) to NREL’s price estimate to scale NREL’s historic residential PV prices to create a time-series of Hawaii prices from 2005-2012. This data is illustrated in figure 2 above.
Estimation Framework
1 Although alternative policy mechanisms could certainly change this incentive.

11
We estimate household electricity demand based on the typical per capita demand of Hawaii’s median income 3-person household and the assumed income elasticity of demand.
(1)
Where: kWh = daily household electricity demand d = 6 kWh per day, the typical daily per capita consumption (DBEDT, 2013b) ! = 0.5, income elasticity of demand for electricity (Silk and Joutz, 1997; Nakajima and Hamori, 2010) i = $78,729, median 3-person household income (U.S. Census Bureau, 2012) Δ! = !!! − !, where ihh is actual household income Nhh = number of people in household We assume that homeowners will maximize the NEM agreement and install a system designed to achieve net-zero electricity use within a year. We estimate each HH’s demand for a PV system as:
PV system size (kW) = (kWhdayae
)!Nhh (2)
Where: a = 5.2 solar hours per day (Hawaii Energy Connection, 2012) e = 0.75, an efficiency factor, due to efficiency losses (irradiance, dust, temperature, wiring), such that system power output is reduced from original system capacity (IREC, 2012). Because not all households have sufficient roof top space or chose to invest in a “net-zero” system, this assumption leads us to overestimate the total demand for PV. On the other hand, we are not considering development of new residential units, which could lead us to underestimate the total demand for PV in the future. Given the household’s required system size, the system cost is simply the system size multiplied by the assumed cost, $5.50 per watt. We assume that electricity rates and PV system costs remain unchanged during the 25-year time-horizon we consider. Over the past two decades, statewide residential electricity rates have increased more than 6% per year while PV costs have fallen dramatically (Figure 1). If these trends continue, this provides yet more motivation to install PV. We calculate household electricity needs and PV system size for representative income groups by household size. We group income levels into $10,000 intervals, from $20,000 to $100,000. For households earning $100,000 or more, we use $20,000 intervals. For calculating electricity demand by household size, demand for PV, and federal and state tax credits, we use the mid-point of each income bracket to represent the income for all households in that bracket. Calculating the “Payback” Period
kwhday = d(1+!!ii)"Nhh
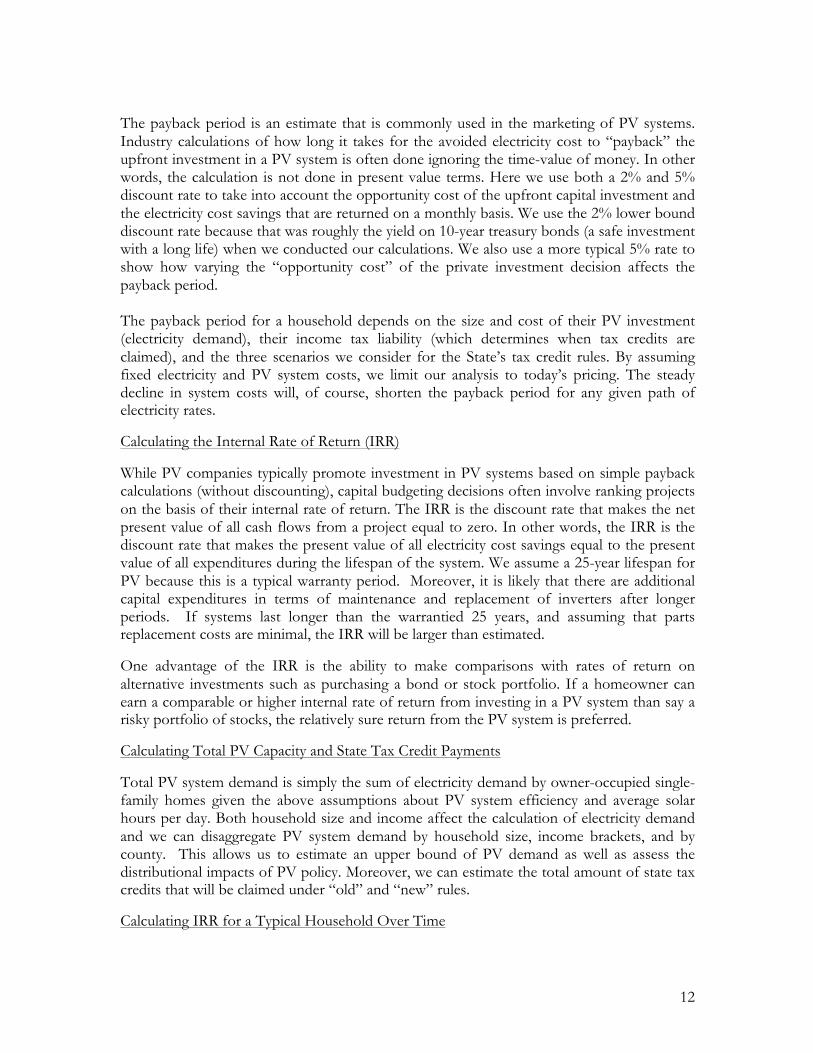
12
The payback period is an estimate that is commonly used in the marketing of PV systems. Industry calculations of how long it takes for the avoided electricity cost to “payback” the upfront investment in a PV system is often done ignoring the time-value of money. In other words, the calculation is not done in present value terms. Here we use both a 2% and 5% discount rate to take into account the opportunity cost of the upfront capital investment and the electricity cost savings that are returned on a monthly basis. We use the 2% lower bound discount rate because that was roughly the yield on 10-year treasury bonds (a safe investment with a long life) when we conducted our calculations. We also use a more typical 5% rate to show how varying the “opportunity cost” of the private investment decision affects the payback period. The payback period for a household depends on the size and cost of their PV investment (electricity demand), their income tax liability (which determines when tax credits are claimed), and the three scenarios we consider for the State’s tax credit rules. By assuming fixed electricity and PV system costs, we limit our analysis to today’s pricing. The steady decline in system costs will, of course, shorten the payback period for any given path of electricity rates.
Calculating the Internal Rate of Return (IRR)
While PV companies typically promote investment in PV systems based on simple payback calculations (without discounting), capital budgeting decisions often involve ranking projects on the basis of their internal rate of return. The IRR is the discount rate that makes the net present value of all cash flows from a project equal to zero. In other words, the IRR is the discount rate that makes the present value of all electricity cost savings equal to the present value of all expenditures during the lifespan of the system. We assume a 25-year lifespan for PV because this is a typical warranty period. Moreover, it is likely that there are additional capital expenditures in terms of maintenance and replacement of inverters after longer periods. If systems last longer than the warrantied 25 years, and assuming that parts replacement costs are minimal, the IRR will be larger than estimated.
One advantage of the IRR is the ability to make comparisons with rates of return on alternative investments such as purchasing a bond or stock portfolio. If a homeowner can earn a comparable or higher internal rate of return from investing in a PV system than say a risky portfolio of stocks, the relatively sure return from the PV system is preferred.
Calculating Total PV Capacity and State Tax Credit Payments
Total PV system demand is simply the sum of electricity demand by owner-occupied single-family homes given the above assumptions about PV system efficiency and average solar hours per day. Both household size and income affect the calculation of electricity demand and we can disaggregate PV system demand by household size, income brackets, and by county. This allows us to estimate an upper bound of PV demand as well as assess the distributional impacts of PV policy. Moreover, we can estimate the total amount of state tax credits that will be claimed under “old” and “new” rules.
Calculating IRR for a Typical Household Over Time
13
We estimate IRR for the median income, $75,000, 3-person household using historic electricity rates and PV system costs. For comparability across years, we normalize to $2011. We do this for each county under the three policy variations: “old rule,” “new rule,” and “no state credit.”
5. Key Findings Table 1 summarizes our findings on the benefits to households from investing in PV systems. For ease of presentation, we focus on a 3-person household with gross income of $75,000 and consider three policy scenarios and two discount rate assumptions. Our accounting framework considers a much wider range of household types. Table 1. Household Payback Period & Return on Investment
Because of differences in electric rates across counties, the expected payback period for PV systems varies widely. The payback is longest on Oahu where electricity rates are lowest, and shortest on Kauai where electricity costs are the highest. Policy plays a large role in determining the payback period. Under the previous interpretation of the law (“old rule”), with a 2% discount rate, the payback period on Oahu is 4.5 years. Under the current rule, it is 6.6 years. With no state tax incentive, the payback with a 2% discount rate ranges between 6.8 and 9.5 years. Using a 5% discount rate, it is between 7.8 and 11.6 years. For comparison, Dusonchet and Telaretti (2010) analyze western European Union countries’ PV policies and find payback periods (without discounting) that range from 8 years for Greece and Italy to 17 years in Portugal. Table 1 also presents the IRR for investment in a PV system assuming a system life of 25-years. The IRR ranges from 9.8% on Oahu with no state tax incentive to 24.1% on Kauai under the old rules.
Illustrative Household ($75,000 Household income, 3-Person Household), $2011
Oahu Maui Hawaii Kauai
Assumed System Cost per Watt $5.50/W
Assumed Electric Rate 32 ¢/kwh 36 ¢/kwh 42 ¢/kwh 44 ¢/kwh
Estimated Monthly Electric Bill $170 $190 $220 $230
Payback Period (in years) Using a 2%, 5% Discount Rate
Old Rule 4.5 , 5.0 4.0 , 4.4 3.4 , 3.7 3.3 , 3.5
New Rule ($5000/system) 6.6 , 7.5 5.8 , 6.6 4.9 , 5.5 4.8 , 5.3
No State Credit 9.5 , 11.6 8.4 , 10.0 7.1 , 8.2 6.8 , 7.8
Internal Rate of Return Over 25 Years
Old Rule 18.9% 20.7% 23.4% 24.1%
New Rule ($5000/system) 13.8% 15.3% 17.6% 18.1%
No State Credit 9.8% 11.0% 12.9% 13.4%

14
IRR Over Time Figure 2 illustrates IRR over time and with varying policies. Though we estimate this for each county, for ease of presentation we compare the IRR for the two extremes – Oahu and Kauai. Figure 2. Internal Rate of Return – Oahu and Kauai, 2005-2011
While relatively constant between 2005 and 2007, the increase in IRR in 2008 reflects a temporary spike in electricity rates following the spike in world oil prices before the onset of the great recession. World oil prices dropped dramatically in 2009 with the recession. Since 2009, electricity rates have risen steadily. Beginning in 2008, PV prices began to drop relatively more quickly. Interestingly, relative prices have become so favorable that the IRR in 2011 with no state credit is comparable the to the IRR in 2010 with the current state credit (“new rule”). Residential PV Installation and State Tax Credit Costs We estimate that the demand for PV systems on single family, owner-occupied housing could eventually reach 1,100 MW of installed capacity. Figure 3 shows the potential demand for PV capacity by household income level.
0%
5%
10%
15%
20%
25%
2005 2006 2007 2008 2009 2010 2011
Old Rule New Rule No State Credit
Old Rule New Rule No State Credit
Oahu:
Kauai:
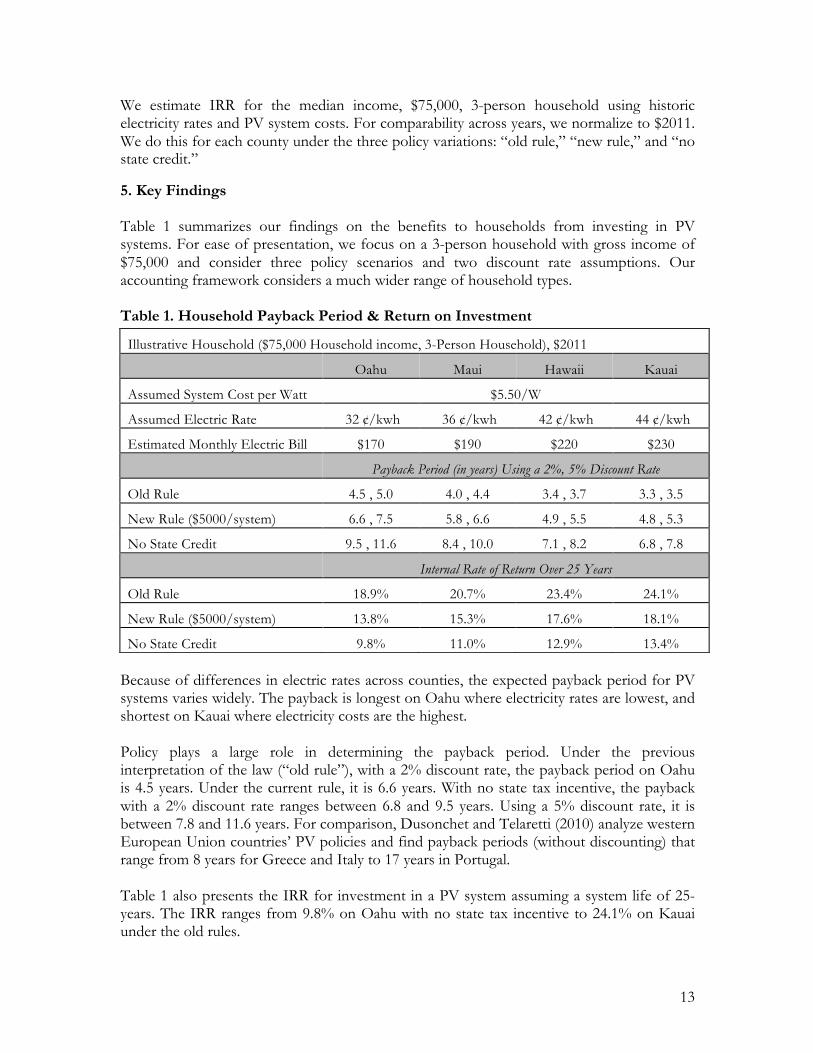
15
Figure 3. Potential PV Capacity by Household Income in MW
The vast majority of capacity will be installed on the rooftops of households with annual income greater than the median, which is $75,000. This is primarily because most owner-occupied single-family houses are owned by households with relatively high incomes. Moreover, the amendment to the law that households with income under $40,000 qualify for a rebate rather than income tax credit applies to a very small number of households and little PV capacity. While making the policy seem relatively more equitable at face value, home ownership is still a large barrier to entry. If the entire 1,100 MW of estimated PV demand was installed, under “new rules,” households could eventually claim $1.4 billion in state tax credits. Under the “old rules,” tax credits could have eventually totaled $2.1 billion. While this is the upper bound of impacts to the state budget, it is useful to illustrate that relatively small changes in interpretation of the tax rules can result in large changes in tax credit costs. 6. Discussion and Conclusions Hawaii is an illustrative case study in residential PV adoption because of its high electricity rates and generous tax credits. We estimate the payback period and internal rate of return for Hawaii’s households. For a representative median income, 3-person household, we calculate the IRR using historic electricity rates and PV prices from 2005 to 2011. Using census data, we determine the upper bound of PV installations and the changing payoff and costs of state tax credits due to changes in tax policy. In purely economic terms, and assuming that the NEM remains unchanged, the rational decision is for households to make the PV investment regardless of tax credit policy. We
0
50
100
150
200
250
300
350
<40K 45K 55K 65K 75K 85K 95K 110K >150K
MW
16
estimate that, under the “old rules”, the payback period for investing in PV is about 4 years (statewide average with a 5% discount rate). Under the “new rules”, the comparable payback occurs in 6 years. With no state tax credit, the payback period is 9.4 years. Because systems are warrantied for 25 years or more, these relatively fast payback periods mean that PV installation is a lucrative investment. The internal rate of return for investment in PV under the “old rules” is 22% (statewide average). Under the “new rules”, it is 16%. With no state tax credit, the IRR is 12%. These findings are consistent with an earlier study by Sarkzynksi (2010) that finds that PV systems in Hawaii are cost-effective for consumers even without the state tax credit and represent a ‘windfall’ for recipients. Moreover, if the lifespan of the system is longer than the warrantied period, the IRR increases substantially. Some studies suggest that PV is a long-term investment that may be active for four decades or more (Zweibel, 2013). Of course other factors play a role in the household decision—there are questions of expected house tenure and whether the investment adds value to the sale of a home.2 In addition, given the decline in system costs, some households may choose to wait to see if technological advances lower system installation costs even further.3 We find that households with annual incomes of $75,000 or higher benefit the most from an investment in PV and under our assumptions have the greatest potential demand for electricity and, subsequently, PV. This is largely due to the income distribution of homeowners and our assumption that owning a home is a prerequisite for PV demand. Due to the need to either self-finance, qualify for a bank loan or solar leasing agreement, up-front cost is clearly an additional barrier to PV installation that aggravates this distributional effect. We estimate that households demand could be as high as 1,100 MW of PV, at a total cost to the State of between $1.4 and $2.1 billion. The difference in these two estimates illustrates the impact to tax credit costs of the reinterpretation of the administrative rules as to what is a “PV system.”
Grid Limitations
In the near term, it is not possible to have 1,100 MW of non-firm PV power on Hawaii’s existing electric grids. The Hawaii Public Utilities Commission has authority to establish NEM requirements and limits. Current law is to limit distributed generation to no more than 15% of a circuit’s capacity and requiring an interconnection study be done otherwise. This constrains total distributed generation to no more than 3% of statewide electricity demand. Using a capacity factor for PV of 18% (HNEI, 2011) and 2011 annual electricity demand of 9,961 GWh (DBEDT, 2013b), 1,100MW of PV is about 17% of statewide electricity demand. In other words, the NEM limit would have to be raised approximately five times over to accommodate this amount of PV. Assuming strict adherence to the 15% circuit constraint, approximately 260 MW of PV could be installed statewide, resulting in an impact to the state budget of $520 million in tax 2 Given the nascent nature of the industry, there is currently little evidence and no studies that of which we are aware. 3 On the other hand, expectations about the loss of the federal tax credit, coupled with changing state policy, may lead homeowners to install early-on, regardless of total system cost.

17
credit expenditures (under the “new rules”). Given the current (2012) installed 179 MW of PV capacity, and assuming that installations continue to grow at their historical rate of 82% per year (2003-2011), the 15% capacity constraint will be reached during 2013. Data for the first half of 2013 indicates that many distribution circuits are reaching the 15% limit (DBEDT, 2013c; HECO, 2013d) and the industry is not growing at previous rates (DBEDT, 2013d). In practice, however, the 15% of peak load threshold has already been surpassed in many circuits. After complaints that conducting an interconnection study is a large burden on individual households, the utilities are allowing continued connections for systems under 10 kW even after the 15% threshold is exceeded. The larger utility has said that PV systems can account for up to 100% of daytime minimum load, which is higher than the 15% circuit distribution threshold for peak demand (HECO, 2013e). The question remains how much PV can be put onto a circuit and what capital investments might facilitate adoption of higher levels of PV. Even with large system upgrades, however, grid limitations will still be a near-term constraint. At the current rate of PV installation, for example, a doubling of the 15% threshold only pushes the grid limitations back by one year, to 2014. Because the grid is a major binding constraint to PV deployment, the state tax credit serves to accelerate PV installation in Hawaii but not necessarily increase its overall level in the long-run. Even without the state tax credit, Hawaii’s electricity rates and the decline of PV prices means that PV is a tremendously attractive private investment. Future Inquiry Upgrading Hawaii’s grid infrastructure is important to be able to accept higher levels of intermittent sources of energy and reach Hawaii’s RPS. This will accrue system upgrade costs, such as installation of grounding transformers. How these investments are paid for, between PV and non-PV customers, is an interesting area of future inquiry. Moreover, the distributional impacts of distributed generation are of great concern. There are several barriers to entry to residential PV, from paying the upfront cost, obtaining a loan, and owning adequate rooftop space. A potentially more appropriate role for state policy is to facilitate PV deployment rather than make direct payments. One approach is on-bill financing. This “pay-as-you-save” mechanism could potentially encourage landlord participation, making PV available to a wider population while limiting taxpayer expenditures.

18
References
Baker, D., 2010. Missing out: Unclaimed government assistance and concession benefits. The Australia Institute, Canberra, Australia. Bunt, K., Adams, L., Leo, C., 2006. Understanding the relationship between barriers and triggers to claiming the Pension Credit. United Kingdom Department of Work and Pensions, London, United Kingdom. Bureau of Labor Statistics, 2012. Consumer Price Index for Honolulu, HI. United States Department of Labor. http://data.bls.gov/pdq/SurveyOutputServlet?series_id=CUURA426SA0,CUUSA426SA0 California Energy Commission and California Public Utilities Commission, 2013. California Solar Initiative Rebates. Accessed 19 September 2013. Available at: http://www.gosolarcalifornia.ca.gov/csi/rebates.php Coffman, M., Griffin, J., and Bernstein P., 2012. An Assessment of Greenhouse Gas Emissions-Weighted Clean Energy Standards. Energy Policy, 45, 122-132. Currie, J., 2004. The Take Up of Social Benefits. National Bureau of Economic Research, Cambridge, Massachusetts, United States. DBEDT, 2012. DBEDT Estimation of Renewable Energy Tax Credits. State of Hawaii. Communication from DBEDT. 13 February 2013. Email. DBEDT, 2013a. Hawaii Energy Facts and Figures, January 2013. State of Hawaii. Available at: http://energy.hawaii.gov/wp-content/uploads/2011/10/EnergyFactsFigures_Jan2013.pdf DBEDT, 2013b. Monthly Energy Data. State of Hawaii. Available at: http://hawaii.gov/dbedt/info/economic/data_reports/energy-trends DBEDT, 2013c. Hawaii Energy Facts and Figures, June 2013. State of Hawaii. Available at: http://energy.hawaii.gov/wp-content/uploads/2011/10/FF_June2013_R2.pdf DBEDT, 2013d. Weekly Photovoltaic Permits. State of Hawaii. Available at: http://dbedt.hawaii.gov/economic/ Department of Taxation, 2012a. Renewable Energy Technologies Income Tax Credit New Temporary Administrative Rules. State of Hawaii. Available at: http://www.state.hi.us/tax/har_temp/RETITC_Rules_FAQ.pdf Department of Taxation, 2012b. Tax Rate Schedules. State of Hawaii . Available at: http://www.state.hi.us/tax/d_12table_p13.htm
DSIRE, 2012a. DSIRE Solar. Available at: http://www.dsireusa.org/solar/index.cfm?
19
DSIRE, 2012b. Hawaii Incentives/Policies for Renewables and Efficiency. Available at: http://www.dsireusa.org/incentives/incentive.cfm?Incentive_Code=HI04R&ee=1 Dusonchet, L. and Telaretti, E., 2010. Economic analysis of different supporting policies for the production of electrical energy by solar photovoltaics in western European Union countries. Energy Policy, 38, 3297-3308. EIA, 2012. Electricity, Average Price by State by Provider (EIA-861). Available at: http://www.eia.gov/electricity/data/state/ Feldman, D., Barbose, G., Margolis, R., Wiser, R., Darghouth, N., and Goodrich, A., 2012. Photovoltaic (PV) Pricing Trends: Historical, Recent, and Near-Term Projections. National Renewable Energy Laboratory (NREL) & Lawrence Berkeley National Laboratory (LBNL). Technical Report DOE/GO-102012-3839. Available at: http://www.nrel.gov/docs/fy13osti/56776.pdf GE Energy Consulting, 2012. Hawaii Solar Integration Study: Final Technical Report for Maui. Subtask 7.1 Deliverables 1 and 2. Prepared for US DOE. Submitted to HNEI December 2012. Available at: http://www.hnei.hawaii.edu/publications/doe-final-report-deliverables Greentech Media, Inc. and Solar Energy Industries Association, 2013. U.S. Solar Market Inisght Report Q2 2013, Executive Summary. Available at: http://www.seia.org/sites/default/files/sPA8D522X92013q2smies.pdf?key=51991727 Hawaii Energy Connection. Sun Hours. [Accessed December 2012] Available at: http://www.hawaiienergyconnection.com/installations/sun-hours Hawaii News Now, 2011. HECO warns about high electric bill. Available at: http://www.hawaiinewsnow.com/story/16402122/heco-warns-people-about-high-electric-bill Hawaiian Electric Company, 2011. Average Electric Rates for Hawaiian Electric Co., Maui Electric Co. and Hawaii Electric Light Co. Available at: http://www.heco.com/portal/site/heco/menuitem.508576f78baa14340b4c0610c510b1ca/?vgnextoid=692e5e658e0fc010VgnVCM1000008119fea9RCRD&vgnextchannel=10629349798b4110VgnVCM1000005c011bacRCRD&vgnextrefresh=1&ct=article Hawaiian Electric Company, 2013a. Solar PV Installed Capacity 2003, 2004. Communication from Hawaiian Electric Company. 8 May 2013. Email. Hawaiian Electric Company, 2013b. Locational Value Maps. Accessed 24 September 2013. Available at: http://www.hawaiianelectric.com/heco/Clean-Energy/Integration-Tools-and-Resources/Locational-Value-Maps Hawaiian Electric Company, 2013c. Rates for 2005. Communication from Hawaiian Electric Company. 25 February 2013. Email.

20
Hawaiian Electric Company, 2013d. Cumulative Installed PV—As of March 31, 2013. Available at: http://www.heco.com/vcmcontent/StaticFiles/pdf/PVSummary_1stQtr2013.pdf Hawaiian Electric Company, 2013e. Reducing Time and Cost of an Interconnection Study. Available at: http://www.hawaiianelectric.com/portal/site/heco/menuitem.508576f78baa14340b4c0610c510b1ca/?vgnextoid=73b1e21cc3b01410VgnVCM10000005041aacRCRD&cpsextcurrchannel=1 Hawaii Natural Energy Institute, 2011. Oahu Wind Integration Study. Prepared for the U.S. DOE Electricity Delivery and Energy Reliability. Subtask 10.1 Report. Available at: http://www.hnei.hawaii.edu/sites/web41.its.hawaii.edu.www.hnei.hawaii.edu/files/story/2011/03/Oahu_Wind_Integration_Study.pdf Interstate Renewable Energy Council (IREC), 2012. U.S. Solar Market Trends, 2011. Available at: http://www.irecusa.org/wp-content/uploads/IRECSolarMarketTrends-2012-Web-8-28-12.pdf Jaffe, A., Newell, R., and Stavins, R., 2005. A tale of two market failures: Technology and environmental policy. Ecological Economics, 54, 164-174. KIUC, 2012. Rate Data Sheet. Available at: http://kauai.coopwebbuilder.com/sites/kauai.coopwebbuilder.com/files/rate_data_sheets_1999-2011.pdf KIUC, 2013. Cumulative Customer Onsite PV Installed Capacity. Communication from KIUC. 8 May 2013. Email. Lüthi, S. and Wüstenhagen, R., 2012. The price of policy risk—Empirical insights from choice experiments with European photovoltaic project developers." Energy Economics 34, 1001-1011. Macintosh, A. and Wilkinson, D. Searching for public benefits in solar subsidies: A case study on the Australian government’s residential photovoltaic rebate program. Energy Policy, 39, 3199-3209. Nakajima, T. and Hamori, S., 2010. Change in consumer sensitivity to electricity prices in response to retail deregulation: A panel empirical analysis of the residential demand for electricity in the United States. Energy Policy, 38, 2470-2476. NREL, 2012. Hawaii Solar Integration Study: Solar Modeling Developments and Study Results. Available at: http://www.nrel.gov/docs/fy13osti/56311.pdf NREL, 2009. Solar Leasing for Residential Photovoltaic Systems. Available at: http://www.nrel.gov/docs/fy09osti/43572.pdf
21
PUC, 2011. Docket No. 2006-0084. State of Hawaii. Available at: http://dms.puc.hawaii.gov/dms/ Sandén, B., 2005. The economic and institutional rationale of PV subsidies. Solar Energy, 78, 137-146. Sarzynski, A., 2010. The Impact of Solar Incentive Programs in Ten States. George Washington Institute of Public Policy. Sarzynski, A., Larrieu, J. and Shrimali, G., 2012. The impact of state financial incentives on market deployment of solar technology. Energy Policy, 46, 550-557. Shimogawa, Duane, 2013. What’s on the horizon for Hawai‘i’s PV industry? Pacific Business News. 7 June 2013. Available at: http://www.bizjournals.com/pacific/print-edition/2013/06/07/whats-on-the-horizon-for-hawaiis-pv.html?page=all Silk, J. and Joutz, F., 1997. Short and long-run elasticities in US residential electricity demand: a co-integration approach. Energy Economics, 19, 493-513. Singh, P. and Singh, S., 2010. Realistic generation cost of solar photovoltaic electricity. Renewable Energy, 35, 563-569. Solangi, K.H., Islam, M.R., Saidur, R., Rahim, N.A., Fayaz, H., 2011. A review on global solar energy policy. Renewable and Sustainable Energy Reviews, 15, 2149-2163. “Solar Financing Options.” 2013. Sunetric. 8 May 2013. Available at: http://sunetric.com/solar-financing/ State of Hawaii, 2003. HRS 235-12.5 Renewable energy technologies; income tax credit. Available at: http://www.capitol.hawaii.gov/hrscurrent/Vol04_Ch0201-0257/HRS0235/HRS_0235-0012_0005.HTM Talavera, D., Nofuentes, G., Aguilera, J., Fuentes, M., 2007. Tables for the estimation of the internal rate of return of photovoltaic grid-connected systems. Renewable and Sustainable Energy Reviews, 11, 447-466. U.S. Census Bureau, 2010. 2005 – 2010 American Community Survey Median Household Income By Family Size. U.S. Census Bureau, 2012. 2007-2011 American Community Survey (Hawaii). U.S. Department of Treasury, 2013. Daily Treasury Yield Curve Rates. Available at: http://www.treasury.gov/resource-center/data-chart-center/interest-rates/Pages/TextView.aspx?data=yield] U.S. EPA, 2012. Renewable Portfolio Standards. Available at: http://www.epa.gov/agstar/tools/funding/renewable.html

22
Wüstenhagen, R. and Bilharz, M., 2006. Green energy market development in Germany: effective public policy and emerging customer demand. Energy Policy, 32, 1681-1696. Young, R., 2006. Hawaiian Electric Company, Inc's FERC Form 714 - Annual Electric Control & Planning Area Report for the year ending December 31, 2005. FERC. Zweibel, K., 2010. Should solar photovoltaics be deployed sooner because of longer operating life at low, predictable cost? Energy Policy, 38, 7519-7530.