a point process analysis of terror attacks in …
TRANSCRIPT
Middle States Geographer, 2017, 50: 50-63
50
A POINT PROCESS ANALYSIS OF TERROR ATTACKS IN AFGHANISTAN, 2002-2013
Chris Fuhriman1, Richard M. Medina2, & Simon Brewer2
1Department of Geography & Environmental Engineering United States Military Academy 745 Brewerton Road, Room 6002
West Point, NY 10996 2Department of Geography
University of Utah 332 S 1400 E, Room 217 Salt Lake City, UT 84112
ABSTRACT: The annual number of terrorist attacks in the world has increased dramatically since 2004. Understanding the spatial distribution of terror incidents is an integral piece of understanding the nature of terroris m in the world today. This article uses point process methods to analyze the spatial distribution of terrorist attacks in Afghanistan from 2002 to 2013. Using data from the Global Terrorism Database, a quadrat count and Chi-squared test are employed to test Afghanistan’s attacks against a random (uniform) distribution. Both elevation values and distance to the ten largest cities in Afghanistan are tested for covariation with attack locations using quadrat classes and Chi-squared tests. All three tests produced statistically significant results (each with p-values less than 0.001), very strongly indicating that terror attacks are spatially clustered in Afghanistan, and that attacks occur preferentially between elevations of 200 – 2500 meters and closer to major urban areas. Keywords: Afghanistan, Spatial Analysis, Terrorist Attacks
INTRODUCTION
Despite the magnitude of the 9/11 attacks in the United States, from 1998 to 2004 worldwide terrorist attacks hovered near their lowest levels in two decades (LaFree, 2010). Since then, however, terrorist attacks have increased significantly from 1,159 incidents worldwide in 2004 to 11,952 attacks in 2013—a ten-fold increase according to the Global Terrorism Database (START, 2016). Although the United States experienced a decline in homeland attacks during that period, other regions and countries endured unprecedented levels of terrorist violence. For example, there were 5,633 terrorist attacks in Afghanistan from the beginning of 2004 until the end of 2013, accounting for 11.5% of the global total for that period. The year of the steepest increase of attacks was 2011-2012 (START, 2016). It is likely that terrorist activity in Afghanistan and other countries will remain high for the foreseeable future, especially in countries with failing governance and preexisting cultural conflict such as Iraq, Mali, Somalia, and Syria.
In Afghanistan, multiple militant organizations, including the Taliban, the Haqqani Network, al-Qaeda, the Islamic State (ISIS), among others are operating against any official government rule of law, and trying rather to install extremist policies for the people. While the Taliban was responsible for killing an eleven year old child who fought against them in a retaliation attack in February 2016, an affiliate of ISIS, the Islamic State in Iraq and Syria – Khorasan Province (IS-KP), has won territory in Nangarhar Province through confrontations with the Taliban (Popalzai, 2016). IS-KP is gaining support and momentum in the region, some of which is due to the joining of deserters from other militant organizations in the country, including the Taliban (Department of Defense, 2015). Infighting between these organizations has increased the violence in Afghanistan (Giustozzi, 2016). Figure 1 illustrates terrorist activity patterns by province in Afghanistan from 2002-2013. The region is far from stable. This instability is most widely seen in the south and in the eastern regions where Afghanistan borders Pakistan’s Federally Administered Tribal Areas (FATA), which have been havens for terrorist organizations in the past.
The U.S. and other countries have long been involved in asymmetrical conflicts, including those fought in Vietnam, Iraq, and Afghanistan. Within these conflicts, paradigms of war shift from traditional (more structured) to decentralized combat that incorporates traps, improvised explosive devices (IEDs), and urban warfare, which puts civilians in danger. These types of conflict are not new, but are presently widespread in the Middle East, Africa, and parts of Asia. It is difficult to anticipate the behavior of adversaries in these situations. The first step to doing so

Terror Attacks in Afghanistan
51
requires social understanding, situational awareness, and spatial reasoning. In order to counter the rise of terrorism effectively, the global community must comprehend, among other considerations, its spatial patterns.
Figure 1. Terror Attacks by Province, 2002-2013.
This study employs point process analysis to investigate environments of terror by including both physical
(terrain) and human (urban development) elements as factors influencing terrorist activity. It is the first of its kind, by the authors’ knowledge, to do so. The results have implications for strategic, as well as tactical military planning. As little work has been done in analyzing spatial patterns of terrorism events in Afghanistan, point process analysis is an appropriate means of initiating the discussion of terrorism in the Afghan context. We assume that regional environmental factors, both physical and human, influence 1) the ability and likelihood of successful attacks, 2) strategies for violence, and 3) perceptual geographic significance and sense of place for terrorists, and thus influence the popularity of specific sites as targets. For counterterrorism and counterinsurgency efforts, understanding environmental risk is vital to troop safety and operational success. This is especially important in extreme regions such as high altitude, desert, or arctic environments. For example, the United States Army considers elevations higher than 1200 meters above sea level to be environmentally stressful from a physiological standpoint due to the effects of hypobaric hypoxia (U.S. Army, 2010). Much of the terrain of Afghanistan is above 1200 meters. In addition to the many physiological limitations of high elevations, some technological advantages are diminished in mountainous terrain. The operation of wheeled and tracked combat vehicles can be severely restricted, resulting in more dismounted patrols which expose combatants to improvised explosive devices (IEDs) and traps (NATO, 2011). Thus, higher elevations can create an important advantage to terror groups who seek to attack softer targets.
This project aims to add to the growing body of empirical research within the field of terrorism geography by answering the following questions: 1) Are recent terrorist attacks in Afghanistan (2002-2013) distributed randomly across the landscape? If not, what patterns do they exhibit? 2) Does terrain/elevation affect attack patterns? 3) Does distance to/from major urban areas affect attacks? Studies such are these are of value for military risk analysis and planning. Asymmetric conflicts will likely continue for the foreseeable future, as will U.S. involvement in them. Understanding the nature of the threat, which includes locations of activity, could help save to lives and potentially stabilize regions.
UNDERSTANDING THE SPATIAL PATTERNS OF TERRORISM Understanding where and in what context terrorism occurs is a critical part of understanding why terrorism
occurs. Recent studies have shown that acts of terrorism are not distributed randomly across geographic space at any

Middle States Geographer, 2017, 50: 50-63
52
scale (global, regional, or within countries), time, or region.1 Many studies using terrorist attack data sets analyze spatial distributions of terrorism without considering local environments, but the environmental factors influence terrorist activity and understanding them is vital to mitigating and preparing for attacks. While clusters of terrorist activity can be a good predictor of where future activity will occur in some cases, identifying these clusters does not provide an understanding of the factors that facilitate and drive the activities.
There have been many studies evaluating spatial, temporal, and spatiotemporal patterns of terrorism. The first, and most regionally related article was written by Zammit-Mangion et al (2012). This study models terrorist attacks from 2004-2009 as recorded in the Afghan War Diary leaked by Edward Snowden. It is focused on growth of activity, time volatility, and predicting attacks, which it does for 2010. This paper takes a modeling approach by using spatial point processes and the stochastic integro-difference equation. While the methodology is impressive, little is offered in understanding causes of violence and interpreting analytical results of terrorism patterns in Afghanistan. Two studies that use point process models are those by White et al. (2013) and Lewis et al. (2012). However, the point process models used by these authors are a self-exciting variation. Rather than including specific location of activities for analysis, the self-exciting models compare time series patterns in different countries or regions. These models consider space and time, where the probability of future events occurring is increased if past events have already occurred in the same place (Daley and Vere-Jones, 2003). White et al. (2013) used self-exciting point process models to demonstrate a statistically significant difference in risk of terror attacks, volatility, and resilience across three countries (Indonesia, the Philippines, and Thailand) in Southeast Asia. They find differences spatially and temporally for the three factors in the countries of study, showing that regions though relatively close geographically and with arguably more similar culture, experience terrorism differently. Lewis et al. (2012) also developed self-exciting point process models to analyze the non-random spatial structure of attacks involving civilian deaths in Iraq. They focus on four regions: Karkh district, Najaf city, Mosul city, and Fallujah, and find that characteristics of follow-on attacks in the regions vary. Medina et al. (2011) analyze attacks and intensities (casualty ratio) of attacks in Iraq from 2004-2009, and showed trends of both over the study period. They find an interesting relationship between terrorist attacks and the resulting human damages, where terrorist activity has an inverse relationship with casualties. Furthermore, the paper identifies shifting spatiality of terrorist activities over time. Siebeneck, et al. (2009) identify spatial clustering and hot spots of terror incidents and potential temporal triggers over a two-year span, also in Iraq. Braithwaite and Li (2007) utilize local spatial statistics to identify transnational terrorism clusters and hot spot regions, finding that terrorist activity is likely to occur where it has occurred previously. Enders and Sandler (2006) apply an autoregressive intervention model to identify large-scale geographical transference of transnational terrorist events before and after 11 September 2001 (hereinafter “9/11”) and show varying increases and decreases for terrorist activity in six regions. Finally, using a spatial nonhomogeneous Poisson process, Ghosh and Das (2010) examined the intensity of the Maoist insurgency in India as a function of low education and income levels. These studies employ a range of statistical modeling methods to quantify the spatial distribution of terrorist attacks.
Surprisingly, most terrorist attack studies focus on regions other than Afghanistan. One example of a study in the country is Barker (2011), which focuses specifically on improvised explosive devices (IEDs). Barker (2011) finds increases in IED attacks and lethality over his study period (2002-2009), which overlaps with the period researched in this article. The most hazardous years for IED attacks were found to be 2006 and 2008. In reviewing the literature on analyzing terrorist attacks in Afghanistan, the authors believe that this study fills a gap by illustrating general spatial and temporal patterns of terrorist activity in Afghanistan, and by initiating an understanding of influential environmental factors.
DATA AND METHODS Terrorism Data
The data for this project were acquired from the open-source Global Terrorism Database (GTD), which contains worldwide terrorist events from 1970 to 2014. The database is hosted by the University of Maryland’s National Consortium for the Study of Terrorism and Responses to Terrorism (START). It includes geospatial information on more than 140,000 incidents (START, 2016). For this study, the authors apply the GTD’s definition of a terror attack. To be included in the GTD an incident must be “…an intentional act of violence or threat of violence by a non-state actor” and satisfy two of the following three criteria: 1) the violence must have a political, economic, religious, or social goal; 2) the violence must show an intention to coerce, intimidate, or send a message to a larger audience beyond the targeted victims; and 3) the act must violate international humanitarian law (START, 2017). The authors acknowledge the ongoing debate in the literature regarding what constitutes a terror attack. However, because
Terror Attacks in Afghanistan
53
our study employs GTD data, START’s definition of terrorism necessarily applies to this analysis. Data for Afghanistan during the period of 2002-2013 were extracted for analysis. The time period was selected due to a dramatic shift in terrorism in Afghanistan in the early 2000s, most likely a byproduct of NATO’s military invasion and continued presence in the country. The GTD reports only 151 total terrorist attacks in Afghanistan from 1970 through the end of 2001—an average of 4.87 attacks per year. During the period of International Security Assistance Force (ISAF) presence in Afghanistan (2002-present), attacks skyrocketed to an average of 481 attacks per year (START, 2016).
Along with geospatial information, the GTD seeks to include many other attributes for each attack, such as weapons used, targets, and perpetrators (if known). For the scope of this study, however, only the spatial coordinates, date, and province were used. Although types of weapons, targets and perpetrators would make fascinating variables for testing correlation to attacks, the GTD was not complete in any of those attributes for the majority of the recorded incidents. If such information becomes available, future studies should include those variables.
There were several issues with the completeness of the GTD data which were addressed prior to the analysis. The first issue was incomplete geospatial data. There were a few (less than ten) data entries which did not include geospatial coordinates. As these points could not be used without location data, they were discarded. Second, some of the province names were spelled multiple ways. For those discrepancies, the necessary changes were made so that every province only had one Romanized spelling. Third, there were several data points (about 30), which listed the province name as “unknown.” For those points, the coordinates were plotted on Google Earth to locate the correct province name, and then recorded with the other extracted data. There was also one point with an unknown province that plotted over the Pakistani border. That point was discarded because it fell outside of Afghanistan (presumably from incorrect country labeling in the original GTD). The final dataset included 5,769 separate terrorist incidents in Afghanistan from 2002 to 2013.
Elevation and Urban Area Data
Elevation values for Afghanistan were incorporated via a digital elevation model (DEM) downloaded from the USGS projects in Afghanistan website (n.d.). To prepare the DEM for use in R, the pixel size was downscaled from 90m to 1000m in ArcMap, then exported as a new DEM file. The 90-meter raster exceeded file size limitations for computation in R. However, as only four elevation categories were necessary for this analysis, the resulting loss in spatial resolution is insignificant. Elevation was selected as an independent variable in an effort to discover if terrorists use the topographic characteristics of Afghanistan as an advantage in selecting targets that may be harder to secure by conventional security forces. The city population data were obtained from the Islamic Republic of Afghanistan’s Central Statistics Organization website, which published an updated estimate of population totals for the years 2013-2015 (IROA, n.d.). For this study, major urban areas with a population of at least 100,000 were considered for two reasons. First, as Laqueur (1999) notes, terrorists seek the anonymity provided by larger cities. Second, the ten largest cities in Afghanistan represent a good departure point for analyzing spatial patterns related to urban areas, which generally house the seats of government and other high-value, symbolic targets for terrorists (Cutter et al., 2003). During the timeframe of the study, only 10 urban areas in Afghanistan exceed 100,000 residents. We have therefore limited our initial study to the 10 largest cities in Afghanistan.
There is a risk that the two independent variables (elevation and distance to city) selected may be correlated if major cities are preferentially located in lower elevation areas, which would limit any inference made. Potential collinearity was checked by examining the relationship between elevation and distance to the nearest major city calculated for all DEM grid cells. For collinear variables, one would expect a high percentage of variance explained (R2) between the two variables. Here, the R2 value is 0.001, with less than 0.1% of the variance explained, strongly suggesting no significant link between the independent variables. Point Process Analysis
Since their emergence in the discipline, spatial point pattern methodologies have traditionally been employed by geographers to demonstrate how observations in a given data set are distributed within the spatial extent of the study area.2 Some methodologies, such as nearest neighbor analysis, rely on distance functions to calculate the spatial distribution of phenomena (Gatrell et al., 1996; Haggett et al., 1977; Ripley, 1976). Another well-established technique (quadrat analysis) divides the study region into sub-regions, or quadrats, in order to examine the characteristics of the spatial distribution of points via area-based analysis (Acevedo, 2013; Bailey and Gatrell, 1995; Cressie, 1993). These quadrats maybe chosen by dividing the region into square or rectangular sub-regions, providing a simple test of spatial clustering. Alternatively the region may be split using classes based on a secondary variable (e.g., elevation or distance classes), providing a test of spatial clustering conditional on that variable. In both distance and area-based techniques, the observed data are compared to a theoretical distribution of events which represent
Middle States Geographer, 2017, 50: 50-63
54
complete spatial randomness (CSR) and follow a Poisson distribution for neighbor distances or a uniform distribution for area-based techniques (Gatrell et al., 1996; Acevedo, 2013) .
The use of point process analysis to study the location of spatial phenomena has been especially useful in ecology and epidemiology. For example, Rayburn and Wiegand (2011) employed point process analysis to study spatial patterns of species diversity for five shrub types in the Great Basin. Stoyan and Penttinen (2000) discussed the wide range of applications of point process analysis and models in the field of forestry. More recently, Adegboye and Kotze (2014) studied the spatial extent of an outbreak of avian flu in Nigeria using a point process model. The field of criminology has also recognized the analytical power of point process modeling. Anselin et al. (2000, 213) suggested that point pattern analysis is one among several exploratory data analysis methods that “should be the starting place of any empirical analyses of the relationship of place to crime.”
This study uses quadrat analysis to investigate if terrorist attacks in Afghanistan show evidence of spatial clustering, and if this is related to elevation and urban areas. In each of the three tests performed, we divide the study area into a set of quadrats and the observed number of attacks in each quadrat (oi) is counted. The expected number of attacks in quadrat i is calculated as:
𝑒𝑒𝑖𝑖 =
𝑛𝑛𝑇𝑇
×𝑎𝑎𝑖𝑖𝐴𝐴
,
where n is the total number of attacks, T the number of quadrats, ai is the area of quadrat i and A the total area of the study region. A significance test can then be performed by calculating a Chi-squared statistic as:
𝜒𝜒2 = �(𝑜𝑜𝑖𝑖 − 𝑒𝑒𝑖𝑖 )2
𝑒𝑒𝑖𝑖
𝑇𝑇
𝑖𝑖 =1
,
where T = number of tiles; o = observed; e = expected (adjusted for area of the tile), and then comparing to a Chi-squared distribution with n-1 degrees of freedom (Burt et al., 2009).
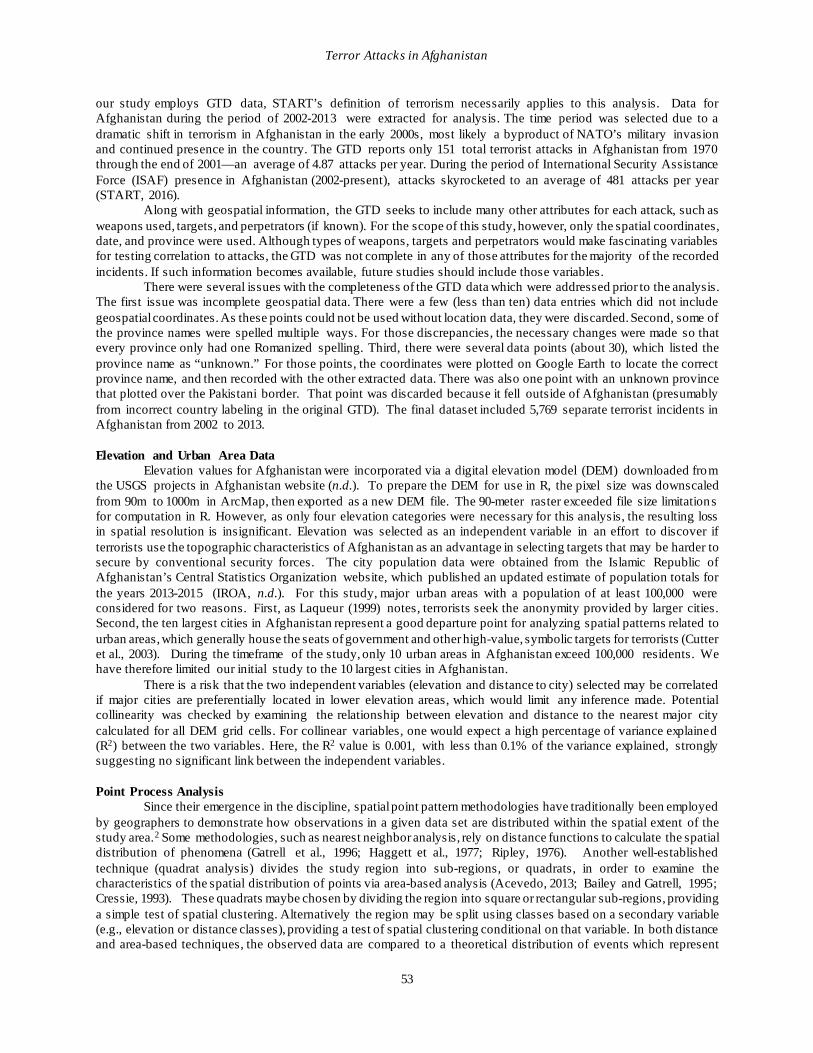
For the point process analysis in this study, data were read into R and stored in a point pattern object (ppp) comprised of the 5,769 attacks (xy coordinates) and an Afghanistan border shapefile (proprietary geographic file of ESRI GIS software) as the window. A density plot was created to reveal any spatial clustering of the data. Next, an initial quadrat count and quadrat test were performed (using rectangular 21 tiles) to test for spatial clustering within the study region. An illustration of the 21 tiles and observed number of attacks in each tile is provided in Figure 2.
Figure 2 Quadrat tiles with the observed number of attacks during the study period

Terror Attacks in Afghanistan
55
A second analysis examined the relationship between attack location and elevation. A digital elevation model (DEM) file was then imported into R using the raster function, fit to the border window, and converted to a pixel object. Quartiles of elevation values were then created, each value was assigned to an elevation class, and a tessellation was created based on the four elevation classes, and each attack was then assigned to one of the elevation classes. The final analysis examined the location of attacks with respect to the 10 largest cities in Afghanistan. City coordinates for the urban areas were imported and stored in a point pattern object. Distance categories were established at 10, 50, 100, and 500 kilometers to the nearest city. Each attack was assigned to a distance category and quadrat analysis performed.
ANALYSIS AND RESULTS
Beginning with some spatial and temporal descriptions, Figure 3 displays a map of Afghanistan with major cities, elevation, and terrorist attack locations. Also included is a histogram of the attacks grouped by year. As expected, the attacks do not appear to be normally distributed. As an interesting point, there is a well-defined ring of attacks that delineates the Ring Road connecting many major cities. Perhaps more useful than examining the mean and standard deviation with this data set is considering the distribution of attacks by province, by year, and by month.
Figure 3. Map of terror attacks in Afghanistan grouped by year from 2002-2013.
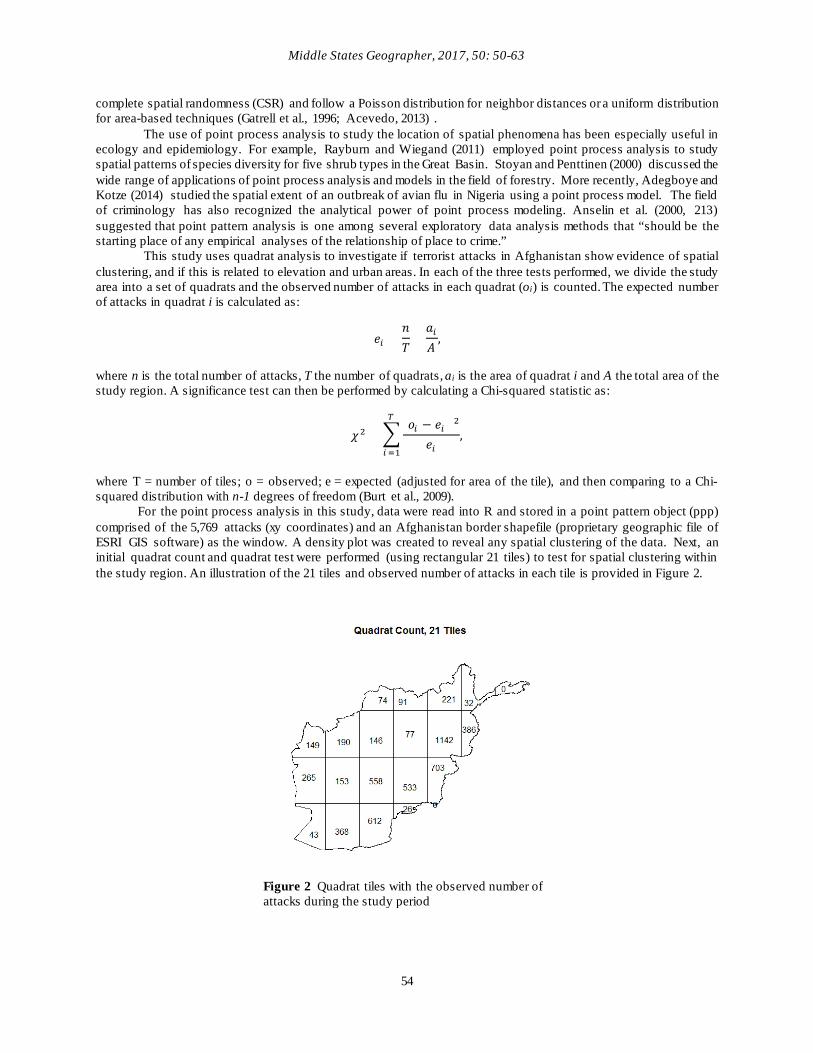
Figure 4 shows histograms of the total attacks in the provinces each year over the 12-year period. The graph
indicates a gradual increase in attacks over time (in most provinces) with a sharp increase in 2012, though many provinces show a dip in activity in 2010-2011 (for spatial reference and province names please review Figure 1). In order to test the statistical significance of the variation in number of attacks per year, a Chi-squared test is used. The provinces that did not have significant variation at α = 0.05, much of which is explained by the overall increase of attacks beginning in 2012 and 2013, are Daykundi (0.96) and Panjshir, (1.00) (p-value given in parentheses). The lack of statistical significance is likely a result of the low number of attacks in those provinces.
The increase of terrorist activity in 2012 coincides with the global awareness of the U.S. drawdown of forces in Afghanistan, initiated by President Obama in a televised speech on June 22, 2011. This drawdown began in southern Afghanistan in Helmand and Kandahar provinces where the greatest terrorist activity has occurred after 2002 (Radin,
Middle States Geographer, 2017, 50: 50-63
56
2011). The newest plan delayed U.S. troop removal, and 9,800 service members remained in Afghanistan through 2016 (Acosta and Diamond, 2015; Jolly, 2016). The U.S. presence will remain at varying levels in Kabul, Bagram, and parts of south and east Afghanistan for the foreseeable future (Department of Defense, 2015).
Figure 4. Histograms of terror attacks per year by province.
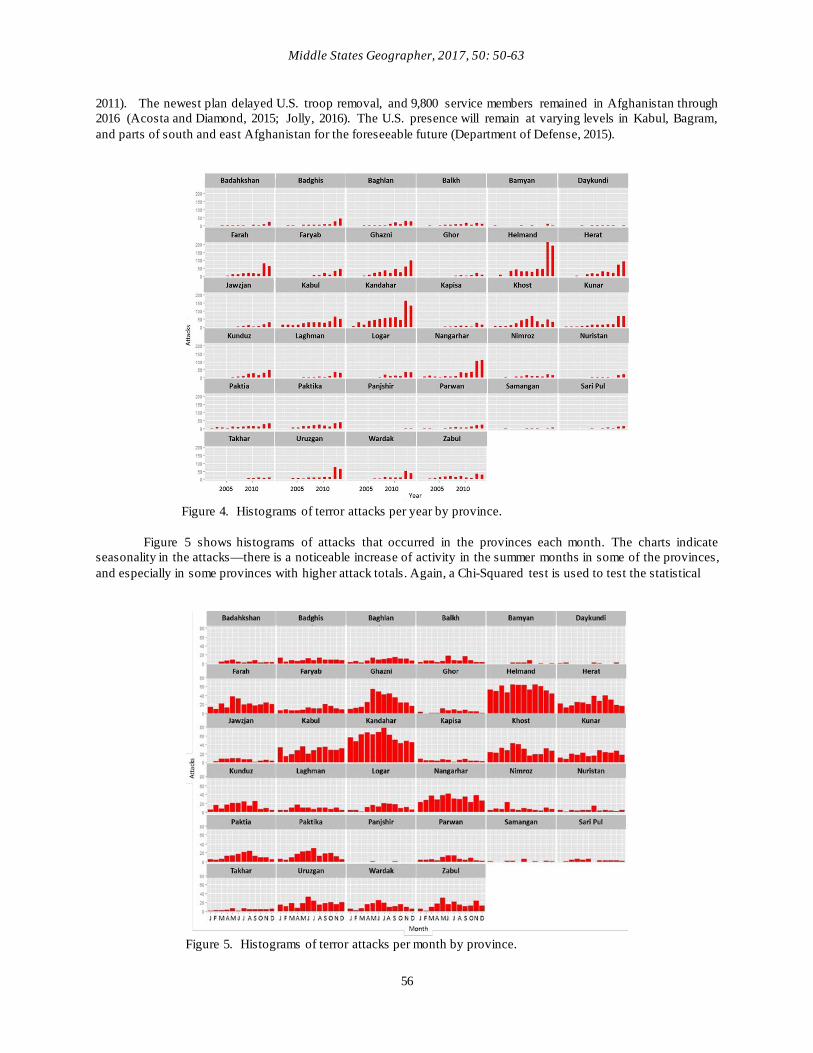
Figure 5 shows histograms of attacks that occurred in the provinces each month. The charts indicate
seasonality in the attacks—there is a noticeable increase of activity in the summer months in some of the provinces, and especially in some provinces with higher attack totals. Again, a Chi-Squared test is used to test the statistical
Figure 5. Histograms of terror attacks per month by province.

Terror Attacks in Afghanistan
57
significance of variation in number of attacks per month for each province at α = 0.05. The provinces not found to have significant variation, hence no significant seasonality trends in attacks, are Badghis (0.52), Daykundi (0.36), Helmand (0.40), Kabul (0.07), Kapisa (0.65), Laghman (0.26), Nangarhar (0.21), Panjshir (1.00), Sari Pul (0.23), and Takhar (0.61) (p-value given in parentheses). Many of these provinces had low terrorist attack activity; however, three of these provinces, Helmand, Kabul, and Nangarhar, did have relatively high numbers of attacks within the study period. In these three provinces, seasonality in attacks may be due to specific environmental factors (e.g., desert vs. mountain, Kabul’s capital city status, urban vs. rural). Further research is required to determine why seasonality of terrorist attacks is not a factor in these particular provinces.
The apparent seasonal trend in most provinces studied counters previous literature findings on terrorism that found no seasonality of terrorist attacks using the RAND Corporation’s Chronology of International Terrorism Database (Weimann and Brosius, 1988). It has long been debated whether or not temperature and seasonality affect conflict, and study results vary.3 It is possible that the seasonality in Weimann and Brosius’s (1988) study was offset by the inclusion of all international terrorist attacks in the database. The amount of influence seasonality and/or temperature will have on conflict may be place or culture specific, as shown here in different provinces. The Taliban have a “fighting season” that begins in the spring when their crops have been harvested. For many of them, the crops are poppy and the harvest feeds the drug market (Blank, 2014). The Taliban may not be the only group who designates a time for fighting. Siebeneck et al. (2009) showed correlation between terrorist attacks in Iraq and specific dates throughout the year. One major consideration is that for regions which see more seasonal conflict due to warmer temperatures, changing climates may facilitate more conflict now and in the future. Decreased seasonality (i.e., higher average temperatures) could be a disaster for counter-terrorist activity by security forces (for spatial reference, please review Figure 1). Point Pattern Analysis Results
To perform the point process analysis, the country was divided into 21 tiles and a quadrat count was completed (see Figure 2). Finally, a quadrat test was performed to test the data against a uniform distribution. The test resulted in a Chi-squared value of 3954.12 and a p-value of less than 0.001. The resulting p-value is statistically significant, and the null hypothesis (random distribution of attacks) is rejected. The alternative hypothesis (clustered distribution) is therefore accepted, indicating the likely presence of a process which controls the spatial distribution of terror attacks.
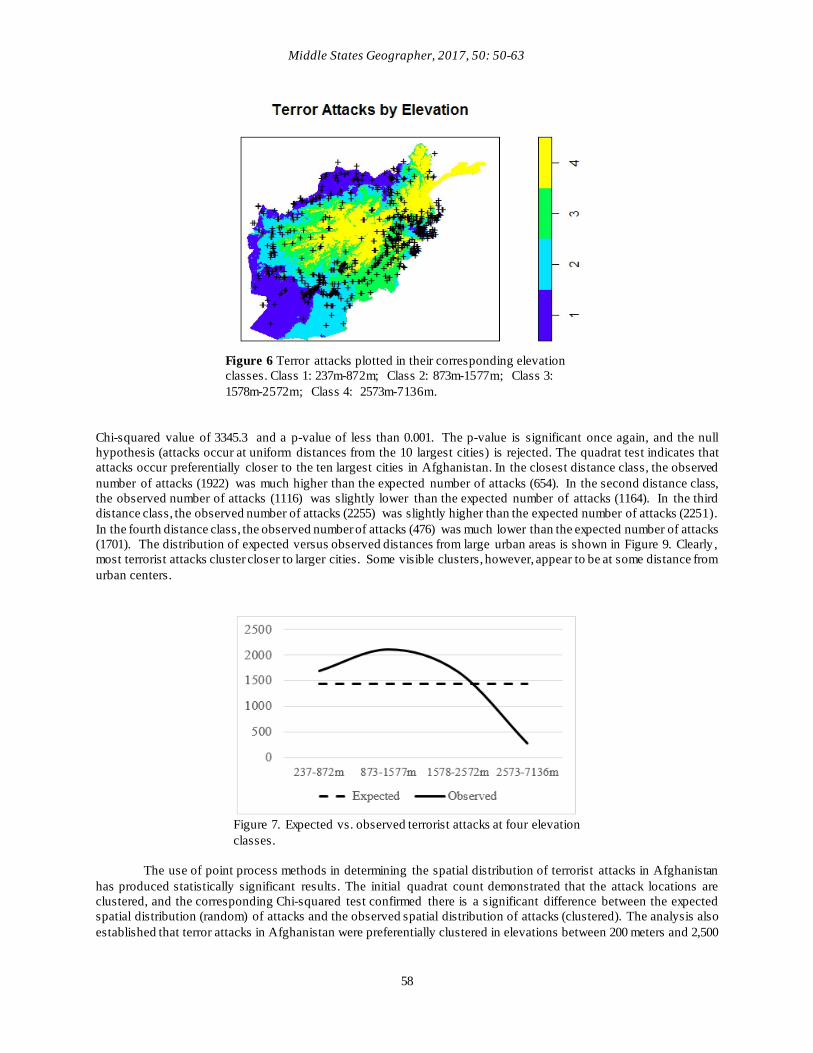
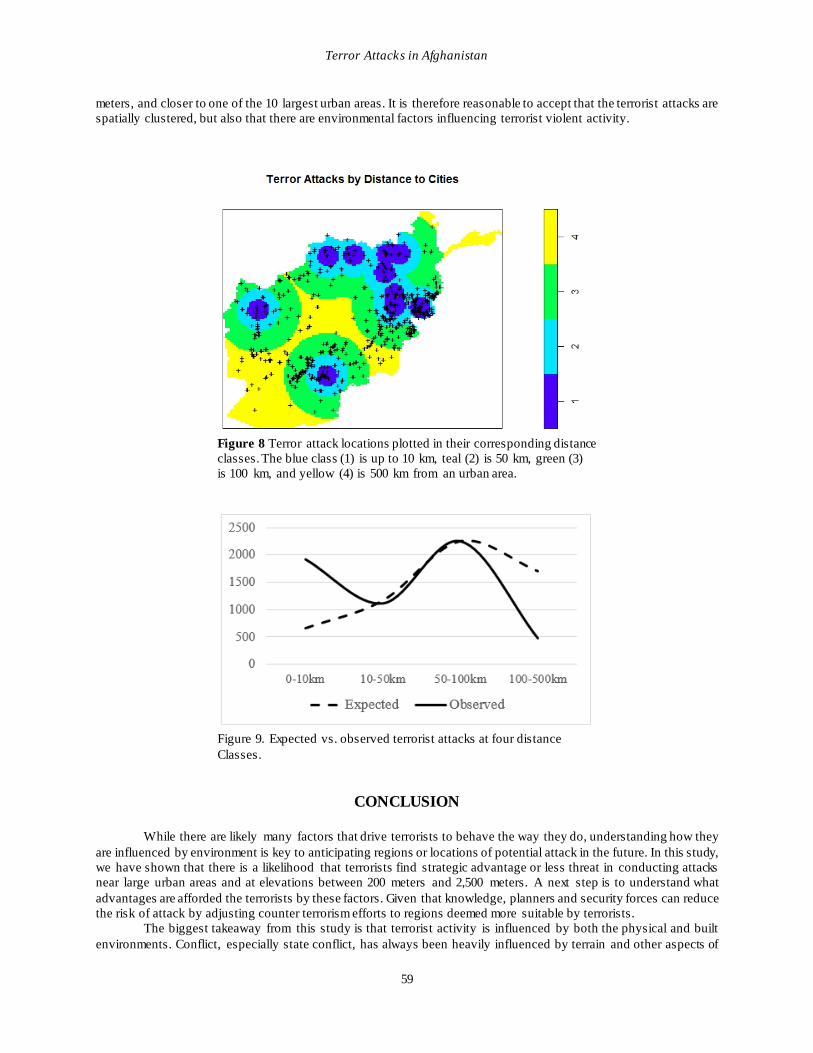
To test for covariation between attack location and elevation, the attacks were plotted in one of four elevation classes (quartiles of the elevation values: 237m-872m; 873m-1577m; 1578m-2572m; and 2573m-7136m). It should be noted that within the lowest elevation class are five of the ten cities, within the second class are three, and the third class has two. The highest elevation class has no major cities in it. Figure 6 depicts each attack location and its corresponding elevation class. The quadrat test for the elevation classes resulted in a Chi-squared value of 1345.12 and a p-value of less than 0.001. This p-value is significant, and the null hypothesis (attacks occur uniformly across elevation classes) is rejected. The results indicate that the strongest clustering of attacks is found in the second lowest elevation class (872m-1577m). In the lowest three elevation classes, the observed numbers of attacks (lowest – 1695, second lowest – 2118, and third lowest – 1681) were all higher than the expected number of attacks (1442). In the highest elevation class, the observed number (275) was much lower than expected number of attacks (1442). Figure 7 shows the observed vs. expected trend for elevation classes. While the expected elevation is the same for all classes, the second class exhibits the largest variation. The first and third elevation classes do register as higher than expected, but as shown by the figure, not much higher. The second elevation class (872m-1577m) contains NATO’s high altitude threshold of 1200 meters (NATO, 2011). The third and fourth elevation classes are entirely above the high elevation threshold. Although the spatial clustering of attacks occurs in the lower three classes, 48% of the total events occurred above 1200 meters. Moreover, if terrorists were targeting cities without other environmental considerations, we would expect to see more attacks in the lowest elevation category which houses five of the 10 largest cities. Yet, this elevation category yielded only 1,695 attacks. Combined, the second and third elevation categories house five of the ten largest urban areas. Yet, these categories experienced a total of 3,799 attacks for the same number of large urban areas—more than double the attacks near the five cities in the lowest elevation category. This indicates that terrorists could be seeking targets in the relatively higher elevation cities that afford them more environmental advantages which neutralize technological advantages of NATO forces.
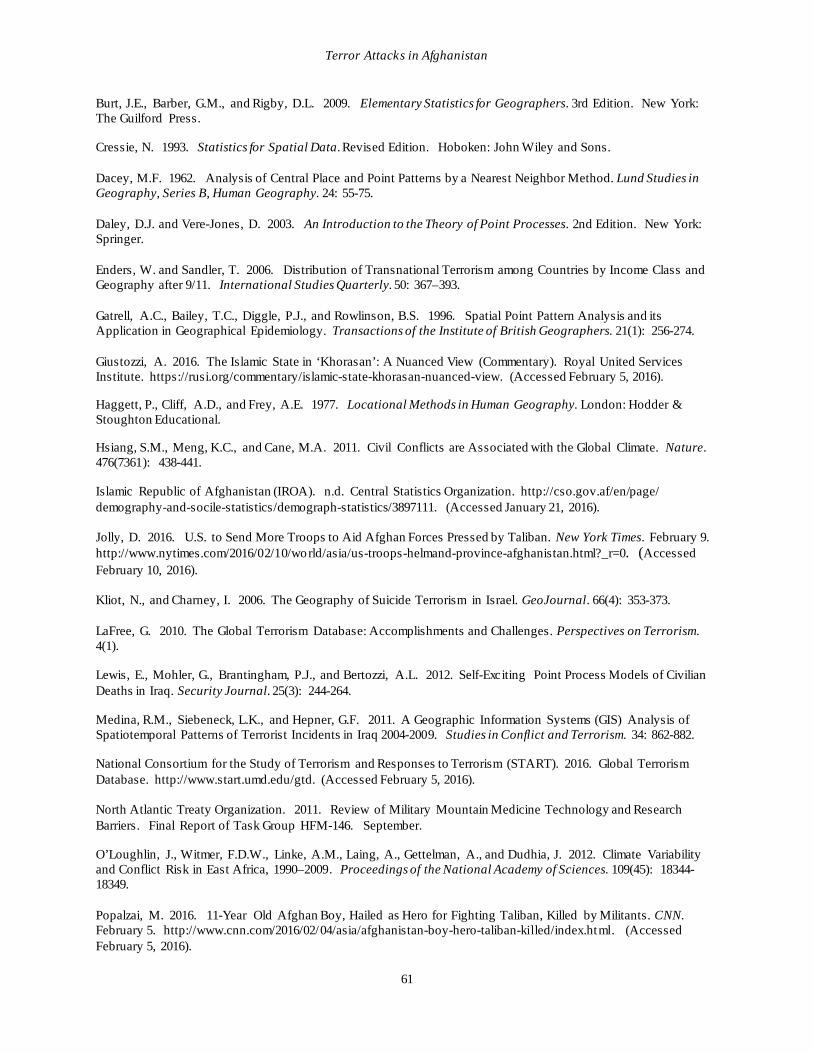
To test for covariation between attack location and distance to large cities, the attacks were plotted in one of four distance classes (up to 10 km, 50 km, 100 km, and 500 km) from the 10 largest cities in Afghanistan. Figure 8 shows each terror attack location and its assigned distance class. The quadrat test for the distance classes resulted in a
Middle States Geographer, 2017, 50: 50-63
58
Figure 6 Terror attacks plotted in their corresponding elevation classes. Class 1: 237m-872m; Class 2: 873m-1577m; Class 3: 1578m-2572m; Class 4: 2573m-7136m.
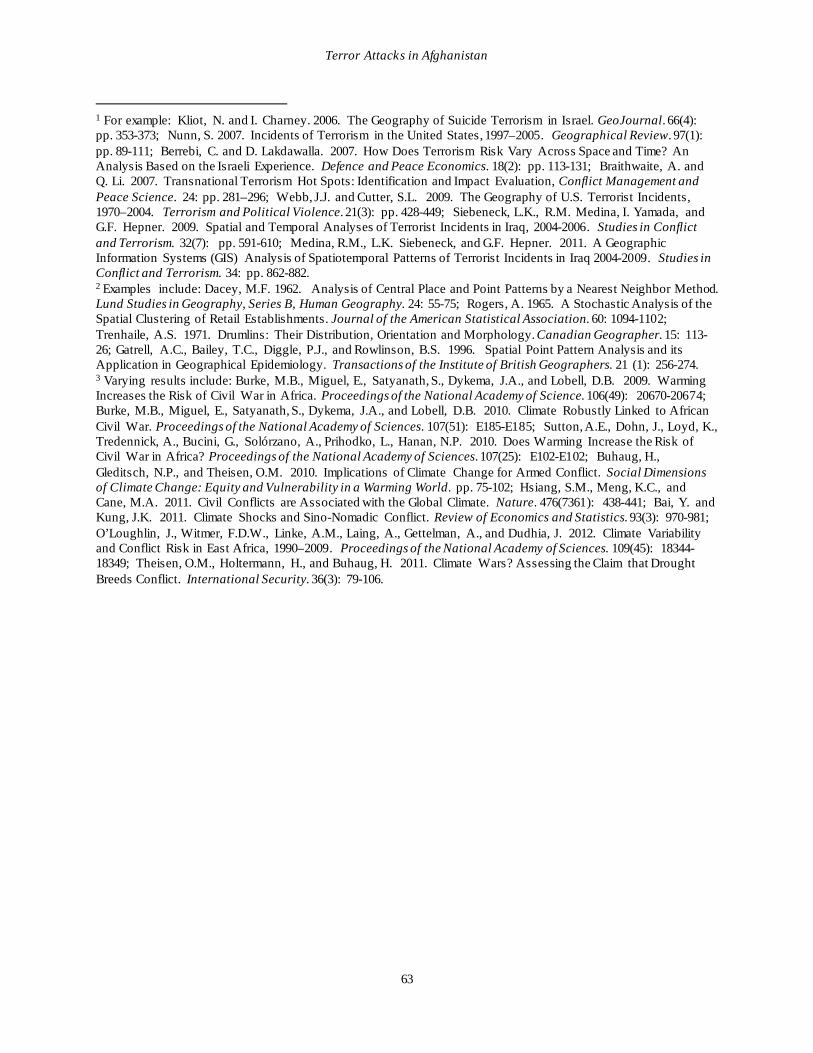
Chi-squared value of 3345.3 and a p-value of less than 0.001. The p-value is significant once again, and the null hypothesis (attacks occur at uniform distances from the 10 largest cities) is rejected. The quadrat test indicates that attacks occur preferentially closer to the ten largest cities in Afghanistan. In the closest distance class, the observed number of attacks (1922) was much higher than the expected number of attacks (654). In the second distance class, the observed number of attacks (1116) was slightly lower than the expected number of attacks (1164). In the third distance class, the observed number of attacks (2255) was slightly higher than the expected number of attacks (2251). In the fourth distance class, the observed number of attacks (476) was much lower than the expected number of attacks (1701). The distribution of expected versus observed distances from large urban areas is shown in Figure 9. Clearly , most terrorist attacks cluster closer to larger cities. Some visible clusters, however, appear to be at some distance from urban centers.
Figure 7. Expected vs. observed terrorist attacks at four elevation classes.
The use of point process methods in determining the spatial distribution of terrorist attacks in Afghanistan
has produced statistically significant results. The initial quadrat count demonstrated that the attack locations are clustered, and the corresponding Chi-squared test confirmed there is a significant difference between the expected spatial distribution (random) of attacks and the observed spatial distribution of attacks (clustered). The analysis also established that terror attacks in Afghanistan were preferentially clustered in elevations between 200 meters and 2,500
Terror Attacks in Afghanistan
59
meters, and closer to one of the 10 largest urban areas. It is therefore reasonable to accept that the terrorist attacks are spatially clustered, but also that there are environmental factors influencing terrorist violent activity.
Figure 8 Terror attack locations plotted in their corresponding distance classes. The blue class (1) is up to 10 km, teal (2) is 50 km, green (3) is 100 km, and yellow (4) is 500 km from an urban area.
Figure 9. Expected vs. observed terrorist attacks at four distance Classes.
CONCLUSION
While there are likely many factors that drive terrorists to behave the way they do, understanding how they are influenced by environment is key to anticipating regions or locations of potential attack in the future. In this study, we have shown that there is a likelihood that terrorists find strategic advantage or less threat in conducting attacks near large urban areas and at elevations between 200 meters and 2,500 meters. A next step is to understand what advantages are afforded the terrorists by these factors. Given that knowledge, planners and security forces can reduce the risk of attack by adjusting counter terrorism efforts to regions deemed more suitable by terrorists.
The biggest takeaway from this study is that terrorist activity is influenced by both the physical and built environments. Conflict, especially state conflict, has always been heavily influenced by terrain and other aspects of

Middle States Geographer, 2017, 50: 50-63
60
the physical environment (e.g., weather). It is also influenced by the built environment (e.g., roads, buildings). These factors may not be as influential when dealing with smaller, guerilla-based organizations, as they are when moving large armies. However, they will still be factors. Terrorists need places to plan, hide, train, and attack. Planning effective terror attacks requires knowledge and exploitation of the environment and surroundings.
The results of this study help lay the foundation for future spatial analyses of terrorism in Afghanistan and other areas. It is likely that several other covariates influence the observed spatial patterns of violence. For example, it would be fascinating to test the covariation of ISAF base locations and terror attack locations. Due to personnel security concerns, base locations are not available to the general public, but future studies may be able to obtain those data when they become declassified. Other potential covariates include land use patterns, relief, resource availability , education levels, and unemployment. This point process analysis could serve as the departure point for further studies in the geography of terrorism. As more data become available, additional spatial analyses will bring us closer to understanding why terrorism occurs where it does.
REFERENCES
Acevedo, M.F. 2013. Data Analysis and Statistics for Geography, Environmental Science and Engineering. Boca Raton: CRC Press. Acosta, J. and Diamond, J. 2015. Obama Again Delays Afghanistan Troop Drawdown. CNN. October 15. http://www.cnn.com/2015/10/15/politics/afghanistan-troops-obama/. (Accessed February 10, 2016). Adegboye, O.A. and Kotze, D. 2014. Epidemiological Analysis of Spatially Misaligned Data: A Case of Highly Pathogenic Avian Influenza Virus Outbreak in Nigeria. Epidemiology and Infection. 142(5): 940-949. Anselin, L., Cohen, J., Cook, D., Gorr, W., and Tita, G. 2000. Spatial Analyses of Crime. Criminal Justice. 4: 213-262. Bai, Y. and Kung, J.K. 2011. Climate Shocks and Sino-Nomadic Conflict. Review of Economics and Statistics. 93(3): 970-981. Bailey, T.C. and Gatrell, A.C. 1995. Interactive Spatial Data Analysis. London: Routledge. Barker, A. 2011. Improvised Explosive Devices in Southern Afghanistan and Western Pakistan, 2002–2009. Studies in Conflict and Terrorism. 34(8): 600-620. Berrebi, C., and Lakdawalla, D. 2007. How Does Terrorism Risk Vary Across Space and Time? An Analysis Based on the Israeli Experience. Defence and Peace Economics. 18(2): 113-131. Blank, J. 2014. Is There a Hidden Message in the Taliban’s 2014 Fighting Season Plan? The Forgotten History of the Battle of Khaibar Offers Some Alluring Hints. Foreign Policy. May 29. http://foreignpolicy.com/2014/05/29/ is-there-a-hidden-message-in-the-talibans-2014-fighting-season-plan/. (Accessed February 12, 2016). Braithwaite, A. and Li, Q. 2007. Transnational Terrorism Hot Spots: Identification and Impact Evaluation, Conflict Management and Peace Science. 24: 281–296. Buhaug, H., Gleditsch, N.P., and Theisen, O.M. 2010. Implications of Climate Change for Armed Conflict. Social Dimensions of Climate Change: Equity and Vulnerability in a Warming World. 75-102. Burke, M.B., Miguel, E., Satyanath, S., Dykema, J.A., and Lobell, D.B. 2010. Climate Robustly Linked to African Civil War. Proceedings of the National Academy of Sciences. 107(51): E185-E185. __________. 2009. Warming Increases the Risk of Civil War in Africa. Proceedings of the National Academy of Science 106(49), 20670-20674.
Terror Attacks in Afghanistan
61
Burt, J.E., Barber, G.M., and Rigby, D.L. 2009. Elementary Statistics for Geographers. 3rd Edition. New York: The Guilford Press. Cressie, N. 1993. Statistics for Spatial Data. Revised Edition. Hoboken: John Wiley and Sons. Dacey, M.F. 1962. Analysis of Central Place and Point Patterns by a Nearest Neighbor Method. Lund Studies in Geography, Series B, Human Geography. 24: 55-75. Daley, D.J. and Vere-Jones, D. 2003. An Introduction to the Theory of Point Processes. 2nd Edition. New York: Springer. Enders, W. and Sandler, T. 2006. Distribution of Transnational Terrorism among Countries by Income Class and Geography after 9/11. International Studies Quarterly. 50: 367–393. Gatrell, A.C., Bailey, T.C., Diggle, P.J., and Rowlinson, B.S. 1996. Spatial Point Pattern Analysis and its Application in Geographical Epidemiology. Transactions of the Institute of British Geographers. 21(1): 256-274. Giustozzi, A. 2016. The Islamic State in ‘Khorasan’: A Nuanced View (Commentary). Royal United Services Institute. https://rusi.org/commentary/islamic-state-khorasan-nuanced-view. (Accessed February 5, 2016). Haggett, P., Cliff, A.D., and Frey, A.E. 1977. Locational Methods in Human Geography. London: Hodder & Stoughton Educational. Hsiang, S.M., Meng, K.C., and Cane, M.A. 2011. Civil Conflicts are Associated with the Global Climate. Nature. 476(7361): 438-441. Islamic Republic of Afghanistan (IROA). n.d. Central Statistics Organization. http://cso.gov.af/en/page/ demography-and-socile-statistics/demograph-statistics/3897111. (Accessed January 21, 2016). Jolly, D. 2016. U.S. to Send More Troops to Aid Afghan Forces Pressed by Taliban. New York Times. February 9. http://www.nytimes.com/2016/02/10/world/asia/us-troops-helmand-province-afghanistan.html?_r=0. (Accessed February 10, 2016). Kliot, N., and Charney, I. 2006. The Geography of Suicide Terrorism in Israel. GeoJournal. 66(4): 353-373. LaFree, G. 2010. The Global Terrorism Database: Accomplishments and Challenges. Perspectives on Terrorism. 4(1). Lewis, E., Mohler, G., Brantingham, P.J., and Bertozzi, A.L. 2012. Self-Exciting Point Process Models of Civilian Deaths in Iraq. Security Journal. 25(3): 244-264. Medina, R.M., Siebeneck, L.K., and Hepner, G.F. 2011. A Geographic Information Systems (GIS) Analysis of Spatiotemporal Patterns of Terrorist Incidents in Iraq 2004-2009. Studies in Conflict and Terrorism. 34: 862-882. National Consortium for the Study of Terrorism and Responses to Terrorism (START). 2016. Global Terrorism Database. http://www.start.umd.edu/gtd. (Accessed February 5, 2016). North Atlantic Treaty Organization. 2011. Review of Military Mountain Medicine Technology and Research Barriers. Final Report of Task Group HFM-146. September. O’Loughlin, J., Witmer, F.D.W., Linke, A.M., Laing, A., Gettelman, A., and Dudhia, J. 2012. Climate Variability and Conflict Risk in East Africa, 1990–2009. Proceedings of the National Academy of Sciences. 109(45): 18344-18349. Popalzai, M. 2016. 11-Year Old Afghan Boy, Hailed as Hero for Fighting Taliban, Killed by Militants. CNN. February 5. http://www.cnn.com/2016/02/04/asia/afghanistan-boy-hero-taliban-killed/index.html. (Accessed February 5, 2016).

Middle States Geographer, 2017, 50: 50-63
62
Ripley, B.D. 1976. The Second-Order Analysis of Stationary Point Processes. Journal of Applied Probability.13: 255–266. Radin, C.J. 2011. Analysis: US Military Strategy in Afghanistan Shifts as Forces Draw Down. Long War Journal. August 3. http://www.longwarjournal.org/archives/2011/08/the_military_strateg_1.php. (Accessed February 10, 2016). Rayburn, A.P. and Wiegand, T. 2011. Individual Species – Area Relationships and Spatial Patterns of Species Diversity in a Great Basin, Semi-Arid Shrubland. Ecography. 35: 341-347. Rogers, A. 1965. A Stochastic Analysis of the Spatial Clustering of Retail Establishments. Journal of the American Statistical Association. 60: 1094-1102. Siebeneck, L.K., Medina, R.M., Yamada, I., and Hepner, F.G. 2009. Spatial and Temporal Analyses of Terrorist Incidents in Iraq, 2004-2006. Studies in Conflict and Terrorism 32(7): 591-610. Stoyan, D. and Penttinen, A. 2000. Recent Applications of Point Process Methods in Forestry Statistics. Statistical Science. 15(1): 61-78. Sutton, A.E., Dohn, J., Loyd, K., Tredennick, A., Bucini, G., Solórzano, A., Prihodko, L., and Hanan, N.P. 2010. Does Warming Increase the Risk of Civil War in Africa? Proceedings of the National Academy of Sciences. 107(25): E102-E102. Theisen, O.M., Holtermann, H., and Buhaug, H. 2011. Climate Wars? Assessing the Claim that Drought Breeds Conflict. International Security. 36(3): 79-106. Trenhaile, A.S. 1971. Drumlins: Their Distribution, Orientation and Morphology. Canadian Geographer. 15: 113-26. United States Department of the Army. 2010. Altitude Acclimatization and Illness Management TB MED 505. Technical Bulletin. September. http://armypubs.army.mil/med/DR_pubs/dr_a/pdf/tbmed505.pdf. (Accessed March 14, 2016). United States Department of Defense (DOD). 2015. Enhancing security and stability in Afghanistan. Report to Congress in accordance with Section 1225 of the Carl Levin and Howard P. “Buck” McKeon National Defense Authorization Act (NDAA) For Fiscal Year 2015. 113-291. United States Geological Survey (USGS). n.d. Afghanistan 90-meter SRTM Digital Elevation Model (DEM) [afghan_dem.esri_grid.zip]. http://afghanistan.cr.usgs.gov/geospatial-reference-datasets. (Accessed December 6, 2014). Webb, J.J. and Cutter, S.L. 2009. The Geography of U.S. Terrorist Incidents, 1970–2004. Terrorism and Political Violence. 21(3): 428-449. Weimann, G. and Brosius, H. 1988. The Predictability of International Terrorism: A Time-Series Analysis. Studies in Conflict and Terrorism. 11: 491-502. White, G., Porter, M.D., and Mazerolle, L. 2013. Terrorism Risk, Resilience and Volatility: A Comparison of Terrorism Patterns in Three Southeast Asian Countries. Journal of Quantitative Criminology. 29(2): 295-320. Zammit-Mangion, A., Dewar, M., Kadirkamanathan, V., and Sanguinetti, G. 2012. Point Process Modelling of the Afghan War Diary. Proceedings of the National Academy of Sciences. 109(31): 12414-12419.
Terror Attacks in Afghanistan
63
1 For example: Kliot, N. and I. Charney. 2006. The Geography of Suicide Terrorism in Israel. GeoJournal. 66(4): pp. 353-373; Nunn, S. 2007. Incidents of Terrorism in the United States, 1997–2005. Geographical Review. 97(1): pp. 89-111; Berrebi, C. and D. Lakdawalla. 2007. How Does Terrorism Risk Vary Across Space and Time? An Analysis Based on the Israeli Experience. Defence and Peace Economics. 18(2): pp. 113-131; Braithwaite, A. and Q. Li. 2007. Transnational Terrorism Hot Spots: Identification and Impact Evaluation, Conflict Management and Peace Science. 24: pp. 281–296; Webb, J.J. and Cutter, S.L. 2009. The Geography of U.S. Terrorist Incidents, 1970–2004. Terrorism and Political Violence. 21(3): pp. 428-449; Siebeneck, L.K., R.M. Medina, I. Yamada, and G.F. Hepner. 2009. Spatial and Temporal Analyses of Terrorist Incidents in Iraq, 2004-2006. Studies in Conflict and Terrorism. 32(7): pp. 591-610; Medina, R.M., L.K. Siebeneck, and G.F. Hepner. 2011. A Geographic Information Systems (GIS) Analysis of Spatiotemporal Patterns of Terrorist Incidents in Iraq 2004-2009. Studies in Conflict and Terrorism. 34: pp. 862-882. 2 Examples include: Dacey, M.F. 1962. Analysis of Central Place and Point Patterns by a Nearest Neighbor Method. Lund Studies in Geography, Series B, Human Geography. 24: 55-75; Rogers, A. 1965. A Stochastic Analysis of the Spatial Clustering of Retail Establishments. Journal of the American Statistical Association. 60: 1094-1102; Trenhaile, A.S. 1971. Drumlins: Their Distribution, Orientation and Morphology. Canadian Geographer. 15: 113-26; Gatrell, A.C., Bailey, T.C., Diggle, P.J., and Rowlinson, B.S. 1996. Spatial Point Pattern Analysis and its Application in Geographical Epidemiology. Transactions of the Institute of British Geographers. 21 (1): 256-274. 3 Varying results include: Burke, M.B., Miguel, E., Satyanath, S., Dykema, J.A., and Lobell, D.B. 2009. Warming Increases the Risk of Civil War in Africa. Proceedings of the National Academy of Science. 106(49): 20670-20674; Burke, M.B., Miguel, E., Satyanath, S., Dykema, J.A., and Lobell, D.B. 2010. Climate Robustly Linked to African Civil War. Proceedings of the National Academy of Sciences. 107(51): E185-E185; Sutton, A.E., Dohn, J., Loyd, K., Tredennick, A., Bucini, G., Solórzano, A., Prihodko, L., Hanan, N.P. 2010. Does Warming Increase the Risk of Civil War in Africa? Proceedings of the National Academy of Sciences. 107(25): E102-E102; Buhaug, H., Gleditsch, N.P., and Theisen, O.M. 2010. Implications of Climate Change for Armed Conflict. Social Dimensions of Climate Change: Equity and Vulnerability in a Warming World. pp. 75-102; Hsiang, S.M., Meng, K.C., and Cane, M.A. 2011. Civil Conflicts are Associated with the Global Climate. Nature. 476(7361): 438-441; Bai, Y. and Kung, J.K. 2011. Climate Shocks and Sino-Nomadic Conflict. Review of Economics and Statistics. 93(3): 970-981; O’Loughlin, J., Witmer, F.D.W., Linke, A.M., Laing, A., Gettelman, A., and Dudhia, J. 2012. Climate Variability and Conflict Risk in East Africa, 1990–2009. Proceedings of the National Academy of Sciences. 109(45): 18344-18349; Theisen, O.M., Holtermann, H., and Buhaug, H. 2011. Climate Wars? Assessing the Claim that Drought Breeds Conflict. International Security. 36(3): 79-106.