a point-correspondence approach to describing … · 2013-01-17 · a point-correspondence approach...
TRANSCRIPT

A POINT-CORRESPONDENCE APPROACH TO DESCRIBING THE DISTRIBUTION OFIMAGE FEATURES ON ANATOMICAL SURFACES, WITH APPLICATION TO ATRIAL
FIBRILLATION
Gregory Gardner?†, Alan Morris†, Koji Higuchi†‡, Robert MacLeod?†, and Joshua Cates?†
?Scientific Computing and Imaging Institute University of Utah, Salt Lake City, UT, USA† CARMA Center, University of Utah, Salt Lake City, UT, USA
‡ University of Utah Hospital, Salt Lake City, UT, USA
ABSTRACTThis paper describes a framework for summarizing and com-paring the distributions of image features on anatomicalshape surfaces in populations. The approach uses a point-based correspondence model to establish a mapping amongsurface positions and may be useful for anatomy that exhibitsa relatively high degree of shape variability, such as cardiacanatomy. The approach is motivated by the MRI-based studyof diseased, or fibrotic, tissue in the left atrium of atrial fib-rillation (AF) patients, which has been difficult to measurequantitatively using more established image and surface reg-istration techniques. The proposed method is to establish aset of point correspondences across a population of shapesurfaces that provides a mapping from any surface to a com-mon coordinate frame, where local features like fibrosis canbe directly compared. To establish correspondence, we use apreviously-described statistical optimization of particle-basedshape representations. For our atrial fibrillation population,the proposed method provides evidence that more intense andwidely distributed fibrosis patterns exist in patients that donot respond well to radiofrequency ablation therapy.
Index Terms— Correspondence, Atrial Fibrillation,LGE-MRI, Particle System
1. INTRODUCTION
In this work, we propose a framework for the summary andcomparison of the distribution of local image features in apopulation of anatomical surfaces. The approach uses a point-based correspondence model of surface shape to establish amapping among surfaces and may be especially useful foranatomy that exhibits relatively high variability in shape, suchas cardiac anatomy. Our motivating application is an analy-sis of the distribution of fibrosis, or diseased tissue, in the leftatrial (LA) walls of atrial fibrillation (AF) patient populations.Comparison of features on the LA wall is difficult due to thevariability of anatomical structure [1] and unclear boundariesbetween adjacent anatomical structures. Moreover, the lackof consistent anatomical features across the LA surface makes
even manual placement of landmarks unreliable. Conven-tional image-based registration techniques have also provenunreliable for this application because cardiac MRI suffersfrom inconsistent quality and appearance across subjects [2].
To compare image features on the LA wall, we proposeto estimate a finite set of correspondence positions using themethods previously introduced by Cates, et al. in [3, 4, 5]for modeling anatomical shape. These methods automaticallysample each surface in the population to produce a set of cor-respondences that is statistically optimal, in the sense that itminimizes the information content of the model while main-taining a good representation of shape surface geometry. Thedensity of correspondence points can be adjusted to model ge-ometric features at the scale appropriate for a given analysis.Once correspondence is established, an exact 1 − 1 mappingexists among all shapes, and image features may be comparedat these points. Correspondence may also be estimated at anyarbitrary surface position with a suitable interpolation, suchas the radial basis function approach given by Bookstein [6].
Tissue changes in the LA wall are of particular interestfor the study and treatment of AF, which is estimated to af-fect more than 10 million people worldwide by 2025 and isassociated with a 5x increased risk of stroke [7, 8]. Numer-ous studies have shown that AF is accompanied by electri-cal and structural remodeling of the LA (see, e.g., [9]) thatleads to depletion of cardiac myocytes and an increase in pro-arrhythmic, collagenous tissue in the LA wall, termed fibro-sis. Recently, late gadolinium enhanced magnetic resonanceimaging (LGE-MRI) has been used to localize fibrosis in theLA. Clinicians use these LGE-MRI scans to guide catheterablation procedures, where the sources of rogue electrical sig-nals responsible for AF are cauterized with radiofrequency(RF) energy in a procedure known as RF ablation.
The extent of LA fibrosis is a major predictor of RF abla-tion success in AF patients [10]. Presumably, more diseasedtissue in the LA requires more extensive ablation proceduresto be successful. However, it is not well understood howthe distribution of fibrosis within the LA affects RF ablationoutcomes, nor are there standard methods for quantitative as-
sessment of these distributions. Improved characterization ofthe LA tissue, by examining how fibrosis distributions varyacross ablation outcomes, would allow clinicians to under-stand, and specifically target, fibrotic regions commonly ob-served in patients with failed procedures. To probe how fi-brosis patterns vary with ablation outcomes, we divided theshape population based on ablation outcomes and generatedthe fibrosis distribution for successful and failed ablation pro-cedures. Using the proposed methodology for feature com-parison across LA surfaces, we found evidence that fibrotictissue for AF patients is most prevalent on the posterior sur-face of the LA. Moreover, patients with failed RF-ablationtreatments exhibit more intense and widespread distributionsof fibrotic tissue. Insights such as these into the spatial dis-tribution of fibrosis in AF may help to triage AF patients andbetter personalize their treatments by determining who willbe better candidates for RF-ablation.
2. RELATED WORK
Current studies of LA fibrosis report the extent of fibrosis asa total percentage of LA wall volume, rather than describ-ing its spatial distribution [10, 11]. Previous attempts to de-scribe the distribution of LA fibrosis used optical mapping ofisolated tissue or histological analysis of biopsies [12, 13].However, the invasiveness of both approaches preclude theiruse in living subjects. Moreover, current analyses of fibro-sis do not directly compare spatial distributions across sub-jects. Some work has been published on point-based corre-spondence for comparative studies of brain anatomy and localfeature variability. One such study used point-based modelsto examine variations in local cortical features, such as sul-cal depth, across subjects [5]. Cates et al. have proposed asystem for establishing inter-subject correspondence withouta parameterization of the surface or parameter tuning [3, 4].This technique underlies the methodology of this paper and isdiscussed in more detail in Section 3.2.
3. METHODOLOGY
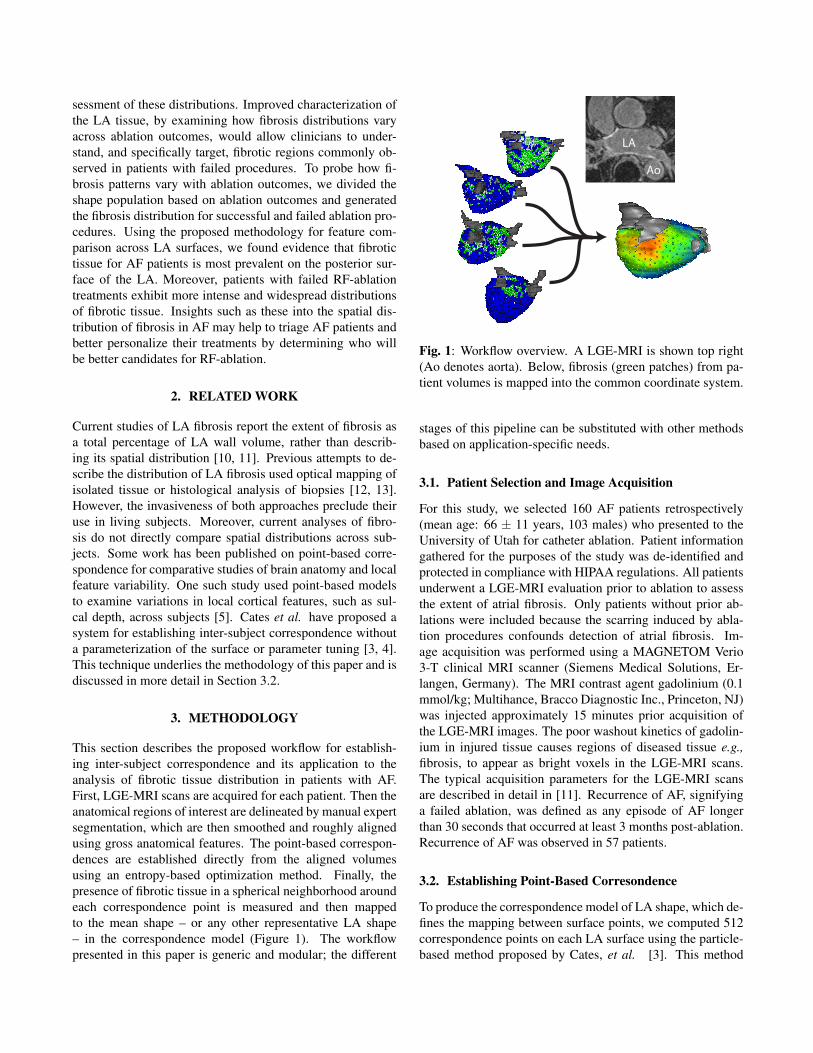
This section describes the proposed workflow for establish-ing inter-subject correspondence and its application to theanalysis of fibrotic tissue distribution in patients with AF.First, LGE-MRI scans are acquired for each patient. Then theanatomical regions of interest are delineated by manual expertsegmentation, which are then smoothed and roughly alignedusing gross anatomical features. The point-based correspon-dences are established directly from the aligned volumesusing an entropy-based optimization method. Finally, thepresence of fibrotic tissue in a spherical neighborhood aroundeach correspondence point is measured and then mappedto the mean shape – or any other representative LA shape– in the correspondence model (Figure 1). The workflowpresented in this paper is generic and modular; the different
LA
Ao
Fig. 1: Workflow overview. A LGE-MRI is shown top right(Ao denotes aorta). Below, fibrosis (green patches) from pa-tient volumes is mapped into the common coordinate system.
stages of this pipeline can be substituted with other methodsbased on application-specific needs.
3.1. Patient Selection and Image Acquisition
For this study, we selected 160 AF patients retrospectively(mean age: 66 ± 11 years, 103 males) who presented to theUniversity of Utah for catheter ablation. Patient informationgathered for the purposes of the study was de-identified andprotected in compliance with HIPAA regulations. All patientsunderwent a LGE-MRI evaluation prior to ablation to assessthe extent of atrial fibrosis. Only patients without prior ab-lations were included because the scarring induced by abla-tion procedures confounds detection of atrial fibrosis. Im-age acquisition was performed using a MAGNETOM Verio3-T clinical MRI scanner (Siemens Medical Solutions, Er-langen, Germany). The MRI contrast agent gadolinium (0.1mmol/kg; Multihance, Bracco Diagnostic Inc., Princeton, NJ)was injected approximately 15 minutes prior acquisition ofthe LGE-MRI images. The poor washout kinetics of gadolin-ium in injured tissue causes regions of diseased tissue e.g.,fibrosis, to appear as bright voxels in the LGE-MRI scans.The typical acquisition parameters for the LGE-MRI scansare described in detail in [11]. Recurrence of AF, signifyinga failed ablation, was defined as any episode of AF longerthan 30 seconds that occurred at least 3 months post-ablation.Recurrence of AF was observed in 57 patients.
3.2. Establishing Point-Based Corresondence
To produce the correspondence model of LA shape, which de-fines the mapping between surface points, we computed 512correspondence points on each LA surface using the particle-based method proposed by Cates, et al. [3]. This method

Fig. 2: Ablation success and spatial distribution of fibrosis. The LA posterior surface is shown in patients with (a.) successfuland (b.) poor outcomes. (c.) Patients with failed ablations showed higher percentages of fibrosis at most correspondence points.
models surfaces as particle systems and optimizes their con-figurations by balancing the information content in each shaperepresentation against the information content of the popula-tion of shapes. The inputs to the correspondence computationare aligned distance transforms from binary segmentation vol-umes, which form implicit object surface representations.
In our study, the boundaries of the LA myocardium weremanually segmented by experts using the Corview cardiacsegmentation and analysis software (CARMA Center, Uni-versity of Utah, www.corview.org). We thresholded the en-hancement in the original LGE-MRI image to localize thefibrosis within the LA wall [14]. We aligned the segmen-tations, with respect to translation, by shifting their originsto their center of mass. We assume a rough rotational align-ment because all patients are positioned in the same orienta-tion in the scanner. Later, during the optimization, this initialalignment is refined using the Procrustes algorithm to removeresidual, non-shape pose parameters (as described in [4]).
The LA segmentations contain an implicit shape surfaceat the boundary between the labeled pixels in the region ofinterest and the background pixels. To alleviate aliasing ar-tifacts at this boundary, we applied an antialiasing algorithmthat also preserves the position of surface boundaries [15].Antialiasing was followed by a very slight Gaussian blur op-eration to remove high-frequency artifacts arising from nu-merical approximations. We note that the location of the seg-mentation boundaries is not appreciably altered by filteringand remained accurate to within two pixels.
3.3. Evaluating Correspondence Accuracy
As a measure of the correspondence model’s accuracy, wemapped manually-determined landmarks to the population’smean shape and analyzed their distributions. The mean shapeis computed as the set of average positions of each correspon-dence point across the population of shapes. The landmarksconsist of the following: the center of the mitral valve and theinsertion sites of the LA appendage and 4 pulmonary veins for18 randomly selected patients from the population. The con-
tinuous coordinate transformations to map landmarks to themean shape were derived using a 3D extension of the thin-plate spline correspondence point interpolation proposed byBookstein [6].
3.4. Computing Fibrosis Distributions
Experts segmented the fibrotic tissue in the LA wall of eachsubject using the raw LGE-MRI data and a threshold-basedapproach described previously in [14]. Using the fibrosis clas-sifications in the LA wall, we can estimate the distributionof fibrosis on the LA surface as a histogram of the presenceof fibrosis at each correspondence point position. The sur-face histogram is computed as follows: for each correspon-dence position, we record the number of times that fibrosisis seen in the region of that correspondence point (2.5mm ra-dius) over the whole population of shapes. The histogramcan then be visualized on a representative shape (such as themean or median shape) to show the patterning of fibrosis inthe population. Additionally, we can compute histograms forsub-populations and compare their distributions. In this studywe compare the fibrosis histograms for two populations: AFpatients who have successful RF ablation outcomes and AFpatients with unsuccessful RF ablation outcomes, where suc-cess is defined by freedom from AF events at 3 months.
4. RESULTS
Figure 2 illustrates some representative LA shapes with cor-respondence points displayed as small spheres on the surface.The gray structures are the LA appendage and the pulmonaryvein insertion sites, which are also the common anatomicallandmarks chosen for the accuracy assessment described inSection 3.3. Panel a. in Fig. 2 shows the observed spatialdistribution of fibrosis on the posterior LA surface in patientswith a successful ablation procedure; panel b. shows the dis-tribution in patients who relapsed into AF. Panel c. shows thedifference between the two groups, measured as the percent-age of recurrent patients minus nonrecurrent patients exhibit-
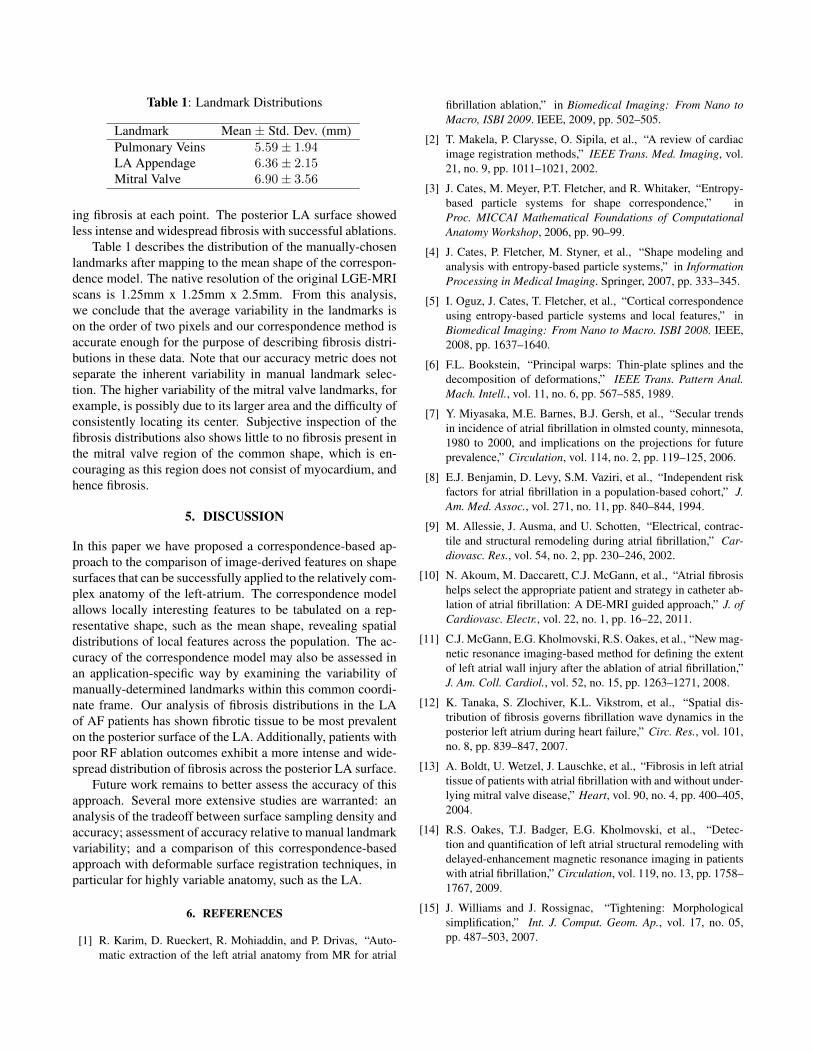
Table 1: Landmark Distributions
Landmark Mean ± Std. Dev. (mm)Pulmonary Veins 5.59± 1.94LA Appendage 6.36± 2.15Mitral Valve 6.90± 3.56
ing fibrosis at each point. The posterior LA surface showedless intense and widespread fibrosis with successful ablations.
Table 1 describes the distribution of the manually-chosenlandmarks after mapping to the mean shape of the correspon-dence model. The native resolution of the original LGE-MRIscans is 1.25mm x 1.25mm x 2.5mm. From this analysis,we conclude that the average variability in the landmarks ison the order of two pixels and our correspondence method isaccurate enough for the purpose of describing fibrosis distri-butions in these data. Note that our accuracy metric does notseparate the inherent variability in manual landmark selec-tion. The higher variability of the mitral valve landmarks, forexample, is possibly due to its larger area and the difficulty ofconsistently locating its center. Subjective inspection of thefibrosis distributions also shows little to no fibrosis present inthe mitral valve region of the common shape, which is en-couraging as this region does not consist of myocardium, andhence fibrosis.
5. DISCUSSION
In this paper we have proposed a correspondence-based ap-proach to the comparison of image-derived features on shapesurfaces that can be successfully applied to the relatively com-plex anatomy of the left-atrium. The correspondence modelallows locally interesting features to be tabulated on a rep-resentative shape, such as the mean shape, revealing spatialdistributions of local features across the population. The ac-curacy of the correspondence model may also be assessed inan application-specific way by examining the variability ofmanually-determined landmarks within this common coordi-nate frame. Our analysis of fibrosis distributions in the LAof AF patients has shown fibrotic tissue to be most prevalenton the posterior surface of the LA. Additionally, patients withpoor RF ablation outcomes exhibit a more intense and wide-spread distribution of fibrosis across the posterior LA surface.
Future work remains to better assess the accuracy of thisapproach. Several more extensive studies are warranted: ananalysis of the tradeoff between surface sampling density andaccuracy; assessment of accuracy relative to manual landmarkvariability; and a comparison of this correspondence-basedapproach with deformable surface registration techniques, inparticular for highly variable anatomy, such as the LA.
6. REFERENCES
[1] R. Karim, D. Rueckert, R. Mohiaddin, and P. Drivas, “Auto-matic extraction of the left atrial anatomy from MR for atrial
fibrillation ablation,” in Biomedical Imaging: From Nano toMacro, ISBI 2009. IEEE, 2009, pp. 502–505.
[2] T. Makela, P. Clarysse, O. Sipila, et al., “A review of cardiacimage registration methods,” IEEE Trans. Med. Imaging, vol.21, no. 9, pp. 1011–1021, 2002.
[3] J. Cates, M. Meyer, P.T. Fletcher, and R. Whitaker, “Entropy-based particle systems for shape correspondence,” inProc. MICCAI Mathematical Foundations of ComputationalAnatomy Workshop, 2006, pp. 90–99.
[4] J. Cates, P. Fletcher, M. Styner, et al., “Shape modeling andanalysis with entropy-based particle systems,” in InformationProcessing in Medical Imaging. Springer, 2007, pp. 333–345.
[5] I. Oguz, J. Cates, T. Fletcher, et al., “Cortical correspondenceusing entropy-based particle systems and local features,” inBiomedical Imaging: From Nano to Macro. ISBI 2008. IEEE,2008, pp. 1637–1640.
[6] F.L. Bookstein, “Principal warps: Thin-plate splines and thedecomposition of deformations,” IEEE Trans. Pattern Anal.Mach. Intell., vol. 11, no. 6, pp. 567–585, 1989.
[7] Y. Miyasaka, M.E. Barnes, B.J. Gersh, et al., “Secular trendsin incidence of atrial fibrillation in olmsted county, minnesota,1980 to 2000, and implications on the projections for futureprevalence,” Circulation, vol. 114, no. 2, pp. 119–125, 2006.
[8] E.J. Benjamin, D. Levy, S.M. Vaziri, et al., “Independent riskfactors for atrial fibrillation in a population-based cohort,” J.Am. Med. Assoc., vol. 271, no. 11, pp. 840–844, 1994.
[9] M. Allessie, J. Ausma, and U. Schotten, “Electrical, contrac-tile and structural remodeling during atrial fibrillation,” Car-diovasc. Res., vol. 54, no. 2, pp. 230–246, 2002.
[10] N. Akoum, M. Daccarett, C.J. McGann, et al., “Atrial fibrosishelps select the appropriate patient and strategy in catheter ab-lation of atrial fibrillation: A DE-MRI guided approach,” J. ofCardiovasc. Electr., vol. 22, no. 1, pp. 16–22, 2011.
[11] C.J. McGann, E.G. Kholmovski, R.S. Oakes, et al., “New mag-netic resonance imaging-based method for defining the extentof left atrial wall injury after the ablation of atrial fibrillation,”J. Am. Coll. Cardiol., vol. 52, no. 15, pp. 1263–1271, 2008.
[12] K. Tanaka, S. Zlochiver, K.L. Vikstrom, et al., “Spatial dis-tribution of fibrosis governs fibrillation wave dynamics in theposterior left atrium during heart failure,” Circ. Res., vol. 101,no. 8, pp. 839–847, 2007.
[13] A. Boldt, U. Wetzel, J. Lauschke, et al., “Fibrosis in left atrialtissue of patients with atrial fibrillation with and without under-lying mitral valve disease,” Heart, vol. 90, no. 4, pp. 400–405,2004.
[14] R.S. Oakes, T.J. Badger, E.G. Kholmovski, et al., “Detec-tion and quantification of left atrial structural remodeling withdelayed-enhancement magnetic resonance imaging in patientswith atrial fibrillation,” Circulation, vol. 119, no. 13, pp. 1758–1767, 2009.
[15] J. Williams and J. Rossignac, “Tightening: Morphologicalsimplification,” Int. J. Comput. Geom. Ap., vol. 17, no. 05,pp. 487–503, 2007.