a personalized course recommendation system based on
TRANSCRIPT

A Personalized Course Recommendation System
Based on Career Goals
by
c© Narges Majidi
A thesis submitted to the
School of Graduate Studies
in partial fulfilment of the
requirements for the degree of
Master of Science
Department of Computer Science
Memorial University of Newfoundland
April 2018
St. John’s Newfoundland

Abstract
Recommendation systems have become very popular and are integrated into many
applications that we use everyday. We are recommended music pieces, articles, books,
and movies by many websites and devices in our everyday life. Education is another
example of a domain where recommendation systems can help make better and wiser
decisions that can affect someone’s future. With the growing number of available
online courses, it is difficult to choose the right courses. In this thesis, a proof-of-
concept of a course recommendation system is proposed that takes the users’ career
goals into consideration in order to help them with choosing the right path toward
their desired future job. First, data is extracted from Indeed job postings for the
desired job titles showing the relations between job titles and skills. Then, a second
dataset is gathered which contains a set of available online courses and the skills that
they cover. The first phase of the method generates some association rules using
the Apriori algorithm which is then used in the second phase that runs a Genetic
Algorithm to find the best set of skills for each career goal. After finding the best
set of skills for a desired career goal, we need to find the minimum number of courses
that can cover all of these skills to be able to recommend them to users which is
an instance of the Set Cover problem. In our method, the last phase runs another
Genetic Algorithm on the course dataset in order to find the optimum set of courses.
This proof-of-concept approach demonstrates that courses that are suggested to users
with a specific career goal add key skills that are trending in the market to their list
of qualifications.
ii

Acknowledgements
I would first like to thank my supervisor Prof. Wolfgang Banzhaf. Prof. Banzhaf
was always very supportive and he was there whenever I ran into a problem in my
research to help me overcome any issues. He allowed my thesis to be my own work,
but steered me in the right direction whenever he thought I needed it.
I wish to express my most sincere gratitude and appreciation to my husband, for
the support he provided me through these years. Without his love, encouragement,
and his editing assistance, I would not have finished this thesis.
Finally, I would like to thank my parents and my brother for providing me with
unfailing support and continuous encouragement throughout my years of study and
through the process of researching and writing this thesis. This accomplishment
would not have been possible without them.
iii

Contents
Abstract ii
Acknowledgements iii
List of Tables viii
List of Figures ix
1 Introduction 2
2 Background 7
2.1 Motivation . . . . . . . . . . . . . . . . . . . . . . . . . . . . . . . . . 7
2.2 Knowledge Discovery in Databases (KDD) . . . . . . . . . . . . . . . 7
2.2.1 Data Mining . . . . . . . . . . . . . . . . . . . . . . . . . . . . 9
2.2.1.1 Association Rule Mining . . . . . . . . . . . . . . . . 10
2.2.1.2 Apriori Algorithm . . . . . . . . . . . . . . . . . . . 11
2.3 Evolutionary Algorithms . . . . . . . . . . . . . . . . . . . . . . . . . 13
2.3.1 Genetic Algorithms . . . . . . . . . . . . . . . . . . . . . . . . 14
2.3.1.1 Genetic Algorithms Process . . . . . . . . . . . . . . 16
iv

2.3.1.2 Selection . . . . . . . . . . . . . . . . . . . . . . . . 17
2.3.1.3 Genetic Operators . . . . . . . . . . . . . . . . . . . 18
2.4 Set Cover Problem . . . . . . . . . . . . . . . . . . . . . . . . . . . . 19
2.4.1 Greedy Algorithm . . . . . . . . . . . . . . . . . . . . . . . . . 19
2.5 Recommendation Systems . . . . . . . . . . . . . . . . . . . . . . . . 22
2.5.1 Classifications of Recommendation Methods . . . . . . . . . . 23
2.5.1.1 Random Prediction Method . . . . . . . . . . . . . . 23
2.5.1.2 Popularity Model . . . . . . . . . . . . . . . . . . . . 23
2.5.1.3 Demographic-based Filtering Systems . . . . . . . . 23
2.5.1.4 Knowledge-based Recommendation Systems . . . . . 24
2.5.1.5 Content-based Filtering Systems . . . . . . . . . . . 24
2.5.1.6 Collaborative Filtering Systems . . . . . . . . . . . . 25
2.5.1.7 Hybrid Recommendation Systems . . . . . . . . . . . 26
2.6 Course Recommendation Systems . . . . . . . . . . . . . . . . . . . . 27
3 Related Works 28
3.1 Performance and Feedback of Users . . . . . . . . . . . . . . . . . . . 28
3.1.1 Collaborative Filtering Systems . . . . . . . . . . . . . . . . . 29
3.1.2 Content-based Filtering Systems . . . . . . . . . . . . . . . . . 35
3.1.3 Hybrid Recommendation Systems . . . . . . . . . . . . . . . . 35
3.2 Courses and Enrollment History . . . . . . . . . . . . . . . . . . . . . 37
3.3 Career Goals of Users . . . . . . . . . . . . . . . . . . . . . . . . . . . 39
4 Method 41
4.1 Data Gathering . . . . . . . . . . . . . . . . . . . . . . . . . . . . . . 42
v

4.2 Proposed Method . . . . . . . . . . . . . . . . . . . . . . . . . . . . . 43
4.2.1 Phase One . . . . . . . . . . . . . . . . . . . . . . . . . . . . . 45
4.2.2 Phase Two . . . . . . . . . . . . . . . . . . . . . . . . . . . . . 46
4.2.3 Phase Three . . . . . . . . . . . . . . . . . . . . . . . . . . . . 48
4.3 Challenges . . . . . . . . . . . . . . . . . . . . . . . . . . . . . . . . . 51
4.3.1 Implicit Feedback . . . . . . . . . . . . . . . . . . . . . . . . . 51
4.3.2 Explicit Feedback . . . . . . . . . . . . . . . . . . . . . . . . . 51
4.3.3 Cold Start . . . . . . . . . . . . . . . . . . . . . . . . . . . . . 52
4.3.4 Performance of Users . . . . . . . . . . . . . . . . . . . . . . . 53
4.3.5 Similarity of Users vs. Career Goal . . . . . . . . . . . . . . . 53
5 Implementation 54
5.1 Data Gathering . . . . . . . . . . . . . . . . . . . . . . . . . . . . . . 54
5.2 First Phase . . . . . . . . . . . . . . . . . . . . . . . . . . . . . . . . 56
5.3 Second Phase . . . . . . . . . . . . . . . . . . . . . . . . . . . . . . . 57
5.3.1 Chromosome Representation . . . . . . . . . . . . . . . . . . . 58
5.3.2 GA Parameters . . . . . . . . . . . . . . . . . . . . . . . . . . 59
5.3.3 Fitness . . . . . . . . . . . . . . . . . . . . . . . . . . . . . . . 59
5.3.4 Selection . . . . . . . . . . . . . . . . . . . . . . . . . . . . . . 61
5.3.5 Crossover and Mutation Operators . . . . . . . . . . . . . . . 63
5.4 Third Phase . . . . . . . . . . . . . . . . . . . . . . . . . . . . . . . . 64
5.4.1 Chromosome Representation . . . . . . . . . . . . . . . . . . . 64
5.4.2 GA Parameters . . . . . . . . . . . . . . . . . . . . . . . . . . 64
5.4.3 Fitness . . . . . . . . . . . . . . . . . . . . . . . . . . . . . . . 65
vi

6 Results 67
6.1 Phase One . . . . . . . . . . . . . . . . . . . . . . . . . . . . . . . . . 68
6.2 Phase Two . . . . . . . . . . . . . . . . . . . . . . . . . . . . . . . . . 69
6.3 Phase Three . . . . . . . . . . . . . . . . . . . . . . . . . . . . . . . . 73
6.4 Experiments . . . . . . . . . . . . . . . . . . . . . . . . . . . . . . . . 78
6.4.1 Initial Population of the Second Phase . . . . . . . . . . . . . 78
6.4.2 Exhaustive Search vs. Greedy Algorithm vs. Genetic Algo-
rithm for the Third Phase . . . . . . . . . . . . . . . . . . . . 80
6.4.3 Location-based Data Extraction . . . . . . . . . . . . . . . . . 81
7 Conclusion and Future Work 83
Bibliography 85
vii

List of Tables
2.1 Comparison of recommendation system approaches [26] . . . . . . . 26
4.1 Job-skill dataset extracted from job postings including a job title and
the set of skills mentioned on those job postings . . . . . . . . . . . . 45
4.2 Career goals (Gm) and their extracted set of main skills (Sn) . . . . . 46
4.3 Courses (Cm) and set of skills that they cover (Sn). . . . . . . . . . . 48
4.4 Skills (Sn) and set of courses that will cover those skills (Cm). . . . . 49
5.1 GA parameters of the second phase of our method . . . . . . . . . . . 60
5.2 GA parameters of the third phase of our method . . . . . . . . . . . . 65
6.1 Top 3 extracted association rules for each job title . . . . . . . . . . . 68
6.2 Comparing greedy algorithm and exhaustive search method to the GA
we used for the third phase . . . . . . . . . . . . . . . . . . . . . . . . 81
6.3 Top skills for “Data Scientist” based on location . . . . . . . . . . . . 82
viii

List of Figures
2.1 Steps of the KDD process [35]. . . . . . . . . . . . . . . . . . . . . . 9
2.2 Generation of frequent item sets. [6] . . . . . . . . . . . . . . . . . . 12
2.3 The general process of an evolutionary algorithm [15] . . . . . . . . . 15
2.4 An example of Set Cover problem . . . . . . . . . . . . . . . . . . . . 20
2.5 Greedy algorithm’s solution to the Set Cover problem in Figure 2.4 . 21
3.1 User’s ratings for different areas [64] . . . . . . . . . . . . . . . . . . 31
3.2 Ratings of different areas in different courses [64] . . . . . . . . . . . 32
3.3 Student’s ratings for completed courses [64] . . . . . . . . . . . . . . 33
5.1 A sample list of itemsets with different supports in RStudio . . . . . 57
6.1 Evolution of the best, average, and worst fitness in runs of the second
phase for the job title “Data Scientist” . . . . . . . . . . . . . . . . . 70
6.2 Error bars indicating (one) standard deviation of individuals in the
second phase for job title “Data Scientist” . . . . . . . . . . . . . . . 71
6.3 Evolution of the best, average, and worst fitness in runs of the second
phase for the job title “Software Developer” . . . . . . . . . . . . . . 72
ix

6.4 Evolution of the best, average, and worst fitness in runs of the second
phase for the job title “Hardware Engineer” . . . . . . . . . . . . . . 72
6.5 Evolution of the best, average, and worst fitness in runs of the third
phase for the job title “Data Scientist” . . . . . . . . . . . . . . . . . 74
6.6 Error bars indicating (one) standard deviation of individuals in the
third phase for job title “Data Scientist” . . . . . . . . . . . . . . . . 74
6.7 Evolution of the best, average, and worst fitness in runs of the third
phase for the job title “Software Developer” . . . . . . . . . . . . . . 76
6.8 Evolution of the best, average, and worst fitness in runs of the third
phase for the job title “Hardware Engineer” . . . . . . . . . . . . . . 77
6.9 Combined initial population vs. random initial population . . . . . . 79
x

Listings
5.1 Encoding functions . . . . . . . . . . . . . . . . . . . . . . . . . . . . 59
5.2 Fitness function of the second phase . . . . . . . . . . . . . . . . . . . 61
5.3 Roulette wheel selection method . . . . . . . . . . . . . . . . . . . . . 62
5.4 Crossover and mutation implementation . . . . . . . . . . . . . . . . 63
5.5 Fitness function of third phase . . . . . . . . . . . . . . . . . . . . . . 66
1

Chapter 1
Introduction
Recommendation systems have become extremely popular in recent years, and are
used in a variety of applications, as can be observed in daily web browsing. For
instance, Amazon1 usually suggests additional items, and YouTube2 provides a rec-
ommendation list of further videos. Sometimes the recommendations we receive are
surprising as they are exactly the things that we were looking for or things that we
are interested in.
One of the popular categories in Netflix 3, that uses recommendation systems is
called “Top picks for you”. Google Scholar 4 is another popular tool with a recommen-
dation system, useful for getting article recommendations, relevant to a research area.
All it needs is the creation of a public Scholar profile. It then analyzes articles, scans
the entire web looking for new articles relevant to the user’s research area. Social
1https://www.amazon.com2https://www.youtube.com3https://www.netflix.com4https://scholar.google.com
2

networks such as Facebook 5 and Instagram6 also have recommendation systems for
friend suggestions, pages the user may like, groups to join, or hashtags to use while
posting.
Three main approaches for recommendation systems can be distinguished as fol-
lows:
1. Collaborative filtering systems recommend items to users based on their simi-
larities to other users. In this method, the system collects and analyzes a large
amount of information on user behaviours and activities and then recommends
items which are already chosen by other users, which have similar attributes.
2. Content-based filtering systems recommend items to users based on item sim-
ilarities. Content-based recommendation systems have profiles of items which
contain item descriptions and profiles of user preferences. For example, in the
case of movies; the name of the director, actors, genre of the movie and other
attributes are provided on item profile. Also, a user profile is built to indicate
the type of items that a user likes; the director that a user has shown interest
in, the genre of movies a user prefers, actors that a user has watched frequently
in movies, etc. In other words, this approach tries to recommend items that are
similar to some other items that a user already have chosen or liked in the past.
3. Hybrid recommendation systems that combine collaborative and content-based
filtering have recently been demonstrated to be more effective in many cases.
Hybrid approaches can be implemented in several ways, such as: making content-
5https://www.facebook.com6https://www.instagram.com
3

based and collaborative-based predictions separately and then combining them;
adding content-based capabilities to a collaborative-based approach (and vice
versa).
As the amount of educational resources on the internet increases, it is possible to
find courses from almost every knowledge domain. The percentage of higher education
institutions in the United States that currently offer online courses increased from
2.6% in 2012 to 11.3% in 2015. In 2015, 28% of all students took at least one online
course and from those students, 83.5% were undergraduate students and 16.5% were
graduate students [12]. Although online learning is expanding in availability and
popularity, the high dropout rates remain a challenging problem [57]. With the
growing number of available online courses, students can easily get overwhelmed while
making decisions on which courses to take and taking courses that are not a good
match to their needs may result in a dropout. Many students graduate every semester
from schools and universities, who have taken a variety of courses, but often do not
know if these courses are useful for their desired job. It is also hard for the students
to decide which courses would be useful for a specific career goal. For instance, if a
student wants to become a data scientist in the future, they should know what skills
are essential and trending on the market for that job title, and acquire those skills to
be a good candidate for that position.
The process of finding appropriate courses and deciding which ones to take can be
challenging and time-consuming. In the process of choosing a course, many factors
may be relevant: finding the right places to look for course offerings, the details, and
content of each course, length, prerequisites, instructors, workload, etc. Using other
4

people’s experience and suggestions to choose a course may be misleading, because
each person has their own background, education, and desired career goal. A course
that was helpful for one person might be somehow unrelated to another’s interests
and career path.
Almost none of the currently used course recommendation systems consider the
user’s future career goal or target job. Instead, they suggest courses from the com-
munity point of view. For instance, they suggest courses based on other students’
feedback [50, 73], or courses with better overall student performance based on marks
[17, 19, 63, 75], or they have implemented a content-based recommendation system
which considers the similarities between course materials [25, 38, 39].
In this thesis, we are proposing a personalized course recommendation system
based on the principles of all recommendation systems. Also, this new system takes
the career goals of users into account, aiming to improve the recommendation results.
Our system tries to choose the best courses to recommend from courses relevant
to the career goals by using a combination of association rule mining and Genetic
Algorithms. Data mining can help reveal hidden relations between skills that are
essential for different jobs, and then Genetic Algorithm helps with optimizing the list
of skills. After obtaining an optimized list of skills, the system uses another Genetic
Algorithm for solving the Set Cover problem of recommending the best set of courses
that can cover the entire set of required skills for the career path chosen by the user.
This thesis is structured as follows: Chapter 2 provides background information
about knowledge discovery in databases, Genetic Algorithms, and recommendation
systems. Chapter 3 discusses related works using recommendation systems, especially
in the field of course recommendation systems. Chapter 4 introduces our personalized
5

course recommendation system. Chapter 5 details the implementation of the proposed
method. Chapter 6 shows the results of this research and compares results in different
scenarios. Finally, conclusions and future suggested works are discussed in Chapter
7.
6

Chapter 2
Background
2.1 Motivation
William J. Frawley et al. [37] quoted a frustrated Management Information System
(MIS) executive as saying “Computers have promised us a fountain of wisdom but
delivered a flood of data”. The amount of data and the complexity of features in any
computational environment and task are increasing rapidly. Huge amounts of raw
and often complex data cause big organizations and market players to want to extract
valuable knowledge from their data collections. This demand prompts scientists to
find new ways to understand the data and find the latent knowledge behind the raw
data.
2.2 Knowledge Discovery in Databases (KDD)
Knowledge discovery in databases was first posed at the first KDD workshop in
1989 [62] and has since been popularized in the artificial intelligence and machine-
7

learning research communities. KDD encompasses the whole process of creating and
developing methods and tools for extracting meaningful information for understand-
ing large and noisy data. KDD aims to make data more compact and abstract so that
they are useful for future decision making. KDD comprises different steps, such as
data selection, data preprocessing, transformation, the process of data mining (which
is the most important step in KDD), and finally proper interpretation [35]. Selection
is the initial insights into the data, and detection of relevant data subsets. Preprocess-
ing includes finding errors, incorrect, and missing data in a data set. Errors are then
corrected or removed, and missing data supplied. Transformation transforms data
into a format that is appropriate for the next step. Data mining assigns models to, or
extracts patterns to be used in the final step. As Sankar noted in [59], “Data is a set
of facts F (e.g., cases in a database), and a pattern is an expression E in a language
L describing the facts in a subset FE of F . E is called a pattern if it is simpler than
the enumeration of all facts in FE”. Finally, in the interpretation/evaluation step,
patterns are analyzed to extract knowledge. Figure 2.1 demonstrates the steps of the
KDD process.
The goals of KDD for specifying patterns to be found can be categorized into two
classes:
1. Verification: The system verifies a user’s hypothesis.
2. Discovery: The system finds a new pattern. Discovery, in turn, can be classified
into two subclasses:
• Prediction: Here, the system wants to predict unknown or future behavior
of some entities by finding patterns.
8

Figure 2.1: Steps of the KDD process [35].
• Description: Here, the system’s purpose is to find a pattern describing the
data which would be understandable for the human [35].
Some predictive models can be used as descriptive patterns and vice versa.
2.2.1 Data Mining
Data mining refers to the pattern discovery step in the KDD process. Fayyad et al.
define data mining as “The non-trivial extraction of implicit, previously unknown,
and potentially useful information from data” [35]. In fact, data mining is an ap-
proach of assigning models to, or extracting patterns from raw data. There exist
many alternative names for data mining, such as knowledge extraction, data/pattern
analysis, data dredging [42], business intelligence, data archeology, or information
harvesting.
Although machine learning algorithms are the core of many data mining methods,
9

there are fundamental differences between machine learning and data mining [56].
Data mining integrates various techniques, depending on the problem and the actual
mining approach. For example, methods from database systems, statistics, machine
learning, information retrieval, fuzzy and/or rough set theory, pattern recognition,
image analysis, signal processing, and bio-informatics are integrated for particular
data mining applications [42].
Several groups of data mining algorithms with the goal of prediction and descrip-
tion [2] have emerged, whose main categories could be roughly as follows:
Mining frequent patterns, associations, correlations, sequence mining, similarity search,
deviation detection, classification, k nearest neighbors (which is a subset of classifi-
cation), regression, clustering, the k-means algorithm (which is the simplest common
clustering algorithm), scalability, outlier analysis, evolution analysis, mining stream,
time-series, summarization, dependency modeling, change and deviation detection,
and sequence data, etc.
2.2.1.1 Association Rule Mining
The purpose of association rule mining is to discover interesting relations among items
and variables to find frequent patterns in a dataset, by discovering items frequently
appearing together [62].
Let I = {i1; i2; ...; ik} be a set of k items and B = {b1; b2; ...; bn} be a set of n
subsets of I (bi ⊆ I). Item set X is associated with item set Y : X ⇒ Y , where
X ⊆ I and Y ⊆ I [3].
Different constraints can be used to extract and evaluate interesting association
rules. Well-known constraints are minimum thresholds on support and confidence.
10

The support of an item set is defined as the percentage of those transactions in the
dataset which contain that item set.
The confidence of an association rule is defined as:
confidence(X ⇒ Y ) =support(X ∪ Y )
support(X)(2.1)
Item sets which have at least a minimum support threshold and a minimum con-
fidence threshold are called strong association rules [42, 46].
There exist different algorithms for generating association rules, such as apriori
algorithms, sampling algorithms, tree projection algorithms, partitioning algorithms,
or parallel algorithms.
2.2.1.2 Apriori Algorithm
The apriori algorithm is one of the most famous data mining techniques, which was
proposed by Agrawal and Srikant in 1994 in their research on fast algorithms for
mining association rules in large databases [4]. Apriori uses level-wise search, where
each item set of size k will make the next level item sets of size k + 1.
The main idea behind this approach is based on the principle of apriori : All
non-empty subsets of a frequent item set (with a minimum support) must also be
frequent. So item sets that have infrequent subsets can be pruned.
The algorithm is given below:
1. Scan the data set to count each candidate (support).
2. Compare the support of item sets of size one with minimum support and omit
those with support less than minimum support.
11

3. Starting from size i = 1, generate candidates of size i + 1 (all combinations
of sets with size i), and prune those candidates whose support is less than the
minimum support until no larger item sets are found.
Figure 2.2 shows the generation of frequent item sets where the minimum support
count is 2.
Figure 2.2: Generation of frequent item sets. [6]
Generating association rules from frequent item sets is usually done in two steps [10]:
1. Finding all non-empty subsets from frequent item set named L.
2. For each non-empty subset of L, find associations like S where S → (L− S) if
Support of LSupport of S
≥ Minimum confidence.
12

2.3 Evolutionary Algorithms
Evolutionary computation refers to a problem-solving process using computational
models of evolutionary processes such as natural selection, survival of the fittest, and
reproduction, as the fundamental components of such computational systems [13]. In
evolutionary computation, each single candidate solution is called an individual, the
set of all candidate solutions is called the population, and each step of the evolution
process is called a generation. The ability of an individual to solve the given problem
is measured by the fitness function. This ranks how likely one solution is to propagate
its characteristics to the next generations.
There are five important questions that need to be answered before designing an
evolutionary algorithm [13]:
1. What data structure will be used for designing the solution?
2. What will be the fitness function?
3. What reproduction methods will be used?
4. How are parents selected from the population and are children entered to the
population of the next generation?
5. What will be the termination criterion?
In the process of an evolutionary algorithm, the first step is to initialize the first
population, which is created randomly or using prior knowledge. In most cases,
generating an initial population is achieved by assigning random values from the
13

allowed domain to each candidate solution. The size of the initial population affects
computational complexity and the exploration abilities of the algorithm as well.
After a population is initialized, the evaluation process will be done on the popu-
lation using the defined fitness function. The goal of the fitness function is to assign
a quality measure to individuals so that the algorithm can get feedback regarding
which individuals should have a higher probability of being allowed to multiply and
reproduce, and which individuals should have a higher probability of being removed
from the population [16].
The selection task in an evolutionary algorithm ensures that an individual with
a higher fitness will have a greater chance of being selected for reproduction. There
are various selection operators such as tournament selection, proportionate selection,
and ranking selection [32].
After applying the selection operator to the population, the reproduction process
will apply crossover and/or mutation operators to the selected parents to generate
offspring. Then, variation operators are applied to the selected individual solutions
so that the current population size reaches the predefined population size, and ready
to loop back to do the process all over again in order to find the fittest popula-
tion [15]. An illustration of the general process of an evolutionary algorithm is shown
is Figure 2.3
2.3.1 Genetic Algorithms
Computational complexity theory has shown that there are many problems that are in
the NP complexity class. NP problems are solvable by a non-deterministic polynomial
14

Figure 2.3: The general process of an evolutionary algorithm [15]
algorithm [30]. Despite the lack of polynomial time algorithms to solve NP problems,
there are some heuristic algorithms that run in polynomial time that are used for
finding approximate solutions. Genetic Algorithms (GA), which are subset of Evo-
lutionary Algorithms, are known to be in this category of heuristic algorithms. GAs
are widely utilized meta-heuristics for optimization, which are based on evolutionary
ideas of genetics and natural selection [68].
GAs were first introduced by John Holland during the 1960s to 1970s. GAs work
based on Darwin’s principle of “survival of the fittest” [29]. The process of GAs is
very similar to other evolutionary algorithms that were mentioned earlier.
In GAs, each individual is represented by a set of parameters known as genes.
The set of all genes that form an individual is called chromosome. A GA encodes a
potential candidate solution to a problem (the phenotype) in a chromosome-like data
structure called the genotype [43, 77].
15

2.3.1.1 Genetic Algorithms Process
There are three essential elements in each GA:
1. Population: A group of solutions to the problem.
2. Fitness function: A way of evaluating candidate solutions.
3. Breeding or mating: The process of generating one or more new candidate
solutions from two solutions that are chosen as parents.
A GA gives a higher chance of breeding for the next generation to an individual
with a better fitness score; therefore most fit individuals have a better chance to
transfer their genes to next generation. By choosing the fittest solutions for breeding
over and over, it is expected that populations will consist of fitter individuals over
more generations.
Encoding the candidate solution individuals to prepare the problem for applying
GA is an important process that needs to be determined before GA is applied. There
are many strategies that scientists have been using for encoding a problem such as
tree encoding, permutation encoding, value encoding, and binary encoding which is
the most common one.
The traditional process of a simple genetic algorithm is as follows:
1. Initialization: Start with a first population which is seeded by randomly gener-
ated individuals
2. Calculate the fitness of each individual in the population
3. Repeat the following steps until the termination criterion is met:
16

• Do selection
• Do crossover
• Do mutation
4. Replace the old population with the created population.
5. Go to step 2.
The stopping condition would typically be the discovery of a solution with the
predefined ideal fitness, or running out of computational resources.
2.3.1.2 Selection
After measuring the fitness of all individuals from a population, the GA needs to
decide whether to apply genetic operators to that individual and whether to keep it
in the population or allow it to be replaced [16]. The selection operator performs this
task in a GA.
Some of the most commonly used selection methods are random selection, rank
selection, tournament selection, steady-state selection and fitness-proportionate se-
lection which was used by Holland in his original Simple GA [72].
Roulette wheel selection [72] is one of the most common fitness-proportionate
selection techniques. In this method, each individual is assigned a slice of a roulette
wheel based on their fitness, with fittest candidates having the biggest slices of the
wheel. The wheel is spun a number of times equal to the size of the population, and
the individual which is allocated to the winning section would be selected each time.
17

2.3.1.3 Genetic Operators
The role of genetic operators is to create new individuals from the old ones selected for
reproduction. In the corresponding phenotype space, these operators are responsible
for generating new candidate solutions. One of the critical decisions in implementing
a genetic algorithm is what operators to choose and how to apply them [74]. Main
genetic operators are:
• Crossover: Crossover or recombination is a mating method of two individuals
with different favorable characteristics. Crossover merges the features of parents
and creates one or more offspring with a combination of their genes. Single-point
crossover is the simplest form which randomly chooses a gene and exchanges
the genes before and after that point between two individuals to create two
offspring. There are other crossover methods such as N-point crossover and
uniform crossover.
• Mutation: Mutation is a unary variation operator which is always stochastic.
The type of this operator depends on the encoding. For instance, in the binary
encoding, bit-flip mutation is usually used where a mutation probability is de-
fined for each gene (mutation rate), and each gene in an individual might flip
its value based on that probability [32]. Some other types of mutation operator
are order changing in permutation encoding, adding or subtracting in real value
encoding, and node changing in tree encoding.
18

2.4 Set Cover Problem
The Set Cover problem is a classical problem in combinatorics, computer science, and
complexity theory and is known to be NP-complete [36, 48]. In this problem, we have
a set of n elements called U = {e0, e1, ..., en−1} and a collection of m subsets of U
called F = {S0, S1, ..., Sm−1} where S0, S1, ..., Sm−1 ⊆ U . Each of these subsets Si
has a non-negative cost of ci. The goal is to find a set I ⊆ {S1, S2, ..., Sm−1} that
minimizes∑i∈I
ci, such that⋃
Si∈ISi = U [36, 48].
In the un-weighted Set Cover Problem, the associated cost with all of the subsets
of U is considered to be 1 (ci = 1) [27, 48]. In this thesis, our work is based on the
un-weighted version of this problem.
Finding the optimal solution to this problem through an exhaustive process needs
testing of every possible solution to the instance (brute-force search). This type
of method has a search time of O(2n) on an instance of m sets. Like many other
combinatorial problems, an approximation technique for solving the problem is a
compromise between solution effectiveness and implementation efficiency, with high
effectiveness usually only possible at the cost of low efficiency [52]. In this section we
present a greedy approximation algorithm for this problem.
2.4.1 Greedy Algorithm
The following greedy algorithm for the Set Cover problem executes in polynomial
time. It starts by adding a set that can cover the largest number of uncovered
elements to a solution and repeats this for the remaining sets, trying to achieve the
greatest gain until all the required elements are covered [45].
19

Algorithm 1 Greedy algorithm
1: procedure GreedySetCover(U, S1, S2, ..., Sm)
2: i← {}
3: while U 6= {} do . Do this until all elements in U are covered
4: Let d(j) = |Sj ∩ U |. . This is the number of uncovered elements in Sj
5: Let j = argmaxi∈[1,2,...,m]d(i). . Break ties by taking lower i
6: I ← I ∪ {j}; . Include set Sj into the set cover
7: U ← U\Sj; . Remove elements in Sj from U
8: return I
Figure 2.4 shows an example of Set Cover problem with 12 elements and 5 sets
where U = {1, 2, ..., 12} and F = {S1, S2, ..., S5}. The goal is to find the smallest
collection of set that can cover all of the elements in U .
Figure 2.4: An example of Set Cover problem
Figure 2.5 illustrates how the greedy algorithm executes for this example. In the
first iteration, it chooses the set that covers the most elements (S2). In the second
20

iteration, sets S3 and S4 both cover 3 elements and the algorithm chooses S3 because
it has a lower index. In the third and fourth iteration, sets S4 and S1 are added to
the solution respectively. After the fourth iteration, all elements in U are covered and
the minimum set cover found by the greedy algorithm consists of four sets (S1, S2,
S3, and S4) but the optimal solution to this problem has only sets which are S1, S4,
and S5.
Figure 2.5: Greedy algorithm’s solution to the Set Cover problem in Figure 2.4
21

2.5 Recommendation Systems
Vast amounts of data in each domain on the internet need to be processed, and
the knowledge from these data need to be extracted in a way that makes people’s
life easier. Recommendation systems are software tools and techniques that provide
suggestions for users about many items such as products, video, music, etc. in a
personalized manner [1, 65].
The vast offering of items on different websites can quickly overwhelm the users.
The process of finding appropriate items that they want, and deciding which ones to
choose can be challenging and time-consuming. The personalized assistance provided
by recommendation systems has proven to be an effective way of increasing user
satisfaction and improving the revenue of many businesses. For example, Netflix and
YouTube are media streaming services that recommend movies and music to their
users, and social networks such as Facebook and Twitter recommend friends, groups,
and many other items to their users.
Most of the recommendation systems that we use are personalized recommenda-
tion systems which base their recommendations on user-specific information. There
has been much research done regarding recommendation systems in different personal
activities. Some examples are:
Chan introduced a TV program recommendation system in [22] and Choi talks
about recommendation of movies in [24]. Dao discusses a location-based advertising
recommendation system in [28]. Paranjape also introduced a recommendation system
for stock market portfolio in [61] and Lucas in [55] explains a recommendation system
for tourism.
22

2.5.1 Classifications of Recommendation Methods
There are various types of recommendation systems that are integrated into different
applications to generate recommendations. The most common methods are discussed
in this section.
2.5.1.1 Random Prediction Method
This approach randomly chooses items from the set of available items and recommends
them to the user. The random prediction method usually serves as a reference point
that helps to define how much better results are obtained by the utilization of more
sophisticated methods [60].
2.5.1.2 Popularity Model
This approach recommends the most popular items to all of the users based on the
most popular choices. For instance, in an online store, the items are ordered by the
number of ratings that all users have given them, and then the system will recommend
some of the most popular items to the new user. This model is easy to implement and
computationally inexpensive. It will somehow accomplish the goal of reducing user
effort, but ratings may be uninformative since most users like popular items. New
items and unpopular items will almost never appear in the recommendations. This
problem causes unequal distribution of ratings in the dataset [58].
2.5.1.3 Demographic-based Filtering Systems
This type of recommendation systems utilizes users in different classes based on their
demographic data stored on their profiles (i.e.. age, job, gender, city, and education).
23

The main assumption in this type of recommendation system is that users with similar
demographic attribute(s) will rate items similarly [67].
2.5.1.4 Knowledge-based Recommendation Systems
This type of recommendation systems are based on users’ requirements and how a par-
ticular item meets a particular user’s need. The main difference between knowledge-
based recommendation methods and other methods is that they have functional
knowledge, meaning they know how a particular item meets a particular user need
and can reason about the relationship between a need and a possible suggestion [20].
There are many applications for this type of recommendation systems such as travel
websites which limit providing suggestions by asking questions such as duration, price
range, and location.
2.5.1.5 Content-based Filtering Systems
A content-based recommendation system suggests the items that are similar to the
items that the user liked in the past regarding the item content. The system receives
users activity history and generates appropriate user models based on the content
of items to indicate which items the user may like [31]. The system will eventually
provide a recommendation of items that are similar to high rated items in users’
profile.
For example, in case of movie recommendations, the name of the director, actors,
genre are described in item profiles. Also, the user profile is built to indicate the
type of items this user likes; the director whom the user has shown interest in and
the genre of the movies they prefer. This approach then tries to recommend movies
24

which have common characteristics with the movies that the user liked in the past.
2.5.1.6 Collaborative Filtering Systems
This type of recommendation system collects and analyzes existing users’ details,
ratings, and feedbacks; then recommend items to users based on user similarities [71].
Collaborative filtering can be separated into two types:
• Memory-based collaborative filtering: The system provides a recommen-
dation with the use of the entire collection of user ratings and reviews. The
similarity of users in this can be discovered with two approaches [70]:
– User-based collaborative approach: If two users have similar details
(i.e., demographic data on their profile), they are considered to be similar
and the system recommends items that are highly rated by one of them to
the other one.
– Item-based collaborative approach: If two items are being liked and
disliked by some users similar to each other, the system considers those
two items as similar items. If a new user likes one or more of those similar
items, that new user is considered to be similar to those users that liked
those items as well. Hence if users who liked those two items, also like
some other items, these other items would be recommended to the new
user.
• Model-based collaborative filtering: This approach provides recommenda-
tions with the use of the patterns extracted from datasets. Model-based collab-
orative filtering is based on matrix factorization (MF). Using this approach, the
25

system learns the latent preferences of users and the latent attributes of items
from known ratings to predict the unknown ratings through the dot product of
the latent features of users and items [70].
2.5.1.7 Hybrid Recommendation Systems
Hybrid recommendation systems are a combination of two or more recommendation
methods for gaining higher quality with fewer drawbacks of any technique separately.
This type of recommendation has been demonstrated to be more efficient in some
cases. Hybrid approaches can be implemented in several ways such as making content-
based and collaborative-based predictions separately and then combining them, or by
adding content-based capabilities to a collaborative-based approach (or vice versa).
A comparison of the most used recommendation system approaches is presented
in Table 2.1.
Approach Benefits Limitations
Content-based filtering No domain information required Cold start, Over-
specialization
Collaborative filtering No domain information required Cold start, Sparsity
Knowledge-based filtering Sensitive to preference change Knowledge acquisi-
tion
Hybrid filtering Improve item-user cold start
problem
Slow performance,
Time complexity
Table 2.1: Comparison of recommendation system approaches [26]
26

2.6 Course Recommendation Systems
In recent years, web-based learning has become very popular. The number of digi-
tal libraries and e-learning materials has been growing rapidly. With the increasing
number of available resources, the traditional approach of users to simply search for
useful courses is not very practical any more in many cases. The role of recommen-
dation systems and search tools is to help instructors and learners to overcome this
information overload by finding relevant resources.
An e-learning recommendation system presents an environment that helps learn-
ers make choices without sufficient personal information of the alternatives. These
recommendation systems are aiming to shorten the search process with better services
and to let learners find more useful and suitable courses. Some examples of course
recommendation systems are discussed in more details in the next chapter.
27

Chapter 3
Related Works
There are many recommendation systems that incorporate collaborative filtering
methods, content-based methods, or the combination of them as hybrid systems.
In this section, some of the most relevant systems to this research are reviewed. Each
section briefly reviews some related works with similar focus and methodology in the
domain of educational recommendation systems.
3.1 Performance and Feedback of Users
Many of the educational recommendation systems focus on how good students’ per-
formance or final marks are. Some of these recommendation systems are discussed in
this section.
28

3.1.1 Collaborative Filtering Systems
Bobadilla proposed an equation in 2009 for memory-based collaborative e-learning
recommendation system that uses the learners’ grades for the weighting of the recom-
mendations (users with better scores have a greater weight than the users with lower
scores) [19].
Thai in [75] used a matrix factorization for predicting student performance, so
users can better decide in selecting the right level of difficulty. El-Bishouty in [33]
proposed a smart online course recommendation tool which considers different stu-
dents’ learning styles and provides teachers with recommendations to attract more
students with different learning styles to get better performance.
Chen in [23] proposed an e-learning material recommendation which considered
both course difficulty and users ability to learn. They used a collaborative voting
method as well as Rasch’s item characterized function [14] to define a parameter for
the difficulty of each course. The ability of the user would be calculated based on user
explicit feedback. Students can select course categories and materials and also search
through the system using keywords of interesting course material. Courses will be
recommended to students, then the system asks them to answer two questionnaires.
Ray proposed a system which uses both item-based and user-based collaborative
filtering on a data set of 255 students’ marks in 25 subjects. Their system could
provide each student with a prediction of the grade they may get if they choose a
particular course. Their system is based on other users’ course marks. Users must
evaluate as many courses as possible. Their system is not able to recommend to
students who have not taken any courses yet [63].
29

Some researchers focus on using recommendation systems in a specific field. For
example, Zhang’s article from 2009 [80] focuses on civil engineering professional
courses and Liu’s article in 2010 [54] focuses on physical education.
Many of collaborative educational recommendation systems are based on explicit
or implicit student feedback. Liu in [50] introduced a system which is based on IEEE
Learning Technology Systems Architecture (IEEE LTSA)1 which is a component-
based framework for a general learning system with high scalability and re-usability.
This system uses a feedback extractor to combine multiple feedback measures and
find user interests. The system then recommends personalized information based on
collaborative approach.
Tan in [73] used a user-based collaborative filtering approach for their recommen-
dation system. Their system recommends courses to a learner based on the correlation
between that learner and other learners who have completed courses in the system.
They got user ratings on courses both implicitly and explicitly and made a matrix
of learner ratings for courses. Then they used the Pearson correlation for computing
the similarity between learners to form a proximity-based neighborhood of a target
learner and some like-minded users in an ordered list from most similar one to the
least similar one. Finally, they used association rule mining to find the top courses
that were taken by a neighborhood of learners and recommended them as the output
of their system.
Salehi in [69] presented a recommendation system for e-learning material from
historical learner logs and ratings. They made a user-item matrix to discover implicit
attributes of learners and learning material of historical rating data. Their system
1http://ltsc.ieee.org/wg1/index.html
30

also uses explicit attributes models and genetic algorithm to find the relationship
between the overall rating and the implicit weight vector of each learner.
Bendakir in [18] presented a course recommendation system which combines a
data mining process with user ratings to recommend the best combination of courses.
In their system, every student has a profile which contains their basic information and
chosen courses. The structure of this system has five primary attributes (four courses,
with the fifth attribute representing the research laboratory). The C4.5 algorithm is
applied to build a decision tree of student profiles that represent the different paths of
courses (nodes) chosen and goes toward a leaf labeled with a research laboratory. For
each student, the recommendation system looks for paths which have the same start
courses and recommends the remaining courses of these paths. The recommendation
will improve with user ratings.
Reddy in [64] proposed a system which used learners’ past courses information and
a user’s preference to recommend courses to them. In their system, users determine
their interest areas, and then their profile will be created for them. Figure 3.1 shows
interest ratings of two students for five different areas.
Figure 3.1: User’s ratings for different areas [64]
31
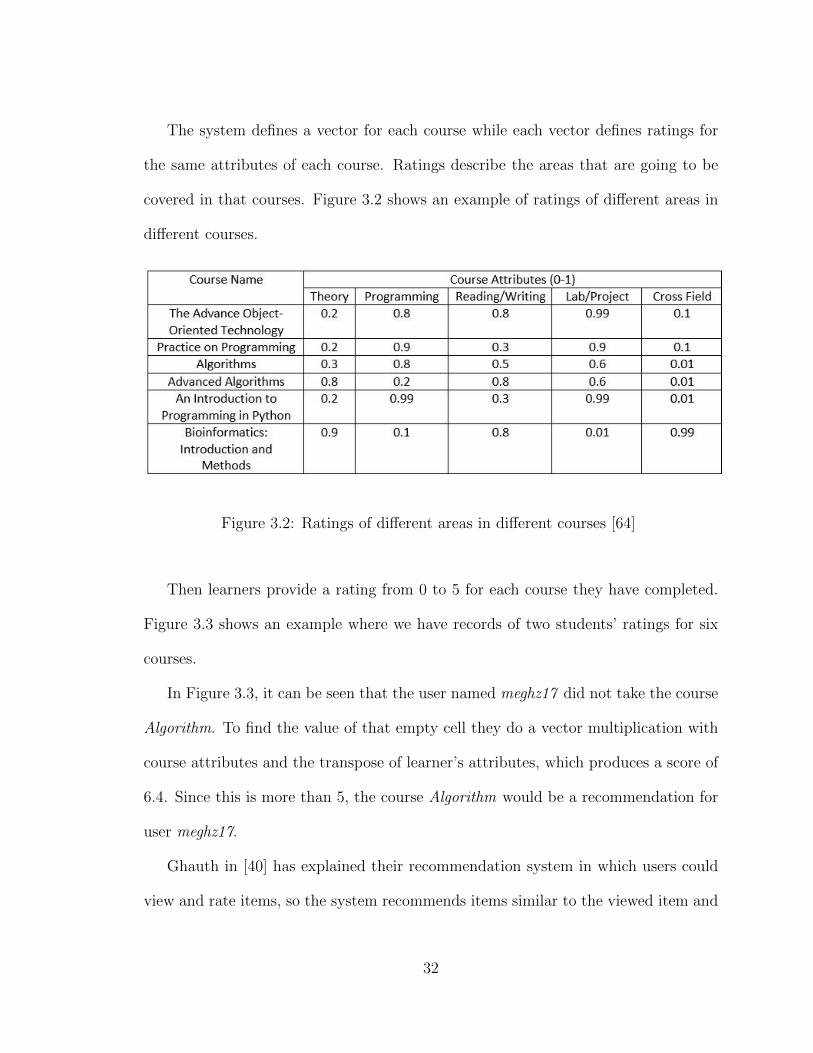
The system defines a vector for each course while each vector defines ratings for
the same attributes of each course. Ratings describe the areas that are going to be
covered in that courses. Figure 3.2 shows an example of ratings of different areas in
different courses.
Figure 3.2: Ratings of different areas in different courses [64]
Then learners provide a rating from 0 to 5 for each course they have completed.
Figure 3.3 shows an example where we have records of two students’ ratings for six
courses.
In Figure 3.3, it can be seen that the user named meghz17 did not take the course
Algorithm. To find the value of that empty cell they do a vector multiplication with
course attributes and the transpose of learner’s attributes, which produces a score of
6.4. Since this is more than 5, the course Algorithm would be a recommendation for
user meghz17.
Ghauth in [40] has explained their recommendation system in which users could
view and rate items, so the system recommends items similar to the viewed item and
32

Figure 3.3: Student’s ratings for completed courses [64]
also make recommendations based on good learners’ average rating on the viewed
items.
There exist many collaborative educational recommendation systems that recom-
mend users based on users’ similarity. They find similarities between users based on
different factors in various ways. Some of them are mentioned below.
Tai in [76] proposed a course recommendation system which uses artificial neural
networks to classify the learners with similar behavioral patterns in different groups,
then uses association rule mining to find the best learning path for each group. Then
33

members of the groups could receive recommendations based on each group’s opinion.
Liu in [53] also used collaborative filtering technique based on collecting and analyzing
information about user activity.
Bydzovska in [21] introduced a tree-like template in their research to represent
mandatory and elective courses for each field of study. In their system, each completed
course is marked with a green ring, and the uncompleted courses are marked with a red
cross. They used 67 templates for active students in their data set. A recommendation
method was designed based on four algorithms to recommend elective courses which
belong to their templates.
1. Finding interesting courses with the help of the most frequent path of graduate
students in the template (each node is associated with the number of students
that passed through).
2. Selected the most similar students and recommended their courses.
3. The teachers’ popularity was calculated based on students’ feedback. The sys-
tem then recommended other teachers’ courses if their popularity was higher
than the popularity threshold.
4. The system explicitly discovered friendship of users relying on posts and com-
ments in discussion forums, e-mails statistics, publication co-authoring, or file
sharing and then recommended courses that were interesting for their friends.
Imran in [44] described that their recommendation system recommended courses
considering the learning object they are visiting and also the learning objects visited
by other learners with similar profiles.
34

3.1.2 Content-based Filtering Systems
Some of the educational recommendation systems that use content-based methods
are mentioned in this section.
Ghauth in [38] explains their recommendation system, which recommends learning
materials with similar content to the item being viewed. Their system first retrieves
documents’ keywords as materials attributes. Then uses a vector-space model on
attributes table of items to calculate the value of similarity among learning resources.
Top-N resources that exceed the similarity value threshold are chosen for the next
step which is calculating good learners predicted ratings for learning resources. For
recommending resources, they used the average ratings of good learners.
Chu in [25] used course selection records from senior college students for their
data set. They categorized elective courses based on the material of courses with the
help of professors and assigned percentages to the relatedness between course and
categories. For instance, they said in fuzzy logic courses, AI is more important than
mathematics. Then a directed graph (DG) was created from the expression of the
order of each category’s importance. So, with the preference sequence of students,
their system was able to recommend the most preferred courses to students. They
evaluated their system by a questionnaire which was conducted by students who
already graduated.
3.1.3 Hybrid Recommendation Systems
Liang in [51] presented a hybrid personalized course recommendation system with
the combination of content-based filtering and collaborative filtering. In their system,
35

every user has an interest group of users. When a learner enters keywords on the portal
of the courseware management system, it searches within his/her interest group of
users and finds k courses with the same or similar keywords that other users have
chosen. A recommendation degree will be associated with each of those k courses
which are the multiplication of the degree of trust (the similarity between that specific
user and other users of interest group) and the evaluation of course by the user. The
top five courses of the list would be recommended to the user.
Khribi in [49] used data mining techniques and the combination of content-based
and collaborative filtering to recommend relevant resources to active users. Their
recommendations were based on learners recent navigation history and extracting
similarities and dissimilarities between user preferences and contents of the learning
resources.
Some of existing course recommendation systems consider different factors such
as time, availability, and prerequisites. Xu in [78] proposed a course sequence recom-
mendation tool that could select course sequences in a way that would try to decrease
the time required for graduation and increase the overall GPA of the student, while
considering prerequisite requirements, and course availabilities.
Some personalized recommendation systems are based on user’s personal activities
e.g. doing an on-line quiz, running an on-line simulation. Zaiane in [79] used data
mining techniques to translate learners’ access history stored in web servers’ logs and
recommend e-learning activities or shortcuts of course navigation in a course website.
The logs of web servers, which contain time ordered transactions, is mapped to either
known actions, i.e., learning activities like doing a test or URLs of a web resource in
a transactional format. Then, association rule mining technique will be applied on a
36

pruned set of transactions for finding associations rules.
3.2 Courses and Enrollment History
The following articles, which use association rule mining to find relations between
courses, are most similar to our proposed method.
Aher has published multiple papers regarding their recommendation systems and
compared them. In [7], they used real data from the Moodle Learning Manage-
ment System of their college which is an open-source course management learning
system [66]. They collected information from computer science and information tech-
nology in the Moodle database which contained information about enrolled courses
and activity, including every click students made. They used these logs to find courses
in which a student may be interested.
They tried an Apriori association rule technique before and after pre-processing
the data using the open source data mining tool, Weka. In the pre-processing step,
they eliminated subjects whose count was less than 20 (less than 20 students had
taken that course), and students whose count was less than two (students who have
taken less than two courses). They discovered that without pre-processing, there are
association rules that contain “no” for some courses. For each association rule that
contains “no”, it means that a specific course is not recommended for that user.
In 2012, after pre-processing the data, they applied four different association rule
algorithms (Apriori, predictive Apriori, Tertius, and filtered associator) using Weka
on their data. They concluded that the Apriori association rule algorithm works
better than other algorithms because this is the only one that consists of “yes” only
37

association rules [10].
In their next paper in 2012, they clustered the data using Simple K-means al-
gorithm into two clusters. The first cluster gives the correct result, and the other
cluster gives the incorrect result. Then they classified correct clusters using ADTree
algorithm. In the last step, they applied the Apriori association rule algorithm on
classified data to find the best combination of courses. They discovered the com-
bination of these three algorithms works better than only Apriori association rule
algorithm because not only there is no need for preprocessing the data, but also this
combined approach increases the strength of the association rule [9].
In their next research, they compared seven classification algorithms (ADTree,
Simple Cart, J48, ZeroR, Naive Bays, Decision Table, and Random Forest Clas-
sification algorithm) for their recommendation system and found that the ADTree
classification algorithm works better in finding the best combination of courses than
other five classification algorithms [11].
In another research, they tried different combinations of data mining algorithms
using Weka. First, they applied Apriori association rule algorithm on those courses
for which the value of ADTree classification was negative. Second they applied Apri-
ori association rule algorithm on sub-table of simple K-means clustering algorithm
which gives the correct result. Third, they combined ADTree classification algo-
rithm, simple K-means clustering algorithm, and Apriori association rule algorithm.
The final combination was the order of simple K-means clustering algorithm, ADTree
classification algorithm.
They concluded that the best combination of the mentioned algorithms is the
combination of clustering, classification, and association rule mining [8].
38

In their next paper which was published in 2014, they discovered that combination
of expectation maximization clustering and Apriori association rule algorithm works
better than using only Apriori association rule algorithm [5].
3.3 Career Goals of Users
CourseAgent [34] is a community-based recommendation system to recommend courses
based on students assessment of their particular career goals. It obtains students’ ex-
plicit feedback implicitly, as part of their natural interaction with the system for
self-benefit. The system uses three different aspects of data to suggest courses to
students:
1. Students selected career goals in their profiles
2. Evaluation of students for courses workloads on a scale of 1 to 3
3. Evaluation of students for relevance of course to their selected career goals on
a scale of 1 to 5
The overall workload of a course is the average of all ratings of different students
for a course. Since each student can choose more than one career goal in the system,
the relevance of each course to a student depends on the relevance of the course to his
career goals. Therefore, only those courses with the relevance ranking of 3 or more in
at least one career goal of a student will contribute to overall relevance of the course
to that student.
Rating the relevance of courses to career goals by students themselves who may
not have enough information either about the course or their career goals might
39

be misleading for the system. They also refer in their paper that “An example of
self-deception which can be provoked by our incentive approach is what we called
positive rating bias.” Students ratings affect system’s recommendation. Hence, the
system recommends courses to students based on students assumptions [34].
40

Chapter 4
Method
This research aims to design and implement a personalized course recommendation
system based on the career goals of users. The goal of this system is to recommend
a set of courses toward a user’s career goals that will cover key skills trending in the
market among many employers.
Our proposed method addresses some of the existing challenges in many of the
existing recommendation systems that were mentioned in the previous chapter. Our
system does not depend on implicit or explicit feedback from the users to be able
to make recommendations which will help eliminating the cold start problem. Some
recommendation systems try to predict users’ performance or grades for a course
based on their background and history in their system but our system doesn’t depend
on such predictions to make recommendations. This chapter details these challenges
and addresses how our system compares to other course recommendation systems.
41

4.1 Data Gathering
For a personalized course recommendation system to consider the career goals of
users, some preliminary information is required. Specifically, information about the
relation between job titles (career goals) and required courses is essential. The pri-
mary connection between the two is a set of skills needed for someone to be a good
candidate for hiring into a career, as well as a set of skills covered in each course.
To achieve this purpose, two different datasets were designed. The first provides
the set of skills required for a specific job position. Data was gathered from the
Indeed website1, which is a worldwide job posting website available in more than 60
countries. Indeed launched in 2004 and is now one of the most popular job search
websites in North America.
The Octoparse crawler2 was used to export information from the job postings in
North America on the Indeed website. The title of each job posting and the required
skills were crawled from each job posting. As a result, we have a dataset in which
each record contains a job title and a set of skills. We extracted 400 records from
job postings for each of the three job titles: “Software Developer”, “Data Scientist”,
and “Hardware Engineer”. Each record of this dataset has a maximum number of 15
skills depending on the number of skills that was mentioned on that job posting.
The second dataset was designed to associate courses and skills. We used MOOC
List3 for gathering the associations between courses and skills.“A MOOC (Massive
Open Online Course) is an online course aimed at unlimited participation and open
1https://ca.indeed.com2https://www.octoparse.com3https://www.mooc-list.com
42

access via the web” [47]. MOOC List is an aggregator (directory) of Massive Open
Online Courses (MOOCs) offered by different providers that helps users find online
courses (MOOCs) offered by top providers and the best universities around the world.
The Octoparse crawler was employed to identify the skill associations from each avail-
able and related online course on the MOOC List. The information we extracted for
creating our dataset is the name of the course and all of the skills that are covered
in that course. We extracted the top 500 MOOCs in the field of computer science,
computer engineering, and electrical engineering.
4.2 Proposed Method
The proposed personalized course recommendation system has three phases designed
to perform sequentially. For each job title, these phases were performed in order to
get the desired recommendation, which are briefly summarized here:
• In the first phase, the Apriori algorithm was used to discover the most frequent
skill sets for that job title from the records of the first dataset. In each row of
the dataset, the first column contains a job title, and the others list skills that
are associated with that job title extracted from the Indeed job postings. There
exist multiple rows for each job title, and the goal of this phase is to aggregate
all these data rows into a desired number of association rules, each containing
a set of skills. Each association rule that is created using Apriori algorithm in
this phase will have the same structure as the mentioned dataset.
• In the second phase of the method, a Genetic Algorithm (GA) was run for
43

evolving the extracted association rules with the goal of improving those found
by the Apriori algorithm in the first phase. The input to the GA in this phase
consists of the set of discovered association rules from the previous phase and
some random skill sets. The fitness function measures the coverage of each
individual against the dataset of job titles and skills. It assigns each individual
a fitness score based on two parameters. One is the number of skills that exist
in the individual and a row of the dataset with that job title (one score is given
for each covered skill). The other parameter is the number of skills that exist
in the individual but do not exist in the dataset for that job title (one negative
score is given for each extra skill). This GA was run 10 times for each job title,
and the fittest individual after 100 generations was used as input to the next
phase.
• Once an optimized set of skills for a job title was identified, they were mapped
to some courses so they could be recommended to users with that career goal.
This phase of our method is a Set Cover problem. The challenge is to find the
minimum number of courses that cover all of the desired skills. We use another
GA in this method in order to find an optimized solution. By using the GA
designed for this phase and with the help of the second dataset that contained
the list of skills covered in each course, an optimized set of courses can be
identified and recommended to users. Each individual in this GA contains a set
of randomly generated courses that were evolved over generations using genetic
operators. The fitness function measured each individual based on two factors:
the coverage of skills that are required from the output of the previous phase
44

and the total number of courses suggested to cover those skills.
4.2.1 Phase One
In order to provide more details about the process, assume that there are 10 job titles
in the first dataset and 100 records of data for each of these job titles (a total of 1000
rows in the first dataset). Table 4.1 illustrates an example of our job-skill dataset
for the job title G1 and the mentioned set of skills (Sn) on each of the extracted job
postings.
G1 S1 S2 S4
G1 S1 S3 S4 S8
G1 S4 S5 S7
G1 S1 S4 S6 S7 S8
Table 4.1: Job-skill dataset extracted from job postings including a job title and the
set of skills mentioned on those job postings
Association rule mining using the Apriori algorithm was used to determine 10
association rules for each job. After analyzing 100 sets of skills, for each job (Gm),
one of the most frequent skill sets (association rules) looks like S1, S4, S8 → G1 where
S1, S4, and S8 are the three main skills that can lead to the job G1. As shown in
Table 4.2, at the end of the first phase, a desired number of association rules for other
jobs are provided as well.
45

G1 S1 S4 S8
G2 S2 S8 S12
G3 S3 S6 S8
Table 4.2: Career goals (Gm) and their extracted set of main skills (Sn)
4.2.2 Phase Two
In the second phase of the method, to optimize the resulting sets of skills found
in the first phase, a Genetic Algorithm was used. A fitness function measured skill
coverage and completeness of each association rule, during the process of evolution, for
selecting the best individuals of each generation for reproducing into next generations.
For measuring the fitness of each association rule, it is compared against all records
of the dataset with that specific career goal. The fitness of an individual is calculated
in two steps:
RowFitnessi = SkillCoveragei − ExtraSkillsi (4.1)
Where:
RowFitnessi: each individual is compared against each record of the job-skill
dataset and will receive a score based on the covered skills and missed skills
on that row. RowFitnessi is the fitness score that is assigned to an individual
against row i of the dataset.
SkillCoveragei: total number of skills from the individual that are present in
the row i of the dataset.
46

ExtraSkillsi: total number of skills from the individual that are not present
in the row i of the dataset.
Fitness = Average(RowFitness1...n) (4.2)
Where:
Fitness is the average value of RowFitness for an individual that is calculated
against all n rows of the job-skill dataset.
Considering the example job-skill dataset in Table 4.1, the fitness of an individual
for the job title G1 that consists of the skills S1, S4, and S8 can be calculated as
follows:
• Since the dataset has 4 records for G1, first we need to calculate RowFitness[1..4]:
RowFitness1 = 2− 1 = 1
RowFitness2 = 3− 0 = 3
RowFitness4 = 1− 2 = −1
RowFitness4 = 3− 0 = 3
• Fitness of this individual is then calculated as follows:
Fitness = Average(RowFitness[1..4]) = 1.5
After measuring the fitness of all individuals in each generation, roulette wheel
selection was applied for choosing parents for reproduction. Crossover and mutation
47

operators were used on parents respectively to generate offspring in each generation.
Elitism was used to ensure the fittest individual of each generation survives into next
generation.
4.2.3 Phase Three
After the second phase is completed, the fittest evolved set of skills for each career
goal was used in the final phase. This phase is aiming to find an optimized solution to
a Set Cover problem using a Genetic Algorithm. The problem is to find the minimum
number of courses that can cover all of the required skills in order to be recommended
to the users as the output of our system.
In the second dataset that was mentioned earlier in this chapter, each course is
associated with some skills that will be learned by a student after passing that course
successfully. Table 4.3 shows a simple example of our course-skill dataset. It shows
which skills (Sn) are covered in each course (Cm). For example, course number 2 (C2)
covers skills number 2, 3, and 4 (S2, S3, S4). This view of the dataset is used in the
fitness function of our method.
C1 S3
C2 S2 S3 S4
C3 S3 S5
C4 S1 S2 S5
C5 S6
Table 4.3: Courses (Cm) and set of skills that they cover (Sn).
48

We also build another view of this dataset as shown in Table 4.4 which will be
used while generating new individuals in the GA of this phase. This view of the
dataset shows which courses can cover each skill.
S1 C4
S2 C2 C4
S3 C1 C2 C3
S4 C2
S5 C3 C4
S6 C5
Table 4.4: Skills (Sn) and set of courses that will cover those skills (Cm).
The GA designed for this final phase of the method aims to suggest the best
combination of courses to cover all skills that are required for each career goal. That
set of skills was the output of the previous phase (target skill set) and were used in
the fitness function of this GA to measure the quality of each individual. In this GA,
each individual contained a list of courses, and the initial population was randomly
generated. The fitness function of this phase is designed to assign a lower fitness score
to individuals with more genes (more number of courses) so that the best individual
covers more skills using a fewer number of courses. Fitness is calculated as follows:
Fitness =# of covered skills
Total # of required skills− # of suggested courses
Total # of available courses(4.3)
49

Where:
# of covered skills: the number of skills from target skill set of that career
goal that is covered by courses suggested by the candidate individual.
Total # of required skills: size of target skill set.
# of suggested courses: the number of courses in the candidate individual.
Total # of available courses: total number of rows (courses) in our course-
skill dataset.
Consider that we want to recommend a set of courses for the job title G1 and the
best set of skills for G1 that was found in the previous phase consists of S2, S3, and
S6. Having an individual that consists of the set of courses C2, C3, and C5, and the
example of course-skill dataset in Table 4.3, the fitness will be calculated as follows:
Fitness = 33− 3
5= 0.4
For the mentioned example, an individual that consists of the skills C2 and C5 is
the optimal solution which will get a fitness of 0.6 which means that this candidate
solution can cover all of the 3 required skills for the job title G1 by recommending 2
courses to the user.
As in the earlier GA, this GA uses roulette wheel selection, the same genetic
operators for reproduction, and elitism. The output of this phase, which is our
system’s final output, is a set of courses required to achieve the desired chosen career
goal and will be recommended to the user.
50

4.3 Challenges
Some earlier research in the area of recommendation systems and the methods that
were used to solve some problems were mentioned in the previous chapter. Some of
the critical challenges from those previous works, and the way our method addresses
them are discussed here.
4.3.1 Implicit Feedback
Many course recommendation systems use implicit feedback of users. Implicit feed-
back is inferred from user behavior. Some examples of possible implicit feedback
from users for a recommendation system are their browsing behavior logs in online
course websites, the time that users have spent on their previous courses, learning
styles, online activities, grades, and instructors that they usually take courses with.
Extracting these pieces of data not only is time-consuming and in some cases even
impossible, but it might also carry privacy issues. Our proposed method does not
depend on any implicit feedback from users.
4.3.2 Explicit Feedback
Some recommendation systems use explicit feedbacks from users. e.g., they ask users
to fill out surveys about the usefulness of each course after taking it, course difficulty,
rating the instructor, time sufficiency, and course coverage. Asking lots of questions
and filling surveys to make a user’s profile to be able to recommend courses based
on their interest and background might be annoying for some users and it also might
have privacy issues.
51

Our system does not have the problem of dependency on user’s explicit feedback
after taking each course. It does not need the engagement of users or the need to
encourage them to give feedback which can become an obstacle to testing the system
and measuring performance. The only piece of information it needs from users is
their career goal.
4.3.3 Cold Start
The cold start problem is a challenge for recommendation systems when there is not
enough information available at the outset for making recommendations. Depending
on the nature of each recommendation system, the reason behind this might differ
from the other systems, but in many cases, it happens because the system is designed
to compare the user’s profile to some reference characteristics to create recommen-
dations. It can also be caused by the small number of users or items in the system,
or users may not have provided enough information at the starting point. Before
providing any recommendations, there should be information about user interests or
item details. Some systems can recommend to only those users of the system who
have taken at least one course such as Ray’s in [63].
Our course recommendation system does not have the cold start problem when
there is no information regarding user’s history of courses taken. It has the ability to
recommend courses to users just by having their career goal.
52

4.3.4 Performance of Users
Some systems predict users’ final grades in a course, based on their background knowl-
edge and their previous grades to decide whether it is a good recommendation. These
systems depend on the performance of users. Uncertainty when predicting the per-
formance of users in a future course based on their previous performance might affect
the performance of the system too.
Systems that look at a user’s performance will most probably have a different
purpose compared to our system. The focus of our system is toward a career goal while
the mentioned systems mainly target academic progress or minimizing graduation
time for users [17, 19]. Our system recommends students to take some courses with
the aim of achieving some skills so that they can become good candidates for their
target job.
4.3.5 Similarity of Users vs. Career Goal
Most course recommendation systems suggest courses to users based on similarities
between users, or the similarities between the courses that they took. Almost none
of the existing systems focus on addressing the connection between courses and job
opportunities, based on the skills that they could achieve in those courses. Our
system recommends practical courses that cover essential skills for specific jobs and
is designed for users whose goal is to reach a career goal they are interested in.
53

Chapter 5
Implementation
In this chapter, the implementation of each phase of our method is explained in more
detail. For the first phase, we use the R programming language and the arules library
to apply the Apriori algorithm on the extracted job-skill dataset. For the second and
the third phase of the method, we use HTML and JavaScript to implement and
visualize both Genetic Algorithms.
5.1 Data Gathering
As mentioned in the previous chapter, our system needs two datasets. The first one
is a job-skill dataset that associates each career goal (job title) from a job posting on
Indeed to a set of skills. The second one is a course-skill dataset that is used in the
third phase of this method and includes the associations between each course and the
set of skills covers in that course.
We used the Octoparse website scrapper tool to build our job-skill dataset from
Indeed job postings. We extracted 400 rows of data from job postings for each of the
54

three job titles: “Software Developer”, “Data Scientist”, and “Hardware Engineer”.
Each record in this dataset contains a job title for the first column and a set of skills
for the next 15 columns. Job postings that mentioned less than 5 skills were ignored
during the extraction process and a maximum number of 15 skills were found on one
job posting. Choosing 5 as the minimum number of skills for each job posting will
result in recommending a combination of courses to the user that will cover at least
5 skills. In this implementation, we chose 5 so that we can see how our system works
if someone is looking to learn at least 5 trending skills for a specific career goal. This
number can be an input parameter to our system that can be set by the users so that
each user has the ability to choose the minimum number of skills they are aiming to
learn. The same number needs to be used in the first phase of our method as the
minimum length of association rules so that each association rule consists of at least
5 skills.
We then built the course-skill dataset using Octoparse to extract data from the
MOOC List1 which offers a list of MOOCs and the set of skills that can be acquired
during each course. We extracted the top 500 MOOCs in the field of computer
science, computer engineering, and electrical engineering (sorted by average rating)
and created the course-skill dataset.
1https://www.mooc-list.com
55

5.2 First Phase
In this phase of our method, we used RStudio2 to apply the Apriori algorithm on our
job-skill dataset so that we can achieve the most frequent skill sets for each career
goal. The tasks of this phase are done in the following order:
• Importing the job-skill dataset into RStudio environment
• Applying Apriori algorithm using the arules package3. The arules package for R
provides the infrastructure for representing, manipulating, and analyzing data
for mining frequent itemsets and applying association rules [41]. In this step
we extracted the most frequent skill sets for each career goal with the following
criteria:
– Minimum length of association rule: 5
– Minimum support of association rule: 0.1
Where minimum length of the association rule represents the minimum number
of skills that are required for each association rule to have. Since we want
to recommend a list of courses to the users that cover at least 5 skills in this
implementation, this parameter is set to 5. Minimum support represents how
frequently that itemset appeared in the dataset on a scale of 0 to 1. Since we
are sorting the association rules by their support value to pick the top ones,
this parameter is not effectively impacting the results and will only improve the
performance by ignoring less useful association rules.
2https://www.rstudio.com/3https://cran.r-project.org/web/packages/arules/index.html
56

• Sorting itemsets based on their support value
• Exporting top 20 output
At the end of this phase, we selected the top 20 sets of skills for each of the career
goals to be used in the next phase. Based on the gathered datasets for the mentioned
job titles, choosing more than 20 sets of skills would result in using the ones with
lower support values that are less useful and less likely to change the final output of
our method. Figure 5.1 shows a sample of generated itemsets from our dataset.
Figure 5.1: A sample list of itemsets with different supports in RStudio
5.3 Second Phase
For this phase of the method, JavaScript and HTML are used to implement the
Genetic Algorithm (GA). We used a basic GA implemented by Daniel Shiffman4 as
a template to implement the second and third phases of our method.
4http://natureofcode.com/
57

During this phase, the initial population consists of two parts. The first part
consists of the set of individuals (skill sets) that are created using the output of the
previous phase and the second part consists of randomly generated individuals.
5.3.1 Chromosome Representation
Each individual in this GA is implemented using the value encoding method. In
our implementation, each chromosome is a bit string of ASCII characters that are
encoded from skills to genes using the Base64 encoding method. We encode skills to
be used in our chromosome structure using built-in JavaScript functions for Base64.
Listing 5.1 shows the implementation of three functions that are used for the
encoding and the decoding process. Function newGene generates a random skill
and returns the encoded string using window.atob function. This function is used
whenever a random gene is needed. Function skill2gene gets the string name of a
skill as an input and returns the encoded character associated with that skill. For
instance, if the input of this function is “python”, the output will be the encoded
string “cHl0aG9u”. Function gene2skill gets an encoded string and decodes it to its
skill using window.btoa function. For example, if the input of this function is the
string “cHl0aG9u”, the output will be “python” that was originally encoded using
skill2gene function. A string array named skillSet is used in these functions that
contains a set of 170 skills (extracted from datasets) that are available to choose from.
58

function newGene() {
var s = Math.floor(Math.random()*skillSet.length);
return window.atob(skillSet[s]);
}
function skill2gene(skill) {
for(var i=0; i<skillSet.length; i++) {
if(skillSet[i]===skill)
return window.atob(skill);
}
}
function gene2skill(gene) {
if(gene)
return window.btoa(gene);
else
return ‘‘ERROR’’;
}
Listing 5.1: Encoding functions
5.3.2 GA Parameters
The GA configuration we used for this phase of our method is presented in Table 5.1.
The minimum length of each individual in this GA is 5 and the maximum length is
15. These numbers are chosen in a way that can help improve performance of the
GA without limiting the search space. The latest population of individuals after 10
runs of this GA had an average length of 8.5.
5.3.3 Fitness
As shown in the Listing 5.2, each individual is compared to the records of the job-skill
dataset which was imported into the data array, and will receive a score (rowScorep)
on each record of the dataset with the same career goal. Then, the average of all the
“rowScore”s is returned as the fitness of that individual. The function indexOf(s)
which is used in this implementation, searches for the given input s in an array and
59

Table 5.1: GA parameters of the second phase of our method
Parameter Name Value
Population Size 200
Number of Generations 100
Creation Type Top 20 of first phase + 180 random individuals
Crossover Probability 98%
Mutation Probability 2%
Selection Type Roulette Wheel
Elitism True
Steady State True
returns a non-negative integer if s is found in the array. If s is not present in the
array, it will return -1. Each rowScore is calculated as follows:
• For each row p of data array (datap), the rowScorep is initialized to 0
• +1 point for each skill that exists in the individual AND in the datap
• -1 point for each skill that exists in the individual but doesn’t exist in the datap
60

this.calcFitness = function() {
var rowScore=[];
for(var p=0; p<data.length; p++){
rowScore[p]=0;
for(var s=0; s<data[p].length; s++){
if(this.gene.indexOf(skill2char(data[p][s]))>=0)
rowScore[p]=rowScore[p]+1;
}
for(var k=0; k<this.genes.length; k++){
if(data[p].indexOf(char2skill(this.genes[k]))<0)
rowScore[p]=rowScore[p]-1;
}
var sum=0;
for(var i=0; i<rowScore.length; i++)
sum=sum+rowScore[i];
this.fitness=sum/rowScore.length;
};
Listing 5.2: Fitness function of the second phase
5.3.4 Selection
We used the roulette wheel selection technique for our method. Based on their fitness
value, each member will be added to the mating pool for a certain number of times.
A higher fitness results in more entries to the mating pool which will make it more
likely to be picked as a parent.
Our implementation of the selection operator is illustrated in Listing 5.3, in
which population is an array that includes individuals of a particular generation.
maxFitness contains the fitness value of the fittest individual from the population,
which is then used for normalizing the fitness value of all individuals. Finally, each
individual will be added to the mating pool between 0 and 100 times based on their
fitness value. This method generates the mating pool and is then used for generating
a new population.
61

this.Selection = function() {
this.matingPool = [];
var maxFitness = -100;
for(var n=0; n<this.population.length; n++){
if(this.population[n].fitness > maxFitness)
maxFitness = this.population[n].fitness;
}
for(var i=0; i<this.population.length; i++){
var fitness = map(this.population[i].fitness,0,maxFitness,0,1);
var m = floor(fitness*100);
for(var j=0; j<m; j++)
this.matingPool.push(this.population[i]);
}
};
Listing 5.3: Roulette wheel selection method
For instance, consider that we have a population of 3 individuals with each con-
sisting of 3 skills: I1 = {S1, S2, S3}, I2 = {S1, S2, S4}, and I3 = {S2, S3, S4}. If the
fitness value of I1 = 1, I2 = 2, and I3 = 4, a mating pool will be generated by using
the implemented selection method with 175 individuals that consists of:
• I3× 100: Because I3 had the highest fitness from this population, it was added
to the mating pool 100 times.
• I2 × 50: Since I2 had a fitness value that was half of the value of the highest
fitness in this population, it was added 50 times to the mating pool to have a
mating chance equal to half of the fittest individual.
• I1×25: Same as the previous individual, I1 gets less chance of mating by having
one-fourth of the chance of the fittest individual.
In order to generate a new population, each time that a parent is being selected
for breeding, a random individual will be chosen from this mating pool.
62

5.3.5 Crossover and Mutation Operators
In our GA, we implemented a single-point crossover operator in order to create two
offspring from two selected parents. As shown in Listing 5.4, our crossover method
randomly chooses a midpoint and swaps the genes after the selected midpoint between
two parents to generate two offspring.
The bit-flip mutation is implemented in our method to mutate one or more genes
of the individual. The likelihood of each gene to be replaced by a new randomly gener-
ated gene is specified by the mutation rate, which is one of the predefined parameters
of GA.
this.crossover = function(partner) {
var offspring[] = new DNA(this.genes.length);
var midpoint = Math.floor(Math.random()*this.genes.length);
for(var i=0; i<this.genes.length; i++){
if(i>midpoint){
offspring[0].genes[i] = this.genes[i];
offspring[1].genes[i] = partner.genes[i];
}
else{
offspring[0].genes[i] = partner.genes[i];
offspring[1].genes[i] = this.genes[i];
}
} return offspring;
};
this.mutate = function(mutationRate){
for(var i=0; i<this.genes.length; i++){
if(Math.random() < mutationRate)
this.genes[i] = newChar();
}
};
Listing 5.4: Crossover and mutation implementation
For example, if the two individuals I1 = {S1, S2, S3, S4} and I2 = {S5, S6, S7, S8}
are chosen as parents, the crossover function will choose a random point and generate
two offspring. A possible output for the mentioned example is {S1, S2, S7, S8, } and
63

{S5, S6, S3, S4}.
5.4 Third Phase
At the end of performing the second phase, we picked the fittest individual from the
latest generation of our GA for each career goal to be in used in this phase. The GA
designed for this phase tries to find the minimum number of courses that can cover
all of the desired skills so that our system can recommend them to the user.
The evolved target skill set for a career goal, from the previous phase, is used by
the GA in this phase to measure the fitness of each course set. The selection method
and the genetic operators are implemented using the same techniques as the previous
phase.
5.4.1 Chromosome Representation
The representation of individuals in this GA is similar to the previous phase and is
achieved by the value encoding using ASCII characters. The main difference in the
implementation of this GA is that we imported data from our course-skill dataset
instead of the job-skill dataset that was used before. Each gene in an individual
represents a course in this GA.
5.4.2 GA Parameters
The GA configuration we used for the third phase of our method is presented in
Table 5.2. The minimum length of individuals in this GA is set to 1 which is when
a single course can cover all of the desired skills. The maximum length is also set
64

to 15 since that is the highest number of possible skills from the GA in the previous
phase. If the desired skill set includes 15 skills, in the worst case scenario where each
suggested course can only cover one skill, we would have no more than 15 courses.
Table 5.2: GA parameters of the third phase of our method
Parameter Name Value
Population Size 200
Number of Generations 100
Creation Type Random
Crossover Probability 98%
Mutation Probability 2%
Selection Type Roulette Wheel
Elitism True
Steady State True
5.4.3 Fitness
The implementation of the fitness function used in this phase is shown in Listing 5.5.
It calculates the fitness value of an individual based on its length, and the total number
of skills that it covers compared to the top individual for that career goal which was
generated in the previous phase. The function getAllCoveredSkills returns an array
of skills that an individual (a set of courses) will cover. The output of this function
(geneSkills) is then used to calculate the number of covered skills.
65

this.calcFitness = function() {
var coveredSkills = 0;
var totalRequiredSkills = topIndividual(this.careerGoal).length;
var numOfSuggestedCourses = this.genes.length;
var totalCourses = courses.length;
var geneSkills = getAllCoveredSkills(this.genes);
for(var i=0; i<geneSkills.length; i++){
if(topIndividual(this.careerGoal).indexOf(geneSkills[i]) >= 0)
coveredSkills = coveredSkills+1;
}
this.fitness = (coveredSkills/totalRequiredSkills) -
(numOfSuggestedCourses/totalCourses);
};
Listing 5.5: Fitness function of third phase
66

Chapter 6
Results
As mentioned in the previous chapter, we used the R programming language for the
first phase to mine the association rules with the Apriori algorithm. For the second
and third phase, HTML and JavaScript were used to implement the two Genetic
Algorithms. The software and hardware specifications used for our experiments are
as follows:
• Windows 10 x64-based processor
• Intel Core i5-4200U CPU @ 1.60GHz 2.30GHz
• 8 GB Memory
• RStudio 0.98.1103
67

6.1 Phase One
In this phase, we ran the Apriori algorithm on our job-skill dataset for each job title
separately. The top 20 skillsets for each job title are selected based on their support
value to be used in the initial population of the next phase. The top three association
rules generated from our dataset in this phase of the algorithm are presented in
Table 6.1.
Table 6.1: Top 3 extracted association rules for each job title
Job title Skill set Support
Data Scientist {hadoop, python, r, scala, statistics} 0.315
{java, python, r, scala, statistics} 0.315
{java, pig, r, scala, spark} 0.31
Software Developer {agile, css, git, java, c} 0.236
{xml, c, git, java, sql} 0.233
{c++, css, git, java, sql, javascript} 0.231
Hardware Engineer {signal processing, digital design, ethernet, fpga,
embedded systems}
0.145
{architecture, digital design, modeling, rf (Radio
Frequency), signal processing}
0.104
{architecture, digital design, schematic design,
fpga, embedded systems}
0.104
68

A higher support value is observed in the discovered skillsets for the job title “Data
Scientist” compared to the other two job titles. A higher support value for a skillset
indicates that those combinations of skills were found in more job postings comparing
to the other skillsets. For example, the top skillset in “Data Scientist” category with
a support value of 0.315 can translate into the fact that the combination of these
skills was found in 31.5% of the extracted job postings with that job title.
6.2 Phase Two
The GA implemented in this phase has a population size of 200. A population size of
200 was chosen for this GA after running it with different population sizes in incre-
ments of 50 in the range of 50 to 300. We observed that there was no improvements
in the fitness of the best individual from the latest generation after the population
size of 200.
For each job title, the top 20 association rules that were found during the previous
phase will form 20 out of 200 individuals in the initial population for this GA. The rest
of the individuals are generated randomly. For each job title, we performed 10 runs
with different random seeds. The development of the fitness for the best, worst and
the average of all individuals in each generation during the evolution of this phase for
the job title “Data Scientist” is shown in Figure 6.1. A higher fitness value represents
a better performance in this GA’s fitness model.
The consistent improvement of the best, average and worst fitness value over 100
generations shows that the evolved individuals had a better performance compared to
the initial individuals. An experiment is detailed later in this chapter that investigates
69

Figure 6.1: Evolution of the best, average, and worst fitness in runs of the second
phase for the job title “Data Scientist”
the effectiveness of using the top association rules generated in the first phase of our
method on the evolution of individuals in this GA. The latest improvement in the
best individual of a generation was observed in the 68th generation and after that,
the improvements were limited to the average and worst fitness of individuals.
There was a minor decrease in the average fitness of individuals during the first
few generations that is caused by destructive mutation and crossover operations per-
formed on the 20 individuals that were chosen from the first phase. Those individuals
had a significantly better fitness value at the start compared to randomly created
individuals.
Figure 6.2 illustrates error bars on the average fitness chart using the standard
deviation of individuals that indicates where the majority of each population are.
The fittest individual among all 10 runs in this phase for the job title “Data
Scientist” had a fitness value of 2.4. This individual represents the following set of
70

Figure 6.2: Error bars indicating (one) standard deviation of individuals in the second
phase for job title “Data Scientist”
skills:
• {SQL, Hadoop, Python, Statistics, Java, Data Modeling, R, Spark}
In other words, using the method we designed, a candidate with the mentioned
skills can be a strong candidate for “Data Scientist” jobs, considering the current job
postings in the market.
Figure 6.3 and 6.4 show the development of fitness for the best, worst, and the
average of all individuals for the job titles “Software Developer” and “Hardware
Engineer”.
We observe an initial decrease in the average fitness of the first few generations
in the runs for all three job titles. This minor decrease is caused by the portion of
individuals that are created based on the output of the previous phase which was
discussed earlier in this section.
71

Figure 6.3: Evolution of the best, average, and worst fitness in runs of the second
phase for the job title “Software Developer”
Figure 6.4: Evolution of the best, average, and worst fitness in runs of the second
phase for the job title “Hardware Engineer”
72

The fittest individuals for these two job titles represent the following skill sets:
• Software Developer:
– {Git, Java, JavaScript, SQL, CSS, Agile Software Development, C++}
• Hardware Engineer:
– {Digital Signal Processing, Schematic Design, FPGA, Embedded Systems,
RF (Radio Frequency), Circuit Design, Computer Networks}
6.3 Phase Three
We use the skill sets that were found in the previous phase in the fitness function
of the GA designed for this phase of the method. Similar to the previous phase, we
performed 10 runs for each job title. Figure 6.5 visualizes the average of these 10
runs and shows the fitness development during 100 generations of our GA for job
title “Data Scientist”. A higher fitness value represents a better performance.
Figure 6.6 visualizes error bars on the average fitness of the GA in this phase using
the standard deviation of individuals.
The fittest individual that was found after 10 runs of this GA had a fitness value
of 0.992. Using this GA’s fitness model, no individual can obtain a fitness value of
more than 0.998 which can be achieved only when a single course is found that can
cover all of the required skills. The fittest individual with a fitness value of 0.992
covers all of the 8 mentioned skills that are required for the job title “Data Scientist”
with a combination of 4 MOOCs:
73

Figure 6.5: Evolution of the best, average, and worst fitness in runs of the third phase
for the job title “Data Scientist”
Figure 6.6: Error bars indicating (one) standard deviation of individuals in the third
phase for job title “Data Scientist”
74

• Using Databases with Python
– By University of Michigan via Coursera
– Covered Skills: Python, Data Modeling, and SQL
• Hadoop Platform and Application Framework
– By University of California, San Diego via Coursera
– Covered Skills: Hadoop and Spark
• Statistics and R
– By Harvard University via edX
– Covered Skills: R and Statistics
• Object Oriented Programming in Java
– By University of California, San Diego via Coursera
– Covered Skill: Java
Figure 6.7 and 6.8 show fitness development during the evolution of 100 gen-
erations in 10 runs for the two job titles of “Software Developer” and “Hardware
Engineer”.
The fittest individuals, which represent the set of courses to be recommended to
a user for these two job titles are:
• Software Developer:
– Java Programming: Principles of Software Design
75

Figure 6.7: Evolution of the best, average, and worst fitness in runs of the third phase
for the job title “Software Developer”
∗ By Duke University via Coursera
∗ Covered Skill: Java
– Programming Foundations with JavaScript, HTML and CSS
∗ By Duke University via Coursera
∗ Covered Skills: JavaScript and CSS
– C++ For Programmers
∗ By Udacity
∗ Covered Skill: C++
– SQL for Data Science
∗ By University of California, Davis via Coursera
76

Figure 6.8: Evolution of the best, average, and worst fitness in runs of the third phase
for the job title “Hardware Engineer”
∗ Covered Skill: SQL
– Software Development Process
∗ By Udacity
∗ Covered Skills: Agile Software Development and Git
• Hardware Engineer:
– Digital Signal Processing
∗ By Ecole Polytechnique Federale de Lausanne via Coursera
∗ Covered Skill: Digital Signal Processing
– Introduction to FPGA Design for Embedded Systems
∗ By University of Colorado Boulder via Coursera
77

∗ Covered Skills: Embedded Systems, FPGA, and Schematic Design
– RF Design Theory and Principle
∗ By Udemy
∗ Covered Skills: Radio Frequency
– Circuits and Electronics
∗ By Massachusetts Institute of Technology via edX
∗ Covered Skill: Digital Design
– Computer Networks
∗ By University of Washington via Coursera
∗ Covered Skill: Computer Networks
6.4 Experiments
6.4.1 Initial Population of the Second Phase
To investigate the effectiveness of the first phase in the output of our method, we
tested the GA of our second phase with two different scenarios and then we compared
the results. We used an initial population with a size of 200 which were all created
randomly and ran the second phase GA to compare it against our method with
combined initial population. The average results of 10 runs for both scenarios on the
job title “Data Scientist” are presented in Figure 6.9.
Comparing the best and the average fitness of these two scenarios reflects the
effectiveness of using the output of our first phase in the initial population of the GA in
78

Figure 6.9: Combined initial population vs. random initial population
the second phase. In the early generations, the difference of best and average fitness is
more visible in these two scenarios but as the populations evolve, major improvement
in the all-random scenario is observed. After 70th generation, the difference of the
two scenarios is insignificant. Among the 10 runs, the fittest individual of our method
had a fitness value of 2.4 but in the all-random scenario, the fitness value of the fittest
individual was 1.98 and it had one different skill comparing to our method’s best set
of skills which explains the difference in the fitness value.
79

6.4.2 Exhaustive Search vs. Greedy Algorithm vs. Genetic
Algorithm for the Third Phase
The third phase of our method tries to find an optimal solution to the problem of
finding the minimum number of courses that can cover all of the required skills for
a specific job title that was the output of second phase. This is an instance of the
un-weighted Set Cover problem which has no known algorithm that guarantees to find
the optimal solution in polynomial time. There exist many approximation algorithms
for the Set Cover problem. In this experiment, we compared the performance of
our GA-based approach for approximating a near-optimal solution against a greedy
approach and an exhaustive search method. The exhaustive search method that was
implemented in this experiment tests each combination of courses (from 500 total
courses in our course-skill dataset) in order to determine if it is the optimal solution
covering all of the required skills. Such exhaustive examination of all possibilities is
known as exhaustive search, direct search, or the brute force method [27]. It starts
by testing all of the courses individually to see if any single course can cover all of the
required skills. If no result was found, it will try all of the possible combinations of
courses that include two courses. This process will be repeated by adding one more
course in each step until a solution is found.
Table 6.2 shows the result of this experiment for the three mentioned job titles
on our dataset. The Genetic Algorithm that we used in our system was able to
outperform the greedy algorithm for the two job titles “Data Scientist” and “Hardware
Engineer” by finding a solution that has one less course for covering all of the required
skills. By comparing the results of our GA against the exhaustive search method, it
80

is evident that our GA was able to find a solution with the optimal number of courses
for all of these three job titles.
Table 6.2: Comparing greedy algorithm and exhaustive search method to the GA we
used for the third phase
Job titleRequired
# of skills
Greedy:
courses(time)
Exhaustive:
courses(time)
GA:
courses(time)
Data Scientist 8 5 (1.8s) 4 (37s) 4 (2m 38s)
Software Developer 7 5 (1.7s) 5 (25m 36s) 5 (3m 3s)
Hardware Engineer 7 5 (1.2s) 5 (24m 32s) 5 (2m 52s)
By comparing the running times of these three algorithms, we can see that the
greedy algorithm finds a solution that is not always the optimal solution but it is
very fast compared to the other two methods. The exhaustive search method’s per-
formance decreases exponentially as the length of the optimal solution grows in this
problem. Over a dataset that includes 500 elements (courses), it takes about 37 sec-
onds for the exhaustive search to find a solution with a length of 4. For a solution
with a length of 5, it takes about 25 minutes, and if the optimal solution had a length
of 6, this time would increase to about 6 hours.
6.4.3 Location-based Data Extraction
Another experiment we did was to study the impact of location of the job postings
on the output of our system. The main runs presented in the previous sections were
using a dataset that was gathered from all of the North American job postings on
81

Indeed. In this experiment, we extracted three job-skill datasets for the job title
“Data Scientist” from job postings in Toronto, Los Angeles, and Chicago.
After running the first two phases of our method, the best combination of skills
to learn, based on the output of our method, is presented in Table 6.3.
Table 6.3: Top skills for “Data Scientist” based on location
Location Skill set
North America {Python, R, Java, Hadoop, Spark, Data Modeling, SQL, Statis-
tics}
Toronto {Python, R, Java, Hadoop, Spark, Data Modeling, Cassandra,
Scala}
Chicago {R, Hadoop, Scala, Statistics, SQL, Pig, RDBMS (Relational
Database Management System)}
Los Angeles {Python, R, Java, Hadoop, Spark, RDBMS, Scala, C++}
This experiment proves the potential of this method in providing recommendations
based on a user’s geographic preferences.
82

Chapter 7
Conclusion and Future Work
In this research, a proof of concept for a course recommendation system is proposed
that takes the users’ career goals into consideration in order to help them with choos-
ing the right path toward their desired future job. First, data is extracted from
Indeed job postings for the desired job title, showing the relations between job titles
and skills. Then, a second dataset is gathered which contains a set of available online
courses and the skills that they cover. The first phase of the method generates some
association rules using the Apriori algorithm which is then used in the next phase
that runs a Genetic Algorithm to find the best set of skills for each career goal. After
finding the best set of skills for the desired career goal, we need to find the minimum
number of courses that can cover all of these skills to be able to recommend them to
users which is an instance of the Set Cover problem. In our method, the last phase
uses another Genetic Algorithm on the course dataset in order to find the optimum
set of courses. We show that the courses that are being suggested to a user with
a specific career goal in mind will cover key skills that are trending in the market
83

among many employers. We also show a Genetic Algorithm can find better solutions
compared to a greedy algorithm on our problem of finding the minimum number of
courses to cover all of the required skills.
In this thesis, we only implemented the three phases of the method separately as
a proof-of-concept. Implementing a web-based application for this method that can
be used by real users can help investigate the effectiveness of the method further.
In the second phase, we only pick one skillset that contains a set of skills which
has the highest fitness value. If we pick multiple skillsets instead of one in this part
of the method and then run the GA in the third phase once separately for each of
these skillsets, the system may be able to recommend multiple sets of courses to a
user so that there is some choice. The effectiveness of this idea on the output of the
system can be investigated in future work.
Here, we extracted data and tested this method for three of the most popular job
titles in Computer Science and Computer Engineering. Other potential future work
could implement and test this method for other professions.
84

Bibliography
[1] G. Adomavicius and A. Tuzhilin. Toward the next generation of recommender
systems: A survey of the state-of-the-art and possible extensions. IEEE Trans-
actions on Knowledge and Data Engineering, 17(6):734–749, 2005.
[2] P. Adriaans and D. Zantinge. Data Mining. Addison-Wesley, London, 1996.
[3] R. Agrawal, T. Imielinski, and A. Swami. Mining association rules between sets
of items in large databases. In ACM Sigmod Record, volume 22, pages 207–216.
ACM, Washington, 1993.
[4] R. Agrawal, R. Srikant, et al. Fast algorithms for mining association rules. In
Proceedings of the 20th International Conference on Very Large Data Bases,
volume 1215, pages 487–499. Morgan Kaufmann, San Francisco, 1994.
[5] S. B. Aher. An algorithm for predicting the course selection by student in e-
learning using data mining techniques. Journal of the Institution of Engineers
(India): Series B, 95(1):43–54, 2014.
[6] S. B. Aher and L. Lobo. Data mining in educational system using weka.
IJCA Proceedings on International Conference on Emerging Technology Trends
(ICETT), 3:20–25, 2011.
85

[7] S. B. Aher and L. Lobo. A framework for recommendation of courses in e-learning
system. International Journal of Computer Applications, 35(4):21–28, 2011.
[8] S. B. Aher and L. Lobo. Best combination of machine learning algorithms for
course recommendation system in e-learning. International Journal of Computer
Applications, 41(6), 2012.
[9] S. B. Aher and L. Lobo. Combination of clustering, classification & association
rule based approach for course recommender system in e-learning. International
Journal of Computer Applications, 39(7):8–15, 2012.
[10] S. B. Aher and L. Lobo. A comparative study of association rule algorithms for
course recommender system in e-learning. International Journal of Computer
Applications, 39(1):48–52, 2012.
[11] S. B. Aher and L. Lobo. Selecting the best supervised learning algorithm for rec-
ommending the course in e-learning system. International Journal of Computer
Applications, 41(5), 2012.
[12] I. E. Allen and J. Seaman. Online report card: tracking online education in the
united states. Babson Survey Research Group, 2016.
[13] D. Ashlock. Evolutionary computation for modeling and optimization. Springer
Science & Business Media, 2006.
[14] F. B. Baker and S.-H. Kim. Item response theory: Parameter estimation tech-
niques. Taylor & Francis, 2004.
86

[15] W. Banzhaf, A. Lakhtakia, and R. J. Martin-Palma. Evolutionary computation
and genetic programming. In Engineered Biomimicry, pages 429–447. Elsevier,
2013.
[16] W. Banzhaf, P. Nordin, R. E. Keller, and F. D. Francone. Genetic programming:
an introduction. Morgan Kaufmann, San Francisco, 1998.
[17] R. Bekele and W. Menzel. A bayesian approach to predict performance of a
student (bapps): A case with ethiopian students. Algorithms, 22(23):24, 2005.
[18] N. Bendakir and E. Aımeur. Using association rules for course recommendation.
In Proceedings of the AAAI Workshop on Educational Data Mining, volume 3.
American Association for Artificial Intelligence, 2006.
[19] J. Bobadilla, F. Serradilla, A. Hernando, et al. Collaborative filtering adapted to
recommender systems of e-learning. Knowledge-Based Systems, 22(4):261–265,
2009.
[20] R. Burke. Hybrid recommender systems: Survey and experiments. User Modeling
and User-adapted Interaction, 12(4):331–370, 2002.
[21] H. Bydzovska. Course enrolment recommender system. In T. Barnes, M. Chi, and
M. Feng, editors, EDM, pages 312–317. International Conference on Educational
Data Mining, Raleigh, 2016.
[22] J.-H. Chang, C.-F. Lai, M.-S. Wang, and T.-Y. Wu. A cloud-based intelligent
tv program recommendation system. In Computers & Electrical Engineering,
volume 39, pages 2379–2399. Elsevier, Tarrytown, 2013.
87

[23] C.-M. Chen, H.-M. Lee, and Y.-H. Chen. Personalized e-learning system using
item response theory. Computers & Education, 44(3):237–255, 2005.
[24] S.-M. Choi, S.-K. Ko, and Y.-S. Han. A movie recommendation algorithm based
on genre correlations. Expert Systems with Applications, 39(9):8079–8085, 2012.
[25] K. Chu, M. Chang, and Y. Hsia. Designing a course recommendation system on
web based on the students course selection records. In D. Lassner and C. Mc-
Naught, editors, World Conference on Educational Multimedia, Hypermedia and
Telecommunications, volume 2003, pages 14–21. Association for the Advance-
ment of Computing in Education (AACE), Honolulu, 2003.
[26] W. M. Chughtai, A. B. Selama, and I. Ghani. Short systematic review on e-
learning recommender systems. Journal of Theoretical & Applied Information
Technology, 57(2), 2013.
[27] V. Chvatal. A greedy heuristic for the set-covering problem. Mathematics of
operations research, 4:233–235, 1979.
[28] T. H. Dao, S. R. Jeong, and H. Ahn. A novel recommendation model of location-
based advertising: Context-aware collaborative filtering using ga approach. Ex-
pert Systems with Applications, 39(3):3731–3739, 2012.
[29] C. Darwin. The origin of species. Dent, 1951.
[30] K. A. De Jong and W. M. Spears. Using genetic algorithms to solve np-complete
problems. In Proceedings of the Third International Conference on Genetic Al-
gorithms, pages 124–132. Morgan Kaufmann, San Francisco, 1989.
88

[31] S. Debnath, N. Ganguly, and P. Mitra. Feature weighting in content based
recommendation system using social network analysis. In Proceedings of the 17th
international conference on World Wide Web, pages 1041–1042. ACM, Beijing,
2008.
[32] A. E. Eiben, J. E. Smith, et al. Introduction to evolutionary computing, vol-
ume 53. Springer, Berlin, 2003.
[33] M. M. El-Bishouty, T.-W. Chang, S. Graf, N.-S. Chen, et al. Smart e-course
recommender based on learning styles. Journal of Computers in Education,
1(1):99–111, 2014.
[34] R. Farzan and P. Brusilovsky. Encouraging user participation in a course recom-
mender system: An impact on user behavior. Computers in Human Behavior,
27(1):276–284, 2011.
[35] U. Fayyad, G. Piatetsky-Shapiro, and P. Smyth. From data mining to knowledge
discovery in databases. In U. M. Fayyad, G. Piatetsky-Shapiro, P. Smyth, and
R. Uthurusamy, editors, AI Magazine, volume 17, pages 1–34. Association for
Computing Machinery, Inc., Menlo Park, 1996.
[36] U. Feige. A threshold of ln n for approximating set cover. Journal of the ACM
(JACM), pages 634–652, 1998.
[37] W. J. Frawley, G. Piatetsky-Shapiro, and C. J. Matheus. Knowledge discovery
in databases: An overview. In N. Lavrac and S. Dzeroski, editors, nductive Logic
Programming: 7th International Workshop, volume 13, page 57. Springer, Berlin,
1992.
89

[38] K. I. Ghauth and N. A. Abdullah. Learning materials recommendation using
good learners ratings and content-based filtering. Educational Technology Re-
search and Development, 58(6):711–727, 2010.
[39] K. I. Ghauth and N. A. Abdullah. Measuring learner’s performance in e-
learning recommender systems. Australasian Journal of Educational Technology,
26(6):764–774, 2010.
[40] K. I. B. Ghauth and N. A. Abdullah. Building an e-learning recommender system
using vector space model and good learners average rating. In Advanced Learn-
ing Technologies, 2009. ICALT 2009. Ninth IEEE International Conference on,
pages 194–196. IEEE, Riga, 2009.
[41] M. Hahsler, B. Gruen, and K. Hornik. arules – A computational environment for
mining association rules and frequent item sets. Journal of Statistical Software,
14(15):1–25, October 2005.
[42] J. Han, J. Pei, and M. Kamber. Data mining: concepts and techniques. Elsevier,
San Francisco, 2011.
[43] J. H. Holland. Adaptation in natural and artificial systems: an introductory
analysis with applications to biology, control, and artificial intelligence. MIT
Press, 1992.
[44] H. Imran, M. Belghis-Zadeh, T.-W. Chang, S. Graf, et al. Plors: a personalized
learning object recommender system. Vietnam Journal of Computer Science,
3(1):3–13, 2016.
90

[45] D. S. Johnson. Approximation algorithms for combinatorial problems. Journal
of computer and system sciences, 9(3):256–278, 1974.
[46] M. Kantardzic. Data mining: concepts, models, methods, and algorithms. John
Wiley & Sons, New York, 2011.
[47] A. M. Kaplan and M. Haenlein. Higher education and the digital revolution:
About moocs, spocs, social media, and the cookie monster. Business Horizons,
59(4):441–450, 2016.
[48] R. M. Karp. Reducibility among combinatorial problems. In Complexity of
computer computations, pages 85–103. Springer, Berlin, 1972.
[49] M. K. Khribi, M. Jemni, and O. Nasraoui. Automatic recommendations for e-
learning personalization based on web usage mining techniques and information
retrieval. In Advanced Learning Technologies, 2008. ICALT’08. Eighth IEEE
International Conference on, pages 241–245. IEEE, Spain, 2008.
[50] X. Li and S.-K. Chang. A personalized e-learning system based on user profile
constructed using information fusion. In A. Guercio and T. Arndt, editors,
In Proceeding of the 11th International Conference on Distributed Multimedia
Systems, volume 2005, pages 109–114. Knowledge Systems Institute, Pittsburgh,
2005.
[51] G. Liang, K. Weining, and L. Junzhou. Courseware recommendation in e-learning
system. In W. Liu, Q. Li, and R. Lau, editors, International Conference on Web-
based Learning, pages 10–24. Springer, Berlin, 2006.
91

[52] C. L. Lim, A. Moffat, and A. Wirth. Lazy and eager approaches for the set
cover problem. In Proceedings of the Thirty-Seventh Australasian Computer Sci-
ence Conference-Volume 147, pages 19–27. Australian Computer Society, Inc.,
Australia, 2014.
[53] F.-j. Liu and B.-j. Shih. Learning activity-based e-learning material recommen-
dation system. In Multimedia Workshops, Ninth IEEE International Symposium,
pages 343–348. IEEE, 2007.
[54] J. Liu, X. Wang, X. Liu, and F. Yang. Analysis and design of personalized
recommendation system for university physical education. In Networking and
Digital Society (ICNDS), 2010 2nd International Conference on, volume 2, pages
472–475. IEEE, Wenzhou, 2010.
[55] J. P. Lucas, N. Luz, M. N. Moreno, R. Anacleto, A. A. Figueiredo, and C. Mar-
tins. A hybrid recommendation approach for a tourism system. Expert Systems
with Applications, 40(9):3532–3550, 2013.
[56] H. Mannila. Data mining: machine learning, statistics, and databases. In Sci-
entific and Statistical Database Systems, 1996. Proceeding, Eighth International
Conference on, pages 2–9. IEEE, Stockholm, 1996.
[57] J. Marshall, H. Greenberg, and P. A. Machun. How would they choose? online
student preferences for advance course information. Open Learning: The Journal
of Open, Distance and e-Learning, 27(3):249–263, 2012.
92

[58] M.-H. Nadimi-Shahraki and M. Bahadorpour. Cold-start problem in collabo-
rative recommender systems: Efficient methods based on ask-to-rate technique.
Journal of Computing and Information Technology, 22(2):105–113, 2014.
[59] S. K. Pal and P. Mitra. Pattern recognition algorithms for data mining. CRC
press, Boca Raton, 2004.
[60] M. Papagelis and D. Plexousakis. Qualitative analysis of user-based and item-
based prediction algorithms for recommendation agents. Engineering Applica-
tions of Artificial Intelligence, 18(7):781–789, 2005.
[61] P. Paranjape-Voditel and U. Deshpande. A stock market portfolio recommender
system based on association rule mining. Applied Soft Computing, 13(2):1055–
1063, 2013.
[62] G. Piatetsky-Shapiro. Discovery, analysis, and presentation of strong rules.
In G. Piatetsky-Shapiro and W. J. Frawley, editors, Knowledge Discovery in
Databases, pages 229–238. AAI/MIT, Menlo Park, 1991.
[63] S. Ray and A. Sharma. A collaborative filtering based approach for recommend-
ing elective courses. In International Conference on Information Intelligence,
Systems, Technology and Management, pages 330–339. Springer, Berlin, 2011.
[64] J. M. Reddy and T. Wang. Online study and recommendation system. ACM,
2014.
[65] P. Resnick and H. R. Varian. Recommender systems. Communications of the
ACM, 40(3):56–58, 1997.
93

[66] C. Romero, S. Ventura, and E. Garcıa. Data mining in course management
systems: Moodle case study and tutorial. Computers & Education, 51(1):368–
384, 2008.
[67] L. Safoury and A. Salah. Exploiting user demographic attributes for solving cold-
start problem in recommender system. Lecture Notes on Software Engineering,
1(3):303, 2013.
[68] G. A. Said, A. M. Mahmoud, and E. M. El-Horbaty. A comparative study
of meta-heuristic algorithms for solving quadratic assignment problem. arXiv
preprint arXiv:1407.4863, 2014.
[69] M. Salehi, M. Pourzaferani, and S. A. Razavi. Hybrid attribute-based recom-
mender system for learning material using genetic algorithm and a multidimen-
sional information model. Egyptian Informatics Journal, 14(1):67–78, 2013.
[70] B. Sarwar, G. Karypis, J. Konstan, and J. Riedl. Item-based collaborative fil-
tering recommendation algorithms. In Proceedings of the 10th international con-
ference on World Wide Web, pages 285–295. ACM, Hong Kong, 2001.
[71] J. B. Schafer, D. Frankowski, J. Herlocker, and S. Sen. Collaborative filtering
recommender systems. In The Adaptive Web, pages 291–324. Springer, 2007.
[72] R. Sivaraj and T. Ravichandran. A review of selection methods in genetic algo-
rithm. International journal of engineering science and technology, 3(5):3792–
3797, 2011.
94

[73] H. Tan, J. Guo, and Y. Li. E-learning recommendation system. In Computer
Science and Software Engineering, 2008 International Conference on, volume 5,
pages 430–433. IEEE, Hubei, 2008.
[74] K. Tang, K. Man, and S. Kwong. A graphical teaching platform for genetic
algorithms. In Industrial Electronics Society, 1999. IECON’99 Proceedings. The
25th Annual Conference of the IEEE, volume 1, pages 116–120. IEEE, San Jose,
1999.
[75] N. Thai-Nghe, L. Drumond, A. Krohn-Grimberghe, and L. Schmidt-Thieme.
Recommender system for predicting student performance. Procedia Computer
Science, 1(2):2811–2819, 2010.
[76] D. Wen-Shung Tai, H.-J. Wu, and P.-H. Li. Effective e-learning recommendation
system based on self-organizing maps and association mining. The Electronic
Library, 26(3):329–344, 2008.
[77] D. White and P. Ligomenides. Gannet: A genetic algorithm for optimizing
topology and weights in neural network design. In J. Mira, J. Cabestany, and
A. Prieto, editors, New Trends in Neural Computation, pages 322–327. Springer,
Spain, 1993.
[78] J. Xu, T. Xing, and M. van der Schaar. Personalized course sequence recom-
mendations. IEEE Transactions on Signal Processing, 64(20):5340–5352, 2016.
[79] O. R. Zaıane. Building a recommender agent for e-learning systems. In Inter-
national Conference on Computers in Education, pages 55–59. IEEE, Auckland,
2002.
95

[80] X. Zhang. Civil engineering professional courses collaborative recommendation
system based on network. In Information Science and Engineering (ICISE),
2009 1st International Conference on, pages 3253–3256. IEEE, Nanjing, 2009.
96