a performance comparison using hpc benchmarks ......a performance comparison using hpc benchmarks:...
TRANSCRIPT
A PERFORMANCE COMPARISON USINGHPC BENCHMARKS: WINDOWS HPC
SERVER 2008 AND RED HAT ENTERPRISE LINUX 5
R. Henschel, S. Teige, H. Li, J. Doleschal , M. S. Mueller
October 2010

Robert Henschel
Contents• HPC at Indiana University• FutureGrid• Benchmarking Setup
• Hardware• Results
• SPEC MPI2007 medium• NSF Acceptance Test Suite• HPCC
• Conclusion

Robert Henschel
HPC at Indiana University
• Indiana University• Founded in 1820• 8 campuses
• Bloomington and Indianapolis• 80,000 students, 7,000 faculty
• HPC systems are operated by Research Technologies of University Information Technology Services
• Open access to graduate students, faculty and staff

Robert Henschel
HPC at Indiana University• IU is one of 11 TeraGrid resource providers

Robert Henschel
HPC at Indiana University• IU hosts the Open Science Grid (OSG) operations center

Robert Henschel
FutureGrid• $15 Mio. NSF Track 2 D award (2009)• Support the research on the future of distributed, grid,
and cloud computing. • Build a robustly managed simulation environment and
testbed to support the development and early use in science of new technologies at all levels of the software stack: from networking to middleware to scientific applications.
• Mimic TeraGrid and/or general parallel and distributed systems.
• FutureGrid is a (small 5600 core) Science Cloud but it is more accurately a virtual machine based simulation environment.

Robert Henschel
FutureGrid

Robert Henschel
Benchmarking Setup
• SPEC MPI2007 medium• NSF Acceptance Test Suite• HPCC
• Windows HPC Server 2008• RedHat Enterprise Linux 5.4
• IBM System x iDataPlex dx340 cluster
• Intel Compiler Version 11.1 (incl. MKL)• OpenMPI 1.3.1 / MS MPI 2008

Robert Henschel
Hardware• IBM System x iDataPlex dx340
– 84 nodes– 64 used for benchmarking
• Intel Xeon L5420 at 2.5 GHz• 32 GByte of memory per node• Mellanox MT26418 DDR Infiniband• Cisco SFS 7024D switch

Robert Henschel
Benchmarks• SPEC MPI2007 (medium)• NSF Acceptance Test Suite• HPCC

Robert Henschel
SPEC MPIM2007• Developed by the SPEC High Performance Group• Includes 13 MPI parallel applications
• Computational fluid dynamics, molecular dynamics Electromagnetism, geophysics, ray tracing, and hydrodynamics
• Version 1.1, released October 2008• Results were published on the SPEC website, after
having been reviewed by the HPG• http://www.spec.org/mpi2007/results/res2010q1/
• First published results running SPEC MPIM2007 on Windows (HPC Server 2008)

Robert Henschel
SPEC MPIM2007• Overall performance
32 64 128 256 5120
5
10
15
20
25
30
SPEC MPIM2007 Score from 32 to 512 Cores
WinHPC RHEL5
Cores
SP
EC
MP
IM2
00
7 S
core

Robert Henschel
SPEC MPIM2007• No Difference in performance, 6 applications
32 64 128 256 5120
10
20
30
40
50
60
SPEC MPIM2007 Score for TACHYON
WinHPC RHEL5
Cores
SP
EC
MP
IM2
00
7 S
core

Robert Henschel
SPEC MPIM2007• RHEL5 outperforms WinHPC in 5 applications
32 64 128 256 5120
5
10
15
20
25
SPEC MPIM2007 Score for SOCORRO
WinHPC RHEL5
Cores
SP
EC
MP
IM2
00
7 S
core

Robert Henschel
SPEC MPIM2007• RHEL5 outperforms WinHPC in 5 applications
32 64 128 256 5120
5
10
15
20
25
SPEC MPIM2007 Score for SOCORRO
WinHPC RHEL5
Cores
SP
EC
MP
IM2
00
7 S
core
32 64 128 256 5120
10
20
30
40
50
60
70
SPEC MPIM2007 Score for FDS4
WinHPC RHEL5
Cores
SP
EC
MP
IM2
00
7 S
core

Robert Henschel
SPEC MPIM2007• RHEL5 outperforms WinHPC in 5 applications
32 64 128 256 5120
5
10
15
20
25
SPEC MPIM2007 Score for SOCORRO
WinHPC RHEL5
Cores
SP
EC
MP
IM2
00
7 S
core
32 64 128 256 5120
10
20
30
40
50
60
70
SPEC MPIM2007 Score for FDS4
WinHPC RHEL5
Cores
SP
EC
MP
IM2
00
7 S
core
32 64 128 256 5120
2
4
6
8
10
12
SPEC MPIM2007 Score for POP2
WinHPC RHEL5
Cores
SP
EC
MP
IM2
00
7 S
core

Robert Henschel
SPEC MPIM2007• WinHPC outperforms RHEL5 in 2 applications
32 64 128 256 5120
10
20
30
40
50
60
SPEC MPIM2007 Score for WRF
WinHPC RHEL5
Cores
SP
EC
MP
IM2
00
7 S
core

Robert Henschel
SPEC MPIM2007• WinHPC outperforms RHEL5 in 2 applications
32 64 128 256 5120
10
20
30
40
50
60
SPEC MPIM2007 Score for WRF
WinHPC RHEL5
Cores
SP
EC
MP
IM2
00
7 S
core
32 64 128 256 5120
5
10
15
20
25
30
SPEC MPIM2007 Score for LESLIE3D
WinHPC RHEL5
Cores
SP
EC
MP
IM2
00
7 S
core

Robert Henschel
NSF Acceptance Test Suite• NSF Track 2 program
• Sun constellation at TACC, Cray XT5 at University of Tennessee, FutureGrid
• Benchmarking Information Referenced in NSF 05-625 “High Performance Computing System Acquisition: Towards a Petascale Computing Environment for Science and Engineering” (2005)• http://www.nsf.gov/pubs/2006/nsf0605/nsf0605.jsp
• Initially comprised of HPCC, 6 applications, SPIOBENCH• Now, just HPCC and 4 applications
• PARATEC, HOMME, MILC, WRF

Robert Henschel
NSF Acceptance Test Suite• MILC, PARATEC, HOMME• WRF not included
32 64 128 256 5120
0.2
0.4
0.6
0.8
1
1.2
Ratio of WinHPC to RHEL
RHEL MILC Medium WinHPC
MILC Large WinHPC
PARATEC WinHPC
HOMME WinHPC
Cores
Ra
tio

Robert Henschel
HPCC• Innovative Computing Laboratory at the University of
Tennessee• Version 3.1.3• 3 categories:
– Floating Point– Memory– Interconnect

Robert Henschel
HPCC• Floating point tests (HPL, G-FFT)
8 16 32 64 128 256 5120
0.2
0.4
0.6
0.8
1
1.2
Ratio of WinHPC to RHEL
RHEL HPL WinHPC GFFT WinHPC
Cores
Ra
tio
Robert Henschel
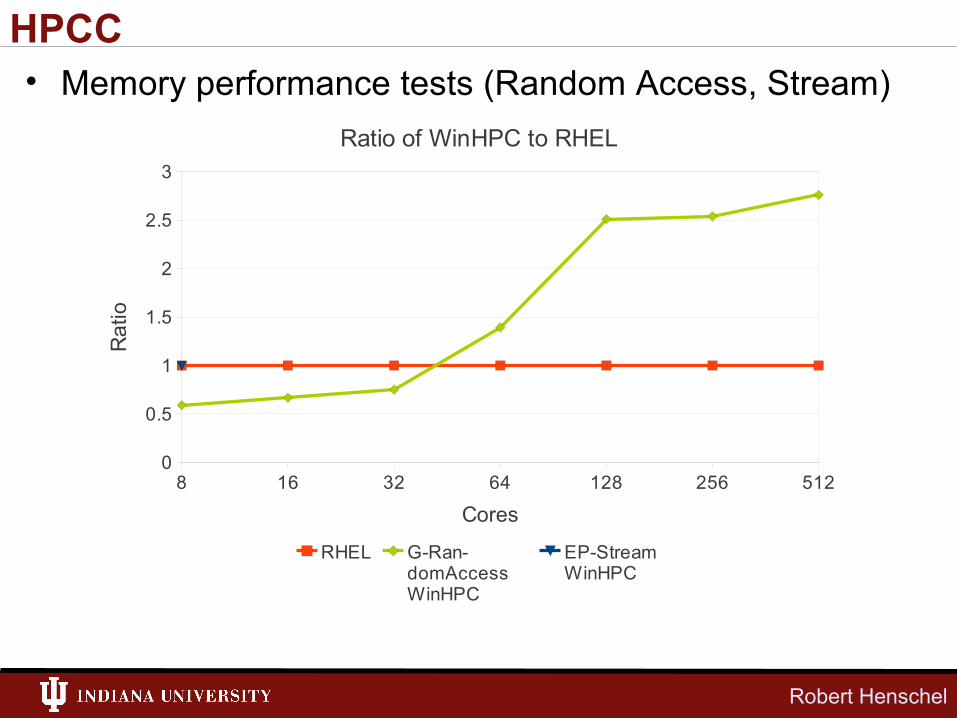
HPCC• Memory performance tests (Random Access, Stream)
8 16 32 64 128 256 5120
0.5
1
1.5
2
2.5
3
Ratio of WinHPC to RHEL
RHEL G-Ran-domAccess WinHPC
EP-Stream WinHPC
Cores
Ra
tio

Robert Henschel
HPCC• Interconnect performance tests (G-PTRANS, RR-
Bandwidth and Latency)
8 16 32 64 128 256 5120
0.2
0.4
0.6
0.8
1
1.2
1.4
1.6
1.8
2
Ratio of WinHPC to RHEL
RHEL G-PTRANS WinHPC
RR-Bandwidth WinHPC
RR-Latency WinHPC
Cores
Ra
tio

Robert Henschel
Conclusion• Overall performance of WinHPC and RHEL5 is almost
identical• Certain applications scale better on RHEL5 than on
WinHPC for larger core counts, while they perform very similar on smaller core counts
• When applications scale better on WinHPC, they do so across all core counts
• Building and running the benchmarks is more challenging on WinHPC

Robert Henschel
AcknowledgementsThis document was developed with support from the National Science Foundation (NSF) under Grant No. 0910812 to Indiana University for "FutureGrid: An Experimental, High-Performance Grid Test-bed." Any opinions, findings, and conclusions or recommendations expressed in this material are those of the author(s) and do not necessarily reflect the views of the NSF.
This material is based upon work supported by the National Science Foundation under Grants No. ACI-0338618l, OCI-0451237, OCI-0535258, OCI-0504075, OCI-0910812 and CNS-0521433.
This research was supported in part by the Indiana METACyt Initiative. The Indiana METACyt Initiative of Indiana University is supported in part by Lilly Endowment, Inc.

Robert Henschel
Thank You
Questions?