a paradox between preoperative overweight/obesity and
TRANSCRIPT

lable at ScienceDirect
Clinical Nutrition xxx (xxxx) xxx
Contents lists avai
Clinical Nutrition
journal homepage: http: / /www.elsevier .com/locate/c lnu
Original article
A paradox between preoperative overweight/obesity and change inweight during postoperative chemotherapy and its relationship tosurvival in stage II and III colorectal cancer patients
Chunlei Hu a, g, 1, Qi Zhang a, 1, Xinghan Jin b, Lin Zhang c, Yiming Zhang d, Qiankun Zhu a,Meng Tang a, Guoqing Lyv g, 2, **, Hanping Shi a, e, f, 2, *
a Department of Gastrointestinal Surgery, Department of Clinical Nutrition, Beijing Shijitan Hospital, Capital Medical University, Beijing, 100038, Chinab Center for Digestive Disease, The Seventh Affiliated Hospital of Sun Yat-sen University, Shenzhen, 518035, Chinac Clinical Laboratory, Peking Union Medical College Hospital, Chinese Academy of Medical Science & Peking Union Medical College, Beijing, 100730, Chinad Department of Breast and Thyroid Surgery, Peking University Shenzhen Hospital, Shenzhen, 518107, Chinae Department of Oncology, Capital Medical University, Beijing, 100038, Chinaf Beijing International Science and Technology Cooperation Base for Cancer Metabolism and Nutrition, Beijing, 100038, Chinag Department of Gastrointestinal Surgery, Peking University Shenzhen Hospital, Shenzhen Peking University, The Hong Kong University of Science andTechnology Medical Center, Shenzhen, 518035, China
a r t i c l e i n f o
Article history:Received 22 June 2020Accepted 21 October 2020
Keywords:Colorectal cancerObesity paradoxDisease-free survivalOverall survival
* Corresponding author. Department of GastrointesClinical Nutrition, Beijing Shijitan Hospital, CapitalRoad, Yangfangdian Haidian District, Beijing 100038, C** Corresponding author.
E-mail addresses: [email protected] (G. Lyv), sh1 These authors contributed equally to this work.2 These authors contributed equally to this work.
https://doi.org/10.1016/j.clnu.2020.10.0390261-5614/© 2020 Elsevier Ltd and European Society
Please cite this article as: C. Hu, Q. Zhang,postoperative chemotherapy and its relatio10.1016/j.clnu.2020.10.039
s u m m a r y
Background & aims: The roles of obesity and weight management in colorectal cancer (CRC) recurrenceand survival have gained a considerable amount of attention. However, whether a change in weightaffects the risk of recurrence and death remains unclear.Methods: A retrospective study was conducted using KaplaneMeier curves, multivariable Cox propor-tional hazards models, and restricted cubic splines in 902 patients with stage II and III CRC to investigatethe impact of the preoperative BMI and change in weight during postoperative chemotherapy ondisease-free survival (DFS) and overall survival (OS).Results: The lowest risk of cancer events (recurrence/metastasis and new CRC cases) and death occurredin patients who had a normal weight (BMI range from 18.5 to 23.9 kg/m2) or had weight gain of < 5%; thepatients who were underweight (BMI � 18.5 kg/m2) or overweight/obese (BMI � 24.0 kg/m2) and hadweight loss or weight gain of � 5% had a higher risk of cancer events and death. The association betweenpreoperative BMI and the risk of cancer events and death exhibited U-shaped curves; the inflectionpoints were at BMI ¼ 24 kg/m2 and BMI ¼ 25 kg/m2 for the risk of cancer events and death, respectively.The association between the change in weight and risk of death also exhibited a U-shaped curve, whilethe association between the change in weight and risk of cancer events was nearly linear. MultivariableCox proportional hazards models showed that the preoperative BMI and change in weight playedbidirectional roles in both the OS and DFS.Conclusions: An obesity paradox exists in patients with CRC, with both weight loss and excessive weightgain being detrimental. Patients with CRC may require a reasonable weight management program, andgaining < 5% of the preoperative weight might be an appropriate goal at 6 months after surgery.
© 2020 Elsevier Ltd and European Society for Clinical Nutrition and Metabolism. All rights reserved.
tinal Surgery, Department ofMedical University, 10 Tieyihina. Fax: þ86 10 6392 6325.
[email protected] (H. Shi).
for Clinical Nutrition and Metabo
X. Jin et al., A paradox betwnship to survival in stage II
1. Introduction
A low body mass index (BMI) and weight loss have been widelyconfirmed to be associated with a poor prognosis [1,2]. Thus, it istraditionally believed that a high BMI andweight gain lead to betteroutcomes [3] since a higher body weight provides more nutritionalreserves to counteract the negative metabolic consequences ofcancer and anticancer treatments [4]. However, emerging evidence
lism. All rights reserved.
een preoperative overweight/obesity and change in weight duringand III colorectal cancer patients, Clinical Nutrition, https://doi.org/

C. Hu, Q. Zhang, X. Jin et al. Clinical Nutrition xxx (xxxx) xxx
indicates that obesity is associated with a higher risk of tumorrecurrence and death [5e7], and there is an obesity paradox incancer patients [6e8]. Many leading cancer research organizationsare beginning to pay attention to the ‘role of obesity in cancersurvival and recurrence’ [9e12] and are trying to provide weightmanagement recommendations for cancer survivors. However,whether weight gain or loss has an impact on the risk of recurrenceand survival remains unclear. Most of the previous research hasevaluated only the relationships between the baseline BMI and riskof recurrence and death, and few studies have evaluated the as-sociation of the change in weight after diagnosis with the risk ofcancer recurrence and death.
Colorectal cancer (CRC) is one of the cancers that are moststrongly associated with obesity [13]. There is substantial evidenceconfirming that obesity can increase the risk of CRC recurrence anddeath [14]. However, most of these lines of evidence originatedfrom Western countries, where the incidence rates of both obesityand CRC are quite high [15,16]. The incidence rates of obesity andCRC have historically been low in Asian countries, including China[17]. However, with the rapid development of economy andpopularity of a Western lifestyle, overweight/obese is becoming aserious public health problem in China, especially in urban pop-ulations [18]. Regarding the link between obesity and CRC, theincidence of CRC in China has increased by more than two times inthe past three decades, and both the incidence and mortality ratesrelated to CRC in large urban populations are nearly 2 times higherthan those in rural populations [19]. The evidence originated fromWestern countries showed that the BMI cut-off point used fordetermining the risk of death was approximately 35 kg/m2 [15,16].However, a systematic review of 56 observational studies foundthat the risk of CRC increased sharply in Asians when the BMIexceeded 23 kg/m2 due to the differences in body composition (BC)between Asian and Western populations [20]. Nevertheless, fewstudies have focused on the association of obesity with the risk ofrecurrence of and death related to CRC in Asians, including Chineseindividuals.
Thus, whether the obesity paradox exists in the Chinese popu-lation and what themost appropriate BMI cut-off point(s) is remainunclear. We conducted this retrospective observational study toevaluate the relationships among the preoperative BMI, change inweight during postoperative chemotherapy and the risk of recur-rence and death in patients with stage II-III CRC.
2. Patients and methods
2.1. Study population and design
In this study, a retrospective analysis of 902 patients with CRCwho underwent radical colectomy at Peking University ShenzhenHospital (Shenzhen, China) from January 2012 to December 2017was conducted, with approval from the Human Research EthicsCommittee of Peking University Shenzhen Hospital. The enrolledpatients met the following inclusion criteria: 1) were aged � 18years; 2) had an American Society of Anesthesiologists (ASA) scoreof� 3; 3) did not undergo antitumor therapy before surgery; 4) hadconfirmed cases of stage II or III CRC and was considered to haverisk factors that warranted first-line standard postoperative adju-vant chemotherapy regimens based on a postoperative pathologyevaluation; 5) had complete medical records before and after sur-gery, including surgical records, follow-up data, and postoperativechemotherapy records; and 6) had returned to our hospital for apostoperative review within 6 months after surgery. The exclusioncriteria were as follows: 1) patients with stage I CRC, who did notneed postoperative chemotherapy; 2) patients with stage Ⅳ CRC,who had significant differences in tumor-bearing conditions and
2
anti-tumor treatments; 3) a history of emergency surgery, palliativesurgery or combined organ resection; 4) a history of reoperation ora hospital stay longer than 3 weeks due to severe postoperativecomplications such as an intestinal fistula, bleeding, and abdominalinfection; 5) a history of incomplete postoperative chemotherapyor any dose or course change in chemotherapy due to severecomplications or other reasons; 6) livermetastasis within the past 6months, as the presence of undiscovered simultaneous livermetastasis before surgery could not be excluded; 7) death within 6months after surgery due to severe complications or other reasons;8) death by an accident or suicide; and 9) newly discovered tumorsother than CRC during the follow-up.
2.2. Clinical data
The data extracted from the inpatient and outpatient recordsincluded demographic data (age, sex, height, weight, BMI, andcomorbidities), tumor-specific data [tumor differentiation, location,size, and tumor, node, metastasis (TNM) stage], surgery data [sur-gical methods, anastomotic methods, number of lymph nodesretrieved, number of metastatic lymph nodes, and severe post-operative complications (within 30 days after surgery)], post-operative chemotherapy data (doses, courses and severecomplications), and survival data.
The tumor stage, type of surgical resection and extent of lymphnode dissection were determined according to the Chinese CRCtreatment guidelines [21]. Postoperative complications wereassessed using the ClavieneDindo classification, with severe com-plications being defined as grade III or higher [22]. Comorbiditieswere assessed using the Charlson comorbidity index (CCI) [23].Metabolic syndrome (MS) components [24], such as diabetes, hy-pertension, cardio-cerebro-vascular diseases, hyperlipidemia andfatty liver, were also recorded, and the patients were divided intotwo groups: patients with MS components and patients withoutMS components.
BMI was calculated by the following formula: BMI (kg/m2) ¼weight (kg)/height (m)2, and patients were divided into fourgroups according to the standards of theWorking Group on Obesityin China (WGOC): underweight, BMI � 18.5 kg/m2; normal weight,18.5e23.9 kg/m2; overweight, 24.0e27.9 kg/m2; and obese, BMI �28.0 kg/m2 [25]. Our analysis revealed that the results in theoverweight and obese categories were consistent, so we combinethe overweight and obese categories into one group for simplicityin the subsequent analysis. Thus, the patients were divided intothree groups based on their BMI values: underweight, normalweight and overweight/obese.
The preoperative weight and postoperative weight when pa-tients returned to the hospital for review after postoperativechemotherapy (approximately 6 months after surgery) wereretrieved from the medical records. The percentage of change inweight was calculated by the following formula: [(postoperativeweight - preoperative weight) ÷ preoperative weight] � 100%,where negative values indicated weight loss and positive valuesindicated weight gain. The patients were divided into four groupsaccording to the degree of change in weight: weight gain � 5%,maintained weight or weight gain < 5%, weight loss < 5% andweight loss � 5%.
2.3. Follow-up
All patients were followed up via inpatient medical visits andtelephone interviews. Mortality data, including the time and causeof death, were retrieved for all patients. Overall survival (OS) wasdefined as the interval between the date of surgery and the date ofdeath. Cancer events (tumor recurrence/metastasis and new CRC

C. Hu, Q. Zhang, X. Jin et al. Clinical Nutrition xxx (xxxx) xxx
cases in the other colorectal segments) were recorded. However,patients who developed liver metastasis within 6 months wereexcluded since the presence of undiscovered simultaneous livermetastasis before surgery could not be excluded. Disease-freesurvival (DFS) was defined as the interval between the date ofsurgery and the date of the cancer events.
2.4. Statistical analysis
Statistical analyses were performed with SPSS 19.0, the R pro-gramming language 2.15.2 and Stata 14.2 SE. The KolmogoroveSmirnov test was used to evaluate the normality of the data for thevariables. The data are expressed as the mean values (± standarddeviations) or medians (interquartile ranges), depending on thenormality of the data for the variables. The data for different vari-ables were compared among groups using ANOVA or theKruskaleWallis test, depending on the normality of the data for thevariables. Chi-squared tests were used for categorical variables.Survival curves were estimated using the KaplaneMeiermethod andanalyzed using the log-rank test. Univariate Cox proportional haz-ards models of all potential baseline predictors, including sex (menvs women), age, preoperative BMI, change in weight, MS compo-nents, CCI, tumor stage, ASA score, type of surgery (open operation vslaparoscopic operation), histological differentiation (high vs moder-ate vs low differentiation) and histopathological type (tubularadenocarcinoma vs villoglandular, adenocarcinoma vs villousadenocarcinoma), were constructed to compute the hazard ratios(HRs) with their 95% confidence intervals (CIs). Multivariable Coxproportional hazards models were formulated using variables thathad significant results in the univariate models. The proportionalhazards assumption was verified using the methods published byGrambsch and Therneau [26]. The continuous variables (preopera-tive BMI and change in weight) were modeled using restricted cubicsplines to assess the possible nonlinearity of their effects and toselect the appropriate degrees of freedom for subsequent modeling.For each variable and endpoint, three automatically selected knotsper model were initially used, with additional knots added asnecessitated by visual inspection of the spline plots and formal sig-nificance tests. To determine whether the effects of any covariableswere dependent on other covariables, partial interaction tests wereperformed for each variable in the multivariable model, where astatistically significant partial interaction prompted the explorationof its pairwise component interactions. Pairwise interactions werethen included in the final models if statistically significant results,according to a likelihood ratio test, were found for both members ofthe pair. The final models were comprised of all relevant main effectsand pairwise interactions, and the fitted models were subsequentlyused to construct both visual nomograms and onlineweb calculatorsfor the 3-year DFS and 5-year OS probabilities. The final models usedfor predicting DFS and OSwere validated using bootstrapping so thatoptimism-corrected discrimination could be performed via theconcordance index for the survival data; in addition, calibration plotswere generated to compare the survival data with the tumor stage.Risk discrimination for the DFS and OS was also performed for themodels. Statistical significance was established at P < 0.05 (2-sided).
3. Results
3.1. Demographics and disease characteristics of the patients
A total of 1590 patients with stage II or III CRC underwent radicalcolectomy in our hospital during the study period. Finally, 902subjects met the inclusion criteria. There were 527 males and 375females, 217 patients with stage II CRC and 685 patients with stageIII CRC, and the mean patient age was 53.7 ± 13.6 years. The
3
demographic characteristics according to the BMI groups are listedin Table 1.
Preoperatively, 11.3% (n ¼ 102) of the patients were under-weight, 57.9% (n ¼ 522) were normal weight, 22.8% (n ¼ 206) wereoverweight and 8.0% (n¼ 72) were obese. A total of 59.1% (n¼ 533)of the patients experienced weight loss, and 40.9% (n ¼ 369)maintained their bodyweight or experiencedweight gain, butmostpatients experienced weight loss or weight gain within 5% of thepreoperative weight. The patients with stage III CRC had a lowerBMI and lost more weight than did the patients with stage II CRC.The patients whowere overweight/obese lost the most weight, andthe average percentage change in weight values were0.19 ± 5.32%,�1.63 ± 5.62% and�3.27 ± 5.56% for the underweight,normal weight, and overweight/obese groups, respectively. Therewere 344 (38.1%) patients who had MS components. The patientswho had MS components had higher rates of overweight/obese(42.2% vs 23.8%) and lost more weight (�2.87 ± 5.55vs �1.35 ± 5.66) than did those without MS components.
3.2. Analysis of survival differences across groups of patients
During the follow-up period, 488 (54.1%) patients had cancerevents (482 had tumor recurrence/metastasis, 6 had new CRC casesin the other colorectal segments), according to the imaging exam-ination, and 174 (19.3%) patients died. Seventy-seven (8.54%) alivepatients had only outpatient medical records or oral informationconfirmed no cancer events, and lacked evidence of imaging ex-amination for more than 1 year from the last follow-up. In order toavoid the undetected cancer events, these patients were notincluded in subsequent analyses. The median follow-up time for OSwas 44 months (range, 19e86 months), and for DFS was 35 months(range, 9e65 months). Thus, we chose to additionally analyze the3-year DFS and 5-year OS rates. The estimated 3-year DFS and 5-year OS rates among all patients were 62.36% and 68.44%, respec-tively. In the patients who were underweight, had a normal weightand were overweight/obese, the 3-year DFS rates were 40.90%,69.58%, and 57.69%, respectively; the 5-year OS rates were 36.01%,77.38%, and 66.44%, respectively. However, an increased risk ofcancer events and death were present in only patients with MScomponents. Based on the change in weight, the 3-year DFS rateswere 37.02%, 57.03%, 86.32% and 79.28% in patients who hadweightloss� 5%, weight loss < 5%, weight gain < 5% and weight gain� 5%,respectively, and the 5-year OS rates were 46.44%, 64.63%, 83.81%and 78.99%, respectively. There were no significant differences inthe 3-year DFS (P ¼ 0.108) or 5-year OS (P ¼ 0.122) between pa-tients with weight gain � 5% and weight gain < 5% (Fig. 1).
3.3. The restricted cubic spline models
In the overall sample, the association between the preoperativeBMI and both the risk of cancer events and risk of death exhibitedU-shaped curves. The inflection point was at 24 kg/m2 for the risk ofcancer events and 25 kg/m2 for the risk of death. The associationbetween the change in weight and risk of cancer events was nearlylinear. The association between the change in weight and risk ofdeath exhibited a U-shaped curve, and the inflection point was 3%.In the subgroup analysis, the association between the preoperativeBMI and risk of cancer events exhibited a J-shaped curve in patientswith stage II CRC, and the inflection point was at 24 kg/m2; itexhibited a U-shaped curve in patients with stage III CRC, and theinflection point was at 24 kg/m2. The association between thechange in weight and risk of death exhibited a U-shaped curve inpatients with stage II CRC, and the inflection point was 0%; itexhibited an L-shaped curve in patients with stage III CRC, and theinflection point was at 1% (Fig. 2).

Table 1Demographics and disease characteristics of the patients.
Underweight Normal weight Overweight/Obese P value
Numbers, n 102 522 278Ages, x ± s, y 47.43 ± 14.97 54.18 ± 13.7 55.12 ± 12.37 <0.001d
Sex, n/%females 82/80.4% 222/42.5% 71/25.5% <0.001f
males 20/19.6% 300/57.5% 207/74.5%BMI, x ± s, kg/m2 17.75 ± 0.51 21.59 ± 1.51 26.7 ± 2.09 <0.001d
Change in weight, x ± s, ratio 0.19 ± 5.32 �1.63 ± 5.62 �3.27 ± 5.56 <0.001d
CCI, median (IQR), score 2 (2/4) 4 (2/5) 4 (2/5) <0.001e
MS, n/%yes 16/15.7% 183/35.1% 145/52.2% <0.001f
no 86/84.3% 339/64.9% 133/47.8%MS components, n/%fatty liver 2/2.0% 14/2.7% 16/5.8%cardio-cerebro-vascular diseases 4/3.9% 13/2.5% 15/5.4%hypertension 4/3.9% 48/9.2% 42/15.1%hyperlipidemia 2/2.0% 61/11.7% 44/15.8%diabetes 7/6.9% 69/13.2% 56/20.1%
ASA, median (IQR), score 1 (1/2) 1 (1/2) 2 (1/2) <0.001e
Tumor stage, n/%II 17/16.7% 124/23.8% 76/27.3% 0.095f
III 85/83.3% 398/76.2% 202/72.7%Survival status, n/%alive 62/60.8% 452/86.6% 214/77% <0.001f
dead 40/39.2% 70/13.4% 64/23%aCancer events, n/%no 23/22.6% 230/44.1% 84/30.2% <0.001f
yes 76/74.5% 246/47.1% 166/59.7%uncertain 3/2.9% 46/8.8% 28/10.1%
Tumor site, n/%left colon 65/63.7% 225/44.1% 83/29.9% <0.001f
right colon 37/36.3% 285/55.9% 195/70.1%bDegree of differentiation, n/%high 14/13.7% 96/18.4% 66/23.7% 0.013g
moderate 84/82.4% 367/70.3% 174/62.6%low 4/3.9% 51/9.8% 38/13.7%undetermined 0/0% 8/1.5% 0/0%
cHistopathological type, n/%TA 12/11.8% 30/5.7% 29/10.4% 0.031g
VGA 69/67.6% 334/64.0% 168/60.4%VA 21/20.6% 153/29.3% 81/29.1%special types 0/0% 5/1% 0/0%
Surgical approach, n/%laparoscopic operation 69/67.6% 265/50.8% 105/37.8% <0.001f
open operation 33/32.4% 257/49.2% 173/62.2%
BMI: body mass index; x ± s: mean value (± standard deviation); IQR: interquartile range; Change in weight was calculated by the following formula: [(postoperative weight -preoperative weight) ÷ preoperative weight] � 100%, where the negative values indicate weight loss and positive values indicate weight gain; CCI: Charlson comorbidityindex; MS: metabolic syndrome, the total frequency of MS components were more than the numbers of patients with MS, since some patients had multiple MS components;ASA: American Society of Anesthesiologists; TA: tubular adenocarcinoma; VGA: villoglandular adenocarcinoma; VA: villous adenocarcinoma.
a There were 3, 46 and 28 patients in underweight, normal weight and overweight/obese group respectively who's cancer events were uncertain.b The degree of differentiation were undetermined in 8 patients in normal weight group.c There were 5 patients with special pathological types of CRC in normal weight group.d ANOVA test.e KruskaleWallis test.f Chi square test.g Fisher exact test.
C. Hu, Q. Zhang, X. Jin et al. Clinical Nutrition xxx (xxxx) xxx
3.4. Analysis of prognostic factors for the patients
The univariate analysis showed that age, preoperative BMI,change in weight, tumor stage, CCI, and histopathological typewere significantly related to poorer 3-year DFS and 5-year OSrates (P < 0.05), while the sex, ASA score, tumor site and surgicalapproach were not associated with either the 3-year DFS or 5-yearOS. The CCI is composed of an age score and complication score(most of the complications are MS components). Thus, weincluded the CCI as a combined factor of age and MS componentsin the final model for simplicity in the modeling and prognosticevaluation. By default, for Cox proportional hazards models,continuous variable is considered to have a linear trend, whereasthe results of the KaplaneMeier and restricted cubic spline model
4
analyses suggested that the preoperative BMI and change inweight might have bidirectional roles. Therefore, we includedboth BMI and change in weight as classification variables in thefinal models.
The significant factors in the multivariable models wereidentified by the examination of spline plots and HRs acrosssubgroups for continuous and categorical variables, respectively.The final multivariable models and corresponding nomograms forOS and DFS are presented in Figs. 3 and 4, respectively. The rela-tive importance of the variables can be easily inferred from Figs. 3and 4; for example, the CCI had the largest impact on the OS andDFS risk, followed by the change in weight, preoperative BMI andtumor stage, while the histopathological type had the smallestimpact.
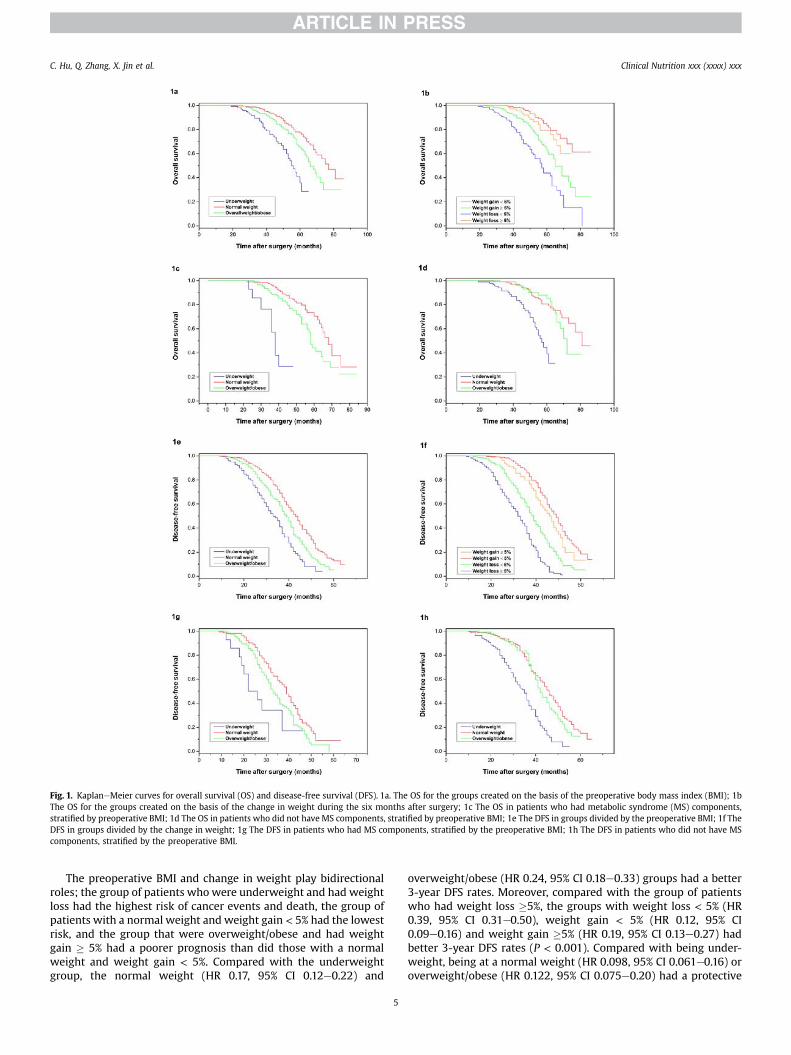
Fig. 1. KaplaneMeier curves for overall survival (OS) and disease-free survival (DFS). 1a. The OS for the groups created on the basis of the preoperative body mass index (BMI); 1bThe OS for the groups created on the basis of the change in weight during the six months after surgery; 1c The OS in patients who had metabolic syndrome (MS) components,stratified by preoperative BMI; 1d The OS in patients who did not have MS components, stratified by preoperative BMI; 1e The DFS in groups divided by the preoperative BMI; 1f TheDFS in groups divided by the change in weight; 1g The DFS in patients who had MS components, stratified by the preoperative BMI; 1h The DFS in patients who did not have MScomponents, stratified by the preoperative BMI.
C. Hu, Q. Zhang, X. Jin et al. Clinical Nutrition xxx (xxxx) xxx
The preoperative BMI and change in weight play bidirectionalroles; the group of patients whowere underweight and had weightloss had the highest risk of cancer events and death, the group ofpatients with a normal weight and weight gain < 5% had the lowestrisk, and the group that were overweight/obese and had weightgain � 5% had a poorer prognosis than did those with a normalweight and weight gain < 5%. Compared with the underweightgroup, the normal weight (HR 0.17, 95% CI 0.12e0.22) and
5
overweight/obese (HR 0.24, 95% CI 0.18e0.33) groups had a better3-year DFS rates. Moreover, compared with the group of patientswho had weight loss �5%, the groups with weight loss < 5% (HR0.39, 95% CI 0.31e0.50), weight gain < 5% (HR 0.12, 95% CI0.09e0.16) and weight gain �5% (HR 0.19, 95% CI 0.13e0.27) hadbetter 3-year DFS rates (P < 0.001). Compared with being under-weight, being at a normal weight (HR 0.098, 95% CI 0.061e0.16) oroverweight/obese (HR 0.122, 95% CI 0.075e0.20) had a protective

Fig. 2. Risk of death (on the log hazard ratio scale, y-axis) as a function of (A) the preoperative body mass index (BMI) and (C) change in weight. The risk of cancer events as afunction of (B) the preoperative BMI and (D) change in weight. The risk of death as a function of (E and F) the change in weight in patients with stage II and III CRC. The risk ofrecurrence as a function of (G and H) the preoperative BMI in patients with stage II and III CRC. Solid line ¼ risk function. Dashed lines ¼ 95% confidence bands for the risk function.
C. Hu, Q. Zhang, X. Jin et al. Clinical Nutrition xxx (xxxx) xxx
effect; compared with the group of patients who had weightloss � 5%, the groups with weight loss < 5% (HR 0.336, 95% CI0.228e0.50), weight gain < 5% (HR 0.093, 95% CI 0.054e0.16) andweight gain �5% (HR 0.181, 95% CI 0.099e0.33) had better 5-yearOS rates.
3.5. Predictive value according to our final multivariable model
The concordance index values of C for DFS and OS according toour final model were 0.822 (range, 0.803e0.840) and 0.845 (range,0.817e0.874), respectively. Thus, our final model had high predic-tive ability (Fig. 5).
6
4. Discussion
Our study found that an obesity paradox exists in Chinese pa-tients with CRC, the association between the preoperative BMI andboth the risk of cancer events and death exhibit U-shaped curves,and the individuals who have a normal weight have the mostfavorable DFS and OS rates. There are many possible explanationsfor the obesity paradox.
Emerging evidence suggests that excessive adipose tissue leadsto the excessive release of free fatty acids and the secretion ofadipocytokines and proinflammatory cytokines, which lead to in-sulin resistance (IR) and systemic inflammatory response

Fig. 3. A nomogram for overall survival (OS). An example patient's predictions may be obtained from a single nomogram as follows. First, the risk points associated with eachvariable are obtained via the vertical translation of the patient's variable value (e.g., the ‘change in weight’) to the scale labeled ‘Points’ in the nomogram (i.e., weight loss ¼ �2contributes 60 points to OS risk). Next, the points associated with each variable value for the patient are totaled across all variables. This total is located on the scale ‘Total Points’(e.g., 140 for OS) and then vertically mapped to obtain the prediction of interest (i.e., five-year OS probability of 10%). BMI: body mass index: underweight (0 points), normal weight(1 point), overweight/obese (2 points); change in weight: weight loss � 5% (�2 points), weight loss < 5% (�1 point), weight gain < 5% (1 point) and weight gain � 5% (2 points);tumor stage: stage IIA (1 point), IIB (2 points), IIIA (3 points), IIIB (4 points), IIIC (5 points); CCI: Charlson comorbidity index; histopathological type: tubular adenocarcinoma (0points), villoglandular adenocarcinoma (1 point), villous adenocarcinoma (2 points); OS: overall survival.
C. Hu, Q. Zhang, X. Jin et al. Clinical Nutrition xxx (xxxx) xxx
syndrome (SIRS); these conditions have been widely indicated tostimulate cancer cell growth, invasion and metastasis [27e29].Thus, fat mass may play a bidirectional role in cancer patients[30e32]. An appropriate level of fat mass can provide necessarynutritional reserves, while excessive adipose tissue may promotecancer recurrence and death [33]. Patients who have a normalweight are more likely to have adequate muscle and fat masses;thus, they have the most favorable outcomes. Patients who areoverweight and obese might have an increased risk of recurrenceand death because they have an excessively high fat mass [2,33].Furthermore, many studies have demonstrated that IR and SIRS arethe co-mechanisms between obesity and an increased risk of MSand cancer [34]. Of note, Yamaji et al. found that the associationbetween obesity and an increased risk of CRC was present in only
Fig. 4. A nomogram for disease-free survival (DFS). The nomogram is used as described inpoint), overweight/obese (2 points); change in weight: weight loss � 5% (�2 points), weightstage: stage IIA (1 point), IIB (2 points), IIIA (3 points), IIIB (4 points), IIIC (5 points); CCI: Chvilloglandular adenocarcinoma (1 point), villous adenocarcinoma (2 points); DFS: disease-f
7
subjects who had obesity-related MS, suggesting that metabolicabnormalities may play a crucial role in the risk of CRC [35]. Wefound similar results showing that an increased risk of cancerevents and death were present in only patients with MS compo-nents. The CCI, which is mainly composed of MS components, hadthe largest impact on cancer events and death.
In regard to the obesity paradox in cancer patients, selectionbias has to be considered [32,36]. In patients with advanced cancer,who are at a high risk of malnutrition, a higher BMI and necessarynutritional reserves may lead to better outcomes [37]. However, inpatients with earlier stages of the disease, who have a low risk ofmalnutrition and a long life expectancy, an excessively high fatmass may lead to shorter survival due to the increased risk ofrecurrence [36]. However, we found that the relationship between
the legend for Fig. 3. BMI: body mass index, underweight (0 points), normal weight (1loss < 5% (�1 point), weight gain < 5% (1 point) and weight gain �5% (2 points); tumorarlson comorbidity index; histopathological type: tubular adenocarcinoma (0 points),ree survival.

Fig. 5. Calibration curves for the final multivariable model for the nomogram predictions of the 5-year overall survival (A) and 3-year disease-free survival (B). The dashed linesindicate an ideal nomogram; the solid lines indicate the developed nomogram; the vertical bars show the 95% CIs.
C. Hu, Q. Zhang, X. Jin et al. Clinical Nutrition xxx (xxxx) xxx
the preoperative BMI and risk of cancer events and death exhibitedU-shaped curves in patients with both stage II and III CRC.
It is currently unclear whether there is a direct or an inversecausal relationship between underweight and risk of recurrence ofand death. The increasing levels of proinflammatory and pro-cachectic factors in patients with cancer may trigger both tumorprogression and weight loss [38]. Thus, underweight may indicatenot only a lack of nutritional reserves but may also reflect theincreased metabolic activity of a more aggressive tumor biology,whichwould lead topooreroutcomes [39]. This featuremaybemorepronounced in patients with advanced tumors. Our results showedthat underweight had a larger effect on the risk of cancer events inpatients with stage III CRC. The association between preoperativeBMI and risk of cancer events exhibited aU-shaped curve in patientswith stage III CRC and a J-shaped curve in patients with stage II CRC.
Ethnic differences must also be taken into account. In studiesconducted in Western countries, the most favorable outcomesoccurred in individuals who had a BMI ranging from25 to 35 kg/m2,and the BMI cut-off point used for determining the point at whichthe risk of death increased was approximately 35 kg/m2 [15,16].However, the East Asians have higher visceral fat mass for a givenBMI due to their lower muscle mass and tendency toward havingabdominal distribution of fat [40]. Ning Yet al. found that the risk ofCRC increased sharply in Asians when the BMI exceeded 23 kg/m2
[20]. Our results showed similar results: the inflection point was at24 kg/m2 for the risk of cancer events and 25 kg/m2 for the risk ofdeath in Chinese CRC patients.
There are great differences in BC between men and women, andsuch differences might alter the association between obese and riskof cancer events and death. Some studies found that the obesityparadox was more pronounced in men [5,13,32], while others heldthe opposite views [30,41]. However, we found a consistent asso-ciation among the preoperative BMI and the risk of cancer eventsand death between men and women.
We analyzed the association between the change in weight andthe risk of cancer events and death. It should be noted that weightloss during postoperative chemotherapy might have been mainlycaused by gastrointestinal dysfunction after surgery and side effectsof chemotherapy. Furthermore, weight loss� 2%within 6months isconsidered to be a risk factor for malnutrition [42]. Therefore, the
8
association between weight loss and the risk of cancer events anddeath in this study mainly reflected the effects of malnutritionduring postoperative chemotherapy rather than weight controlachieved in asymptomatic patients after antitumor treatments viadietary and exercise-related interventions. Therefore, we foundthat weight loss was always an adverse factor. However, we foundthat patients with weight gain �5% had a higher risk of cancerevents and death than did patients with weight gain < 5%. Theseresults are consistent with those of a study by Thivat E et al. inpatients with breast cancer during postoperative chemotherapy[43]. However, the association between change in weight and riskof death exhibited an L-shaped curve in patients with stage III CRC,suggesting that weight gain might mainly play a protective role inthese patients.
Thus, any advice on weight management for cancer patientsmust be given with caution. Plus, the evidence from current ran-domized clinical trials (RCTs) is not yet available [44]. Studies failedto confirm their hypotheses due to poor patient compliance. Mostof the patients followed interventions lasting less than 6 months[45e47]. We believe that patients have poor compliance withweight control programs is due to a lack of strong evidence thatindicates a change in weight does affect the risk of recurrence anddeath. While the present results may be insufficient to changeclinical practice, they do provide new evidence that may helpimprove patient compliance in future RCTs.
Our current study has substantial strengths. First, we simulta-neously evaluated the effects of the baseline BMI and change inweight after surgery on the risk of cancer events and death andfound that obesity and excessive weight gain were not alwaysbeneficial. Second, we retrieved BMI and change in weight datafrom the hospital records and excluded patients who had severepostoperative complications and patients who underwent incom-plete postoperative chemotherapy; thus, the confounding factors ofpostoperative complications and incomplete chemotherapy, as wellas recall bias of BMI and weight change, were excluded. The resultstherefore provided specific and strong evidence of such associa-tions. Nevertheless, there are several limitations that must benoted. First, our study was a retrospective observational study, socausal relationships cannot be inferred. Second, as in all observa-tional studies, there is a possibility that some confounding factors

C. Hu, Q. Zhang, X. Jin et al. Clinical Nutrition xxx (xxxx) xxx
were not measured. However, our results were robust to adjust-ments for numerous potential confounding variables.
5. Conclusion
Our results showed that the lowest risk of cancer events anddeath were in those who had a normal weight and had weight gain< 5% during the 6 months after surgery; patients who were un-derweight or overweight/obese and had weight loss or weight gain� 5% had a poorer prognosis. These results support the existence ofan obesity paradox and demonstrate that weight gain is not alwaysbeneficial. Cancer patients may need a reasonable weight man-agement program, and according to our results, maintaining thepreoperative weight or gaining < 5% of the preoperative weightmight be an appropriate range at 6 months after surgery.
Funding
This work was supported by the National Key Research andDevelopment Program: The key technology of palliative care andnursing for cancer patients (2017YFC1309200) and the SanmingProject of Medicine in Shenikzhen (CN) (SZSM201612051).
Authors' contributions
Chunlei Hu, Xinghan Jin and Yiming Zhang contributed to datacollection; Qi Zhang and Lin Zhang performed statistical analysis;Chunlei Hu, Qiankun Zhu and Meng Tang wrote this paper; Hanp-ing Shi was the chief of this study and 2017YFC1309200; and LyvGQ was the chief of SZSM201612051.
Conflict of interest
The authors have no disclosure of interest regarding this article.
Acknowledgements
We thank all the investigators and personnel who contributedto data collection and statistical analysis. We appreciate the sup-ports from the 2017YFC1309200 and SZSM201612051.
References
[1] Ravasco P. Nutrition in cancer patients. J Clin Med 2019;8(8):1211.[2] Renfro LA, Loupakis F, Adams RA, Seymour MT, Heinemann V, Schmoll HJ,
et al. Body mass index is prognostic in metastatic colorectal cancer: pooledanalysis of patients from first-lineclinical trials in the ARCAD database. J ClinOncol 2016;34(2):144e50.
[3] Schlesinger S, Siegert S, Koch M, Walter J, Heits N, Hinz S, et al. Postdiagnosisbody mass index and risk of mortality in colorectal cancer survivors: a pro-spective study and meta-analysis. Cancer Causes Control 2014;25(10):1407e18.
[4] Lieffers JR, Mourtzakis M, Hall KD, McCargar LJ, Prado CM, Baracos VE.A viscerally driven cachexia syndrome in patients with advanced colorectalcancer: contributions of organ and tumor mass to whole-body energy de-mands. Am J Clin Nutr 2009;89(4):1173e9.
[5] Fedirko V, Romieu I, Aleksandrova K, Pischon T, Trichopoulos D, Peeters PH,et al. Pre-diagnostic anthropometry and survival after colorectal cancerdiagnosis in Western European populations. Int J Canc 2014;135(8):1949e60.
[6] Renehan AG, Sperrin M. The obesity paradox and mortality after colorectalcancer: a causal conundrum. JAMA Oncol 2016;2(9):1127e9.
[7] Caan BJ, Kroenke CH. Next steps in understanding the obesity paradox incancer. Cancer Epidemiol Biomark Prev 2017;26(1):12.
[8] Cespedes Feliciano EM, Kroenke CH, Caan BJ. The obesity paradox in cancer:how important is muscle? Annu Rev Nutr 2018;38:357e79.
[9] Ligibel JA, Alfano CM, Courneya KS, Demark-Wahnefried W, Burger RA,Chlebowski RT, et al. American Society of Clinical Oncology position statementon obesity and cancer. J Clin Oncol 2014;32(31):3568e74.
[10] Rock CL, Doyle C, Demark-Wahnefried W, Meyerhardt J, Courneya KS,Schwartz AL, et al. Nutrition and physical activity guidelines for cancer sur-vivors. CA Cancer J Clin 2012;62(4):243e74.
9
[11] Senkus E, Kyriakides S, Ohno S, Penault-Llorca F, Poortmans P, Rutgers E, et al.ESMO Guidelines Committee. Primary breast cancer: ESMO Clinical PracticeGuidelines for diagnosis, treatment and follow-up. Ann Oncol 2015;26(Suppl5):v8e30.
[12] Lauby-Secretan B, Scoccianti C, Loomis D, Grosse Y, Bianchini F, Straif K. In-ternational agency for research on cancer handbook working group. Bodyfatness and cancer-viewpoint of the IARC working group. N Engl J Med2016;375(8):794e8.
[13] Bardou M, Barkun AN, Martel M. Obesity and colorectal cancer. Gut2013;62(6):933e47.
[14] Demark-Wahnefried W, Platz EA, Ligibel JA, Blair CK, Courneya KS,Meyerhardt JA, et al. The role of obesity in cancer survival and recurrence.Cancer Epidemiol Biomark Prev 2012;21(8):1244e59.
[15] Sinicrope FA, Foster NR, Yothers G, Benson A, Seitz JF, Labianca R, et al.Adjuvant Colon Cancer Endpoints (ACCENT) Group. Body mass index atdiagnosis and survival among colon cancer patients enrolled in clinical trialsof adjuvant chemotherapy. Cancer 2013;119(8):1528e36.
[16] Renfro LA, Grothey A, Xue Y, Saltz LB, Andr�e T, Twelves C, et al. Adjuvant ColonCancer Endpoints (ACCENT) Group. ACCENT-based web calculators to predictrecurrence and overall survival in stage III colon cancer. J Natl Cancer Inst2014;106(12):dju333.
[17] Ferlay J, Soerjomataram I, Dikshit R, Eser S, Mathers C, Rebelo M, et al. Cancerincidence and mortality worldwide: sources, methods and major patterns inGLOBOCAN 2012. Int J Canc 2015;136(5):E359e86.
[18] Xi B, Liang Y, He T, Reilly KH, Hu Y, Wang Q, et al. Secular trends in theprevalence of general and abdominal obesity among Chinese adults, 1993-2009. Obes Rev 2012;13(3):287e96.
[19] Chen W, Zheng R, Zhang S, Zeng H, Zuo T, Xia C, et al. Cancer incidence andmortality in China in 2013: an analysis based on urbanization level. Chin JCanc Res 2017;29(1):1e10.
[20] Ning Y, Wang L, Giovannucci EL. A quantitative analysis of body mass indexand colorectal cancer: findings from 56 observational studies. Obes Rev2010;11:19e30.
[21] Diagnosis And Treatment Guidelines For Colorectal Cancer Working GroupCSOCOC. Chinese Society of Clinical Oncology (CSCO) diagnosis and treatmentguidelines for colorectal cancer 2018 (English version). Chin J Canc Res2019;31(1):117e34.
[22] Dindo D, Demartines N, Clavien PA. Classification of surgical complications: anew proposal with evaluation in a cohort of 6336 patients and results of asurvey. Ann Surg 2004;240(2):205e13.
[23] Charlson ME, Pompei P, Ales KL, MacKenzie CR. A new method of classifyingprognostic comorbidity in longitudinal studies: development and validation.J Chron Dis 1987;40(5):373e83.
[24] Samson SL, Garber AJ. Metabolic syndrome. Endocrinol Metab Clin N Am2014;43(1):1e23.
[25] Zhou B. Coorperative Meta-Analysis Group Of Working Group On Obesity InChina. Prospective study for cut-off points of body mass index in Chineseadults. Zhonghua Liuxingbingxue Zazhi 2002;23(6):431e4.
[26] Grambsch P, Therneau T. Proportional hazards tests and diagnostics based onweighted residuals. Biometrika 1994;81(3):515e26.
[27] Iyengar NM, Hudis CA, Dannenberg AJ. Obesity and cancer: local and systemicmechanisms. Annu Rev Med 2015;66:297e309.
[28] Malietzis G, Aziz O, Bagnall NM, Johns N, Fearon KC, Jenkins JT. The role ofbody composition evaluation by computerized tomography in determiningcolorectal cancer treatment outcomes: a systematic review. Eur J Surg Oncol2015;41(2):186e96.
[29] Malietzis G, Currie AC, Athanasiou T, Johns N, Anyamene N, Glynne-Jones R,et al. Influence of body composition profile on outcomes following colorectalcancer surgery. Br J Surg 2016;103(5):572e80.
[30] Caan BJ, Meyerhardt JA, Kroenke CH, Alexeeff S, Xiao J, Weltzien E, et al.Explaining the obesity paradox: the association between body compositionand colorectal cancer survival (C-SCANS study). Cancer Epidemiol BiomarkPrev 2017;26(7):1008e15.
[31] Caan BJ, Cespedes Feliciano EM, Kroenke CH. The importance of bodycomposition in explaining the overweight paradox in cancer-counterpoint.Canc Res 2018;78(8):1906e12.
[32] Meyerhardt JA, Tepper JE, Niedzwiecki D, Hollis DR, McCollum AD, Brady D,et al. Impact of body mass index on outcomes and treatment-related toxicityin patients with stage II and III rectal cancer: findings from Intergroup Trial0114. J Clin Oncol 2004;22(4):648e57.
[33] Lee CS, Murphy DJ, McMahon C, Nolan B, Cullen G, Mulcahy H, et al.Visceral adiposity is a risk factor for poor prognosis in colorectal cancerpatients receiving adjuvant chemotherapy. J Gastrointest Canc 2015;46(3):243e50.
[34] Saetang J, Sangkhathat S. Diets link metabolic syndrome and colorectal cancerdevelopment (Review). Oncol Rep 2017;37(3):1312e20.
[35] Yamaji Y, Mitsushima T, Koike K. Pulse-wave velocity, the ankle-brachial in-dex, and the visceral fat area are highly associated with colorectal adenoma.Dig Liver Dis 2014;46(10):943e9.
[36] Rickles AS, Iannuzzi JC, Mironov O, Deeb AP, Sharma A, Fleming FJ, et al.Visceral obesity and colorectal cancer: are we missing the boat with BMI?J Gastrointest Surg 2013;17(1):133e43.
[37] Dodson S, Baracos VE, Jatoi A, Evans WJ, Cella D, Dalton JT, et al. Musclewasting in cancer cachexia: clinical implications, diagnosis, and emergingtreatment strategies. Annu Rev Med 2011;62:265e79.

C. Hu, Q. Zhang, X. Jin et al. Clinical Nutrition xxx (xxxx) xxx
[38] Richards CH, Leitch EF, Horgan PG, Anderson JH, McKee RF, McMillan DC. Therelationship between patient physiology, the systemic inflammatory responseand survival in patients undergoing curative resection of colorectal cancer. BrJ Canc 2010;103(9):1356e61.
[39] Fearon K, Strasser F, Anker SD, Bosaeus I, Bruera E, Fainsinger RL, et al. Defi-nition and classification of cancer cachexia: an international consensus. LancetOncol 2011;12(5):489e95.
[40] Hu FB. Globalization of diabetes: the role of diet, lifestyle, and genes. DiabetesCare 2011;34:1249e57.
[41] Meyerhardt JA, Catalano PJ, Haller DG, Mayer RJ, Benson AB, Macdonald JS,et al. Influence of body mass index on outcomes and treatment-relatedtoxicity in patients with colon carcinoma. Cancer 2003;98:484e95.
[42] Huhmann MB, August DA. Review of American society for parenteral andenteral nutrition (ASPEN) clinical guidelines for nutrition support in cancerpatients: nutrition screening and assessment. Nutr Clin Pract 2008;23(2):182e8.
10
[43] Thivat E, Th�erondel S, Lapirot O, Abrial C, Gimbergues P, Gad�ea E, et al. Weightchange during chemotherapy changes the prognosis in non metastatic breastcancer for the worse. BMC Canc 2010;10:648.
[44] Demark-Wahnefried W, Schmitz KH, Alfano CM, Bail JR, Goodwin PJ,Thomson CA, et al. Weight management and physical activity throughout thecancer care continuum. CA Cancer J Clin 2018;68(1):64e89.
[45] Stolley M, Sheean P, Gerber B, Arroyo C, Schiffer L, Banerjee A, et al. Efficacy ofa weight loss intervention for african American breast cancer survivors. J ClinOncol 2017;35(24):2820e8.
[46] Meyerhardt JA, Irwin ML, Jones LW, Zhang S, Campbell N, Brown JC, et al.Randomized phase II trial of exercise, metformin, or both on metabolic bio-markers in colorectal and breast cancer survivors. Version 2. JNCI CancerSpectr 2019;4(1):pkz096.
[47] Brown JC, Yung RL, Gobbie-Hurder A, Shockro L, O'Connor K, Campbell N, et al.Randomized trial of a clinic-based weight loss intervention in cancer survi-vors. J Canc Surv 2018;12(2):186e95.