a numerical simulation of the distribution of water temperature and salinity in the seto inland sea
TRANSCRIPT

Journal of the Oceanographical Society of Japan Vol. 41, pp. 213 to 224, 1985
A Numerical Simulation of the Distribution of Water Temperature and Salinity in the Seto Inland Sea*
Mayumi Murakami t , Yukio Oonishi$ and Hideaki Kunishi t
Abstract: Constant flows, as well as oscillatory tidal flow, play an important role in the long-term dispersion of water in the Seto Inland Sea. Two kinds of numerical model (l-line and 2-line models) of the Seto Inland Sea have been developed to determine the role of density- induced currents, one type of the constant flow, in water dispersion in the Inland Sea. The seasonal variations of temperature, salinity and density fields are simulated and the density- induced current field is predicted at the same time. It is found that the most appropriate value of the longitudinal eddy diffusion coefficient, Ks, is 5 • 10e-7 • 108 cm 2 sec -1. The value of the overall mean dispersion coefficient is of the order of 10Vcm2sec -1 (Hayami and Unoki, 1970). Consequently, it is suggested that 50-70 % of the total dispersion in the Seto Inland Sea can be attributed to currents other than density-induced currents, i.e., tidal currents, tide-induced currents and wind-driven currents.
In winter, both density and velocity fields, calculated using the l- l ine model, satisfy the conditions -for the existence of a coastal front in Kii Channel and in the eastern Iyo-nada.
1. Introduction The Seto Inland Sea is a semi-enclosed, long
and nar row coastal sea of Japan which is sur- rounded by Honshu, Kyushu and Shikoku Is- lands. The length, width and depth of the In land Sea are about 500km, 10 -50km and 15-50 m, respectively. T h e Inland Sea consists o f several basins, called nada, which are con- nected to each other wi th na r row waterways , called seto or straits. Many islands exist in these basins and the topography of the Inland Sea is complicated. The water in the Inland Sea is exchanged with the outer sea wate r th rough three channels, i.e., Bungo and Kii Channels and Kanmon Strai t (Fig. 1). Kanmon St ra i t is too nar row to have a significant effect on water exchange between the Inland Sea and the outer sea, compared with the other two .channels.
The Seto Inland Sea is a place of scenic beauty and one of the nat ional parks of Japan. In addit ion, it is an important fishing ground. Since the 1960s, there have been problems of
* Received 19 October 1984; in revised form 12 March 1985; accepted 12 March 1985.
I" Geophysical Institute, Faculty of Science, Kyoto University, Sakyo-ku, Kyoto 606, Japan.
$ Lake Biwa- Research Institute, Uchidehama, Ootsu 520, Japan.
pollution and /o r eutrophication in this beautiful inland sea. Quant i ta t ive oceanographical studies were started because of this situation, and one of the main purposes of such studies is to de- termine the dispersion abili ty of the Inland Sea.
In regard to total dispersion ability, Hayami and Unoki (1970) have est imated an overall mean longitudinal dispersion coe~cient , K~, in the Inland Sea. The method they used is a kind of optimization which minimizes the differ- ence of annual mean chlorinity between obser- vations and calculations. The calculation was performed using a steady, one-dimensional equa- tion of diffusion. A fairly large value of K~ of 10 v cm 2 sec -1 was obtained.
Kunishi e t a / . (1971) pointed out that the longi- tudinal dispersion in the Inland Sea was caused by the shear diffusion effect. Kunishi and Unoki (1977) also suggested t h a t c o n s t a n t flow, such as tide-induced flow, density-induced flow and wind-driven flow, is more important than oscil- la tory (tidal) flow so far as material t ransport during long periods (a few months or longer) is concerned.
The purpose of this paper is to make a quanti- ta t ive estimation of the contribution of the den- sity-induced current to the current system which causes water dispersion.
By analizing temperature , salinity and density

214 Murakami, Oonishi and Kunishi
132'E I
�9 t a a
134.EI 13~.E I
Fig. 1. The Seto Inland Sea, showing the longitudinal axis and 59 cross sections perpendicular to it. The names of places show the locations of weather stations.
data, Imasato et al. (1978) showed that the salinity distribution in the Inland Sea was corre- lated well with river discharge data. (These data were obtained by the Environmental Agency (1973) in May, August and October 1972, and January 1973.) It was concluded that the magni- tude of mixing in each basin and of the water exchange through each strait are the main factors determining salinity distribution in the Inland Sea.
Many investigations have been carried out to examine the mechanism of dispersion during the past 15 years.
The Seto Inland Sea is composed of several basins and straits. Tidal flow is dominant in the straits, and weak in the basins. The dis- persion of properties in the basins is controlled mainly by the constant flow.
On the other hand near the straits, the oscil- latory tidal current plays an important role in dispersion. Recent studies (Oonishi et al . , 1980; Awaji et al . , 1980; Imasato et al . , 1980) have found, from the Lagrangian viewpoint, that the coupling effect of the oscillatory and non-oscil- latory flows results in strong mixing near the straits. Further, Awaji et al. (1980) showed that spatially rapid changes of amplitude and phase lag of the tidal current near a model strait cause exchange of a fairly large amount of water through the strait.
Now, we have a clearer image of dispersion in the Inland Sea. The Inland Sea is a kind
of chain composed of basins joined with straits. Briefly speaking, "the constant flow" causes dispersion in the basins while "the coupling of the constant and tidal flows" and/or "the non- linearity of the tidal flow itself" causes it in the vicinity of the straits.
The next problem is to elucidate the role of each component of the constant flow in dis- persion.
It is well-known that a tide-induced flow often appears in the form of a gyre and is essential for material transport in the basins.
Wind-driven flow in the Inland Sea is negligible except in winter (Oonishi, 1979) and probably does not have a significant effect upon dispersion in the other seasons.
On the basis of a theoretical study of oceanic fronts similar to that which appears in the Kii Channel in winter (Yoshioka, 1971), Harashima et al. (1978) showed that density-induced cur- rents result in a fairly large dispersion coefficient, K~, of the order of 107 cm ~ sec -1 in water masses, while K~ falls to the level of eddy diffusivity of 105 cm ~ sec -1 in frontal zones.
It is not clear, however, what influence the density-induced flow has upon long-term dis- persion in the whole Inland Sea. Our purpose is to estimate the role of the density-induced current on dispersion in the whole Seto Inland Sea. We develop two kinds of model. The first is a laterally integrated two-level model and is termed the "l-l ine 2-level model" or "l- l ine

A Numerical Simulation of the Distribution of Water in the Seto Inland Sea 215
model" for short. The second has a double form of parallel l - l i ne models, and is te rmed the "2- l ine 2-level model" or "2- l ine model" , The effect of density-induced flow on tempera- ture and salinity distributions is explicitly de- scribed by advection. In these models, the hori- zontal diffusion coefficient, K= and K~, represent the intensity of dispersion produced by flows other than the density-induced flow.
Needless to say, dispersion abili ty varies spatially. I t is usually small in basins and large near straits. The dispersion coefficient evaluated by Oonishi (1981) was 1 -3 • 10 scm ~ sec -~ in the basins and 2 - 9 • 10rcm e sec -~ near the straits in the eastern region of the Inland Sea. The horizontal diffusion coefficient, a t t r ibuted to the higher frequency components of current than the semi-diurnal t ide, has a l ready been est imated by W a d a and Kadoyu (1975) to be about 1-5 • 10 ~ cm ~ see -~ in the basins and of the order of 10 s cm ~ see -~ in the straits of the Inland Sea.
In spite of this, the horizontal diffusion co- efficients, K~ and K~, are kept constant in this
+~ - i r 601"t,OL: Width and Depth of the Seto Inland Sea / - ~ t
"~ o - -
~ o20
-40- - - m o
-mi+ ~-+ . - - - ~ - ~ - - - r - ~ - + - ~ - - ~ - - - = + - , - m ~ ,
' j=2 . + ~ . _ I
+o ~e- - . ' - > ; ' " " ~ . . . . . . . . . : . . . . . . . :-t;-:T';"<':"+" 1 = > - ',,,,- i:l . . . . . . ~ . , I ' "~ 't'; - -~ 1~ upper level A A ~ ( ',' ~'~ , +:, I-'" ~,']vX 7X ','~ i +,o. ,/-z"++0'" v---\ ,,, t
/l ,oo i -
f teCal d.~.th[m/ -2gO
Grid Number i..+x-axis
Fig. 2. Longitudinal variations of width and depth of the Seto Inland Sea. "j" denotes the lateral grid number. If the total depth, H, is less than 20 m, the depth of the upper level is set equal to 0.SH. If H is more than 40m, the depth of the upper level is set equal to 0.25 H, while the depth of the upper level is equal to 10 m in all other places.
paper as our interest lies in the overall dispersion,
2. The m o d e l
2.1. 1-Hne model and 2-line model I t is assumed tha t Kanmon Strai t and Narutc~
Strai t are closed. A longitudinal axis (x-axis) is taken and the Seto Inland Sea is divided into 59 cross-sections (Fig. 1). These sections are separated by a distance of 10 km w h i c h corre- sponds to the longitudinal grid spacing dx. Each section is divided vertically into two levels. The depth of the upper level is determined as a function of water depth, H , and is. typical ly 10m. The width, B, at the surface, mean. depth, H , and the depth of the upper level a re
l - l i n e 2 - 1 e v e r
I? / /
z /U I I I / ll/I Z
f I - 4 o L t I I I ,
__V
m o d e l
# t ! # A / :
ll~ II I l II
I i # I I i I l I
z y 2 - l i n e 2 - l e v e l m o d e l ~ - ~ x
,, ? . j : 3..,. ,L... i =2 ,' ,'= , - ............. ~'" ' . �9 ' ~ ' ~ j _ 2 _ . ' - ' I '~' - - 7 . . . . - - . . . . # b
i - 1 , ' / ,,-~u~, ' i,~ f
' - ' ~ ' u w ! ; - 1 .../......~'"'",~"7..../ 7 i
t / ILl.' ': ~--~ i/.+ + i~ II ! i " l ,+/# u i l u - , , ,, ;, " L _ L I , ' , ,
Fig. 3. Schematic diagram of the 1-line and 2-1ine models. " j " denotes the lateral grid number in the 2-line model. In the 1-1ine model, the longitudinal velocity component, u, is defined in the upper and lower levels at the center of each cross section which is indicated by dashed lines. Temperature and salinity are defined at the center of gravity of each region separated by the cross sections and the interface between the two levels. In the 2-1ine model, u is defined at four points in each cross section. Temperature and salinity are defined at the center of gravity of each region separated by the cross sections, the interface and the sections indicated by dotted lines.

216 Murakami, Oonishi and Kunishi
shown in Fig. 2. A curvilinear orthogonal system of co-ordi-
nates (x,y,z) is adopted, where x increases longitudinally from Bungo Channel toward Kii Channel, y is perpendicular to x and increases from the Shikoku side toward the Kyushu and Honshu side, and z is positive upward.
Figure 3 shows the l-line and 2-line models schematically. In the 1-1ine model, the longi- tudinal velocity component, u, is defined in the upper and lower levels at the center of each cross section which is indicated by dashed lines in Fig. 3. Temperature and salinity are defined at the center of gravity of each region separated by the cross sections and the interface between the two levels. In the 2-line model, u is de- fined at four points in each cross section. Temperature and salinity are defined at the center of gravity of each region separated by the cross sections, the interface and the sections indicated by dotted lines in Fig. 3.
The l-line model is one of the simplest numerical models which can represent a density- induced flow field. In the l-line model, the lateral differentiation, 0/aI/ vanishes and the lateral velocity component, v, does not appear. The Coriolis force is neglected as a result.
By using the 2-line model, on the other hand, one can describe the lateral differentiation of properties and three dimensional motion. I t is the simplest model to incorporate the Coriolis effect and the lateral density gradient.
Since temperature and salinity are defined at six grid points in a cross-section, their distri- butions are obtained on the Shikoku side ( j = l ) , center ( j--2) and Honshu and Kyushu side ( j=3) for each level when the 2-line model is applied to the Seto Inland Sea (see Fig. 7).
2.2. Governing equations Nonlinear terms representing the advection of
momentum are considered to be negligible be- cause the velocities in our models are relatively small. In our models the velocity field represents only the density-induced current. The tidal force and the wind stress are not treated ex- plicitly as the driving force. The influence of these implicit parts of the actual flow upon the disi~ersion of temperature and salinity is, there- fore, embodied in the form of the diffusion terms. A linear equation of state is assumed and the Boussinesq approximation, the hydrostatic
approximation and rigid-lid approximation are employed. When a density inversion occurs in the vertical water column, the values of temper- ature, salinity and density are averaged within the unstable column at each time step. This procedure is called "convective adjustment".
In the 2-1ine model, the horizontal and vertical momentum balances, continuity of flow, the equation of state and conservations of tempera- ture and salinity are defined by the following equations,
au _ l O P a au a au a au of: po O x o x o x o y o y a,~ o z 9
(1)
av _ 1 aP a av a av a av
(2)
aP o=--~= - p q , (3)
au av aw . (a)
p=po(1-aT+,6S) , (5)
aT + OuT+ OvT.+ OwT
O _aT a_ aT a K~aT a (6)
aS auS OrS OwS + W ;
a _as a as a K , as RS =Oxx-K=~x+oyyKuay -~ az 6 az BH' (7)
where u, v and zv are the x, y and z compo- nents of velocity, respectively (cmsec-Z), t is time (see), P pressure (g cm -1 see-Z), p density (gem-a), T temperature (~ S salinity (%0), p0 the mean density (gem-a), q the gravitational acceleration (cm see-Z), ~,, vu, v, and K=, Ku, K, are the coefficients of eddy viscosity and eddy diffusivity in the x, y and z directions, respectively (era * sec-l), R is river discharge per unit length of x (cm * sec-:), B width (cm), H depth (cm), and a and ~ are the coefficients of thermal expansion and saline contribution, re- spectively. When density inversion occurs, 8 is set equal to zero. Otherwise, the value of 8 is set equal to unity.

A Numerical Simulation of the Distribution of Water in the Seto Inland Sea
Table l(a). Monthly mean river discharge in each region (unit=10~m3sec-1).
217
Region Bungo Iyo-nada Bingo-nada Harima- Osaka Kii Total Channel Aki-nada Hiuchi-nada nada Bay Channel
Section (1-3) (4-8) (9-23) (24-33) (34-44) (45-49) (50-54) (55-58) (1-58)
1972 March 0. 58 0.05 4.51 0.89 2.64 2.72 3.08 0.0 14.47 April 0.77 0.09 4.49 1.25 4.38 4.10 4.99 0.0 20.07 May 1.09 0.15 4.67 1.39 2.83 3.70 3.31 0.0 17.14 June 2.64 0.51 8.35 2.30 3.51 3.84 6.38 0. 0 27.53 July 4.63 0.73 14.84 6.73 13.61 11.98 12.92 0. 0 65.44 August 0.74 0.48 4.05 0.82 1.84 2.79 2.98 0.0 13.70 September 1.23 0.17 4.41 3.12 4.75 7.07 14.05 0.0 34.80 October 0.34 0.38 1.72 0.35 1.69 2.04 2.97 0.0 9.49 November 0.34 0.44 3.21 0.92 1.76 2.06 2.40 0.0 11.13 December 0.23 0.02 2.41 0.59 2.02 1.95 4.69 0.0 11.91
1973 January 0.74 0.09 3.65 1.40 3.01 3.56 3.43 0.0 15.88 :February 0.81 0.10 2.73 0.85 2.43 2.91 2.51 0.0 12.34
Average 1 .18 0.27 4.92 1.72 3.71 4.06 5.31 0.0 21.16
Total 0.37 0.08 1.53 0. 53 1.15 1.26 1.66 0.0 6.58 amount (X 101~ m 3 year -1)
Table l(b). Variation of river discharge with year in the Seto Inland Sea.
(unit= 101~ -1)
only the first-class river all rivers 1970 3.53 according to Hayami and 1971 3.59 Unoki (1970) : 1972 4.64 a 4.50 1973 2.78 in the present paper:
6.58 1.0 average 3.64 b 5.13 when Cr=o. 78
b/a=O. 78
Cr is the correlation factor of river discharge. See section 3.1).
Most of the rivers discharging into the Seto In land "Sea have been listed in the report pub- lished by the Environmenta l Agency (1974). Month ly mean r iver discharge is evaluated using the discharge tables (1972, 1973) for these rivers. A summary of the discharge in each region is tabula ted in Table l(a) . Since r iver inflow it- self scarcely accelerates the flow, the river effect is taken into our model in the form of a dilution .effect.
2.8. Boundary conditions Kanmon Strai t and Naru to Strai t are assumed
to be closed. A t the other two open sea boundaries temperature and salinity are specified from observational data obtained by the Environ- menta l Agency (1973). In regard to the momen-
tum, no acceleration at the open sea boundaries, no stress on the sea surface and a non-slip con- dition at the bot tom are adopted. Zero vertical flux of heat and salt are specified at the bottom. Heat flux and salt flux through the sea surface are evaluated and given as follows;
K OT Q OS - - g - 2 = o o C ; -K.-g;~ =SU'r-Eoo,),
at z = 0 , (8)
where Q is the upward heat flux (cal cm -2 sec-l), Cp the isopiestic specific heat (cal g-1 deg-1), p~ precipitation (cmsec -1) and E~a~ evaporation (cm sec-1).
Heat flux, Q, and evaporation, F_~ap, are est imated by the following equations (Defant, 1961; Budyko, 1956; Hishida and Nishiyama, 1969).
E~p=0.12x 10 -6 W(E,o--E~,), (9)
Q=-Q,+Q~+Q~+Qo, (lO)
Q,-- Q,o(l- 0.71C) (I- r), (ii)
Q~:s~T~: (0.39-0.058 E~) X (1-- cC') +4saTa3(Tw - Ta) (12)
f).. = Z ? E~p , (13)
Qo=R. Q.. (14)

218 Murakami, Oonishi and Kunishi
Here W is the wind speed (m sec-1), 7'= atmos- pheric temperature (~ T~ temperature of surface water (~ Ea vapor pressure (mb), E~o the saturated vapor pressure at Tw (mb), C cloud amount in fractions of unity, ~8 and Q~0 global solar radiation under actual conditions and without cloudiness, respectively (cal cm -2 sec-~), ~n effective back radiation (cal cm -~ sec-1). ~e sensible heat t ransport by heat conduction and convection (cal cm -2 see-l), ~e latent heat trans- por t by evaporat ion (cal cm -2 sec-1), r the albedo at the sea surface, s the coefficient of emissivity, relat ing the properties of radiat ing surfaces to those of a black body, a the Stefan-Boltzman's constant , c the coefficient depending on the lati tude, L the latent heat of sea wate r vapori- zation (cal g-~), and R~ Bowen 's ratio.
Table 2. Values of the constants.
p0 1.0 g cm -s f 8 .0x10 -5 sec -1 g 980 cm sec -~ a 2.0 x 10 -4 g deg -~ cm -s fl 7.75• -4 g ~'~-z cm-8
Qso 4.03• 10 -3 cal crn -2 sec -s
r O. 09
s 0.9 1.38 x 10 -'2
c 0.65 L 596-0.52 Tw cal g-~ R~ 0.66 (T~-Ta)/(Ew-Ea)
The meteorological variables, W, E~, T~, C and P , are evaluated using observations at wea ther stations around the In land Sea ( the Japan Meteorological Agency, March 1972- Februa ry 1973). The weather stations are located at the places named in Fig, 1. The surface temperature , Tw, in Eq. (12) is the calculated temperature in the upper level in our model. The wind speed, W, should be corrected, be- cause our observational data were obtained at stations on land where the wind speed is reduced compared to over the sea. The correction factor is assumed to be 1.5 after the pre-trials.
The values of the above parameters are t abu - lated in Table 2.
Init ial ly, tempera ture and salinity, observed in May 1972, are specified and u = v = w = O in all cases. The equations are integrated numeri- cally wi th respect to t ime for two years in real t ime. As the seasonal variations during t h e second year are the same as those during t h e first year, only the results during the second year will be described hereafter. The calculating time step was 600 see.
3. Discussion of results 8.1, Distributions of temperature, salinity
and density Tempera ture , salinity and density distributions
were computed by using the l - l i n e and 2-l ine models, and the results were compared w i t k observational data collected in May, Augus t and
. 1 - 1 i n e 2 - 1 e v e [ mode[
32 MAY " ' 7
J28 g
1 0 ~ . . . . . . . . 3 26 . . . . . . . . . . . . . . . j 2 ~ "6
10 20 30 40 50 10 20 30 40 50 grid number grid number
n i ~ M A Y , ~
"~ 1.6
" ~ JAN
10 20 30 z,O 50 grid number
--:Calculated(upper level) - - : O b s e r v e d ( u p p e r [eve[) - - - : �9 ( tower ,.. ) - - - : '~ [ tower r )
Fig. 4. Calculated ( : upper level and " " ": lower level) and observe& ( : upper level and - - - : lower level) distributions of temperature, salinity and-density in the l-l ine model.

A Numerical Simulation of the Distribution of Water in the Seto Inland Sea 219
October 1972, and in January 1973. (a) l - l i ne model results The differences of temperature and salinity
between calculations and observations are mini- mized when the value of K~ is taken as 5 • l0 s cm2sec -1 in the 1-line model (Murakami et al. , 1978). In their model the variat ion of K~ from 3 • 106 to 7 • 10 s cm 2 sec -~ has little effect upon the temperature and salinity fields, in contrast to the results of Hayami and Unoki (1970). Effects of variations of K~ and ~ from 1 to 30cm~sec -~ were also checked in the l - l i ne model, and suitable values of K ~ = 5 and ~ = 1 0 c m ~ sec -1 were obtained. I t was found, at the same time, that the strong vertical stratification o f density, which is a common feature in the basins in summer, cannot be reproduced as long .as K~ is held spatially constant.
Figure 4 shows the distributions of tempera- tu re , salinity and density calculated by using :the l - l i ne model.
As regards the temperature distribution, the resul ts of the 1-1ine model are in good agreement wi th measurements except for the underesti- mat ion of vertical stratification in the basins in .summer.
Calculated values of salinity are about 0.5 ~/~ ihigher in Iyo-nada and about 1.5~'~ lower in the area from eastern Hiuchi-nada to Har ima- nada than observational data throughout the :year. The calculated position of a salinity min imum in western Har ima-nada coincides wi th • observed.
The density distributions are similar to those .of salinity.
(b) 2~-line model results The 2-l ine model calculations are performed
for the combinations of parameters shown in Table 3. In order to describe the spatial varia-
Table 3. Values of the parameters
(cm ~ sec-')
l - l ine 5x10⁸ - 5 5x10⁶ - 1 0 1 . 0 2-line
RUN0 5x10⁸ 108 5 108 106 5 1.0 RUN1 5x10⁸ 106 1, 10 a 106- 106 10 1.0 RUN2 5x10⁶ 10 s 10 106 108 10 0.78 RUN3 7x10 e 108 10 7x10 e 10 e 10 0.78
a Ks is set equal to 1 in a basin and to 10 at a strait as explained in the section 3. l(b).
t ion in vertical mixing intensity, K , is assumed to vary spatially, except for RUN0. The value of K , at Hoyo (grid number 9), Kurushima (24-25), Bisan-seto (33-34), Akashi (44-45) and Ki tan (49) Straits is set equal to 10 cm 2 sec -1, while it is set at 1 cm * sec -~ in the other places.
Despite close similarity in the values of the parameters, the calculated results of temperature and salinity in RUN0 (Fig. 5) differ considerably from those in the l - l i ne model (Fig. 4). (As mentioned later, these differences can be attri- buted to differences in the computed velocity fields between the l - l i ne and 2 - l ine models.) Tha t is, the most appropriate values of para- meters must be revalued for the 2-1ine model.
Table l(b) shows annual variations in river discharge. River discharge in 1972 was un- usually large. Af ter several test runs using the 2-1ine model, we have found that distributions of temperature and salinity in May, August and October t 9 7 2 and January 1973 cannot be satisfactorily reproduced without a modification
I~ I L AUG \ ,~:ct q
10 20 30 ~O 50 10 20 30 40 50 gr id n u m b e r
- - ;ColcuLaied ( upper (eve[) - - :Observed (upper Level) - - - : -/ ( l ower -~ ) - - - : ~ ( lower 4. )
Fig. 5. Calculated ( : upper level a n d - - - : lower level) and observed ( : uppe r level and - - - : lower level) distributions of laterally averaged temperature and salinity in RUN0.
34
32
�9 30
RUN I:CR=t Solkdty ( j = 3 )
JAN
,8
" C - ~ = , 8 , l [ RUN3:Kx=7 10 S~Lin' tyt j=3] I
AUG " ~ "
10 20 30 ~ " 50 g r id n u m b e r lO 20 30 40 50 : Calcuk:ded(upper level) ~ : Obsen~(upper ~ e l ) ~ : RUN 2
. . . . ." /p ( lower level) . . . . ; ~ (lower level) (upper le~. )
Fig. 6. Influences of the parameters on salinity in (a) RUN1 (Cr=l) and (b) RUN3 (Kx=7• 10 ecm 2 see-').

220 Murakami, Oonishi and Kunishi
TEMPERATURE ( RUN 2
1o
" ~ ' ~ ' ~ ' 4 ' o ' ~ ' ~ ' '~ : ~ ' ~ ' k ' 6 : ~ grid number
SALINITY
3s~ ~
gr id number
- - :Cok:ulbted(upper ~ ) . - - - :Colcukated(Iower levt4) - - :Ot~erved(upp~r l e ~ ) . . . . . :Observed(tce, ver te~,4)
Fig. 7. Calculated temperature and salinity in RUN2.
of river discharge. A correction factor of river. discharge, Cr, is introduced in the 2-line model When river discharge is not corrected (RUNI: C~=I), total river discharge entering the Inland Sea from March 1972 to February 1973 is 6.58• 10 l~ m 3 year -1. When C~ is set equal to 0.78 (RUN2), total river discharge is reduced to 5.16•176 m 3 year -1 and coincides with the average value for four successive years (1970- 1973). The calculated values of salinity in RUN1 are lower than those in RUN2, with a difference of 0.5-0.8 f/oo, in the central region of the Inland Sea (Fig. 6(a)). The temperature distribution is ~ffected little by the value of Cr.
The influence of K~ on salinity distribution is illustrated in Fig. 6(b). Salinity increases with increase in Kx. The difference in salinity between RUN3 (Kx=7• 106 cm ~ sec -1) and RUN2 (Kx=5• -l) reaches a maximum of the order of 0.87~ in the center of the In- land Sea. Kx has little effect oh the tempera- ture field.
RUN2 is the best fit case using the 2-line model (Fig. 7). The improvements are obtained by varying Kz spatially, and vertical stratifi- cations are reproduced in the basins in summer. The magnitude of the discrepancy in tempera- ture is never more than 2~ between the calcu-
lated and observed results. Salinity tends to-be underestimated in Hiuchi-nada and Harima-nada and overestimated in Kii Channel throughout the year. The deviations of the model results from measurements are less than 1.5 f/~. In August the vertical stratification of salinity is not com- pletely reproduced in the northern Harima-nada, northern Osaka Bay and Kii Channel, where: heavy river discharge occurs.
In Kii Channel, both temperature and salinity are estimated to be higher than measurements in every season. This indicates that more outer sea water enters Kii Channel in the model than in reality.
On the whole, the 2-line model results agree with observations of the temperature, salinity and density fields except for the points mentioned. above.
3.2. Velocity field (a) l-line model results The schematic velocity fields in August and~
February are shown in Fig. 8(a). In the central part of the Inland Sea (from
the eastern Iyo-nada to Osaka Bay), the magni- tude of u is not more than several centimeters per sec, i.e., a strong density-induced current does not exist at any time of the year. In the western part (from Bungo Channel to the

A Numerical Simulation of the Distribution of Water in the Seto Inland Sea 22I
l - l ine 2-level model AUGUST FEBRUARY
/ : ' / { (a)
2-l ine 2-level model AUGUST FEBRUARY
[../2 ~?" \ ._ e % . ,; ' - . " L_~, .~ , 'L~--~.FZ . . . . .
/ ....--~?, %.t./ t,, f~-, / ~ - ~j.._t%.~, t,~ ~t *( 1
f ~
0,) Fig. 8. Schematic density-induced current field i n the upper and louver levels
computed by (a) the 1-1in e model and (b) the 2-line model (RUN2).
western Iyo-nada) and eastern part (Kii Charmei). of the In land Sea, on the other hand, the magn~ tude o f u is never less than 10 cm see -~, :and a pronounced density-induced current of the: order of 30 cm sec -1 appears during January and April . The flow is outward in the upper level and in- ward in the lower level in summer, and is reversed in winter w h i c h c o r r e s p o n d s to the seasonal variat ion of tlae longitudinal density gradient.
I t seems that Bisan-seto is the center of the Inland Sea so far as the flow pat tern is concerned in the l - l i ne model.
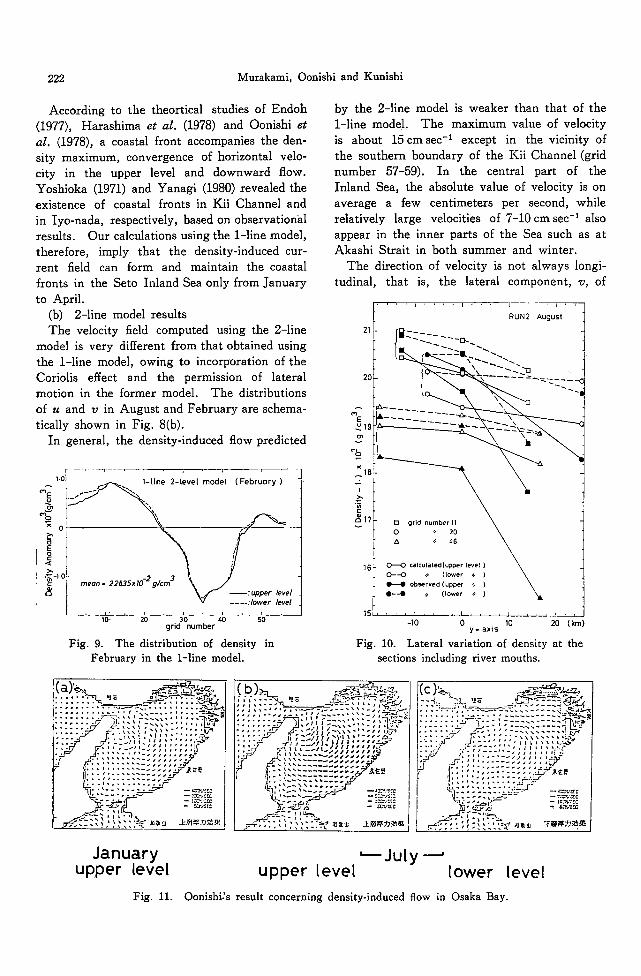
There are two convergent zones of u in the upper level in February . One is in the westerrt Iyo-nada (grid number 12-13) and another in Kii Channel (50-51), where density ~shows maxi- mum values at the same t ime (Fig. 9). Th is state continues from January to Apri l when the intense density-induced f l0w exists.
2 2 2 Murakami, Oonishi and Kunishi
According t o the theortical studies of Endoh (1977), Harashima et al. (1978) and Oonishi et
al. (1978), a coastal front accompanies the den- sity maximum, convergence of horizontal velo- city in the upper level and downward flow. Yoshioka (1971) and Yanagi (1980) revealed the existence of coastal fronts in Kii Channel and in Iyo-nada, respectively, based on observational results. Our calculations using the l-line model, therefore, imply that the density-induced cur- rent field can form and maintain the coastal fronts in the Seto Inland Sea only from January to April.
(b) 2-line model results The velocity field computed using the 2-line
model is very different from that obtained using the l-line model, owing to incorporation of the Coriolis effect and the permission of lateral motion in the former model. The distributions of u and v in August and February are schema- tically shown in Fig. 8(b).
In general, the density-induced flow predicted
l'Of ' ~ - - F - ~ . ~ i - l i n e 2-1~evel 'model r i -- E l . J " ""
~ /
"~ - ~ ~ -2 3 �9 -~ ~ - - : u p p e r /eve/
L . . . . : l o w e r /eve/
' ,o: zo 3'0 ~0 5'o grid number
Fig. 9. The distribution of density in February in the l-line model.
by the 2-line model is weaker than that o f the i-line model. The maximum value of velocity is about i5cmsec -~ except in the vicinity of the southern boundary of the Kii Channel (grid number 57-59). In the central part of the Inland Sea, the absolute value os velocity is on average a few centimeters per second, while relatively large velocities of 7-10cmsec -: also appear in the inner parts os the Sea such as at Akashi Strait in both summer and winter.
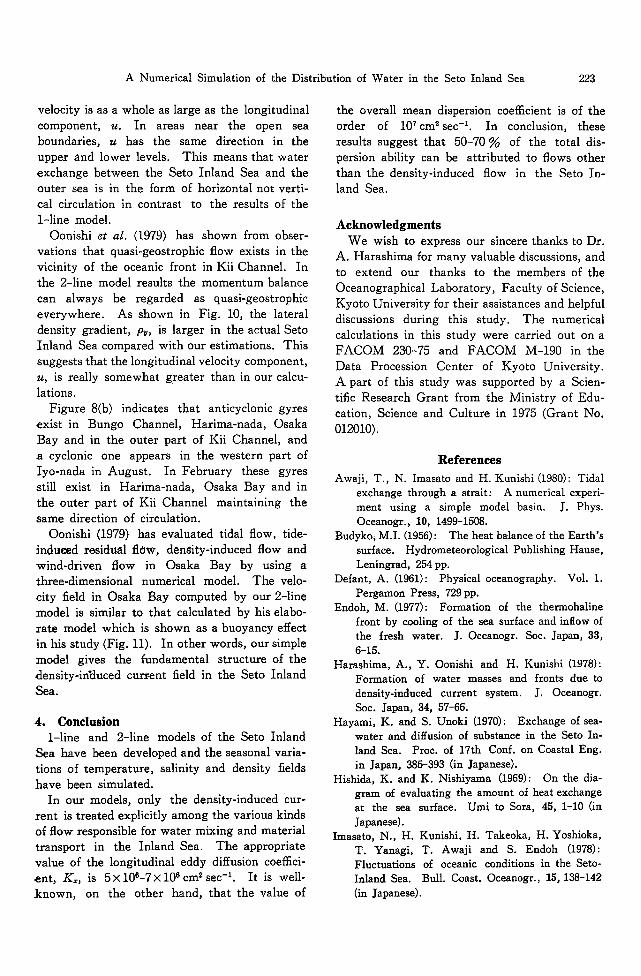
The direction of velocity is not always longi- tudinal, that is, the lateral component, v, of
~171r [] grid number 11 ~ -~
16[ 0---0 (alculsled(upper level) X -I L 0 - - 0 ~ (lower ~ ) ~ [ H observed(upper "~ ) ~ J ! o--O :~ (, . . . . . ) "~ J
ISl !
-I0 0 10 20 (km) y - axis
Fig. 10. Lateral variation of density at the sections including river mouths.
. . . . . . . ,,~ ..~_~. ~ . . -~ . . ~ .~':.. ~
. . . . i!Y~ - - ~ . . . . . . . . . ~ I
' : : : ; : : : : ~ " , _ ~ : : " - - . . , . - " ' , ' , , . , , & 7 . . . .
t----;~" ~ , - , , , ~ , , ; . . . . . . . ~ / I Y S . . . . . . . . . . . . . . . . .
, . . , ; . . . . . .: . . . . . . : : : , , : : 1 " 1 . : : : :
. - ~ - ~ , ~ , - . ~ . } - ~ - : : - , , , , , ,--,~'.~,, , •
( b ) . ~ . ~ . ~ ,~_ ~-~=.~
. . . . . . . . . . . . I : ( ~ . . . . 1~ ' , : - ~, "~,'~- ~
. . . . . . . . . . . . . . . . . . . N ?
. . . . . /--" ~I ~ _ . I I I I . ) ' I I I ; " ' ~ " I " ; / --T~ ~ r - ,t'H, ~,,,,,.crb ~ '
~,~T -~- - , ,
l - - - ' . . . -~..~ ' ~ . ~ ~ ' ~ " - - = ~ - = ~ I I . . . . :_...A~ , ~ - - - - = = . . . . . . . . ~, ~ ., . . . . . . . . . : . . - - - : . : . . . . . . . : . . . . . ~ ,
I . . . . . . ~ ~ . . . . . . . . . . . . . . . . i ~ " I t : : . : : J A , = - - ' : . . . . . . . . . " ~ I
I , ' J / , ; , . ...............
', . . . . . . ~' ,'.-k-~ "~ - - : ~ - ' ~ c [ ~ n . . . , . . ~ - 1~.%,:~c
January upper level
' July ' upper level lower level
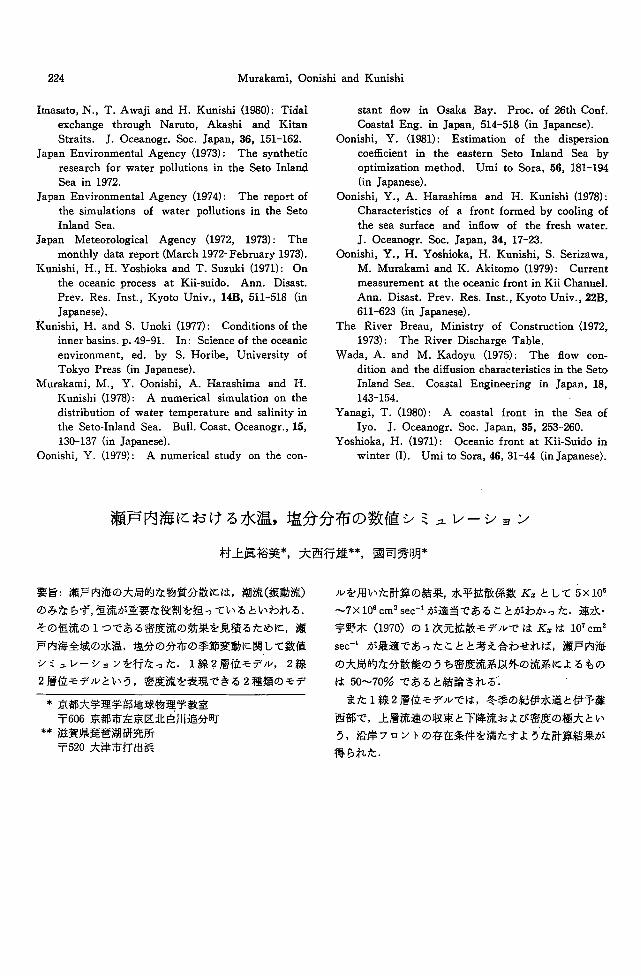
Fig. 11. Oonishi's result concerning density-induced flow in Osaka Bay.
A Numerical Simulation of the Distribution of Water in the Seto Inland Sea 223
velocity is as a whole as large as the longitudinal component, u. In areas near the open sea boundaries, u has the same direction in the upper and lower levels. This means that water exchange between the Seto Inland Sea and the outer sea is in the form of horizontal not verti- cal circulation in contrast to the results of the l - l i n e model.
Oonishi et al. (1979) has shown from obser- vations that quasi-geostrophic flow exists in the vicinity of the oceanic front in Kii Channel. In the 2-line model results the momentum balance can always be regarded as quasi-geostrophic everywhere . As shown in Fig. 10, the lateral densi ty gradient , p~, is larger in the actual Seto Inland Sea compared with our estimations. This suggests that the longitudinal velocity component, u, is really somewhat greater than in our calcu- lations.
F igure 8(b) indicates that anticyclonic gyres exist in Bungo Channel, Har ima-nada, Osaka Bay and in the outer par t of Kii Channel, and a cyclonic one appears in the western part of Iyo-nada in August . In Februa ry these gyres still exist in Har ima-nada, Osaka Bay and in the outer part of Kii Channel maintaining the same direction of circulation.
Oonishi (1979) has evaluated tidal flow, tide- induced residual flow, density-induced flow and wind-driven flow in Osaka Bay by using a three-dimensional numerical model. The velo- ci ty field in Osaka Bay computed by our 2-line model is similar to that calculated by his elabo- ra te model which is shown as a buoyancy effect in his s tudy (Fig. 11). In other words, our simple model gives the fundamental structure of the densi ty-induced current field in the Seto Inland Sea.
4. Conclusion l - l i ne and 2-l ine models of the Seto Inland
Sea have been developed and the seasonal varia- tions of temperature , salinity and density fields have been simulated.
In our models, only the density-induced cur- ren t is t reated explicitly among the various kinds o f flow responsible for water mixing and material t ransport in the Inland Sea. The appropriate value of the longitudinal eddy diffusion coeffici- ent , Kx, is 5 •215 -1. I t is well- known, on the other hand, that the value of
the overall mean dispersion coefficient is of the order of 107 cm 2 sec -1. In conclusion, these results suggest that 50-70 % of the total dis- persion ability can be at t r ibuted to flows other than the density-induced flow in the Seto In- land Sea.
Acknowledgments W e wish to express our sincere thanks to Dr.
A. Harashima for many valuable discussions, and to extend our thanks to the members of the Oceanographical Laboratory, Facul ty of Science, Kyoto Universi ty for their assistances and helpful discussions during this study. The numerical calculations in this s tudy were carried out on a F A C O M 230-75 and F A C O M M-190 in the Data Procession Center of Kyoto Universi ty. A part of this s tudy was supported by a Scien- tific Research Grant from the Minis try of Edu- cation, Science and Culture in 1975 (Grant No. 012010).
References Awaji, T., N. Imasato and H. Kunishi (1980): Tidal
exchange through a strait: A numerical experi- ment using a simple model basin. J. Phys. Oceanogr., 10, 1499-1508.
Budyko, M,I. (1956) : The heat balance of the Earth's surface. Hydrometeorological Publishing Hanse, Leningrad, 254 pp.
Defant, A. (1961): Physical oceanography. Vol. 1. Pergamon Press, 729 pp.
Endoh, M. (1977): Formation of the thermohaline front by cooling of the sea surface and inflow of the fresh water. J. Oceanogr. Soc. Japan, 33, 6-15.
Harashima, A., Y. Oonishi and H. Kunishl (1978): Formation of water masses and fronts due to density-induced current system. J. Oceanogr. Soc. Japan, 34, 57-66.
Hayami, K. and S. Unoki (1970): Exchange of sea- water and diffusion of substance in the Seto In- land Sea. Proc. of 17th Conf. on Coastal Eng. in Japan, 385-393 (in Japanese).
Hishida, K. and K. Nishiyama (1969): On the dia- gram of evaluating the amount of heat exchange at the sea surface. Umi to Sora, 45, 1-10 (in Japanese).
Imasato, N., H. Kunishi, H. Takeoka, H. Yoshioka, T. Yanagi, T. Awaji and S. Endoh (1978): Fluctuations of oceanic conditions in the Seto- Inland Sea. Bull. Coast. Oceanogr., 15, 138-142 (in Japanese).
224 Murakami, Oonishi and Kunishi
Imasato, N., T. Awaji and H. Kunishi (1980): Tidal exchange through Naruto, Akashi and Kitan Straits. J. Oceanogr. Soc. Japan, 36, 151-162.
Japan Environmental Agency (1973): The synthetic research for water pollutions in the Seto Inland Sea in 1972.
Japan Environmental Agency (1974): The report of the simulations of water pollutions in the Seto Inland Sea.
Japan Meteorological Agency (1972, 1973): The monthly data report (March 1972-February 1973).
Kunishi, H., H. Yoshioka and T. Suzuki (1971): On the oceanic process at Kii-suido. Ann. Disast. Prey. Res. Inst., Kyoto Univ., I4B, 511-518 (in Japanese).
Kunishi, H. and S. Unoki (1977): Conditions of the inner basins, p. 49-91. In: Science of the oceanic environment, ed. by S. Horibe, University of Tokyo Press (in Japanese).
Murakami, M., Y. Oonishi, A. Harashima and H. Kunishi (1978): A numerical simulation on the distribution o~ water temperature and salinity in the Seto-Inland Sea. Bull. Coast. Oceanogr., 15, 130-137 (in Japanese).
Oonishi, Y. (1979): A numerical study on the con-
stant flow in Osaka Bay. Proc. o~ 26th Conf. Coastal Eng. in Japan, 514-518 (in Japanese).
Oonishi, Y. (1981): Estimation of the dispersion coefficient in the eastern Seto Inland Sea by optimization method. Umi to Sofa, 56, 181-194 (in Japanese).
Oonishi, Y., A. Harashima and H. Kunishi (1978): Characteristics of a front formed by cooling of the sea surface and inflow of the fresh water. J. Oceanogr. Soc. Japan, 34, 17-23.
Oonishi, Y., H. Yoshioka, H. Kunishi, S. Serizawa, M. Murakami and K. Akitomo (1979): Current measurement at the oceanic front in Kii Channel. Ann. Disast. Prev. Res. Inst., Kyoto Univ., 22B, 611-623 (in Japanese).
The River Breau, Ministry of Construction (1972, 1973): The River Discharge Table.
Wada, A. and M. Kadoyu (1975): The flow con- dition and the diffusion characteristics in the Seto Inland Sea. Coastal Engineering in Japan, 18, 143-154.
Yanagi, T. (1980): A coastal front in the Sea of Iyo. J. Oceanogr. Soc. Japan, 35, 253-260.
Yoshioka, H. (1971): Oceanic front at Kii-Suido in winter (I). Umi to Sora, 46, 31-44 (in Japanese).
~ t _ l = ~ * , ; k ~ i ~ * * , ~ ) ] *
~ : ~ r
~ 6 0 6 ~ ~ ] 1 1 ~ * * ~ ~ ~
~ 0 ~ # ~
.~7 x 106 cm 2 sec-' , ~ _ ~ "C $ ;5 ~_ ,}: ~ ~b~ -~ ~ . ~zk.-
~ (1970) �9 1 7 X : ~ - e ~'~L,'C }~: K= ~, lO 'cm =
sec -~ ~ t ~ f ' C ~ 5 - , ~ - ~" & ~ . ~ - ~ , i ~ , ~ l ~