a novel transient testing method for heat/energy …
TRANSCRIPT

A NOVEL TRANSIENT TESTING METHOD FOR
HEAT/ENERGY WHEEL COMPONENTS
A Thesis Submitted to the College of
Graduate Studies and Research
in Partial Fulfillment of the Requirements for
the Degree of Doctor of Philosophy
in the Department of Mechanical Engineering
University of Saskatchewan
Saskatoon
By
Farhad Fathieh
July 2016
Copyright Farhad Fathieh, July, 2016. All rights reserved.

i
PERMISSION TO USE
In presenting this thesis in partial fulfillment of the requirements for a postgraduate degree
from the University of Saskatchewan, I agree that the Libraries of this University may make it
freely available for inspection. I further agree that permission for copying of this thesis in any
manner, in whole or in part, for scholarly purposes may be granted by the professors who
supervised this thesis work or, in their absence, by the Head of the Department or the Dean of the
College in which my thesis work was done. It is understood that any copying, publication, or use
of this thesis or parts thereof for financial gain shall not be allowed without my written permission.
It is also understood that due recognition shall be given to me and to the University of
Saskatchewan in any scholarly use which may be made of any material in this thesis. Requests for
permission to copy or to make other use of material in this thesis in whole or in part should be
addressed to:
Head of the Department of Mechanical Engineering
University of Saskatchewan
57 Campus Drive, Saskatoon, Saskatchewan, S7N 5A9

ii
ABSTRACT
Heat wheels and energy wheels are widely used in ventilation systems to recovery sensible
and latent energy, and consequently, reduce the energy required to condition outdoor ventilation
air for buildings. This Ph.D. thesis proposes a novel transient testing facility and method to predict
the effectiveness of heat/energy wheels by testing a small component of the wheels. The
component required for this test is a few coated sheets (for energy wheels) or non-coated sheets
(for heat wheels). The effectiveness values predicted for small-scale testing and determined from
correlations in the literature agreed within ±3% and within the experimental uncertainty bounds
(at wheel angular speed, ω, of 20 rpm when NTU < 13.1 and 2 < NTUm < 10).
The transient component testing was also used to investigate the effects of physical and
sorption properties of mesoporous silica gel on moisture transfer. It was found that the smaller the
pore width and the larger the specific surface area, the higher the sorption capacity of the desiccant.
However, the smaller pore width increases the vapour diffusion resistance and reduces the sorption
rate. It was observed that the energy exchanger coated with silica gel that has an average pore
width of 63 Å and an average particle size of 150 μm (63 Å-150 μm) performed better than the
two other silica gel coated exchangers (77 Å-55 μm and 115 Å-160 μm), especially when ω < 5
rpm. The latent effectiveness of all the exchangers were nearly the same at higher angular speeds,
ω > 10 rpm. Finally, the performance of an exchanger coated with biopolymer starch particles was
compared with the silica gel coated exchangers through transient testing. It was found that the
starch particles increased the latent effectiveness by 13% at ω = 0.5 rpm compared to the silica gel
particles while the latent effectiveness values were nearly equal at ω = 20 rpm. Considering that
starch typically costs less than silica gel, bio-desiccants such as starch have great potential to be
used in desiccant coated exchangers.

iii
ACKNOWLEDGEMENTS
This thesis would not have been possible without the help of many individuals. First and
foremost, I would like to acknowledge my distinguished supervisors, Dr. Carey Simonson, Dr.
Richard Evitts, and Professor Robert Besant not only for their encouragement and invaluable
feedback throughout my Ph.D. studies, but also for their professional training along the road.
Thank you for your kind support and “teachable moments” during the past four years which will
be some I cherish forever.
I am immensely grateful to my committee members, Dr. James Bugg, Dr. Lee Wilson, and
Dr. David Torvi for the compassion and coaching they have given me throughout my doctorate
program.
To my fellow graduate students/post-doctoral fellows, Dr. Ge Gaoming, Dr. A. H. Abdel-
Salam, M. Rafati Nasr, M. R. Abdel-Salam, M. R. Naghash, S. Niroumand, Dr. D. Ghadiri
Moghadam, M.J. Afshin, A. Oghabi, and H. Kamali: thank you for the countless hours of
assistance. I was extremely fortunate to be part of a supportive and active group. I would be remiss
if I did not acknowledge R. Retzlaff, D. Duetscher, and Dr. M. Fauchoux for their support and
valuable training in developing the test facility and conducting experiments. I also wish to thank
my colleagues Dr. S. Ravazi, L. Dehabadi, M. Shakouri, and A. Arzani for their feedback and
contributions. My special thanks also go to my family and friends who supported me with endless
love and words of encouragement.
I would like to acknowledge the Natural Sciences and Engineering Research Council of
Canada (NSERC), the Department of Mechanical Engineering at the University of Saskatchewan,
the Government of Saskatchewan’s Innovative & Opportunity Scholarship, Russell (Russ)
William Haid Award, Frederick Wheeler & W.H.T. Spary Graduate Scholarship for financial
support.

iv
DEDICATION
I dedicate this thesis to my wife, my parents, and my brother.
Thank you very much for your support throughout my Ph.D. studies.

v
TABLE OF CONTENTS
PERMISSION TO USE ................................................................................................................. i
ABSTRACT ................................................................................................................................... ii
ACKNOWLEDGEMENTS ........................................................................................................ iii
DEDICATION.............................................................................................................................. iv
TABLE OF CONTENTS ............................................................................................................. v
LIST OF FIGURES ...................................................................................................................... x
LIST OF TABLES ................................................................................................................... xviii
NOMENCLATURE .................................................................................................................. xxii
CHAPTER 1 INTRODUCTION ................................................................................................. 1
Motivation ........................................................................................................................ 1
Background ...................................................................................................................... 2
Indoor Air Quality Control ....................................................................................... 2
Heat Wheels (Sensible Energy Recovery) ................................................................ 4
Energy Wheels (Sensible and Latent Energy Recovery) .......................................... 5
Desiccant Wheels ...................................................................................................... 6
Wheels Performance Testing .................................................................................... 7
Literature overview ................................................................................................... 9
Objectives ....................................................................................................................... 13
Publications .................................................................................................................... 13
Refereed Journal Papers .......................................................................................... 14
Conference Paper .................................................................................................... 15
Thesis Outline ................................................................................................................ 15
CHAPTER 2 TRANSIENT TESTING OF HEAT WHEELS ................................................ 17
Overview ........................................................................................................................ 17
Abstract .......................................................................................................................... 18
Introduction .................................................................................................................... 19
Theory ............................................................................................................................ 22
Experimental .................................................................................................................. 27
Small-Scale Heat Exchanger................................................................................... 27

vi
Transient Test Facility ............................................................................................ 28
Test Section ............................................................................................................. 29
Sliding and Supporting Plates ................................................................................. 30
Measurements and Data Acquisition System ................................................................. 31
Experiments Procedure and Test Conditions ................................................................. 32
Single Step Change Test ................................................................................................ 33
Cyclic Test...................................................................................................................... 35
Results and Discussion ................................................................................................... 35
Single Step Test Results.......................................................................................... 36
Cyclic Test Results and Uncertainty Analysis ........................................................ 45
Comparison with the Literature Data ...................................................................... 50
Summary and Conclusions ............................................................................................. 52
CHAPTER 3 HEAT LOSS/GAIN IN TRANSIENT TESTING OF HEAT WHEELS ....... 54
Overview ........................................................................................................................ 54
Abstract .......................................................................................................................... 55
Introduction .................................................................................................................... 55
Theory ............................................................................................................................ 56
Experimental .................................................................................................................. 59
Test Conditions ....................................................................................................... 59
Results and Discussion ................................................................................................... 60
Analytical Results ................................................................................................... 60
Transient Test Results ............................................................................................. 65
Comparison with Literature Data ............................................................................ 71
Summary and Conclusions ............................................................................................. 74
CHAPTER 4 TRANSIENT TESTING OF ENERGY WHEELS .......................................... 76
Overview ........................................................................................................................ 76
Abstract .......................................................................................................................... 77
Introduction .................................................................................................................... 78
Theory ............................................................................................................................ 80
Transient Double Exponential Model (DEM) ........................................................ 80
Latent effectiveness Calculation for the Cyclic Tests............................................. 82

vii
Experimental .................................................................................................................. 83
Materials and Characterization Methods ................................................................ 83
Small-Scale Energy Exchanger............................................................................... 85
Test Apparatus and Experimental Procedures ........................................................ 87
Single Step Test Procedure and Operating Conditions ........................................... 88
Cyclic Test Procedure and Operating Conditions ................................................... 89
Sensors Calibration and Uncertainty Analysis ....................................................... 90
Results and Discussion ................................................................................................... 92
Desiccant Properties and Coating ........................................................................... 92
Transient Response of Humidity Sensors ...................................................................... 95
Transient response of the exchanger plus humidity sensor ............................................ 99
Energy Exchanger Response ........................................................................................ 104
Cyclic Test Results ....................................................................................................... 105
Latent Effectiveness ..................................................................................................... 107
Comparison with the Literature Correlation ................................................................ 110
Summary and Conclusions ........................................................................................... 113
CHAPTER 5 .... EFFECTS OF DESICCANT PHYSICAL PROPERTIES ON MOISTURE
RECOVERY .............................................................................................................................. 115
Overview ...................................................................................................................... 115
Abstract ........................................................................................................................ 116
Introduction .................................................................................................................. 117
Theory .......................................................................................................................... 119
Transient Double Exponential Model (DEM) ...................................................... 119
Yoon-Nelson model .............................................................................................. 119
Moisture Uptake.................................................................................................... 119
Experimental ................................................................................................................ 120
Materials ............................................................................................................... 120
Small-Scale Energy Exchanger............................................................................. 121
Transient Test Facility and Test Procedure .......................................................... 121
Results .......................................................................................................................... 122
Energy Exchangers Response ...................................................................................... 128

viii
Latent effectiveness ...................................................................................................... 137
Summary and Conclusions ........................................................................................... 140
CHAPTER 6 EFFECTS OF DESICCANT CHEMICAL COMPOSITION ON
MOISTURE RECOVERY ....................................................................................................... 142
Overview ...................................................................................................................... 142
Abstract ........................................................................................................................ 143
Introduction .................................................................................................................. 143
Experimental ................................................................................................................ 145
Materials ............................................................................................................... 145
Characterization of the Samples ................................................................................... 147
Small-Scale Exchanger ................................................................................................ 147
Transient Test Facility .................................................................................................. 147
Results and Discussion ................................................................................................. 148
Desiccant and Coated Sheets ................................................................................ 148
Transient Test........................................................................................................ 153
Latent Effectiveness ..................................................................................................... 159
Summary and Conclusions ........................................................................................... 161
CHAPTER 7 SUMMARY, CONCLUSIONS, CONTRIBUTIONS, AND FUTURE WORK
163
Summary ..................................................................................................................... 163
Conclusions ................................................................................................................. 163
7.3 Contributions ................................................................................................................ 168
Transient Component Testing of Heat Wheel and Energy Wheels ...................... 168
Performance Analysis for Wheel Component and Full-Scale Wheel ................... 168
Desiccant Selection Based on Component Testing in Energy Wheels ................. 168
Future work .................................................................................................................. 169
Coupled Heat and Moisture Transfer Study ......................................................... 169
Modification of Transient Analytical Model and the Test Facility for Counter-Flow
Arrangement ........................................................................................................................ 169
Transient Component Testing for Desiccant Wheels ........................................... 170
Durability Tests and Life Cycle Analysis ............................................................. 170
REFERENCES .......................................................................................................................... 171

ix
APPENDIX A ........................................................................................................................ 180
APPENDIX B......................................................................................................................... 182
B.1 Permission for Manuscripts Used in Chapters 2 .............................................................. 182
B.2 Permission for Manuscripts Used in Chapters 3 .............................................................. 183
B.3 Permission for Manuscripts Used in Chapters 4 .............................................................. 184
B.4 Permission for Manuscripts Used in Chapters 5 .............................................................. 191
B.5 Permission for Manuscripts Used in Chapters 6 .............................................................. 195

x
LIST OF FIGURES
Figure Title Page
1.1 Influence of indoor air humidity level on human health and its optimum range,
(Sterling, Arundel, & Sterling, 1985)
3
1.2 Schematic of heat wheel with supply and exhaust airstreams 4
1.3 Schematic of heat transfer in a channel of the heat wheel with no moisture
transfer
5
1.4 Schematic of heat and moisture transfer in a desiccant coated channel of the
energy wheel
6
1.5 Classification of the 416 journal papers on the rotary wheels as a single device
or as a system component published between 1990 and 2015 as found in
Engineering Village, Scopus, Science Direct, and ASME databases
10
1.6 A classification for the methodologies used to study rotary wheels in the
majority of journal papers published between 1990 and 2015
11
1.7 A breakdown of common topics reported in the majority of published journals
on the wheel studies between 1990 and 2015
12
1.8 Thesis outline with the objectives and manuscript title for each chapter 16
2.1 Normalized inlet and outlet temperature profiles for parallel-flow heat
exchangers.
24
2.2 Theoretical sensible effectiveness versus ψ for a heat wheel with equal supply
and exhaust airflow rates
27
2.3 The small-scale heat exchanger geometry with the supporting frame and
geometrical dimensions
28

xi
2.4 Schematic of the testing facility with the airflow lines, the measurement
instrumentations, and the test section.
30
2.5 Test section with the insulation (a) top view (b) side view. 30
2.6 Sliding and supporting plates, air ducts, and test section. 31
2.7 Schematic of the ducts cross-section with thermocouples arrangement at (a)
ducts inlet and (b) exchanger outlet.
32
2.8 Normalized temperature profile of small-scale heat exchanger with theoretical
fitted curve for a step increase in the inlet temperature (ΔTst = 27 °C, and Vf =
0.34 m/s, maximum uncertainty in the experimental data is Uθ = ±0.01)
36
2.9 Precision uncertainty in the sensible effectiveness due to temperature
difference between exhaust and supply airstreams (step change amplitude)
obtained by in the transient test
39
2.10 Time constants for the parallel-plate heat exchanger response for different
values of face velocities at (ΔTst = 6.9 °C )
40
2.11 Sensible effectiveness with respect to face velocity for different values of wheel
angular speed obtained by performing the transient test on the small-scale heat
exchanger (ΔTst = 6.9 °C)
41
2.12 Bias uncertainty in sensible effectiveness due to systematic error in flow rate
measurements (UBε,Qf) with respect to angle ratio ψ for different values of the
supply and exhaust flow rate
42
2.13 Total bias uncertainty in sensible effectiveness with respect to angle ratio ψ for
different values of supply and exhaust air face velocities obtained through
small-scale transient test (ΔTst = 6.9 °C)
44

xii
2.14 Total uncertainty in sensible effectiveness with respect to angle ratio ψ obtained
though small-scale transient test at supply and exhaust air face velocity 0.34
m/s.
45
2.15 Normalized experimental and theoretical temperature profiles for cyclic test
(with 16 min period of oscillations and ΔTst = 27 °C, and Vf = 0.34 m/s,
maximum uncertainty in the experimental data is Uθ = ±0.01)
47
2.16 Sensible effectiveness obtained by cyclic and single step tests a heat wheel with
(a) parallel-flow and (b) counter-flow flow arrangement (ΔTst = 27 °C, and Vf
= 0.34 m/s)
49
2.17 a) Sensible effectiveness of the heat wheel obtained by transient experiment
and the literature correlations. b) Difference between the transient and
correlated sensible effectiveness (ΔTst = 27 °C, and Vf = 0.34 m/s)
51
3.1 Sensible effectiveness versus angle ratio (ψw) for (a) parallel-flow and (b)
counter-flow heat wheel with the equal supply and exhaust airflow rates
61
3.2 Normalized temperature for a parallel-flow heat wheel with the equal supply
and exhaust airflow rate at different angle ratios
62
3.3 Normalized temperature profile (θ) of a parallel-flow heat wheel with the equal
supply and exhaust airflow rate for different values of loss weighting factors
63
3.4 The upper and lower limits for the sensible effectiveness of a counter-flow heat
wheel with the equal supply and exhaust airflow rate with respect to the wheel
time constant for different weighting factors and wheel angle ratio ψw
64
3.5 The critical ratio of wheel to heat loss/gain time constant (τw/τʹ) above which
less than 2% uncertainty is expected in the sensible effectiveness
65

xiii
3.6 Normalized temperature response of the small-scale heat exchanger obtained
through the transient testing at different step change amplitudes (Vf = 0.34 m/s,
maximum uncertainty in the experimental data is Uθ = ±0.03)
66
3.7 The difference in the sensible effectiveness of the small-scale heat exchanger
calculated by DEM and SEM (Vf = 0.34 m/s, Redh = 174)
68
3.8 Normalized temperature response of small-scale heat exchanger obtained
through transient testing at different flow rates of the (ΔTst = 7.0 °C, maximum
uncertainty in the experimental data is Uθ = ±0.03)
69
3.9 Comparison of the sensible effectiveness calculated by SEM and DEM at
different flow rates and wheel angular speeds (ΔTst = 7.0 °C)
71
3.10 Comparison between the sensible effectiveness of the heat wheel calculated
from Eq. (3.10) and the correlations in literature for a) NTU0 = 13.1 and b)
NTU0 =2.3
73
3.11 The difference between the sensible effectiveness of a heat wheel obtained
through literature correlations and the correlation in Eq. (3.10) using a) SEM
b) DEM
74
4.1 The pictures of a) Schlenk line and b) sealed jar used to dry the silica gel 85
4.2 A schematic of a) coated exchanger and b) coated substrate front view 87
4.3 Schematic of the test facility with the airflow lines, the measurement
instrumentation, and the test section
88
4.4 IR spectroscopy of silica gel samples 93
4.5 Particle size distribution of silica gel desiccant obtained from PSA 93
4.6 Adsorption isotherm of water vapor on the mesoporous silica gel at 23.0 °C 94

xiv
4.7 SEM images of aluminum substrate coated with silica gel particles through
powder coating at two levels of magnification
95
4.8 Normalized response of RH sensors to the step change in the humidity and fitted
curve obtained through DEM for a) step increase and b) step decrease (ΔRH =
40%, and Redh = 87, maximum uncertainty in the experimental data is UW =
±0.05)
97
4.9 Normalized response of small-scale energy exchanger plus RH sensors to the
step change in the inlet humidity during a) dehumidification and b) regeneration
(ΔRH = 40%, and Tair = 23.0 °C, maximum uncertainty in the experimental data
is UW = ±0.05)
99
4.10 a) Breakthrough and b) exhaust time for the humidity response of the small-
scale exchanger
101
4.11 R-squared values obtained by applying DEM on the response of small-scale
energy exchanger plus RH sensors to the step increase in the inlet humidity,
(ΔRH = 40%, Redh = 43, and Tair = 23.0 °C)
102
4.12 Decoupled response of the small-scale energy exchanger from humidity sensor
response during a) dehumidification and b) regeneration single step test (ΔRH
= 40%, Redh = 87, and Tair = 23.0 °C)
105
4.13 Response of the small-scale energy exchanger to the periodic step
increase/decrease in the inlet humidity at different periods of excitation, (ΔRH
= 40%, Tair = 23.0 °C, Redh = 174, maximum uncertainty in the experimental
data is UW = ±0.05)
107

xv
4.14 Latent effectiveness of the exchanger obtained through the step change in the
inlet relative humidity during a) dehumidification and b) regeneration (ΔRH =
40% and Tair = 23.0 °C)
108
4.15 Difference between the latent effectiveness obtained from regeneration and
dehumidification tests (ΔɛL = ɛL,reg - ɛL,deh)
109
4.16 Comparison of the latent effectiveness obtained through the small-scale
transient testing and the correlation in literature
113
5.1 A conceptual view of molecular structure of amorphous silica gel 121
5.2 IR spectroscopy of the silica gel samples 122
5.3 Particle size distribution of silica gel desiccants obtained from particle size
analyzer
123
5.4 Sorption isotherms for a) SG55-77, b) SG150-63 and c) SG160-115 obtained
through N2 gas sorption test at 77 K
125
5.5 SEM images of silica gel particles coated on an aluminum substrate 126
5.6 Breakthrough curves for water vapor adsorption on the mesoporous silica gels
in the small scale exchangers at different flow rates (ΔRH = 40%, and Tair =
23.1 °C, maximum uncertainty in the experimental data is UW = ±0.05)
130
5.7 Moisture content in the small scale exchanger with time during the
dehumidification at different flow rates (ΔRH = 40%, and Tair = 23.1 °C)
133
5.8 Breakthrough curves of water vapor on silica gel coated exchanger EX160-115
at different flow rates (ΔRH = 40%, and Tair = 23.1 °C, maximum uncertainty
in the experimental data is UW = ±0.05)
134

xvi
5.9 Latent effectiveness an equivalent wheel with the matrix coated with the same
desiccant particles at different angular speeds and balanced supply and exhaust
flow rate
138
5.10 The latent effectiveness of tested exchangers obtained by applying DEM on the
transient test data and Yoon-Nelson correlated data at different Re numbers and
wheel angular speed of ω = 0.5 rpm.
139
6.1 A conceptual view of the molecular structure of a) high amylose “linear” starch
where the unit in parentheses show the glycosidic linkage of a disaccharide
fragment of starch and the various hydroxyl groups, and b) a 2-D perspective
of the framework and surface structure of an amorphous silica gel.
147
6.2 IR spectroscopy of the silica gels and high amylose starch samples 149
6.3 Particle diameter distribution of silica gel desiccant obtained from laser particle
size analyzer
150
6.4 Sorption isotherms for a) SG 55, b) SG13 and c) HAS15 obtained through N2
gas sorption test at 77 K (Solid lines serve as an illustrative guide)
151
6.5 SEM images of aluminum substrate coated with HAS15, SG13, and SG55 at
two levels of magnification
152
6.6 Relative humidity and temperature variations at the outlet of the exchangers
during the dehumidification and regeneration tests (maximum uncertainty in
the experimental data is URH = ±2% and UT = ±0.2 °C)
154
6.7 The normalized humidity ratio (W) for sensor, aluminum substrate and acrylic
adhesive agent during the a) dehumidification and b) regeneration transient
testing (maximum uncertainty in the experimental data is UW = ±0.05)
155

xvii
6.8 The response (breakthrough curves) of small-scale exchangers a)
dehumidification (RH = 44% and Tair = 22.5 °C) and b) regeneration transient
testing (RH = 4% and Tair = 22.5 °C) (maximum uncertainty in the experimental
data is UW = ±0.05)
156
6.9 Moisture uptake/removal with time during the a) dehumidification and b)
regeneration transient testing
157
6.10 Latent effectiveness (εL) of energy wheels predicted through transient testing
of the small-scale coated exchangers at variable conditions; a) dehumidification
cycle b) regeneration cycle and for the balanced supply and exhaust flow rates
161

xviii
LIST OF TABLES
Figure Title Page
1.1 AHRI standards 1060-2014 test conditions for steady state test of energy
wheels
8
1.2 Comparison between the steady-state and the transient test for the
determination of wheels effectiveness
9
2.1 Geometric dimensions of flow channels with the physical and thermal
properties of the sheets
28
2.2 Air condition at ducts inlet for different amplitude of step change 34
2.3 Air flow rates for the step change tests with cold airstream temperature Tc =
22.9 °C and hot airstream temperature Th = 29.8 °C, ΔTst= 6.9 °C.
34
2.4 Airflow conditions in the ducts for cyclic step changes 35
2.5 Time constant, NTU, and ɛs of the equivalent full-scale heat wheel obtained by
performing the transient test on the small-scale heat exchanger at different step
change amplitudes, (Vf = 0.34 m/s, ω = 0.75 rpm)
38
2.6 Fitting constant and R-squared for power fitting on the sensible effectiveness
versus face velocity for different wheel angular speeds
41
2.7 Sensible effectiveness of the heat exchanger response found through cyclic test,
(ΔTst = 27 °C, and Vf = 0.34 m/s)
49
3.1 Response characteristics of the small-scale heat exchanger obtained through
transient testing at different step change amplitudes (Vf = 0.34 m/s, Redh = 174)
66
3.2 Response characteristics of the small-scale heat exchanger obtained though the
transient testing at different air flow rates, (ΔTst = 7.0 °C)
69

xix
3.3 Fitting parameters and coefficient of determination (R2) for Eq. (3.10) 72
4.1 Equilibrium relative humidity of saturated aqueous salt solutions 85
4.2 Air conditions and the flow rates for the transient single increase
(dehumidification) and step decrease (regeneration) tests
89
4.3 Airflow conditions and flow rate for the cyclic tests 90
4.4 Silica gel physical properties 94
4.5 Amount of silica gel coated on the small-scale exchangers through powder
coating
95
4.6 The average RH sensor response time constants and weighting factors obtained
through three tests at each amplitude of step increase in the inlet humidity (Redh
= 87 and Tair = 23 °C)
97
4.7 The average RH sensor response time constants and weighting factors obtained
through three tests at each amplitude of step decrease in the inlet humidity (Redh
= 87 and Tair = 23 °C)
97
4.8 RH sensor response to the step increase in the inlet humidity at different flow
rates
98
4.9 RH sensor response to the step decrease in the inlet humidity at different flow
rates
98
4.10 Precision uncertainty in time constants and weighting factors of the exchanger
plus RH sensor response to step increase in the inlet humidity (Redh = 87 and
Tair = 23.0 °C)
103
4.11 Exchanger plus RH sensors response to the step increase in the humidity at
different flow rates (ΔRH = 40% and Tair = 23.0 °C)
103

xx
4.12 Exchanger plus RH sensors response to the step decrease in the humidity at
different flow rates (ΔRH = 40% and Tair = 23.0 °C)
104
4.13 Exchanger response to the step increase in the inlet humidity at different flow
rates
105
4.14 Exchanger response to the step decrease in the inlet humidity at different flow
rates
105
4.15 Comparison of the latent effectiveness of rotary wheel obtained through the
transient single step test and cyclic test, (ΔRH = 40% and Tair = 23.0 °C)
110
4.16 The correlation parameters used to determine the latent effectiveness of small-
scale exchanger
112
5.1 Air conditions and the flow rates for the transient single step increase/decrease
tests
122
5.2 Physical properties of the amorphous silica gel samples obtained by laser
particle size analyzer and N2 gas adsorption
124
5.3 Mass of coated particles on the sheets of parallel-plate energy exchangers 128
5.4 RH sensor response to the step increase in the inlet humidity at different flow
rates
128
5.5 EX55-77 response characteristics to the humidity step increase at different flow
rates (ΔRH = 40% and Tair = 23.0 °C)
135
5.6 EX150-63 response characteristics to the humidity step increase at different
flow rates (ΔRH = 40% and Tair = 23.0 °C)
135
5.7 EX160-115 response characteristics to the humidity step increase at different
flow rates (ΔRH = 40% and Tair = 23.0 °C)
136

xxi
5.8 Yoon-Nelson fitting parameters for adsorption of water vapor on the
mesoporous silica gel samples at different flow rates
137
6.1 Air condition properties and the flow rates for the transient
adsorption/desorption tests
148
6.2 Physical properties of the desiccant samples obtained by laser particle size
analyzer and N2 gas adsorption†
151
6.3 Mass of coated particles on the small-scale coated exchangers 153
6.4 Time constants, weighting factors, and coefficient of determinations (R2) for
the small-scale coated exchangers obtained by fitting the DEM to the
breakthrough curves
160

xxii
NOMENCLATURE
ACRONYM
DEM Double Exponential Model
EX Exchanger
HAS High Amylose Starch
HVAC Heating, Ventilating and Air Conditioning
PSA Particle Size Analyzer
SEM Single Exponential Model
SG Silica gel
SYMBOLS
Aduct cross-sectional area of the each duct [m2]
Aht total heat surface area of the exchanger [m2]
bch width of exchanger channels [m]
Cp specific heat capacity [J(kg-1.K-1)]
Cr* heat capacity rate ratio
dh hydrodynamic diameter of channels [m]
dp desiccant particle size [μm]
F input forcing function
H* operating condition factor
H convective heat transfer coefficient [W(m2.K-1)]
hm convective mass transfer coefficient [m.s-1]
hch height of exchanger channels [m]

xxiii
Lch length of exchanger channels [m]
M mass of matrix [kg]
am air mass flow rate [kg·K-1]
NTU number of transfer unit on the supply or exhaust side
NTUm number of mass transfer unit on the supply or exhaust side
Pv desiccant specific pore volume [m3·g-1]
Pw desiccant pore width [Å]
Qa volumetric air flow rate [L·s-1]
Re Reynolds number
RH relative humidity [%]
SA desiccant specific surface area [m2·g-1]
t time [s]
ts student t-factor
UB bias (systematic) uncertainty
UP precision uncertainty
UT total uncertainty
Vf airflow face velocity [m·s-1]
W normalized air humidity ratio
Wm maximum moisture content in desiccant [g/g]
W air humidity ratio [kg/kg]
xh,FD hydrodynamic entry length [m]
xth,FD thermal entry length [m]

xxiv
GREEK SYMBOLS
γ response weighting factor
Δ difference between the exchanger outlet and inlet conditions
δ thickness of the exchanger sheets [m]
εL latent effectiveness [%]
εs sensible effectiveness [%]
εT total effectiveness [%]
θ normalized temperature
ρ density [kg·m-3]
τ time constant of exchanger response [s]
ψ angle ratio
Ω accumulative moisture uptake/removal
ω wheel angular speed [s-1or rpm]
SUBSCRIPTS
a Airflow
ads Adsorption
b breakthrough point
CF counter-flow
c cold airstream
ch Channels
cr Critical
des desiccant (or desorption)

xxv
e exhaust point
final test final conditions
FD fully-developed
h hot airstream
ht heat transfer
i exchanger inlet
init test initial conditions
M Matrix
m mass transfer
o exchanger outlet
PF parallel-flow
reg regeneration
St step change
W Wheel
YN Yoon-Nelson model
SUPERSCIPTS
ʹ heat loss/gain indicator

1
CHAPTER 1
1 INTRODUCTION
Motivation
The growth in world energy demand, depletion of fossil fuels, increased CO2 emissions,
and lack of alternative promising energy resources have motivated engineers to adopt more energy-
efficient technologies. A study from the World Energy Council (WEC) estimates that with no
change in the energy consumption rate, the energy consumption in 2020 would be 50-80 % higher
than in 1990 (Omer, 2008). Recent statistical data reveal that buildings are responsible for about
40% of national energy consumption in North America (Natural Resources Canada, 2011; U.S.
Energy Information Administration (EIA), 2015). More than 50% of this energy is used by heating,
ventilating, and air conditioning (HVAC) systems to achieve thermal comfort in industrial and
commercial buildings. Furthermore, energy cost has always been a matter of concern for both
HVAC designers and consumers. In 2009, Canadians spent about $16 billion to maintain the
indoor thermal comfort conditions in buildings (Natural Resources Canada, 2011). As a result,
engineers are continuously working towards buildings with reduced sensible and latent loads and
equipped with more energy-efficient HVAC systems with lower capital and operational costs. In
the past few decades, energy efficient HVAC systems are being equipped with air-to-air heat or
energy exchangers which recover a large portion of the energy from the exhaust or the supply
airstreams. These exchangers can substantially decrease the cooling and heating load and reduce
the capacity of the HVAC equipment installed in commercial and industrial buildings.
Among conventionally available air-to-air heat/energy exchangers, rotary wheels (heat
wheels and energy wheels) are the most common exchangers used in the North American HVAC
market. The main advantages of rotary wheels are their high energy recovery effectiveness, ease

2
of manufacturing, low installation, operational, and maintenance cost, and short (2-4 years)
payback periods (Asiedu et al., 2004, 2005). Since rotary wheels play an important role in the
performance and energy savings of HVAC systems, much attention has been placed on wheel
performance testing, enhanced matrix materials, and wheel designs. The main goal of this Ph.D.
study is to reduce the time and cost required to test rotary wheels by developing a new method of
performance testing, known as transient component testing. The hypothesis is that the transient
heat and moisture transfer measurements taken from testing the basic components of wheels can
be used to predict the steady-state performance of rotary wheels. This novel method can eventually
help to enhance the effectiveness of wheels by facilitating the wheel design process and expediting
the performance testing of prototypes.
Background
Indoor Air Quality Control
An activity pattern study in North America shows that Canadians and Americans spend
about 90% of their time indoors (Leech et al., 2002). Due to the amount of time that occupants
spend indoors, indoor air quality (IAQ) and thermal comfort of buildings are directly related to
occupants’ health and productivity (Yu et al., 2009). The main factors that affect thermal comfort
and IAQ are temperature, humidity, ventilation rate, and concentration of particles and pollutant
gases. The worldwide energy crisis in the 1970s drew public attention towards energy saving
strategies. Since then, airtight buildings with enhanced insulation materials and lower ventilation
rates have been constructed. However, several studies reveal the adverse effects of low ventilation
rates on the well-being and performance of occupants, especially in workplaces and schools
(Mendell & Heath, 2005; Sundell et al., 2011). It was reported that the prevalence of sick building
syndrome (SBD) is 30%-200% higher in buildings with natural ventilation compared to the
buildings equipped with air-conditioning systems (Seppanen & Fisk, 2002). Although the

3
importance of indoor thermal comfort has been recognized for centuries, the influence of indoor
humidity on occupants’ health have often been underestimated. The impacts of indoor humidity
level on occupants’ health are shown in Figure 1.1 which shows that humidity levels between 40-
60% are recommended for human health.
In the past few decades, many countries have introduced new regulations, standards, and
codes for buildings that require HVAC systems to be equipped with air-to-air heat/energy
exchangers (Ashrae & Ies, 2011) to reduce the overall energy consumption while maintaining
acceptable IAQ (Ashrae & Ies, 2011). The research in this thesis focuses on a specific type of air-
to-air heat/energy exchanger known as heat wheel and energy wheel. In the next sections, different
types of rotary wheels (heat wheels, energy wheels, and desiccant wheels) will be described.
Figure 1.1-Influence of indoor air humidity level on human health and its optimum range
(Sterling et al., 1985)
Bacteria
Viruses
Fungi
Mites
Respiratory Infections
Allergic Rhinitis and
Asthma
Chemical Interactions
Ozone Production
10 20 30 40 50 60 70 80 90 100
Optimum zone
Dec
reas
e in
bar
wid
th in
dic
ates
dec
reas
e in
eff
ect
RH (%)

4
Heat Wheel (Sensible Energy Recovery)
Heat wheels are one of the most effective sensible energy (heat) recovery exchangers.
Figure 1.2 shows a schematic of the heat wheel with the supply and exhaust airstreams. Heat
wheels consist of a cylindrical matrix with thousands of honeycomb or corrugated flow channels.
The matrix is made up of a heat-adsorbing material such as aluminum. As the wheel rotates, heat
is continuously transferred between the supply and exhaust airstreams with different temperatures.
Heat is absorbed by the wheel matrix as the hot airstream, the supply air in the summer or the
exhaust air in the winter, passes through the wheel flow channels, presented in Figure 1.3. The
stored heat in the wheel matrix is transferred to the cold airstream as the wheel rotates and the
channel is exposed to the cold airstream. This phenomenon repeats as the wheel rotates
continuously which leads to continuous heat recovery with an effectiveness of 70-80% (ASHRAE,
2008). Moreover, in a recent application of heat wheels, they are combined with other types of
energy exchangers (energy wheels, air-to-air membrane, liquid-to-air membrane) to enhance the
coefficient of performance (COP) of the system and prevent frost formation in energy exchangers
(Rafati Nasr et al., 2014). Although heat wheels are still of great interest for HVAC designers, heat
wheels are not capable of transferring moisture (latent recovery) between air streams unless
condensation or frosting occurs in the wheel.
Figure 1.2-Schematic of the heat wheel with supply and exhaust airstreams
Exhaust Air
Supply Air Outdoor Air
Return Air

5
Figure 1.3-Schematic of heat transfer in a channel of heat wheels with no moisture transfer
Energy Wheel (Sensible and Latent Energy Recovery)
While heat wheels are used to transfer sensible energy, energy (enthalpy) wheels are
capable of recovering a large portion of sensible (heat) and latent (moisture) energy from the
exhaust airstream. Similar to heat wheels, energy wheels have a heat-adsorbing (mainly metallic)
cylindrical matrix that consists of a large number of honeycomb or corrugated flow channels. To
make the moisture transfer possible, the energy wheel channels are coated with micron-sized
highly-porous desiccant particles with strong affinity for water vapor. Silica gel, molecular sieves,
activated alumina, and zeolites are extensively used to coat the wheels due to their high surface
area, low cost, and low regeneration temperature (Zheng et al., 2014). A schematic of an energy
wheel with coating is shown in Figure 1.4. While hot and humid air passes through the wheel
channels, heat is mainly stored in the metallic substrate and water vapor is adsorbed by the
desiccant particles. As the wheel rotates and the channels are exposed to the cold and dry airstream,
the accumulated heat and moisture in the wheel matrix are released into the airstream. As a result
of the continuous rotation of the wheel, heat and moisture are transferred between the supply and
exhaust airstreams periodically.
Latent energy recovery
Hot & Humid
heat flow
Cold & Humidexhaust air (winter)
or
supply air (summer)
Substrate
Substrate
return air (winter)
or
outdoor air (summer)
4
heat flow

6
Figure 1.4-Schematic of heat and moisture transfer in a desiccant coated channel of energy
wheels
Desiccant Wheels
Desiccant wheels, or desiccant drying wheels, are mainly used as dehumidifiers in HVAC
systems in order to remove moisture from the supply air. Compared to conventional
dehumidification systems, such as cooling coils, desiccant wheels are beneficial when the required
dew point is low (∼less than 4°C). In desiccant cooling systems, the desiccant wheel is mainly
placed before a direct/indirect evaporative cooling system to decouple the latent and sensible loads
for the system. Similar to energy wheels, the matrix of desiccant wheels is coated with micron size
desiccant particles; whereas, the matrix substrate is made of materials with low heat capacity, such
as plastic. As a result, desiccant wheels have high latent recovery efficiency with low sensible
energy recovery. Unlike the regeneration process in energy wheels which takes place at moderate
temperature (Treg = 20-35 °C), the desiccant is regenerated at elevated temperatures in desiccant
wheels (Treg = 60-90 °C). A heating device, such as electrical or gas heater, is commonly coupled
with a desiccant wheel to provide the energy required for the regeneration process. Another
difference between energy wheels and desiccant wheels comes from the wheel angular speed.
Desiccant wheels typically operate at low angular speeds, 0.1 rpm < ω < 1 rpm, whereas energy
wheels and heat wheels angular speed are relatively higher, 10 rpm < ω < 20 rpm.
Latent energy recovery
Hot & Humid
hea
t fl
owCold & Dryexhaust air (winter)
or
supply air (summer)
Substrate
Substrate
return air (winter)
or
outdoor air (summer)
4m
ois
ture
flo
w
Des
icca
nt

7
Wheel Performance Testing
There are several parameters that quantify the performance of rotary wheels. Among them,
the effectiveness is the most important factor that identifies the energy recovery efficiency of the
heat/energy wheels. The heat recovery performance in rotary wheels is quantified by sensible
effectiveness. The sensible effectiveness is defined as the ratio of the actual heat transfer rate
between the supply and exhaust airstreams to the maximum possible heat transfer rate between the
supply and exhaust airstreams (Kays & London, 1984). Similarly, the moisture recovery
performance in energy wheels is indicated by the latent effectiveness. The latent effectiveness is
the ratio of actual moisture transfer rate to the highest possible moisture transfer rate between the
humid and dry air streams.
The total effectiveness represents the transfer of enthalpy in the energy wheels which is the
ratio of actual enthalpy transfer rate to the highest possible enthalpy transfer rate between the
supply and exhaust air streams. According to data in the literature, wheel effectiveness values can
be determined through experimental, empirical-analytical, or numerical methods. Although
numerical simulations are mostly successful in predicting wheel effectiveness, experimental
approaches are still the most reliable testing methods to obtain wheel effectiveness values. The
following is a brief description of experimental methods for testing wheels.
1.2.5.1 Steady-State Testing Method
In the steady-state testing method, the sensible and latent effectiveness are measured while
the wheel operates at steady-state conditions. The steady-state tests are conventionally used to
certify wheels at specified operating conditions. Several standards, such as AHRI certification
1060-2011 (ANSI/AHRI, 2014) and ANSI/ASHRAE standard 84-2013 (ANSI/ASHRAE, 2013),
provide the specific conditions and stepwise procedure to obtain the effectiveness of the wheels

8
within acceptable uncertainty limits. AHRI test conditions are listed in Table 1.1. In fact,
maintaining the standard conditions requires a large test facility with the ability to provide
conditioned air flow. Moreover, obtaining the effectiveness within the acceptable uncertainty
limits is reported to be expensive and time consuming which requires extensive online data
analysis (Ciepliski, 1997; 1998).
Table 1.1- AHRI standard 1060-2014 test conditions for steady-state testing of energy
wheels
Airstream Conditions
Heating Cooling
Supply air
Dry bulb temperature 1.7 ± 1oC 35.0 ± 1oC
Relative humidity 82.5% ± 2% 82.5% ± 2%
Exhaust air
Dry bulb temperature 21.1 ± 1oC 23.9 ± 1oC
Relative humidity 49.2% ± 2% 51.2% ± 2%
1.2.5.2 Transient Testing Method
To reduce testing time and cost, Abe et al. (Abe et al., 2006a, 2006b) proposed a testing
method which measures the sensible and latent effectiveness from the transient response of the
wheel to a step change in the inlet flow properties (temperature or humidity ratio). They suggested
that wheels with different matrices and coatings respond to the inlet step change differently and,
consequently, each wheel has distinctive transient characteristics. They developed an analytical
model that correlates the wheels transient characteristics (time constants and weighting factors) to
the effectiveness. In their method of testing, a wheel was subjected to a step change in the inlet
airflow temperature and/or humidity ratio while the airflow properties (temperature and humidity)
were measured at the inlet and outlet sections. Analyzing the data obtained from transient test, Abe
et al. (2006) calculated the effectiveness with acceptable uncertainty from their transient analytical

9
model. Since then, several researchers studied the transient response of wheel at different operating
conditions (Abe et al.2006a, 2006b; Shang & Besant, 2009a, 2008, 2009c). The obtained sensible
and latent effectiveness agreed with the steady-state test results within the uncertainty bounds at
most of the tested conditions.
The transient testing method has several advantages over the steady-state method, listed in
Table 1.2. Since the transient test is performed on part of a stationary wheel, the air supply system
and the entire test facility can be scaled down. Moreover, the transient test duration is substantially
shorter than conventional steady-state testing. As a result, the cost per test can be effectively
reduced for the transient test. In addition, transient testing can effectively be used for performance
comparison of the wheels and quality control purposes.
Table 1.2-Comparison between the steady-state and the transient test for determination of
the wheels effectiveness
Parameter Steady state test Transient test Factor
Test time 5-10 hours 1 hour 5-10
Equipment cost $1-2,000,000 $50,000 20-40
Space 1-2,000 ft2 100 ft2 10-20
Cost per test $5-10,000 $500-1,000 10
Uncertainty ±5% (sensible)
±7% (latent)
±4% (sensible)
±5% (latent)
Slight
improvement
Literature Overview
Since the invention of desiccant coated wheels (energy wheels and desiccant wheels) in the
1980s, wheels have become the most common air-to-air energy exchangers in HVAC systems. In
addition, several desiccant cooling evaporative systems (direct and indirect) have been designed
that employ desiccant wheels as a dehumidifier and energy and/or heat wheel as air-to-air energy
exchangers (Rafique et al., 2015). As another application in the food and mining industries, new
configurations have been developed for desiccant wheels as an industrial dryer (Chua & Chou,

10
2003). With more emphasis on renewable energy, solar desiccant integrated A/C systems use solar
energy to assist the regeneration of desiccant wheels (Ge et al., 2014). Numerous studies have been
conducted to study the wheel operation and investigate methods to improve their performance. In
this section, a brief statistical overview of data published on wheels (as a single device or as a
system component) between 1990 and 2015 is given; whereas, more details on the most related
literature are provided at the introduction sections of chapters 2-5. The results have been collected
by searching the words “Energy Wheel”, “Enthalpy Wheel”, “Desiccant Wheel”, and “Heat
Wheel” through the online databases: Engineering Village (www.engineeringvillage.com), Scopus
(www.scopus.com), Science Direct (www.sciencedirect.com), and ASME
(asmedigitalcollection.asme.org). Figure 1.5 shows the number of published journal articles per
year from 1990 to 2015. It should be noted that duplicate papers from the different databases are
removed from the search results.
Figure 1.5-Classification of the 416 journal papers on rotary wheels as a single device or a
systems component published between 1990 and 2015 as found in Engineering Village,
Scopus, Science Direct, and ASME databases
0
10
20
30
40
50
60
Art
icle
per
yea
r
Year
Heat wheel
Eergy wheel
Desiccant Wheel
System
Energy wheels
21%20%
14%4%

11
The results in Figure 1.5 clearly indicate an increasing trend in the number of articles,
especially after 2010. Although numerous investigations have been conducted on wheel integrated
systems, studying the wheel as a single device has the highest contribution. This fact reflects the
overall complexity of coupled heat and moisture transfer in the desiccant coated wheels which
remains to be fully understood. Figure 1.6 gives a statistical overview of the methodologies used
in the wheel studies as a single device. Although several enhanced analytical models and numerical
simulations have been proposed throughout these years, experimental investigations are still very
common, 39%, where more than 90% of the experiments were performed on full-scale wheels. As
discussed in section 1.2.4, full-scale testing has several practical challenges and experimental
limitations, such as constructing a full-scale wheel and providing the testing conditions according
to standards AHRI conditions, given in Table 1.1. Therefore, developing an alternative small-scale
testing methods would be beneficial for wheel performance testing which has received relatively
little attention.
A breakdown of the major topics and objectives with the portion of contribution covered
in the previous wheel studies is given in Figure 1.7. The papers are divided into three main
categories Operation (50%), Testing (5%), and Design (45%). In addition, a list of the main
parameters investigated in each category is given in Figure 1.7. Based on Figure 1.7, much focus
has been on the design and the operating conditions of wheels with little emphasis on the testing.
According to the design parameters listed in Figure 1.7, studying the design parameters at different
operating conditions requires hundreds of tests which equates with huge amount of testing time
and cost. Therefore, this Ph.D. thesis targets the gap in the literature and attempts to develop an
alternative testing method (known as transient component testing) based on the transient method
presented in section 1.2.4.

12
Figure 1.6-A classification for the methodologies used to study the rotary wheels in the
majority of journal papers published between 1990 and 2015
Figure 1.7-A breakdown of common topics reported in the majority of published journals
on wheel studies between 1990 and 2015
39%42%
20%
Methodology
Experimental
Numerical
Analytical
92%
8%
Full-scale
small-scale
Testing method
Objective classification with percentage of contribution in the wheels studies between 1990-2015
Operation Testing Design
Control strategies
Uncertainty analysis
Transient testing
Small-scale testing
Matrix geometry
Matrix material
• Channel height and pitch • Channel maldistribution • Channel shape • Channel thickness • Wheel thickness • Wheel porosity • Purging section • Ratio of supply to exhaust area
• Thermal conductivity • Heat capacity
Coating and desiccant
• Sorption capacity • Sorption rate • Desiccant types • Durability • Sorption isotherm
Operating conditions
• Climate zones • Supply and exhaust Flow rates • Supply and exhaust humidity • Wheel speed • Regeneration temperature
• Thermal and latent response of heat wheel and energy wheel
• Effectiveness calculation and Comparison with AHRI results
• Small-scale wheel • Small section of full-scale wheel
• Uncertainty analysis for steady-state testing
• Uncertainty analysis for the transient testing
45% 5% 50%

13
Objectives
The main aim of this Ph.D. study is to develop a transient method for testing components
of heat wheels and energy wheels. The hypothesis is that it is possible to predict accurately the
performance of a full-scale wheel by conducting small-scale transient tests on the wheel
components (i.e. materials and coating). For heat wheels, the component is a few sheets of the heat
wheel; whereas, the sheets are coated with the desiccant material in the case of energy wheels. A
modified version of the transient testing method, mentioned in section 1.2.4, is used in this study.
This method of component testing is novel and has not been reported elsewhere in the literature.
Transient testing of components enables one to quantify the effects of the desiccant physical and
sorption properties on the wheel performance with reduced testing time and cost. It is believed that
such a fundamental investigation would be beneficial for better understanding the operation and
design of wheels. Therefore, the objectives of this Ph.D. study are defined as follows:
1. To develop a novel testing facility for performing the transient testing on heat and energy
wheel components.
2. To predict the full-scale heat wheel effectiveness with its uncertainty and to investigate the
relationship between the sensible effectiveness and operating conditions.
3. To predict the full-scale energy wheel effectiveness with its uncertainty and to investigate
the relationship between the latent effectiveness and operating conditions.
4. To identify the effects of physical, chemical, and sorption properties of the desiccant on
the latent effectiveness of energy wheels.
Publications
The outcome of the current Ph.D. study have been presented in 6 peer-reviewed journal
papers, 1 conference paper, and 1 poster presentation. Four of the journal papers are published and
two are under review.

14
Refereed Journal Papers
1. F. Fathieh*, R. W. Besant, R. W. Evitts, C. J. Simonson, “Determination of air-to-air heat
wheel sensible effectiveness using temperature step change data”, International Journal
of Heat and Mass Transfer, 2015, 87, pp 312-326.
2. F. Fathieh*, R. W. Besant, R. W. Evitts, C. J. Simonson, “The effects of Heat Loss/Gain
on the Sensible Effectiveness of Heat Wheels Determining from Transient Single Step
Testing”, ASME Journal of Thermal Science and Engineering Application, 2016, 8,
0311003-1-12.
3. F. Fathieh*, M. Rafati Nasr, S. Sadeh, R. W. Besant, R. W. Evitts, J. Müller, C. J. Simonson,
“Determination of Air-to-Air Energy Wheels Latent Effectiveness Using Humidity Step
Test Data”, International Journal of Heat and Mass Transfer, Accepted, July 2016.
4. F. Fathieh*, M. Nezakat, R. W. Evitts, C. J. Simonson, “Effects of Physical and Sorption
Properties of Mesoporous Silica Gel on Dehumidification Performance of Energy
Wheels”, ASME Journal of Heat Transfer, Submitted, March 2016.
5. F. Fathieh*, L. Dehabadi, L. D. Wilson, R. W. Besant, R. W. Evitts, C. J. Simonson,
“Sorption Study of a Starch Biopolymer as an Alternative Adsorbent for Energy Wheels”,
ACS Sustainable Chemistry & Engineering, 2016, 4, issue 3, pp 1262-1273.
6. L. Dehabadi, F. Fathieh*, L. D. Wilson, R. W. Evitts, C. J. Simonson, “Study of
Dehumidification and Regeneration in a Starch Coated Energy Wheel”, ACS Sustainable
Chemistry & Engineering, Submitted, June 2016.
* Corresponding author

15
Conference Papers and Posters
1. F. Fathieh, R. W. Besant, R. W. Evitts, C. J. Simonson, “Sorption Changes after Milling
Silica Gel Particles to Micron Sizes”, Proceedings of the 24th CANCAM, Saskatoon, SK,
Canada, June 2013.
2. F. Fathieh, R. W. Besant, R. W. Evitts, C. J. Simonson, “Effects of Physical and Sorption
Properties of Silica Gel on the Performance of Energy Wheels”, Poster Presentation,
ASHRAE Saskatoon Chapters Regional Conference, Saskatoon, SK, Canada, May 2016.
Thesis Outline
The current thesis is a collection of the refereed journals listed in section 1.4. Each chapter
of the thesis is comprised of a separate publication that addresses one or more of the thesis
objectives, Figure 1.8. Manuscripts are slightly modified to present the material in a logical
sequence and to follow the thesis formatting style. In order to avoid repetition, the background,
overview, and applications are omitted from the introduction section of each paper as they are
thoroughly presented in chapter 1 of the thesis. In addition, the experimental facility is only
described in chapter 2 (for heat transfer) and chapter 4 (for mass transfer). The analytical analysis
is presented only in chapter 2 and 3 and is referenced in the other chapters. Figure 1.8 shows the
outline of the thesis with the objectives addressed in each chapter. A brief overview of each chapter
and the authors’ contributions to each paper are also given at the beginning of each chapter. Note
that the authors’ contributions are included only when the paper is co-authored by more than one
graduate student.

16
Figure 1.8-Thesis outline with the objectives and manuscript title for each chapter
CHAPTER 1: INTRODUCTION
CHAPTER 2: TRANSIENT TESTING OF HEAT WHEELS Manuscript: Determination of Air-to-Air Heat Wheel Sensible Effectiveness Using
Temperature Step Change Data
Objective #1: To developing a novel testing facility for performing the transient
testing on heat wheels component
CHAPTER 3: HEAT LOSS/GAIN IN TRANSIENT TESTING OF HEAT
WHEELS Manuscript: Effects of Heat Loss/Gain on the Transient Testing of Heat Wheels
Objective #2: To predict the full-scale heat wheel effectiveness with its uncertainty
and to investigate the relationship between the sensible effectiveness
and operating conditions
CHAPTER 4: TRANSIENT TESTING OF ENERGY WHEELS Manuscript: Determination of Latent Effectiveness in Regenerators Using
Humidity Step Test Data
Objective #1: To developing a novel testing facility for performing the transient
testing on energy wheels component
Objective #3: To predict the full-scale energy wheel effectiveness with its
uncertainty and to investigate the relationship between the latent
effectiveness and operating conditions.
CHAPTER 5: EFFECTS OF DESICCANT PHYSICAL PROPERTIES ON
MOISTURE RECOVERY Manuscript: Effects of Physical and Sorption Properties of Mesoporous Silica Gel
on Dehumidification Performance of Energy Wheels
Objective #4: To identify the effects of physical, chemical, and sorption properties
of desiccant on the latent effectiveness of energy wheels
CHAPTER 6: EFFECTS OF DESICCANT CHEMICAL COMPOSITION ON
MOISTURE RECOVERY Manuscript: Sorption Study of a Starch Biopolymer as an Alternative Desiccant
for Energy Wheels
Objective #4: To identify the effects of physical, chemical, and sorption properties
of desiccant on the latent effectiveness of energy wheels
CHAPTER 7: SUMMARY, CONCLUCIOSN AND RECOMMENDATIONS
FOR FUTURE WORK
APPENDIX A: COPY RIGHT PERMISSIONS

17
CHAPTER 2
2 TRANSIENT TESTING OF HEAT WHEELS
Overview
This chapter mainly addresses the first objective of this Ph.D. research which is “to develop
a novel testing facility for performing the transient testing of heat wheel components”. In this
chapter, the heat wheel component, a small-scale parallel-plate heat exchanger, is introduced and
the experimental facility with instrumentation are thoroughly described. Sensors calibration,
uncertainty analysis, and experimental validation are also presented in this chapter. The chapter
focuses on heat transfer (no moisture transfer) while the extension of the test facility and study of
moisture transfer in energy wheels will be presented in chapter 4.
In addition to the first objective, the second objective, “to predict the full-scale heat wheel
effectiveness with its uncertainty and to investigate the relationship between the sensible
effectiveness and operating conditions” is partially addressed in this chapter. To address the second
objective of this Ph.D. thesis, this chapter studies the effects of operating conditions (including
airflow velocity, wheel speed, and temperature difference) on sensible effectiveness. In addition,
cyclic tests are conducted to validate the predicted results obtained from transient testing. Finally,
a comparison between the sensible effectiveness obtained from the transient component testing
and the literature correlations are presented at the end of the chapter. This manuscript was
published in the International Journal of Heat and Mass Transfer in August 2015.

18
Determination of Air-to-Air Heat Wheel Sensible Effectiveness Using Temperature Step
Change Data
Farhad Fathieh *, Robert. W. Besant, Richard. W. Evitts, Carey. J. Simonson
Abstract
The determination of the effectiveness of large heat wheels using standard measured data
and test conditions can be very expensive and time consuming. The main contribution of this
chapter is to test heat wheel components rather than the wheel itself. In addition, this chapter
discusses the uncertainty in sensible effectiveness obtained by performing a transient step change
on the exchanger matrix materials. In this chapter, the sensible effectiveness of heat wheels was
predicted by performing a number of cyclic and single step change transient experiments on a
wheel component (i.e. parallel-plate heat exchanger). A new experimental facility was developed
to cause a step change for the inlet air temperature of the exchanger. In the cyclic tests, the heat
exchanger was exposed to a periodic inlet temperature steps; afterward, the sensible effectiveness
of parallel-flow and counter-flow heat wheel, comprised of the same material as parallel-plate
exchanger was determined using the obtained temperature profiles. It was found that the cyclic test
can be used to determine the sensible effectiveness of heat wheels with a parallel-flow arrangement
for a range of angle ratios (1 < ψ < 20). However, a high uncertainty (±20%) was found in the
sensible effectiveness of counter-flow heat wheels when ψ > 2. In the single step-change test, a
time constant was assigned to the exchanger response when it was subjected to a step change in
the inlet temperature. The time constant was obtained by fitting the experimental data to a first
order exponential time response curve. An analytical solution states that the effectiveness of the
heat wheel depends only on the product of the time constant and the wheel angular speed, or angle

19
ratio. Comparing values of the sensible effectiveness calculated through available empirical
correlations and the ones obtained by single step change experiment showed less than 3%
difference in results when the heat capacity rate ratio is greater than 5. It was concluded that due
to simplicity, accuracy, and low cost of the single step change experiments, it could be an
alternative testing method to determine the effectiveness of heat wheels operating at a specified
range of angular speed, provided the flow channel geometries and Reynolds numbers for both the
wheel and the small-scale test cell.
Introduction
Many studies have been done to investigate the sensible effectiveness of heat recovery
wheels both theoretically and numerically. Some researchers attempted to solve the partial
differential governing equation applied within the wheels’ flow channels under simplifying
assumptions (Baclic, 1985; Romie, 1988). However, due to complexity and inaccuracy in the
results, the solutions were not appreciated by wheel designers and manufacturers. Instead, most of
the reliable data is in the form of a correlation proposed by Kays and London (Kays & London,
1984). They derived a correlation based on the results of a comprehensive study on heat
regenerative wheels done by others (Lamberston, 1958; Bahnke & Howard, 1964). For the same
supply and exhaust air heat capacity rate, their correlation can be simplified as follow:
93.1*9
11
1rCNTU
NTU (2.1)
where a dimensionless term NTU = (hAht)/(�̇�acp,a) is number of transfer unit in which h is the
convective heat transfer coefficient, Aht is heat transfer surface area, �̇�a and cp,a are the mass flow
rate and specific heat capacity of the air, respectively. The heat capacity rate ratio, Cr*is defined
as follows:

20
,*
,
p m
r
a p a
MCC
m C
(2.2)
and M and cp.m are the mass and specific heat capacity of the matrix, respectively. The symbol ω
represents the angular frequency of the wheel.
Even though the Kays and London correlation provides useful information about
performance of the wheels, its application is limited to high rotational speeds, Cr*> 1. More
recently, a simpler analytical solution for the effectiveness of heat wheels was presented in 2002
(Buyukalaca & Yilmaz, 2002, 2003) which can be applied to all wheel rotational speeds.
*
1/42 4
* *. .1 3
1 1
r
r r
C
NTU C NTU C
NTU NTU
(2.3)
The accuracy of these models strongly depends on the convective heat transfer coefficient
inside the wheel channels. An analytical study was done to determine the Nusselt number and
convective heat transfer coefficient inside a constant wall temperature channel from the literature
(Yilmaz & Cihan, 1993). Applying this theory to determine convective heat transfer coefficient,
Yilmaz and Buyukalaca (Yilmaz & Büyükalaca, 2003) found a good agreement between the
experimental and analytical sensible effectiveness of the heat wheel.
Because standard steady-state tests are costly and time consuming, researchers have been
seeking new transient methods to measure data and determine wheel effectiveness (Abe et al.,
2006a, 2006b; Shang & Besant, 2009a, 2009c). They suggested that as a wheel rotates between
supply and exhaust airstreams, the inlet condition can be modeled by a series of increasing and
decreasing step changes in temperature and relative humidity. They developed an analytical model
which can predict the sensible and latent effectiveness of the wheel with acceptable uncertainties

21
by subjecting the wheel to a step change in temperature and/or relative humidity, respectively.
They also conducted a set of experiments on a section of a wheel to determine sensible and latent
effectiveness and verify the analytical model. A good agreement was seen by comparing the
predicted sensible and latent effectiveness to standard steady-state test results. Shang and Besant
(Shang & Besant, 2009a, 2009c) made some corrections to the transient model presented by Abe
et al. (Abe et al., 2006a, 2006b). The modified transient analytical model predicted sensible
effectiveness of energy wheels with corrections for flow entrance effects, axial heat conduction,
carryover, water vapor phase change, and flow channel variations due to manufacturing tolerances.
It was observed that these corrections improved agreement between the transient and steady-state
results. The corrections were seen to be important and small in most cases except for phase change
which can be large for some test inlet conditions.
The main goal of this chapter is to predict the sensible effectiveness of a heat wheel by
performing transient step change experiments on a wheel component (a small-scale, parallel-plate
heat exchanger). The small-scale heat exchanger used in this study was made of an identical
material to an industrial heat wheel matrix. Testing a small-scale exchanger is beneficial for
paramet studies and allows the researchers and designers to test a proposed wheel matrix material
before constructing a wheel and before building a wheel cassette with all the sealing, casing, and
external driving systems. In addition, the transient test can be performed by a more convenient
testing facility compared to standard steady-state tests. Another contribution of this chapter is to
assess different testing conditions, including the amplitude of step change and air flow rate, for
transient tests. In this chapter, the uncertainty analysis for the transient test was studied which have
not been accurately addressed in previous studies. The same theoretical relations and experimental

22
procedure proposed for energy recovery wheels by others (Shang & Besant, 2009a, 2009c, Abe et
al., 2006a, 2006b).
For wheel component testing, an experimental test cell was described with all the
measurement instrumentation. The effects of the supply and exhaust flow rate and amplitude of
step change on effectiveness were also investigated through a set of experiments. Furthermore, a
comprehensive uncertainty analysis was conducted for different operating conditions. A
comparison between the results of single and cyclic step changes and their uncertainties were
investigated. Finally, the sensible effectiveness found by single step change experiment was
compared to results determined using correlations in literature.
Theory
As discussed, the inlet condition of heat wheels varies as it rotates between the supply and
exhaust airstreams. These variations in inlet conditions can be mathematically modeled by a series
of step changes. An analytical solution was presented in the literature to model transient response
of a heat (energy) wheel by integrating the governing equations (continuity, momentum, energy,
and state equations for both flow and matrix) within its channel (Abe et al., 2006a, 2006b; Shang
& Besant, 2009c). It was shown that the airflow temperature at the outlet of rotary wheels behaves
similar to a first order linear system with the forcing function of inlet temperature In their analysis,
they assumed that the entrance effects, carry-over of air flow due to wheel rotation, axial heat
conduction in the matrix, and flow channel hydraulic diameter variations are small which can be
accounted for as small corrections to the linear theory. Based on their studies, the analytical model
can successfully describe the heat transfer in both heat wheels and energy wheels. They
mathematically modeled the temperature response of the rotary heat wheel as follows:
)(tf
dt
d
(2.4)

23
where τ is the time constant and θ is the normalized temperature given by
( ) o i stt T T T (2.5)
in which ΔTst is the amplitude of the step change and To (t=0) – Ti (t→∞) is the maximum
temperature difference. For a parallel-flow heat wheel where both the supply and exhaust
airstreams enter the wheel at the same side, the periodic forcing function f(t) is expressed as
follows:
1, 0( )
0, 2
tf t
t
(2.6)
The steady-state solution of Eq. (2.4) with periodic step change forcing function, Eq. (2.6)
was found (Kaplan, 1962) as follows:
1
2
1
2
1, 0
1( )
11 , 2
1
t
t
ee t
et
ee t
e
(2.7)
where ψ = ωτ/π is defined as an angle ratio that has the typical range of 1 < ψ < 20 in heat wheels
(Shang & Besant, 2008). The normalized inlet and outlet temperature profiles obtained
respectively by Eqs. (2.6) and (2.7) are shown in Figure 2.1. This figure shows that the outlet air
temperature of the wheel cycles through a range of values much smaller than the step size, e.g.
about 50% of the step change amplitude.

24
Figure 2.1- Normalized inlet and outlet temperature profiles for parallel-flow heat
exchangers.
In case of a single step change instead of periodic series of step changes, Eq. (2.4) is still
applicable with the new forcing function described as follow:
1, 0( )
0, 0
t step increasef t
t step decrease
(2.8)
The solution for the ordinary differential, Eq. (2.4), with the forcing function given by Eq.
(2.8) is found as:
1 , 0
( )
, 0
t
t
e t step increasef t
e t step decrease
(2.9)
Therefore, the same time constant can be achieved through periodic and single step changes
though there might be small deviations due to experimental uncertainties.
The sensible effectiveness of heat wheels is defined as the ratio of the averaged actual heat
transfer rate in each half cycle (double shaded area shown in Figure 2.1) to the maximum possible
heat transfer rate (shaded area shown in Figure 2.1). If the flow temperature profile at the steady-
θ
t π/ω 2π/ω
Θ(t)
0
f(t)

25
state conditions is known, then the effectiveness can be calculated by integrating the area between
the input and output curves by Eq. (2.10 ) (Abe et al., 2006a; Shang & Besant, 2009c).
0dt
(2.10)
Using the temperature profile given by Eq. (2.7), the sensible effectiveness for fully-
developed parallel-flow within the channel is found as (Shang & Besant, 2009c):
21
2
1
1
PF
e
e
(2.11)
It is known that for parallel-flow heat exchangers with equal supply and exhaust flow rates,
the effectiveness can be expressed only as a function of number of transfer units as (Shah & Sekuli,
2003):
211
2
NTU
PF e (2.12)
Combining Eqs. (2.11) and (2.12), the NTU can be expressed by (Shang & Besant, 2009c):
21
2
11
Ln 1 22
1
e
NTU
e
(2.13)
The NTU has the same value for fully-developed flow in both parallel-flow and counter-
flow exchangers with the same inlet condition and channel geometry. For balanced supply and
exhaust flows, the effectiveness of counter-flow exchangers is given by (Shah & Sekuli, 2003):
CF
1
NTU
NTU
(2.14)
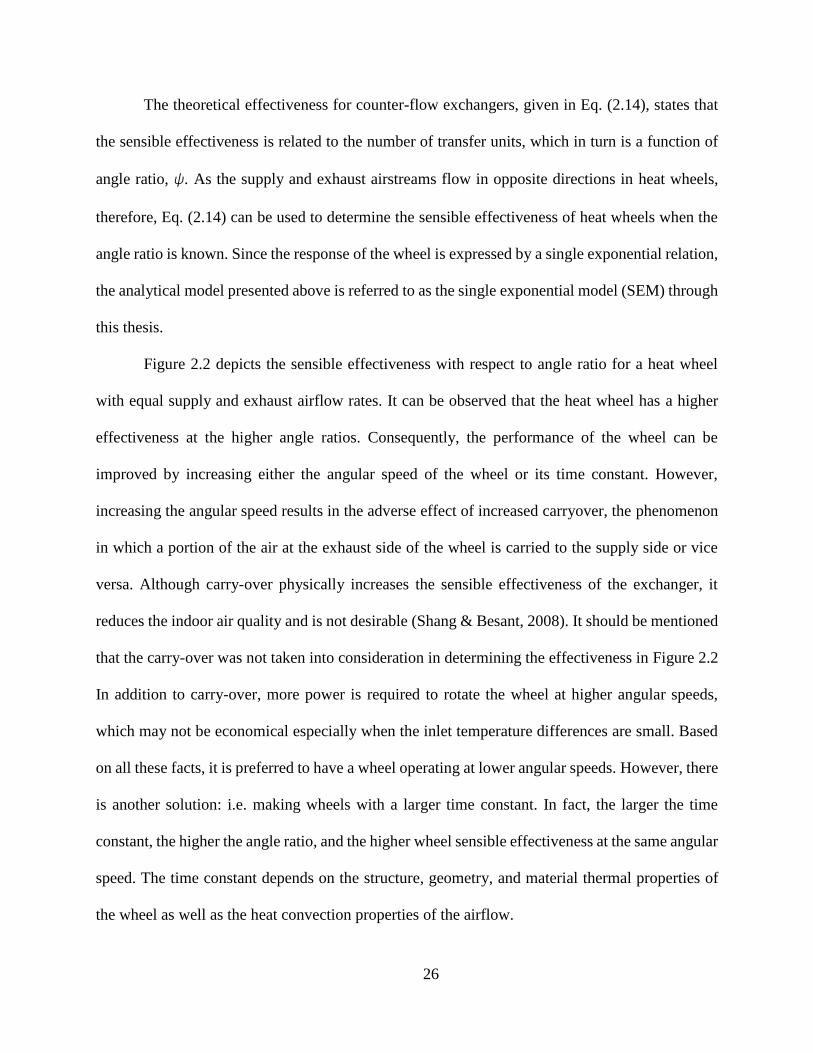
26
The theoretical effectiveness for counter-flow exchangers, given in Eq. (2.14), states that
the sensible effectiveness is related to the number of transfer units, which in turn is a function of
angle ratio, ψ. As the supply and exhaust airstreams flow in opposite directions in heat wheels,
therefore, Eq. (2.14) can be used to determine the sensible effectiveness of heat wheels when the
angle ratio is known. Since the response of the wheel is expressed by a single exponential relation,
the analytical model presented above is referred to as the single exponential model (SEM) through
this thesis.
Figure 2.2 depicts the sensible effectiveness with respect to angle ratio for a heat wheel
with equal supply and exhaust airflow rates. It can be observed that the heat wheel has a higher
effectiveness at the higher angle ratios. Consequently, the performance of the wheel can be
improved by increasing either the angular speed of the wheel or its time constant. However,
increasing the angular speed results in the adverse effect of increased carryover, the phenomenon
in which a portion of the air at the exhaust side of the wheel is carried to the supply side or vice
versa. Although carry-over physically increases the sensible effectiveness of the exchanger, it
reduces the indoor air quality and is not desirable (Shang & Besant, 2008). It should be mentioned
that the carry-over was not taken into consideration in determining the effectiveness in Figure 2.2
In addition to carry-over, more power is required to rotate the wheel at higher angular speeds,
which may not be economical especially when the inlet temperature differences are small. Based
on all these facts, it is preferred to have a wheel operating at lower angular speeds. However, there
is another solution: i.e. making wheels with a larger time constant. In fact, the larger the time
constant, the higher the angle ratio, and the higher wheel sensible effectiveness at the same angular
speed. The time constant depends on the structure, geometry, and material thermal properties of
the wheel as well as the heat convection properties of the airflow.

27
Experimental
Small-Scale Heat Exchanger
The wheel component used for transient testing was a small-scale parallel-plate heat
exchanger. Figure 2.3 shows the parallel-plate heat exchanger with its dimensions. The parallel-
plate exchanger used in the experiments was comprised of 16 sheets of Al-3003. Each sheet was
80 mm x 200 mm and 0.62 ± 0.05 mm thick. A plastic frame, made by 3D printing rapid
prototyping held the sheets in parallel and formed 15 flow channels that had 4 mm height. Thus,
the parallel-plate heat exchanger had an airflow channel hydraulic diameter of 7.2 mm. The
geometric dimensions of the channels with physical and thermal properties of the matrix is given
in Table 2.1.
Figure 2.2- Theoretical sensible effectiveness versus ψ for a heat wheel with equal supply
and exhaust airflow rates
0
10
20
30
40
50
60
70
80
90
100
0 20 40 60 80 100
ε s(%
)
ψ = ωτ/π

28
Figure 2.3-The small-scale heat exchanger geometry with the supporting frame and
geometrical dimensions
Table 2.1-Geometric dimensions of flow channels with the physical and thermal properties
of the sheets Channel Sheets
Width (mm)
b
Length (mm)
L
Height (mm)
h
Hydraulic diameter (mm)
dh
Material Thickness
(mm) δm
Specific heat capacity (J.kg-1K-1)
Cp,m
Density (m3/kg)
ρm
80 200 4 7.6 Al-3003 0.62 893 2730
Transient Test Facility
The test facility, shown in Figure 2.4, was designed to measure the transient response of
the parallel-plate exchanger (wheel component) after exposure to a step change in airflow
temperature at the inlet. The transient testing facility consisted of (1) the supply air system, (2) the
test section, and (3) the sliding and supporting plates.
Supply Air System: An air compressor in line with an industrial dryer provided dry air (3%-
5% RH) to the test section through 25.4 mm (1 inch) inner diameter PVC tubes. To perform the
transient test, two airstreams with different temperature were needed. Thus, the supply air was split
into two airstreams where the flow rate of each was adjusted by a flow controller (MKS-Type
1559A). Depending on flow rates required for each test, three flow controllers with capacities (in
L/min) of 0-50, 0-200, and 0-400 and an accuracy of 2% of the full-scale were used. In addition,
to adjust the temperature of each airstream, two electric heaters with maximum power of 110 W

29
were placed after the flow controllers, where variable transformers (variac) were used to regulate
the supply power of each. The heated air passed through PVC tubes surrounded by 12.5 mm
insulation to minimize heat loss.
The air supply tubes terminated at two 12.5 mm (1/2 inch) Plexiglas ducts of 500 mm
length, shown as duct I and duct II in Figure 2.4. Since the exchanger had a rectangular cross
section, rectangular ducts with the same inner dimensions were installed upstream of the test
section. One inch of extruded polystyrene insulation was put around the ducts to ensure minimal
heat loss or gain during the experiments. In all the tests, the airflow in duct II had ambient
temperature whereas the airflow with elevated temperature passed through duct I. To provide
more uniform bulk temperature in duct I, two stationary air mixers were installed 100 mm from
the top of the duct. In addition, a flow straightener was placed before the exchanger inlet to provide
a uniform velocity profile. The flow straightener was composed of hundreds of 2mm x 3mm
rectangular channels with a length of 100 mm. This setup provided a uniform airflow with the
desired temperature to pre-condition and change the inlet condition of the exchanger.
Test Section
The test section with its dimension is shown in Figure 2.5. The test section was made of
extruded polystyrene insulation which substantially reduced the heat transfer to the surroundings.
The test section consisted of three flow passages. The parallel-plate exchanger was placed at the
middle passage which was the test cell and two other passages were used to bypass the airflow.

30
Figure 2.4-Schematic of the testing facility with the airflow lines, the measurement
instrumentations, and the test section.
Figure 2.5-Test section with the insulation (a) top view (b) side view.
Sliding and Supporting Plates
To subject the parallel-plate exchangers to a step change in inlet air temperature, the inlet
condition must be changed as fast as possible. Thus, the Plexiglas air ducts were designed to be
capable of sliding horizontally. The Plexiglas ducts were attached to a Plexiglas sliding plate from
the bottom. This plate was capable of quick linear motion between two Plexiglas rail-bars and over
a PVC supporting plate, shown in Figure 2.6. The PVC supporting plate with three air passages
RH Relative humidity sensor
TC T-type thermocouples
FC Mass flow controller
PPE Parallel-plate heat exchanger
Dehumidifier
Ball valve
Flow mixer
Flow straightener
Airflow pipeline
2xFC
2xheater
du
ct II
du
ct I
Styrofoam
Insulation
5xTC
9xTC
1xRH
1xRH
5xTC
PVC partP
PE
air com
presso
r
storag
e tank
data
acquisition
system
80 mm 70 mm
Parallel-plate
exchanger 80 mm
550 mm
300 mm 70.4 mm
550 mm
200 mm
300 mm
insulation
Parallel-plate
exchanger

31
was placed on top of the test section. This PVC plate held the rail-bars and provided a flat and
rigid base for the sliding plate to move on. The Plexiglas rail-bars supported the linear motion of
the sliding plate and prevented any lateral movement. To avoid any misalignment of the ducts
before and after a step change, two stoppers were installed at each side of the rail-bars, not shown
in the Figure 2.6. To ensure no airflow leakage through the sliding plate, two toggle clamps were
used to force the sliding plate down onto the PVC plate. The bottom PVC supporting plate, similar
to the top PVC supporting plate, was placed beneath the insulation and fastened to the upper PVC
plate by means of eight threaded rods.
Figure 2.6-Sliding and supporting plates, air ducts, and test section.
Measurements and Data Acquisition System
To determine the transient response and then effectiveness of a parallel-plate exchanger,
the temperature should be measured at locations upstream and downstream of the exchanger. Five
T-type thermocouples installed 5 cm upstream of the exchanger measured the inlet temperature.
The outlet temperature was monitored by nine thermocouples 1 cm downstream of the exchanger.
The arrangement of these thermocouples is shown in Figure 2.7. All the thermocouples were
Plexiglas duct
Top PVC supporting plate
Airflow bypass
passages
80 mm
Plexiglas duct
Plexiglas rail-barsPlexiglas
sliding
plate
Bottom PVC supporting plateTest section
550 mm
80 mm 80 mm
Test cell
80 mm
Cold airstream
Hot airstream

32
calibrated using a Hart Scientific Dry-well Calibrator (model 9107) with a transfer standard bias
uncertainty of ±0.1 °C. The total uncertainty in temperature for the calibration range of 15 to 85
°C was found to be ±0.2 °C. The measured temperatures and flow rates were acquired using a
National Instruments data acquisition system (NI-CDAQ 9174); these were monitored and
recorded each second through Lab View 2010 software.
Experimental Procedure and Test Conditions
In this study two different tests, named cyclic and single step change, were performed on
the wheel component. The same test facilities were used for both tests where the only difference
was inlet conditions. In the single step change test, the heat exchanger inlet temperature was altered
in less than a second and then kept constant through the end of the experiment. In the cyclic test,
the inlet temperature was changed periodically through a number of step changes. In this section
the procedure for each of these tests will be discussed.
Figure 2.7-Schematic of the ducts cross-section with thermocouples arrangement at (a)
duct inlet and (b) exchanger outlet.
(a)50.0 mm
17
.3 m
m1
7.3
mm
(b)50.0 mm
T-type thermocouple

33
Single Step Change Test
In the single step tests, the air inside ducts I and II had different conditions which are given
in Table 2.2 and Table 2.3. To perform the transient single step change experiment, the following
step-wise procedure was followed:
Pre-conditioning period: Conditioned air passed through the ducts for at least one hour
before the step change. Thus, the steady-state condition was achieved at the exchanger
outlet. The steady-state was defined as the condition under which the temperature
variation remains within the thermocouples’ uncertainty, ±0.2 °C, for a period of 30
minutes.
Step change: After pre-conditioning, the step change in temperature was made. In this
step, the inlet temperature was changed in less than one second by sliding the ducts
rapidly. The stoppers put on the rail-bars prevent any misalignment of the ducts. As a
result, the pre-conditioned airflow in duct I passed through the test cell and the heat
exchanger whereas the airflow in duct II purged into the ambient through the bypass flow
passage.
Transient period: The ducts remained in their positions until the outlet temperature
reached the inlet temperature so that the new equilibrium conditions were obtained.
Monitoring the temperature at the inlet and outlet of the test cell during the test, the
response of the heat exchanger was studied.
As discussed in section 2.4, the amplitude of the step change represents the temperature
difference between the supply and exhaust airstreams passing through a wheel. In fact, the
temperature of the supply and exhaust airstreams has different values during the summer and
winter, their difference is not constant throughout wheel operation. In the first set of experiments,

34
the effects of the amplitude of step change on the time constant and the sensible effectiveness were
studied. To alter the step change amplitude, airflow temperatures were adjusted to different values
in duct I while the temperature of airflow in duct II was kept constant at room temperature. The
air condition at the exchanger inlet and the flow rates in each duct are provided in Table 2.2.
It was reported that the flow rate can also alter the time constant and sensible effectiveness
of the heat exchanger (Abe et al., 2006b; Wu et al., 2006). To investigate the effect of flow rate on
the performance of the parallel-plate heat exchanger, a number of step change experiments were
performed at different flow rates. Table 2.3 shows the airflow conditions for these tests.
Table 2.2-Air condition at duct inlet for different amplitude of step change Volumetric flow rate
(± 2 L/min)
Face velocity (± 0.01 m/s)
Redh (± 4)
Air relative humidity
(± 3%)
Cold airstream temperature
(± 0.2 °C)
Hot airstream temperature
(± 0.2 °C)
Step change amplitude (± 0.3 °C)
100 0.34 174 < 4%
23.1 60.6 37.5 23.7 50.7 27.0 22.8 42.9 20.1 24.1 39.9 15.8 22.8 30.1 7.3 23.5 28.3 4.8
Table 2.3- Air flow rates for the step change tests with cold airstream temperature Tc =
22.9 °C and hot airstream temperature Th = 29.8 °C, ΔTst= 6.9 °C. Volumetric flow
rate (L/min)
Volumetric flow rate bias error
(L/min)
Face velocity (m/s)
Rechannel
15 1 0.05 26 25 1 0.09 43 50 1 0.17 87 75 1 0.26 130
100 2 0.34 174 120 2 0.41 209 150 2 0.51 261 200 4 0.68 348 250 4 0.86 434 300 4 1.03 521 350 4 1.20 608

35
Cyclic Test
In the cyclic tests, the exchanger was exposed to a series of step changes in inlet
temperature as given in Table 2.4. The cyclic test provided inlet conditions very similar to heat
wheel operating conditions with a parallel-flow arrangement. The test cell and heat exchanger were
pre-conditioned with the same procedure used for the single step change test. As before, the steady-
state condition was defined where the temperature changes no more than ±0.20 °C for a period of
30 minutes. Then, the cycles of step changes was made by rapidly interchanging duct and duct
in each half a period. In this set of tests, four different periods of 2 min (ω = 3.14 rpm), 4 min
(ω = 1.57 rpm), 8 min (ω = 0.78 rpm), and 16 min (ω = 0.39 rpm) were considered for the cyclic
experiments. For a period of less than 2 min the changes in outlet temperature could not be detected
by the measurement system as the changes were smaller than the uncertainty range of the
thermocouples.
Results and Discussion
In this section, the results of cyclic and single step change experiments are presented and
compared. The effects of flow rate and step change amplitude on the time constants and the
sensible effectiveness are also provided in this section. Uncertainty analysis results are presented
for both cyclic and single step change results. Moreover, a comparison with the correlations in the
literature is presented.
Table 2.4-Airflow conditions in the ducts for cyclic step changes Volumetric flow rate
(±2 lit/min)
Air relative humidity
(± 3%)
Cold airstream temperature
(± 0.2 °C)
Hot airstream temperature
(± 0.2 °C)
Step change amplitude (± 0.4 °C)
T (min) ω (rpm)
100 < 4% 22.9 50.5 27.6
2 3.14 4 1.57 8 0.78
16 0.39

36
Single Step Test Results
2.10.1.1 Exchanger Transient Response
Figure 2.8 provides an example of the exchanger response in terms of outlet temperature
profile normalized by Eq. (2.5). In this test, the inlet temperature was changed through 27 °C, ΔTst
= 27 °C, where the face velocity was 0.34 m/s. The experimental data was correlated using an
exponential function given in Eq. (2.9) using the trust-region optimization algorithm with
MATLAB R2013a (Moré and Sorensen, 19883). The Levenberg-Marquardt method was used to
fit test data by minimizing the sum of squares of the difference between the measured and
calculated temperatures. For the case shown in Figure 2.8, the time constant was found to be 470
s. The coefficient of determination (R2) was found to be 0.993 which indicates how precisely the
single exponential model fits the experimental data.
Figure 2.8-Normalized temperature profile of small-scale heat exchanger with theoretical
fitted curve for a step increase in the inlet temperature (ΔTst = 27 °C, and Vf = 0.34 m/s,
maximum uncertainty in the experimental data is Uθ = ±0.01)
0.0
0.2
0.4
0.6
0.8
1.0
0 500 1000 1500 2000 2500 3000 3500 4000
Norm
ali
zed
Tem
per
atu
re, θ
Time (s)
Fitted curve
experimetnal dataExperimental data

37
2.10.1.2 Effect of Step Change Amplitude on Transient Response
To determine the performance of a wheel through steady-state tests, the temperature of the
supply and exhaust airstreams should be adjusted according to NSI/AHRI 1060-2011
(ANSI/AHRI, 2014), presented in Table 1.1. A question may be raised about testing conditions for
wheel transient testing. Based on the analytical results, it is believed that the time constant must
be independent of the step change amplitude; this in turn means that the obtained effectiveness is
valid for any temperature difference between the supply and exhaust airstreams. To investigate the
effects of step change amplitude on the time constant and the effectiveness, the heat exchanger
was tested under six different step change amplitudes with the conditions listed in Table 2.2. This
set of amplitudes covered the range of temperature difference normally experienced by wheels at
different operating conditions, i.e. 5-35 °C temperature difference between the supply and exhaust
streams.
The time constant and the sensible effectiveness for different step change amplitudes are
listed in Table 2.5 for an angular speed of ω = 0.75 rpm. This value of angular speed is chosen to
maintain the angle ratio within the conventional operating range for heat wheels, 1 < ψ < 20. It
can be observed that changing the step change amplitude from 4.8 to 37.5 leads to a 70 s change
in the time constant which leads to about 0.2% variation in the sensible effectiveness. The
difference between results can be related to the effects of heat loss or even small variations in the
inlet air conditions, such as moisture content or flow rate. Since the sensible effectiveness
variations are very small by changing the amplitude of the step change, it is suggested that an
average value can be assigned for the time constant and the sensible effectiveness with the relative
precision uncertainty. The average values for time constant, angle ratio, and the sensible

38
effectiveness are also given in Table 2.5. The precision of sensible effectiveness, Up,amp, can be
determined by the following relation:
,p ampU St (2.15)
Where S is the precision index defined as the square root of data points standard deviation
and t is the student t-factor based on the 95% of uncertainty bounds on both sides of mean value
(Figliola & Beasley, 2006). For the total number of 6 data points the student t-factor is 2.571.
Figure 2.9 depicts the precision uncertainty coming from step change amplitude for
different values of angle ratio. Different values of angle ratio were calculated by assigning different
values to the wheel angular speed. Then, the precision was determined based on the six values of
sensible effectiveness corresponding to each step change amplitude. It is observed that the
uncertainty increases as the wheel has a lower angle ratio, however, the uncertainty remains less
than 0.5% for ψ > 4. It should be noted that the ± 0.2 K uncertainty in temperature coming from
T-type thermocouples imposes insignificant uncertainty on final results. This is due to the fact that
bias uncertainty in temperature measurement changes the step change amplitude only by a
maximum value of ±0.4 K. A change in the step change amplitude by 32.5 °C caused the
uncertainty of 0.1% in the sensible effectiveness, therefore, the bias uncertainty in temperature
measurement did not affect results by more than 0.1%, which was included in the uncertainty of
0.2% in the sensible effectiveness.

39
Table 2.5-Time constant, NTU, and ɛs of the equivalent full-scale heat wheel obtained by
performing the transient test on the small-scale heat exchanger at different step change
amplitudes, (Vf = 0.34 m/s, ω = 0.75 rpm)
ΔTst (± 0.4 °C) τ (± 6.7 s) R2 ψ NTU εCF
37.5 488 0.995 12.2 3.74 78.9 27.0 501 0.993 12.5 3.77 79.0 20.1 494 0.993 12.4 3.76 79.0 15.8 485 0.993 12.1 3.74 78.9 7.3 470 0.996 11.8 3.71 78.8 4.8 431 0.999 10.8 3.62 78.4
Average 478 - 11.9 3.72 78.8
Figure 2.9-Precision uncertainty in the sensible effectiveness due to temperature difference
between exhaust and supply airstreams (step change amplitude) obtained by the transient
test
Based on the above discussion, the value of temperature difference between the supply and
exhaust airstreams does not play an important role at an angle ratio of greater than 5. In fact, a
precision uncertainty can be assigned to sensible effectiveness to account for step change
amplitude effects.
2.10.1.3 Effect of Flow Rate on the Transient Response
The supply and exhaust flow rates must be kept constant during the test period. The sensible
effectiveness has different values for each specified equal supply and exhaust flow rate that should
be studied. To investigate the effects of flow rates on the time constant and effectiveness, the single
0
0.2
0.4
0.6
0.8
1
1.2
1.4
0 5 10 15 20 25 30
Up
, am
p (%
)
ψave

40
step change experiment was conducted at eleven different flow rates, or face velocities. For all the
tests step change amplitude was ΔTst = 6.9 ± 0.2 °C, as indicated in Table 2.3. Figure 2.10 shows
the time constant found by fitting the experimental data at each face velocity. It can be seen that
the time constant increases rapidly at lower values of face velocities, Vf < 0.1 m/s. On the other
hand, the time constant approaches an almost constant value of 100 s at higher face velocities.
Figure 2.10-Time constants for the parallel-plate heat exchanger response for different
values of face velocities at (ΔTst = 6.9 °C)
The sensible effectiveness at different angular speed is plotted in Figure 2.11. It can be
seen that for all wheel angular speeds, sensible effectiveness decreases as the face velocity
increases. This decrease in the effectiveness is due to the fact that at higher face velocities there is
less flow residence time, which reduces the amount of heat transferred within the wheel channel.
In other words, the NTU is lower at higher face velocities that leads to lower sensible effectiveness.
Based on the results in Figure 2.11, it is preferable for heat wheels to operate at higher angle ratios.
For a built wheel, a larger angle ratio can be achieved by rotating the wheel at higher angular
speeds. However, this amplifies carryover which is not preferable. The amount of carryover is
generally different from wheel to wheel, depending on the wheel design and manufacturing
0
500
1000
1500
2000
2500
3000
0.00 0.20 0.40 0.60 0.80 1.00 1.20 1.40
Tim
e co
nst
an
t (s
)
Face velocity (m/s)

41
quality. Therefore, the optimal angular speed can be found for each wheel (Simonson, 1998). Small
systematic deviations in flow rate measurements, due to flow controller inaccuracies, can lead to
bias uncertainty in the sensible effectiveness of the wheel. In order to take this uncertainty into
account, a power function was determined to be a proper choice to represents the sensible
effectiveness as a function of face velocity. Therefore:
f f
bV aV c (2.16)
Where, Table 2.6 depicts the values of fitting parameters a and b at various wheel angular speeds.
Figure 2.11-Sensible effectiveness with respect to face velocity obtained by performing the
transient test on the small-scale heat exchanger (ΔTst = 6.9 °C)
Table 2.6-Fitting constant and R-squared for power fitting on the sensible effectiveness
versus face velocity for different wheel angular speeds
Angular Speed
ω (rpm)
ε(Vf) = aVfb + c
a b c R2
1 -15.1 0.60 87.5 0.9939 0.5 -19.9 0.68 86.0 0.9932
0.25 -27.7 0.75 84.1 0.9924 0.15 -36.5 0.78 82.8 0.9923 0.1 -45.9 0.74 82.5 0.9927
30.0
40.0
50.0
60.0
70.0
80.0
90.0
0.00 0.20 0.40 0.60 0.80 1.00 1.20 1.40
ε s(%
)
Face velocity (m/s)
Experimental effectiveness,
RPM 1
Experimental effectiveness,
RPM 0.25
Experimental effectiveness,
RPM 0.15
Experimental effectiveness,
RPM 0.1
ω = 1 rpm
ω = 0.25 rpm
ω = 0.15 rpm
ω = 1 rpm
ω = 0.10 rpm

42
With the bias uncertainty of flow controllers, bias uncertainty in the sensible effectiveness
can be calculated by:
f f
f
B,Q B,Q1f fB,εQf B,Q f
f f duct duct
( ) ( ) bU UV V
U U abVQ V A A
(2.17)
Figure 2.12 shows the bias uncertainty in the sensible effectiveness coming from the
uncertainty in flow rates measurement with respect to face velocities at different angular speeds.
It can be seen that the uncertainty decreases as the flow rate increases and rises at the lower angular
speeds. For the typical angle ratio of more than 5 and within the range of face velocities tested, the
bias uncertainty in the sensible effectiveness is less than 1%.
Figure 2.12-Bias uncertainty in sensible effectiveness due to systematic error in flow rate
measurements (UBε,Qf) with respect to angle ratio ψ for different values of the supply and
exhaust flow rate
0.0
0.5
1.0
1.5
2.0
2.5
3.0
3.5
4.0
0 2 4 6 8 10 12 14 16 18 20
Flo
w r
ate
bia
s er
ror
UBε,
Qf (%
)
ψ
face velocity 0.05 m/s
face velocity 0.26 m/s
face velocity 0.34 m/s
face velocity 0.51 m/s
face velocity 1.03 m/s

43
2.10.1.4 Transient Test Uncertainty Analysis
With regard to the ANSI/ASHRAE 84-2013 standard of testing air-to-air heat/energy
exchangers, the uncertainty in measuring the sensible effectiveness found by the steady state test
should not exceed 5% (ANSI/ASHRAE, 2013). Therefore, any alternative testing method must
have a uncertainty of less than 5%. For the single step change transient method presented in this
thesis, the two sources of uncertainty come from fitting the experimental data and systematic
uncertainty of the flow rate and temperature measurements. In this chapter, the regression curves
were determined with 95% confidence bounds, which causes an uncertainty of less than 1.5 s in
the time constant, Uτ95% = ±1.5 s. A bias uncertainty was imposed in the calculated effectiveness
due to curve fitting which was determined using the method of error propagation (Figliola &
Beasley, 2006). It was found that the uncertainty in sensible effectiveness within the tested flow
rates was less than 0.1%. In addition, the bias uncertainty in flow rate measurement was determined
in section 6.1.2. Thus, the total bias uncertainty in sensible effectiveness can be determined as:
f
2 2
B fit B,QU U U (2.18)
Total bias uncertainty versus angle ratio for different face velocities is plotted in
Figure 2.13. The bias uncertainty increases with lowering the face velocity. In addition, for high
angle ratio, ψ >5, the uncertainty decreases to less than 1% for all the face velocity except for Vf
= 0.05 m/s.

44
Figure 2.13-Total bias uncertainty in sensible effectiveness with respect to angle ratio ψ for
different values of supply and exhaust air face velocities obtained through small-scale
transient test (ΔTst = 6.9 °C)
In addition, the temperature difference between the supply and exhaust air imposes a
precision uncertainty of Up,amp= 0.2-05% on the sensible effectiveness. These values include the
uncertainty due to temperature measurements as well. Finally, the total uncertainty, UT, is
comprised of bias and precision uncertainty can be calculated as:
2 2
t,ε B p,ampU U U (2.19)
Since the bias and precision uncertainties are functions of face velocity and wheel angular
speed, the total uncertainty also depends on these two parameters. The total uncertainty in the
sensible effectiveness with respect to angle ratio for a face velocity of 0.34 m/s is given in
Figure 2.14. The uncertainty of less than 2.5% for 1 < ψ < 20 confirms the high accuracy of the
single step change testing method in determining the sensible effectiveness. The results are within
0.0
0.5
1.0
1.5
2.0
2.5
3.0
3.5
4.0
0 2 4 6 8 10 12 14 16 18 20
To
tal
bia
s u
nce
rta
inty
UB
(%)
ψ
face velocity 0.05 m/s
face velocity 0.26 m/s
face velocity 0.34 m/s
face velocity 0.51 m/s
face velocity 1.03 m/s
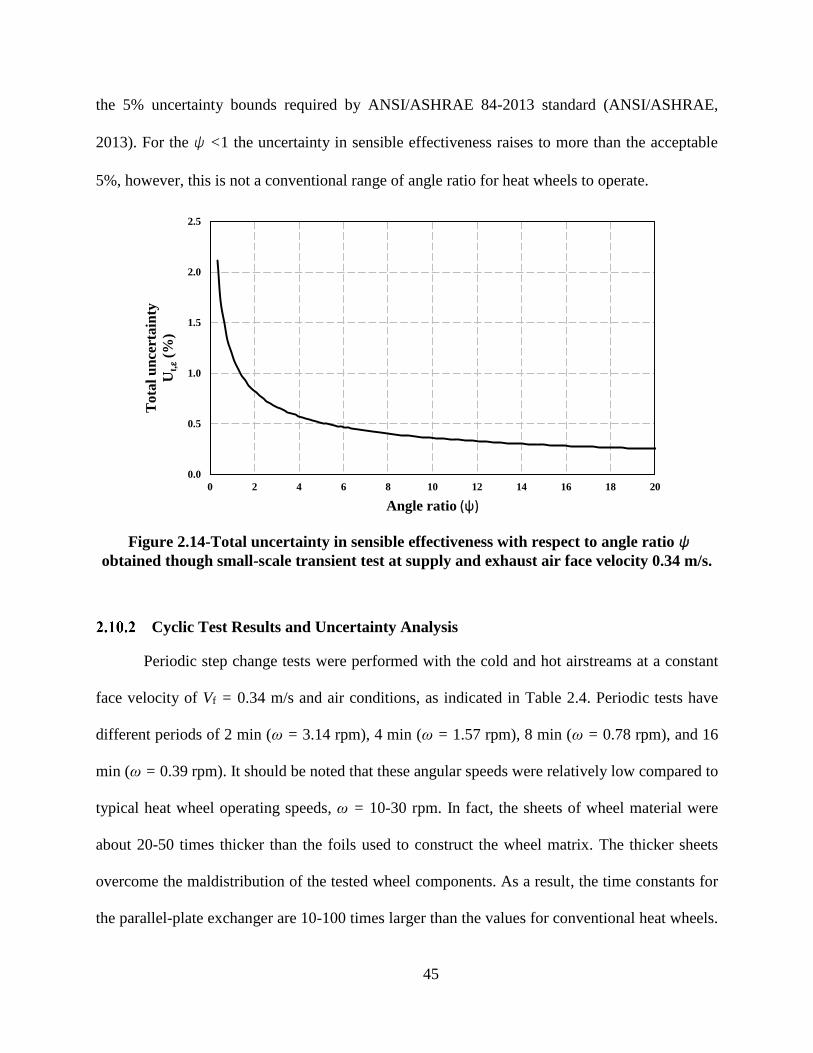
45
the 5% uncertainty bounds required by ANSI/ASHRAE 84-2013 standard (ANSI/ASHRAE,
2013). For the ψ <1 the uncertainty in sensible effectiveness raises to more than the acceptable
5%, however, this is not a conventional range of angle ratio for heat wheels to operate.
Figure 2.14-Total uncertainty in sensible effectiveness with respect to angle ratio ψ
obtained though small-scale transient test at supply and exhaust air face velocity 0.34 m/s.
Cyclic Test Results and Uncertainty Analysis
Periodic step change tests were performed with the cold and hot airstreams at a constant
face velocity of Vf = 0.34 m/s and air conditions, as indicated in Table 2.4. Periodic tests have
different periods of 2 min (ω = 3.14 rpm), 4 min (ω = 1.57 rpm), 8 min (ω = 0.78 rpm), and 16
min (ω = 0.39 rpm). It should be noted that these angular speeds were relatively low compared to
typical heat wheel operating speeds, ω = 10-30 rpm. In fact, the sheets of wheel material were
about 20-50 times thicker than the foils used to construct the wheel matrix. The thicker sheets
overcome the maldistribution of the tested wheel components. As a result, the time constants for
the parallel-plate exchanger are 10-100 times larger than the values for conventional heat wheels.
0.0
0.5
1.0
1.5
2.0
2.5
0 2 4 6 8 10 12 14 16 18 20
Tota
l u
nce
rta
inty
Ut,ε
(%)
Angle ratio (ψ)

46
Thus, considering relatively low angular speeds but large time constants for the wheel component
(parallel-plate exchanger), the angle ratio would be within the range of 1 < ψ < 10. This range
corresponds to conventional range for heat wheels 1< ψ < 20 (Shang & Besant, 2008).
The normalized temperature profile for three cycles of step change with a period of 16 min
is shown in Figure 2.15. The temperature profile was obtained after the exchanger was exposed to
a sufficient number of cycles (more than 30 cycles). Thus, the steady-state temperature profile was
achieved at the exchanger outlet. The temperature was normalized using Eq. (2.5) where ΔTst =
27.6 °C. The bold line shows the inlet temperature profile, which varies between hot and cold air
streams corresponding to 1 and 0, respectively. It can be observed that the normalized outlet
temperature varies between 0.25 and 0.74, which results in an amplitude of oscillation equal to
0.49. Based on the time constant obtained through a single step change experiment, given by Eq.
(2.9), it was possible to predict the periodic temperature profile by Eq. (2.7). Taking the average
time constant from Table 2.5, the predicted temperature profile was calculated and is shown with
a dashed line in Figure 2.15. The comparison proves a good agreement between the temperature
profiles. Small differences between the results can be attributed to heat loss or gain during the
experiments. In addition, the flow within the channels is developing, both thermally and
hydrodynamically with the developing length of xth,FD/L=0.21 and xh,FD/L=0.30, respectively.
Thus, assuming the fully developed flow in the transient testing given in section 2.4 may cause
small deviations in results.

47
Figure 2.15-Normalized experimental and theoretical temperature profiles for cyclic test
(with 16 min period of oscillations and ΔTst = 27 °C, and Vf = 0.34 m/s, maximum
uncertainty in the experimental data is Uθ = ±0.01)
To determine the effectiveness based on the periodic temperature profile, Eq. (2.7) was
used to find the area between the output and input curve within each half a cycle. A ninth order
polynomial is used to precisely fit the the temperature profile. Then, the obtained curve was
integrated. Finding the sensible effectiveness in parallel-flow arrangement, the NTU was
determined from Eq. (2.12). Considering that the NTU was independent of the flow arrangement,
the sensible effectiveness of the counter-flow arrangement was calculated by using Eq. (2.14). To
show the repeatability of the result in different cycles, effectiveness was calculated within 6 half-
cycles at each period by numerical integration of temperature profiles. Then, the precision
uncertainty was calculated by Eq. (2.15) where the student t-factor is 2.571 for six data points.
In addition to precision uncertainty, the bias uncertainty of the area integration should be
taken into consideration. In this set of tests, the bias uncertainty mainly resulted from uncertainty
in temperature profiles, which can be calculated based on calibration results. The bias uncertainty
of ±0.2 K for temperature measurements caused the changes in integration area resulting in bias
Experimental profile
Analytical profile

48
uncertainty in the sensible effectiveness of the parallel-flow exchanger. To determine the bias
uncertainty of sensible effectiveness in a counter-flow exchanger (heat wheel), the method of
propagation of error was used. Detailed calculations are provided in Appendix A. Consequently,
the total uncertainty can be obtained as a combination of precision and bias uncertainty by Eq.
(2.19).
The average value of sensible effectiveness with its total uncertainty at each angular speed
is presented in Table 2.7. In addition, a comparison between the measured effectiveness,
determined by periodic temperature profile of the cyclic test, and the predicted effectiveness,
calculated by time constant obtained through single step change experiment, is given in
Figure 2.16. The predicted values of effectiveness for the parallel and counter flow exchangers are
determined through Eqs. (2.11) and (2.14), respectively, where the angle ratio, ψ, was obtained
from single step change experiments, Table 2.5. The results show that for both flow arrangements
increasing angular speed causes higher sensible effectiveness. In addition, there is good agreement
between cyclic test results and the sensible effectiveness predicted from single step change results
for both parallel-flow and counter-flow exchangers. It can be seen that the sensible effectiveness
of parallel flow can be measured with adequate accuracy with an uncertainty of less than 1.5%.
However, considerable uncertainty can be seen in the effectiveness of the counter-flow exchanger
at higher angular speeds, i.e. UT = 32.5% at ω = 3.14 rpm. The high amount of uncertainty is an
indicator of the propagation of error in calculations. Even though the uncertainty for the parallel-
flow effectiveness is less than 1.5%, the maximum theoretical effectiveness for parallel-flow
exchanger approaches 50% when NTU is infinite. As a result, for an effectiveness of more than
48.5% even a small uncertainty leads to a large variation in NTU, which in turn causes a large
variations in the counter-flow exchanger effectiveness. Even though decreasing the angular speed

49
reduces the uncertainty in a counter-flow exchanger, this can be applied to the cases where the
counter-flow effectiveness is less than 55%, which is far below the performance of industrial
counter-flow exchangers (heat wheels) available on the market. Thus, it can be concluded that
finding the effectiveness of a heat wheel through cyclic step changes performed on a parallel-flow
exchanger with the same geometry and material is not practical.
Table 2.7-Sensible effectiveness of the heat exchanger response found through cyclic test,
(ΔTst= 27 °C, and Vf = 0.34 m/s)
T (min) ω (rpm) εPF (%) Uε,PF(%) εCF (%) Uε,CF(%)
2 3.14 49.8 1.4 74.5 32.5
4 1.57 49.6 1.4 70.7 15.2
8 0.78 49.0 1.4 66.92 8.1
16 0.39 45.8 1.3 55.37 3.6
Figure 2.16-Sensible effectiveness obtained by cyclic and single step tests a heat wheel with
(a) parallel-flow and (b) counter-flow flow arrangement (ΔTst = 27 °C, and Vf = 0.34 m/s)
0.0
10.0
20.0
30.0
40.0
50.0
60.0
0 2 4 6 8 10
ε s(%
)
ψ(a)
0.0
20.0
40.0
60.0
80.0
100.0
120.0
0 2 4 6 8 10
ε s(%
)
ψ(b)
-- Single step test
Cyclic test
-- Single step test
Cyclic test

50
Comparison with the Literature Data
No data was found for a full-scale wheel with the same geometry and materials as in the
small-scale exchanger tested in this chapter. On the other hand, building a full-scale wheel and
carrying out full-scale performing testing was not economically and technically feasible. Thus, in
this section, the predicted sensible effectiveness of the equivalent heat wheel is compared to results
obtained by empirical correlations in the literature (Kays & London, 1984; (Buyukalaca & Yilmaz,
2002). Eqs. (1-3). Measuring airflow rate, mass of sheets, and area of heat transfer, the sensible
effectiveness can be determined by correlations if the convective heat transfer coefficient is
known. In the tests performed in this study, the flow within the exchanger channels was laminar,
i.e. 26 < Re < 626, therefore, the convective heat transfer coefficient value can be taken from the
literature by knowing the channel aspect ratio. It should be noted that at face velocities less than
0.2 m/s, entrance effects were insignificant as the flow was assumed to be both thermally and
hydrodynamically fully developed, xh,FD/L = 0.12 and xth,FD/L = 0.04; whereas, at higher face
velocities there was developing flow through all the channel length, xh,FD/L = 1.99 and xth,FD/L =
1.42. To account for the changes in convective heat transfer coefficient for both thermally and
hydrodynamically developing flow, the tabular results of the average Nusselt number for
simultaneously developing flow were utilized (Shah & London, 1978). The obtained sensible
effectiveness from experiment and correlations are plotted in Figure 2.17. a. It can be seen that the
results show good agreement for high Cr* values, however, the difference between the results
increases as Cr* decreases. To get more information, the difference between the predicted and
correlated sensible effectiveness is given in Figure 2.17.b. Comparing to either of the correlations,
the difference in the sensible effectiveness increases to more than 5% at Cr*< 4. This is expected
since the analytical solution used to predict sensible effectiveness of rotary wheels is developed
for the cases that Cr* > 5. For Cr
*= 5, about 5% and 3% discrepancy is observed comparing the
51
results to Kays and London and Yilmaz and Buyukalaca correlations, respectively. At higher heat
capacity rate ratio, Cr* > 5, the difference between results reduces to less than 3% and approaches
about 1% at Cr*= 20. It should be noted that these values should not be interpreted as the actual
uncertainty in the sensible effectiveness found by the single step change testing method. In fact,
an accurate uncertainty study was not applicable since the literature did not specify the uncertainty
bounds for the sensible effectiveness correlations. The Kays and London correlation is based on
the numerical study of Lamberston (Lamberston, 1958) which does not include any uncertainty in
its tabular results. Yilmaz and Buyukalaca validated the proposed empirical correlations with their
experimental data and reported 2.8-10% difference in the results increasing NTU from 1.2 to 2.3.
However, the comparison was made based on their experiment with specified conditions that were
not the same as this study. Also, the uncertainty in the sensible effectiveness obtained from
experiment was not mentioned, which is normally within the range of ±5%. Considering all these
facts, it can only be claimed that the single step change testing method on stationary parallel-plate
heat exchanger is applicable for predicting the performance of the rotary wheels with Cr* > 5 by
which the predicted sensible effectiveness of the wheel has the uncertainty of less than 3%
compared to that obtained by available correlations. It should be noted that heat loss (or gain) to
the surroundings during the transient test can change the thermal response of the exchanger which
was not considered in the transient model. Further studies are required to fully describe these
effects in the transient testing.

52
Figure 2.17-(a) Sensible effectiveness of the heat wheel obtained by transient experiment
and the literature correlations. (b) Difference between the transient and correlated
sensible effectiveness (ΔTst = 27 °C, and Vf = 0.34 m/s)
Summary and Conclusions
In this chapter, a set of transient experiments was performed on a parallel-plate heat
exchanger to predict the effectiveness of an equivalent heat wheel comprised of the same material
and hydraulic diameter. In the transient tests, the inlet temperature of the exchanger changed
through a step increase/decrease and the step response of the exchanger was studied by monitoring
its outlet temperature. A time constant was determined for response of heat exchanger by fitting
the normalized temperature profile at different airflow rates. Then, the wheel angle ratio was
defined as a ratio of wheel time constant to half of its rotation period. An analytical solution
represented the sensible effectiveness of heat wheels as a function of the angle ratio. Obtaining the
time constant through transient experiment and considering the wheel angular speed, the sensible
effectiveness was calculated at different air flow rates. The results stated that the effectiveness
decreased as the face velocity increased. In addition, increasing angular speed of the wheel led to
an increase in the sensible effectiveness. The uncertainty analysis was performed on the results to
find the uncertainty imposed on the sensible effectiveness due to systematic uncertainty in flow
rate measurements, curve fitting, and changes in amplitude of step change. When Vf = 0.34 m/s,
0
10
20
30
40
50
60
70
80
90
100
0 5 10 15 20
ε s(%
)
Cr*
Kays and London
Transient test
Buyukalaca & Yilmaz
-10.0
-8.0
-6.0
-4.0
-2.0
0.0
2.0
4.0
6.0
8.0
10.0
0 5 10 15 20
Δɛ
(%)
Cr*
Kay&London
Yilmaz & Buyukalaca

53
the uncertainty analysis determined the total uncertainty to be less than 5% when the angle ratio
was between 5 and 20. Finally, the sensible effectiveness of the heat wheel obtained by the
transient test was compared to the sensible effectiveness calculated by empirical correlations in
the literature. It was observed that there was less than 3% difference in results for heat capacity
rate ratio of greater than 5. The difference between the sensible effectiveness values is higher at
low capacity rate ratio, Cr*< 5, which may be due to the uncertainty involved in the transient
experiments, such as heat loss to the surroundings. In general, the outcomes demonstrated that the
single step change transient experiment could predict the effectiveness of heat wheels within
certain operating conditions.
In addition, the sensible effectiveness of parallel-flow and counter-flow heat wheel
configurations was determined by performing a cyclic test on the parallel-plate exchanger. In this
experiment, the inlet condition was changed through a series of step cycles, similar to what occurs
in an actual heat wheel. It was observed that at a constant airflow rate, the effectiveness for both
the parallel-flow and counter-flow heat wheels increased as the periods of the cycles decreased.
The uncertainty analysis showed that the uncertainty in the effectiveness of the parallel-flow
wheels was less than 1.5%. However, the uncertainty in the sensible effectiveness of the counter-
flow wheels, was found to be large, ε = 74.5 ± 32.5%. The high values of uncertainty illustrated
that the cyclic test performed in this study could not determine the effectiveness of counter-flow
heat wheels with low uncertainty.

54
CHAPTER 3
3 HEAT LOSS/GAIN IN TRANSIENT TESTING OF HEAT WHEELS
Overview
The results in chapter 2 revealed that although the component transient testing has great
potential for heat wheel testing, the predicted sensible effectiveness values are lower than the
literature correlations. It was hypothesized that this discrepancy was due to heat loss/gain
occurring during the transient test. Therefore in this chapter, the analytical model is extended to
consider heat transfer with the surroundings. Thus, the main purpose of this chapter is to satisfy
the second objective of the thesis, “to predict the full-scale heat wheel effectiveness with its
uncertainty and to investigate the relationship between the sensible effectiveness and operating
conditions”, which was partially addressed in chapter 2. The first part of this chapter discusses the
modification of the transient analytical model to consider the influence of heat loss/gain and
determines the criteria within which the model is valid. In addition, the effects of heat loss are
experimentally investigated at different step change amplitudes, air flow velocities, and wheel
angular speeds. Finally, a correlation is proposed based on the extended model to determine the
sensible effectiveness as a function of operating conditions, within the tested range.
The manuscript in this chapter was published in the ASME Journal of Thermal Science
and Engineering Applications in February 2016. It should be noted that slight changes have been
applied to the original manuscript to avoid repetition. In particular, the experimental facility and
introduction are not presented in this chapter as they were thoroughly described chapter 2.

55
Effects of Heat Loss/Gain on the Transient Testing of Heat Wheels
Farhad Fathieh, Robert. W. Besant, Richard. W. Evitts, Carey. J. Simonson
Abstract
Heat wheels are used in ventilation systems to recover a considerable amount of sensible
energy required for providing indoor thermal comfort. The transient single step test is a new testing
method developed to determine the sensible effectiveness of heat wheels. In practice, heat loss/gain
may create large uncertainty in the sensible effectiveness obtained through transient testing. In this
chapter, the transient analytical model in the literature was extended to account for heat loss/gain
effects in the transient testing. The results state that in particular operating conditions, the sensible
effectiveness can be affected by more than 10% due to heat loss/gain. The transient testing facility
(introduced in chapter 1) was used to investigate the effects of heat loss/gain on the sensible
effectiveness through transient testing of a small-scale heat exchanger. After decoupling heat
loss/gain effects from transient test data, less than 2% difference was observed in the sensible
effectiveness while the supply and exhaust flow rate was small (Re < 209) and the temperature
difference was ΔTst < 7.0 °C. However, the sensible effectiveness decreased by more than 9%
when ΔTst > 37.5 °C or Re > 600. An empirical correlation was proposed based on the transient
test data that correlates the sensible effectiveness with the heat capacity rate ratio. Comparing the
results of the proposed correlation with data in the literature, less than 2% difference was observed
at a heat capacity rate ratio greater than 0.5 after the heat loss/gain effects were decoupled from
transient test data.
Introduction
Fathieh et al. conducted the transient single step tests on a heat wheel component to predict
the sensible effectiveness of a full-scale wheel (Fathieh et al., 2015). The heat wheel component

56
in their work, was a parallel-plate exchanger made up of identical materials to industrial heat
wheels. Comparing the sensible effectiveness with the experimental data in the literature, the
results were in good agreement at moderate and high angular speeds and while the heat capacity
of the matrix is relatively large compared with the heat capacity of airflow. However, a 5-10%
discrepancy was seen compared to the steady state results in some testing conditions. It was
reported that the difference could be due to heat loss/gain.
Although the second mode was observed in the transient results (Bolster, 2012; Fathieh et
al., 2015), its effects on the results have not been considered until now. Therefore, the main
objective of this study is to take the effects of the second mode on the sensible effectiveness into
consideration. For this reason, the transient analytical model in the literature is extended to
consider the effect of second mode, in the presence of heat loss/gain. In addition, the effects of
heat loss/gain on the sensible effectiveness is investigated by conducting a series of transient tests
with the same procedure provided in the literature (Fathieh et al., 2015). In this research, a test
facility was developed to perform the transient single-step experiment on a small-scale heat
exchanger and predict the sensible effectiveness of a full size heat wheel with the same material.
The small-scale testing facilitate the experiments by reducing the testing time and allowing to
provide and maintain test conditions with laboratory scale facilities. The sensible effectiveness is
modified due to heat loss/gain and a detailed comparison with literature data was carried out. In
addition, an empirical correlation is proposed for the sensible effectiveness with respect to the
capacity rate ratio.
Theory
In practice, a second mode of heat transfer was observed in transient test data which could
be attributed to heat loss/gain during the test (Fathieh et al., 2015). This would change the
temperature profile and, consequently, the sensible effectiveness determined through the transient
57
single exponential model (SEM), discussed in section 2.4. A double exponential model (DEM) is
introduced in this chapter to account for the changes in the temperature due to heat loss and gain.
In this regard, a second term was added to the normalized temperature response of the heat wheel,
Eq. (2.4), that gives:
𝜃(𝑡) = 𝛾𝑤𝜃𝑤(𝑡) + 𝛾′𝜃′(𝑡) (3.1)
The subscript w and superscript ʹ represent the response parameters for heat wheel and heat
loss/gain, respectively, that satisfy the energy balance for both heating and cooling period as
follows:
𝛾𝑤 + 𝛾′ = 1, 𝛾𝑤 ≥ 0 (3.2)
The sign of 𝛾′ can be evaluated from the criterion given in Eq. (3.2). If heat loss occurs
during the test, γ’ is negative. On the other hand, heat gain results in positive γ’. With the periodic
forcing function, given by Eq. (2.6), the solution of Eq. (2.4) with the modification due to heat
loss/gain effect becomes:
𝜃(𝑡) =
{
𝛾w (1 − 𝑒
−1𝜓w
1 − 𝑒−2𝜓w
)𝑒−𝑡 𝜏w⁄ + 𝛾′ (1 − 𝑒
−1𝜓′
1 − 𝑒−2𝜓′
)𝑒−𝑡 𝜏′⁄ 0 ≤ 𝑡 ≤ 𝜋 𝜔⁄
1 − 𝛾w (1 − 𝑒
1𝜓w
1 − 𝑒−2𝜓w
)𝑒−𝑡 𝜏w⁄ − 𝛾′ (1 − 𝑒
1𝜓′
1 − 𝑒−2𝜓′
)𝑒−𝑡 𝜏′⁄ 𝜋 𝜔⁄ ≤ 𝑡 ≤ 2𝜋 𝜔⁄
(3.3)
In which the subscript “w” and superscript “'” represent wheel and heat loss/gain,
respectively. With the equal heat capacity rate of supply and exhaust airstreams, the sensible
effectiveness for cooling or heating periods is calculated by dividing the integral of the normalized
temperature response by the integral of the forcing function within each period (O. Abe et al.,
2006a):

58
휀 =𝜔
𝜋∫ 𝜃𝑑𝑡
𝜋𝜔
0
(3.4)
Replacing normalized temperature, θ, from Eq. (3.3), the sensible effectiveness of the
parallel-flow heat wheel can be expressed by:
휀PF = 휀PF,w + ∆휀′PF = 𝛾w𝜓w
(1 − 𝑒−1𝜓w)
2
1 − 𝑒−2𝜓w
± 𝛾′𝜓′(1 − 𝑒
−1𝜓′)
2
1 − 𝑒−2𝜓′
(3.5)
where 휀𝑃𝐹 is the sensible effectiveness when heat loss/gain occurs within the wheel and 휀𝑃𝐹,𝑤 is
the sensible effectiveness of heat wheel alone with no heat loss/gain. The term ∆휀′𝑃𝐹 represents
the uncertainty in the sensible effectiveness due to heat loss/gain. The sensible effectiveness of a
stationary parallel-flow heat wheel with equal supply and exhaust flow rates can be expressed in
terms of 𝑁𝑇𝑈 as follows (Shah & Sekuli, 2003):
휀PF,w =
1
2(1 − 𝑒−2𝑁𝑇𝑈w) (3.6)
Combining Eqs. (3.5) and (3.6), NTUw can be given in terms of angle ratio as:
𝑁𝑇𝑈w = −1
2𝐿𝑛(휀PF,w) = −
1
2Ln
[
1 − 2𝛾w𝜓w
(1 − 𝑒−1𝜓w)
2
1 − 𝑒−2𝜓w
]
(3.7)
Thus, the sensible effectiveness of the counter-flow heat wheel can be obtained as follows:
휀CF,w =
𝑁𝑇𝑈w1 + 𝑁𝑇𝑈w
(3.8)
According to DEM, the time constant of the heat wheel is the property of the system which
is independent from the forcing function. In fact, in the case of heat loss/gain, the sensible

59
effectiveness can be determined only if the corresponding time constants and weighting factors of
the wheel and heat loss/gain are known. The time constants and weighting factors can be obtained
by performing the single step test. Considering DEM, the solution of Eq. (2.4) is as follows:
𝜃(𝑡) = {
1 − 𝛾𝑤𝑒−𝑡 𝜏𝑤⁄ − 𝛾′𝑒−𝑡 𝜏
′⁄ , 0 ≤ 𝑡 ≤ ∞ 𝑠𝑡𝑒𝑝 𝑖𝑛𝑐𝑟𝑒𝑎𝑠𝑒 (ℎ𝑒𝑎𝑡𝑖𝑛𝑔)
𝛾𝑤𝑒−𝑡 𝜏𝑤⁄ + 𝛾′𝑒−𝑡 𝜏
′⁄ , 0 ≤ 𝑡 ≤ ∞ 𝑠𝑡𝑒𝑝 𝑑𝑒𝑐𝑟𝑒𝑎𝑠𝑒 (𝑐𝑜𝑜𝑙𝑖𝑛𝑔) (3.9)
In the transient single step test, the inlet and outlet temperature are monitored and the
normalized temperature is determined. Then, the time constants and weighting factors are found
by fitting DEM to the experimental data using Eq. (3.9). Finally, the sensible effectiveness is
determined through Eqs. (3.7) and (3.8).
Experimental
The same small-scale exchanger and experimental facility, as described in section 2.5.1
and 2.5.2., were used in this chapter. The test procedure was also identical to the procedure
described in section 2.7.
Test Conditions
It was believed that changing the amplitude of the step change may alter the heat loss/gain
during the experiment. In this regard, the transient single step change test was performed at six
different amplitudes. The amplitude of the step change was adjusted by changing the hot and cold
airstream temperatures at each constant flow rate given in Table 2.2. The face velocity may also
affect heat loss/gain and, consequently, the sensible effectiveness of the heat wheels (Abe et al.,
2006b; Fathieh et al., 2015; Wu et al., 2006). In this chapter, step change experiments were
performed at eleven different flow rates at two amplitudes of step change, ΔTst = 4.8 °C and ΔTst
= 7.0 °C. The face velocities and volumetric flow rates for each test are also provided in Table 2.3.

60
Results and Discussion
Analytical Results
The double exponential model (DEM), provided in section 3.4, was used to obtain the
normalized temperature profile and sensible effectiveness of full-scale, parallel-flow and counter-
flow heat wheels. According to Eq. (3.6) and (3.7), the sensible effectiveness of heat wheels is
only a function of angle ratio. Figure 3.1 shows the sensible effectiveness as a function of wheel
angle ratio, ψw, for the parallel-flow and counter-flow heat wheels with equal supply and exhaust
airflow rates. It can be observed that the sensible effectiveness for both the parallel-flow and
counter-flow rotary exchangers increases as the angle ratio increases. The maximum effectiveness
of parallel-flow wheels is 50% while 100% effectiveness is theoretically achievable for counter-
flow wheels. In practice, conventional heat wheels operate at a counter-flow arrangement with the
angle ratio within the range of 1 < ψw < 20 and a sensible effectiveness of 70-80% (Shang &
Besant, 2008). As shown in Figure 3.1, a wheel is capable of recovering more sensible energy by
increasing its angular speed and/or time constant. It is reported that increasing the wheel angular
speed leads to higher amount of carryover (Shang & Besant, 2008). Carryover occurs if a portion
of the exhaust air is carried to the supply side. Although carryover slightly increases the sensible
effectiveness of the wheel, it reduces the indoor air quality. Thus, it is preferred to lower the wheel
angular speeds and increase the time constant by proper selection of the matrix thermal properties,
air channels geometry, and airflow rate. Moreover, heat loss/gain may considerably change the
time constant in small-scale testing (Shang & Besant, 2009b).

61
Figure 3.1-Sensible effectiveness versus angle ratio (ψw) for (a) parallel-flow and (b)
counter-flow heat wheel with the equal supply and exhaust airflow rates
Figure 3.2 shows the normalized temperature profile for the parallel-flow heat wheel at
different wheel angle ratios calculated from Eq. (3.5) while no heat loss/gain occurs, γ’= 0. It can
be observed that as the wheel rotates, the normalized temperature increases during the heating
period and then decreases in cooling periods. For the case shown in Figure 3.2, the wheel angular
speed was kept constant and the angle ratio was changed by increasing/decreasing the time
constant. Reducing the angle ratio of the wheel leads to larger variations in the normalized
temperature. Moreover, increasing the angle ratio from 10 to 20 has a small impact on the
temperature profile. For extremely large angle ratios, the temperature profile becomes horizontal
and its value approaches 0.5. This would result in the sensible effectiveness of 50% which is the
maximum value for parallel-flow heat wheels, see Figure 3.1.
0
25
50
75
100
0 10 20 30 40
Sen
sib
le e
ffec
tiven
ess
(%)
ψw= ωτ/π
(a)
0
25
50
75
100
0 10 20 30 40
Sen
sib
le e
ffec
tiven
ess
(%)
ψw= ωτ/π
(b)

62
Figure 3.2-Normalized temperature for a parallel-flow heat wheel with equal supply and
exhaust air flow rates at different angle ratios
The effects of heat loss/gain on the temperature profile of a parallel-flow wheel with equal
supply and exhaust airflow are plotted in Figure 3.3. The profiles were computed for two loss time
constants and weighting factors, while the wheel angle ratio was ψw = 20 (τw = 2.5 s and ω = 15
rpm) and the results were compared to the case without heat loss/gain, γ’ = 0. It can be observed
that once γ’ increases the temperature profile changes remarkably. For instance, the maximum
difference in normalized temperature increases from 0.001 to 0.005 as γ’ increases from 0.1 to 0.4
for τw/τ’ = 0.5. It should be noted that even this small difference in normalized temperature would
be considerable if the amplitude of the step change is large. For small values of loss weighting
factor, γ’ < 0.1, the temperature profile variations are trivial for a wide range of loss time constants.
However, the variations in the temperature profile with the loss time constant becomes significant
for larger loss weighting factors.
0.35
0.45
0.55
0.65
Norm
ali
zed
tem
per
atu
re (
θ)
Time0 T/4 T/2 3T/4 T
Heating Period Cooling Period
=
=
=
=

63
Figure 3.3-Normalized temperature profile (θ) of a parallel-flow heat wheel with the equal
supply and exhaust airflow rate for different values of loss weighting factors
The double exponential model (DEM) was used to determine the sensible effectiveness of
a counter-flow exchanger for loss/gain weighing factors of γ’ = 0.1 and γ’ = 0.4. The effectiveness
was calculated for three values of wheel angle ratio (ψw) and the results are graphed as a function
of τw/τ’ in Figure 3.4. For each angle ratio, two curves were plotted corresponding to the upper
and lower bounds for the sensible effectiveness. Depending on the direction of the heat (heat loss
or gain), the effectiveness would increase or decrease. However, the absolute value of the changes
in effectiveness increases as the ratio of τw/τ’ decreases. The upper and lower bounds of sensible
effectiveness approach the wheel effectiveness at high time constant ratios, τw/τ’ >>1. This implies
that the heat loss/gain effects are insignificant when the second time constant is a few times larger
than the wheel time constant. In addition, the effectiveness increases with the wheel angle ratio
which is in accordance with the results of Figure 3.1.
0.45
0.47
0.49
0.51
0.53
0.55
0 T/4 T/2 3T/4 T
No
rm
ali
zed
tem
pera
ture (
θ)
) ′ =
Time (s)
no loss/gain
τw / τ'= 0.5
b) ′ =
0 T/4 T/2 3T/4 T
τw / τ'= 2
no loss/gain
τw / τ'= 0.5
τw / τ'= 2

64
Figure 3.4- The upper and lower limits for the sensible effectiveness of a counter-flow heat
wheel with the equal supply and exhaust airflow rate with respect to the wheel time
constant for different weighting factors and wheel angle ratio ψw
According to the results of Figure 3.4, a critical time constant ratio, (τw/τ’)cr , can be
defined above which less than 2% uncertainty is expected in the sensible effectiveness. In fact, 2%
uncertainty coming from heat loss/gain combined with 2-3% uncertainty in the transient testing
would result in the total uncertainty of less than 5% which is still acceptable according to the
standards. The critical time constant ratio with respect to the loss weighting factor is plotted in
Figure 3.5 for different wheel angle ratios. It can be seen that (τw/τ’)cr increases with loss
weighting factor. In addition, the (τw/τ’)cr is higher if the wheel has a higher angle ratio. In fact,
above the critical point, the heat loss/gain is relatively slow compared to the heat transfer which
occurs between the airflow and the wheel matrix. Consequently, the heat loss/gain has small effects
on the sensible effectiveness. Figure 3.5 gives the critical time constant ratio if the wheel and heat
loss/gain time constants and weighting factors are known. A few analytical studies (Abe et al.,
2006a, 2006b; Shang & Besant, 2009b, 2008) were conducted to relate the wheel time constant to
the matrix thermal properties, channel geometry, and face velocity. Due to the simplifying
assumptions in these works, the results cannot accurately predict the wheel time constant and
/ /
40
50
60
70
80
90
100
0 1 2 3 4 5 6 7 8 9 10
ε s(%
)
a) γ‘ = 0.1
= =
=
=
=
=
0 1 2 3 4 5 6 7 8 9 10
b) γ‘ = 0.4

65
examine the effects of heat loss/gain on wheel time constant. Therefore, a set of transient
experiments was carried out to study the effects of heat loss/gain on wheel time constant and the
results were presented in the next section.
Figure 3.5-The critical ratio of wheel to heat loss/gain time constant (τw/τʹ) above which less
than 2% uncertainty is expected in the sensible effectiveness
Transient Test Results
3.6.2.1 Effects of Step Change Amplitude on the Second Transient Mode
Figure 3.6 shows the transient normalized temperature profile of the small-scale heat
exchanger at different values of step change amplitude. It can be seen that increasing the amplitude
of the step change slightly alters the exchanger temperature response. To quantify the response
variations, the single exponential model (SEM) was used to fit the experimental data with Eq.
(2.7). The data was fitted using the trust-region optimization algorithm in MATLAB R2014a. It
should be noted that SEM does not take the effects of heat loss/gain into account since the loss
weighting factor is equal to zero in this model, γ’=0. The time constant, weighting factors, and
coefficient of determination (R2) obtained through SEM are given in Table 3.1.
0
2
4
6
8
10
12
14
0.0 0.1 0.2 0.3 0.4 0.5
τ w/τ
'
γ'
=
=
= 0

66
Figure 3.6-Normalized temperature response of the small-scale heat exchanger obtained
through transient testing at different step change amplitudes (Vf = 0.34 m/s, maximum
uncertainty in the experimental data is Uθ = ±0.06 and ±0.01 at ΔTst = 4.8 °C and 37.5 °C,
respectively)
Table 3.1-Response characteristics of the small-scale heat exchanger obtained through
transient testing at different step change amplitudes (Vf = 0.34 m/s, Redh = 174)
In fact, the wheel time constant depends on the wheel structure and should not change with
the amplitude of the step change at certain face velocity and angular speeds. However, it was found
that the time constant varies 14% while the amplitude of the step change increases from 4.8 °C to
SEM DEM experiment
0
0.2
0.4
0.6
0.8
1
0
0.2
0.4
0.6
0.8
1
Norm
ali
zed
tem
per
atu
re
(θ)
) ∆ = ) ∆ =
) ∆ = ) ∆ =
Time (s)
0 500 1000 1500 2000 0 500 1000 1500 2000
∆ 𝒔𝒕 °C SEM DEM
(s) R2 ( ) ′( ) ′ R2
4.8 431 0.999 430 0.99 1136 0.01 0.999 7.0 470 0.996 430 0.89 989 0.11 0.999
15.8 485 0.993 430 0.86 1077 0.14 0.998 20.1 494 0.993 430 0.85 1310 0.15 0.998 27.0 501 0.993 430 0.81 1071 0.19 0.998 37.5 488 0.995 430 0.54 1074 0.16 0.997

67
37.5 °C. This could be due to the heat loss to the surroundings which is more significant at higher
temperature. To consider the heat loss effects, the double exponential model (DEM) was also used
to fit the experimental data using eq. (3.9) and eq. (3.3). It was found that at the lowest amplitude
of the step change, ΔTst = 4.8 °C, the fitting parameters obtained through DEM and SEM are almost
identical which states that the heat loss/gain effects are negligible. Therefore, the wheel time
constant is specified with negligible uncertainty due to heat loss/gain at ΔTst = 4.8 °C. With the
fixed wheel time constant obtained at ΔTst = 4.8 °C, DEM model was used to determine the
weighting factors and loss time constant. Table 3.1 lists the time constant, weighting factors, and
coefficient of determination (R2) obtained through DEM. The plots in Figure 3.6 and coefficient
of determination given in Table 3.1 state that both SEM and DEM fit the experimental data
accurately at low amplitude of step change, ΔTst < 15.8 °C. However, at higher amplitudes of the
step change, DEM fits the experimental data better. The values given in Table 3.1 show that heat
loss/gain intensifies remarkably as γ’ increases with the step change amplitude. On the other hand,
the loss time constant slightly changes by increasing step change amplitude. In conclusion, the
amplitude of the step change has a significant impact on the amount of the loss/gain in transient
testing but it does not alter the rate of loss/gain effectively.
With the time constants and weighting factors given in Table 3.1, the sensible effectiveness
was calculated at different step change amplitudes through SEM, described in section 2.4, and
DEM, described in section 3.4. The difference in the SEM and DEM sensible effectiveness is
calculated at each angular speed and the results are plotted in Figure 3.7. The results illustrate that
the difference in sensible effectiveness is less than 2% for the given range of step change amplitude
if ω > 0.7 rpm. However, for 0.1 < ω < 0.7 rpm, more than 5%, appears in the sensible effectiveness
as the amplitude of step change increases, ΔTst > 7.0 °C.

68
Figure 3.7-The difference in the sensible effectiveness of the small-scale heat exchanger
calculated by DEM and SEM (Vf = 0.34 m/s, Redh = 174)
3.6.2.2 Effects of Flow Rate on the Second Transient Mode
The effects of supply and exhaust flow rate on the time constant is presented in Figure 3.8.
According to the weighting factor values for ΔTst = 7.0 °C, given in Table 3.1, the effects of heat
loss are expected to be small enough so that the linear superposition model presented in section
2.2 should be valid. Thus, the amplitude of step changes for flow rate tests was set to 7.0 °C. In
addition, to find the wheel time constant while heat loss effects are insignificant, the tests were
also performed at ΔTst = 4.8 °C at each flow rate. In Figure 3.8, it can be seen that as the flow rate
increases, the outlet temperature reaches its final value faster. The experimental data was
correlated using SEM and DEM and the results are presented in Table 3.2. The results in Table 3.2
clearly state that changing the flow rate alters heat loss/gain effects in transient test. Observing the
SEM correlated curves, it can be found that the model can precisely describe the exchanger’s
response at low Reynolds number, Re < 261. At higher Reynolds number, a second mode appears
which cannot be correlated accurately by SEM while the DEM can precisely correlate the
experimental data even at high Reynolds number. The time constants, weighting factors, and
0.0
1.0
2.0
3.0
4.0
5.0
0 2 4 6 8 10
ε SE
M-ε
DE
M(%
)
ω (rpm)
ΔTst = 4.8 °C
ΔTst = 7.0 °C
ΔTst = 20.1 °C
ΔTst = 27.0 °C

69
coefficients of determination (R2) are listed in Table 3.2. When SEM was used to correlate the
temperature profile, low values of R2 at higher face velocities were found. In contrast, R2 of higher
than 0.99 was seen for DEM at all the flow rates. Moreover, increasing the face velocity amplifies
the heat loss weighting factor, γ’, for the most of the cases.
Figure 3.8-Normalized temperature response of small-scale heat at different flow rates of
the (ΔTst = 7.0 °C, maximum uncertainty in the experimental data is Uθ = ±0.03)
Table 3.2-Response characteristics of the small-scale heat exchanger obtained though the
transient testing at different air flow rates, (ΔTst = 7.0 °C)
Redh 𝑽𝐟(𝐦 ⁄ ) SEM DEM
(s) R2 (s) ′(𝒔) ′ R2
26 0.05 2676 0.999 2784 0.98 8004 0.02 0.999 43 0.09 1672 0.999 1670 0.96 5155 0.04 0.999 87 0.17 832 0.996 745 0.92 2408 0.08 0.999
130 0.26 610 0.997 553 0.91 1686 0.07 0.998 174 0.34 468 0.996 430 0.89 989 0.11 0.999 209 0.41 441 0.958 293 0.81 1706 0.19 0.998 261 0.51 312 0.984 207 0.74 781 0.26 0.998 348 0.68 241 0.907 158 0.85 1696 0.15 0.998 434 0.86 180 0.888 114 0.84 1315 0.16 0.997 521 1.03 139 0.924 69 0.72 470 0.28 0.997 608 1.20 134 0.905 73 0.77 590 0.23 0.997
0
0.2
0.4
0.6
0.8
1
0
0.2
0.4
0.6
0.8
1
a) Redh = 26 b) Redh = 87
c) Redh = 261 d) Redh = 608
0 1500 3000 4500 6000 7500
No
rma
lize
d t
emp
era
ture
(θ
)
Time (s)
0 1500 3000 4500 6000 7500
SEM DEM experiment

70
It should be noted that the time constant of the small-scale exchanger may be different from
the commercial wheels depending on wheels matrix structure and geometry. It was stated that the
time constant is proportional to the heat capacitance of the exchanger (Shang & Besant, 2008);
therefore, with thicker sheets and greater heat capacity, a larger time constant is expected for small-
scale exchangers. The time constant of the small-scale exchanger was compared to the thermal
response of three commercial wheels tested using a single step test in literature (Abe et al., 2006b).
The comparison shows that the time constant of the small-scale exchanger is about 5.6 times larger
than the time constant of commercial wheels at a face velocity of 0.3 m/s.
With the time constants and weighting factors given in Table 3.2, the sensible effectiveness
was determined through SEM and DEM at specified wheel angular speeds. Figure 3.9 shows the
sensible effectiveness with respect to Reynold number at four different wheel angular speeds. The
angular speeds presented in Figure 3.9 are relatively low, ω = 0.1-1 rpm, compared to the angular
speeds of a practical heat wheels, ω = 10-30 rpm. In fact, due to the larger heat capacity of the
small-scale exchanger, its time constant is about 10 times larger than the time constant of the
conventional heat wheels. For similarity study, with the larger time constant, lower angular speeds
are required to limit the angle ratio of small-scale exchanger to that of conventional wheels, 1 <
ψw <10. According to the results in Figure 3.9, the sensible effectiveness decreases as Reynolds
number increases. In fact, as flow rate increases, NTU decreases which in turn lowers the sensible
effectiveness. Comparing the sensible effectiveness obtained by SEM and DEM in Figure 3.9
shows that the difference in the sensible effectiveness is insignificant at low Reynolds numbers,
Re < 209 within the range of the given angular speeds. For instance, at ω = 1 rpm and Re = 130
(ψw = 18), a maximum difference of less than 0.4% in the sensible effectiveness is seen, whereas,

71
the difference increases to 1.6% when the angular speed is reduced to ω = 1 rpm (ψw = 18).
However, the difference in sensible effectiveness increases more than 9% when Re > 608.
Comparison with Literature Data
To study the effects of heat loss/gain in small-scale transient testing, the calculated
effectiveness through the SEM and DEM models were compared to correlations proposed in the
literature (Kays & London, 1984; Buyukalaca & Yilmaz, 2002; Yilmaz & Cihan, 1993), given by
Eq. (2.1) and Eq. (2.3). Moreover, the sensible effectiveness obtained through SEM and DEM in
this study were used to develop a correlation as follows:
휀휀0⁄ = 1 −
1
𝑎𝐶𝑟∗𝑏 (3.10)
Figure 3.9-Comparison of the sensible effectiveness calculated by SEM and DEM at
different flow rates and wheel angular speeds (ΔTst = 7.0 °C, sample error bars show the
maximum uncertainty in the effectiveness values obtained from SEM and DEM)
0
20
40
60
80
100
a) ω =1.00 rpm b) ω =0.50 rpm
0
20
40
60
80
100
c) ω =0.25 rpm d) ω =0.10 rpm
Sen
sib
le e
ffec
tiv
enes
s (%
)
0.0 0.2 0.4 0.6 0.8 1.0 1.2 1.4
0 100 200 300 400 500 600 700 0 100 200 300 400 500 600 700
0.0 0.2 0.4 0.6 0.8 1.0 1.2 1.4
𝑽𝐟 𝐦 ⁄

72
The effectiveness of the stationary wheel (ε0) can be determined if the number of transfer
units of the stationary wheel 𝑁𝑇𝑈 = (ℎ𝐴ht)/(�̇�𝐶𝑝 )𝑎 is known. With the known flow rate and
total heat transfer surface area, NTU could be calculated if the convective heat transfer coefficient
was known. In this set of experiments, the flow inside the channels was laminar and developing,
both thermally and hydrodynamically. To account for the changes in convective heat transfer
coefficient due to entrance effects, the tabular results of the average Nusselt number for
simultaneously developing flow in literature was used (Shah & London, 1978). The calculated
NTU0 values are given in Table 3.3.
Table 3.3-Fitting parameters and coefficient of determination (R2) for Eq. (3.10)
Re Ntu0 SEM DEM
a b R2 R2
26 43.3 3.9 ± 0.3 1.20 ± 0.02 0.956 3.9 ± 0.3 1.20 ± 0.02 0.956 43 26.0 3.8 ± 0.3 1.24 ± 0.02 0.957 3.8 ± 0.3 1.26 ± 0.02 0.964 87 13.1 4.1 ± 0.3 1.34 ± 0.03 0.982 3.3 ± 0.3 1.35 ± 0.03 0.986
130 8.8 5.4 ± 0.4 1.44 ± 0.03 0.996 5.1 ± 0.4 1.45 ± 0.04 0.998 174 6.7 7.0 ± 0.5 1.58 ± 0.05 0.993 6.4 ± 0.5 1.52 ± 0.04 0.995 209 5.5 9.2 ± 0.7 1.65 ± 0.05 0.992 6.6 ± 0.5 1.54 ± 0.04 0.966 261 4.4 11.0 ± 0.8 1.75 ± 0.06 0.991 6.5 ± 0.5 1.52 ± 0.04 0.973 348 3.3 15.0 ± 1.1 1.59 ± 0.05 0.982 6.9 ± 0.4 1.51 ± 0.04 0.987 434 2.7 12.5 ± 0.9 1.68 ± 0.06 0.940 6.6 ± 0.4 1.48 ± 0.03 0.950 521 2.3 19.1 ± 1.3 1.87 ± 0.07 0.961 5.4 ± 0.4 1.43 ± 0.03 0.988 608 2.0 18.2 ± 1.3 1.86 ± 0.07 0.953 5.9 ± 0.4 1.43 ± 0.03 0.979
Average 9.9 ± 3.9 1.56 ± 0.16 5.4 ± 0.9 1.43 ± 0.08
With the transient test data and the sensible effectiveness obtained through SEM and DEM,
Eq. (3.10) was used to determine fitting parameters a and b. Table 3.3 lists the values of a and b
at different Re numbers. For all the cases, the coefficients of determination exceeds 0.95, for 95%
confidence bounds, which represents a strong fitting. It can be seen that while Eq. (3.10) was used
to correlate SEM results, the values of fitting parameters increased with flow rate. However, there
was only a slight change in the values of a and b while DEM results were used. At the lower flow
rates with trivial heat loss/gain, the values for fitting parameters are almost identical for both SEM
and DEM. Nevertheless, a large discrepancy is seen between SEM and DEM fitting parameters at

73
higher flow rates when heat loss/gain is considerable. According to the results of Table 3.3, average
values can be assigned to fitting parameters obtained by DEM. In contrast, due to large variations
in the SEM results, averaging the values for fitting parameters would result in a high uncertainty
in the averaged values.
A comparison between the values of sensible effectiveness calculated from correlations in
the literature and the new correlation is shown in Figure 3.10. Moreover, the differences between
the correlated values are plotted in Figure 3.11. According to the results, good agreement is seen
between the SEM and Kays and London correlated effectiveness values, whereas, more than 5%
difference is observed at Cr* < 2. In contrast, the effectiveness values obtained from the DEM
correlation follow the Yilmaz and Buyukalaca correlation which is more accurate. For the range
of the NTU0 tested, the DEM correlation gives more accurate effectiveness within the range of 0.5
< Cr* < 10, while, at Cr* > 10 less than 2% difference in SEM and DEM correlated effectiveness
is achieved. In fact, the fitting parameters vary with the air and matrix heat capacity, convective
heat transfer coefficient, heat transfer area, and the wheels angular speed. A detailed study is
needed to relate fitting parameters to wheel physical and thermal properties.
Figure 3.10-Comparison between the sensible effectiveness of the heat wheel calculated
from Eq. (3.10) and the correlations in literature for a) NTU0 = 13.1 and b) NTU0 =2.3
40
50
60
70
80
0 5 10 15 20
ε s(%
)
Cr*
a) NTU0 = 13.1
SEM
DEM
Kays & Londan
Yilmaz & Buyukalaca
0 5 10 15 20
Cr*
b) NTU0 = 2.3
SEM
DEM
Kays & Londan
Yilmaz & Buyukalaca

74
Figure 3.11-The difference between the sensible effectiveness of a heat wheel obtained
through literature correlations and the correlation in Eq. (3.10) using a) SEM b) DEM
Summary and Conclusions
The transient single exponential model (SEM) relates the sensible effectiveness of a rotary
heat wheel to its angular speed and time constant, τw. The time constant of a wheel can be obtained
through its temperature response to a step change in the wheel inlet temperature. In this chapter, a
double exponential model (DEM) was presented to modify the SEM due to the heat loss/gain
occurring during the transient testing. The loss time constant, τ’, and weighting factors, γ’, were
assigned to heat loss/gain. In addition, the wheel weighting factor, γw, should be defined to satisfy
the energy balance. According to the analytical solution, the heat loss/gain would substantially
change the sensible effectiveness at high loss time constant and weighting factors.
Transient tests were performed on a small-scale heat exchanger to determine the sensible
effectiveness from the transient test data. The small-scale heat exchanger was comprised of the
same materials as conventional heat wheels. It was observed that, increasing the amplitude of the
step change led to higher heat loss and, consequently, a larger loss weighting factor. The DEM was
used to decouple heat loss effects from the test data. It was found that the DEM fit the experimental
data more accurately compared to SEM, especially at higher step change amplitude, ΔTst > 4.1 °C.
0
5
10
15
20
25
0 2 4 6 8 10
Δε
(%)
Cr*
− 𝐦
− 𝐦
−
−
0 2 4 6 8 10Cr*
− 𝐦
− 𝐦
−
−

75
Comparison of the sensible effectiveness obtained through SEM and DEM showed that at Re <
209, heat loss reduced the effectiveness less than 0.4% whereas 9% difference was seen in the
sensible effectiveness at Re = 608. An empirical correlation was developed to correlate the sensible
effectiveness with capacity rate ratio. More than 40% uncertainty was found in correlation
parameters when SEM results were used; whereas the uncertainty in parameters reduced to less
than 17% for DEM results. Comparison showed a good agreement between effectiveness
calculated through the DEM correlation and the results obtained through correlation in the
literature while heat capacity rate ratio is higher than 0.5. Moreover, if the heat capacity rate ratio
is higher than 10, both the DEM and SEM result in the same effectiveness with less than 2%
uncertainty bounds. The outcome of this research showed that the transient single step test can be
used to determine the sensible effectiveness of parallel-plate exchanger accurately at a certain
range of operating conditions.

76
CHAPTER 4
4 TRANSIENT TESTING OF ENERGY WHEELS
Overview
This chapter completes the first objective of the thesis, “to develop a novel testing facility
for performing the transient testing on energy wheel components”, by modifying the transient test
facility (presented in chapter 2) to measure the latent energy transfer in energy wheel components.
The humidifying/dehumidifying systems, humidity sensors calibrations, detailed uncertainty
analysis, and the procedure for coating a small-scale parallel-plate exchanger are presented in this
chapter. The physical and sorption properties of desiccants are also obtained and used to calculate
the full-scale energy wheel latent effectiveness using a correlation in the literature. The correlated
latent effectiveness is used to verify the latent effectiveness obtained from the transient testing.
With the results presented in this chapter, the third objective is also fully addressed which is “to
predict the full-scale energy wheel effectiveness with its uncertainty and to investigate the
relationship between the latent effectiveness and operating conditions”.
To fulfill the objectives addressed in this chapter, a Ph.D. student (Mr. M. Rafati Nasr)
assisted the author of this Ph.D. thesis (Farhad Fathieh) with uncertainty analysis and performing
cyclic tests. In addition, the desiccant preparation for water sorption isotherm measurements was
done with the help of Dr. S. Sadeh and Dr. J. Müller from the Department of Chemistry, University
of Saskatchewan. Except for these parts, all the experiments, data acquisition, and data analysis
were conducted by Farhad Fathieh, the lead author of the paper. Farhad Fathieh wrote the
manuscript, integrated comments from the co-authors, and submitted it for review for publication
to the International Journal of Heat and Mass Transfer in February 2016.

77
Determination of Air-to-Air Energy Wheel Latent Effectiveness in Using Humidity Step
Test Data
Farhad Fathieh, Mohamad Rafati Nasr, Saied Sadeh, Robert W. Besant, Richard W. Evitts, Jens
Müller, Carey J. Simonson
Abstract
Desiccant wheels are capable of recovering a considerable amount of the moisture
difference between two air streams. This chapter is aimed at determining the latent effectiveness
of a rotary desiccant wheel through small-scale, transient testing. A coating of mesoporous silica
gel particles (55 μm particle size- pore width 77.5 Å) was deposited on an aluminum substrate.
The physical properties (particle size, pore width, surface area, and surface functional groups) of
the silica gel were characterized and its sorption properties were investigated by nitrogen gas
adsorption at 77 K. In addition, the equilibrium condition and the kinetics of water vapor sorption
on the silica gel sample were studied at 23 °C. A test facility was developed to obtain the exchanger
transient response during the dehumidification process and the data was used to determine the
latent effectiveness of a regenerator constructed with the silica gel coated aluminum. Moreover,
the latent effectiveness was determined using a cyclic test with both dehumidification and
regeneration cycles. Good agreement was observed between the latent effectiveness values
obtained through the single dehumidification and cyclic tests. A correlation from the literature was
used to calculate the latent effectiveness of the silica gel coated regenerator. Comparison between
the latent effectiveness determined by transient test data and the correlation showed good
agreement when NTUm < 4.3 and ω > 4 rpm.

78
Introduction
During the past decades, extensive research has been carried out to model heat and mass
transfer in rotary wheels (Golubovic et al., 2006; Nia et al., 2006; Nóbrega & Brum, 2009;
Simonson & Besant, 1998; Sphaier & Worek, 2004; Wu et al., 2006; Zhang & Niu, 2002; Zhang
et al., 2003). It has been found that the sorption properties of desiccant material have a large
influence on the performance of wheels. In these studies, it was assumed that the driving force for
moisture transfer was proportional to the gradient of water vapor partial pressure (relative
humidity) in the air stream and the moist air in the vicinity of the adsorbent surface. The relative
humidity at the desiccant surface was determined using the equilibrium sorption isotherm.
However, during transient sorption processes in wheels, the moisture content in the desiccant may
be different than its equilibrium sorption capacity as the sorption kinetics are reduced by water
vapor in-pore diffusion and access to the internal sorption sites. In fact, the gas diffusion coefficient
in microporous and mesoporous desiccants is significantly lower when the average pore width is
reduced (Satoh et al., 1995). Another challenge in this research is that the heat of sorption
calculation depends on surface functional groups of adsorbent material. A few correlations have
been developed based on numerically simulated data that relate the performance of the wheels to
the matrix thermal and physical properties, moisture diffusivity, desiccant sorption isotherms, and
heat of sorption at different operating conditions (Jeong & Mumma, 2005; Simonson & Besant,
1999; Simonson & Besant, 1999). Due to these reasons, the proposed correlations in the literature
are only valid for certain types of desiccant and specific ranges of operating conditions.
Over the past few years, numerous studies have been conducted to determine the latent
(moisture recovery) effectiveness through transient single step testing of rotary wheels (Abe et al.,
2006a, 2006b; Shang & Besant, 2009a, 2008). During the transient single step testing, a stationary
wheel is subjected to a step change in the inlet humidity and the response of the wheel is monitored

79
by measuring the humidity at the outlet. It has been found that the wheel response to step changes
in the inlet humidity can be modeled by a first order linear system. An analytical relation has been
developed to relate the latent effectiveness to the response time constant of the wheel. Good
agreement was seen between the latent effectiveness values obtained through transient testing (Abe
et al., 2006a, 2006b) and ANSI/ASHRAE standard testing method 84 (2013). Most recently,
Fathieh et al. (Fathieh et al., 2015) performed the transient single step test on a small-scale heat
exchanger to predict the sensible (heat recovery) effectiveness of the full-scale heat wheel with the
same matrix materials and physical properties. To account for heat loss/gain during the transient
testing, they considered a second mode and extended the analytical relation for latent effectiveness
calculations (Fathieh et al., 2016a). It was verified that the sensible effectiveness values predicted
by the transient testing of small-scale exchanger were consistent with data in the literature.
In this chapter, the transient single step testing was applied to a desiccant coated small-
scale energy exchanger to predict the full-scale wheel effectiveness with identical coating and
channel geometry. A novel coating method was used to deposit mesoporous micron-size silica gel
particles on the metallic substrate of an exchanger. Several tests were performed to determine the
physical and sorption properties of silica gel. Moreover, the experimental facility (introduced in
chapter 2) was modified to perform transient testing on the small-scale exchanger. The transient
humidity measurements were corrected to account for the transient characteristics of the sensors
and the latent effectiveness was predicted based on the wheel response. The second order linear
model proposed for heat wheels (presented section 3.4) was applied to the energy exchanger to
calculate the latent effectiveness. In addition to single step dehumidification and regeneration tests,
the latent effectiveness values were obtained through several repeated cycles of dehumidification
and regeneration steps (cyclic test) and the results were compared to the single step test. A
80
correlation in the literature (C.J. Simonson & Besant, 1999) was used to determine the latent
effectiveness and the values obtained through the transient testing and the correlation were
compared.
Theory
Transient Double Exponential Model (DEM)
Similar to heat wheels, the latent effectiveness of counter-flow energy exchangers for the
balanced supply and exhaust air flow can be determined by (Shah & Sekuli, 2003):
휀L =
𝑁𝑇𝑈m1 + 𝑁𝑇𝑈m
(4.1)
in which
𝑁𝑇𝑈m = (ℎm𝐴m)/�̇�a (4.2)
In Eq. (4.2), hm is the convective mass transfer coefficient, Am is the total area for mass
transfer, and ṁa is air mass flow rate. In fact, determination of hm is a practical challenge in wheels
with coated channels. Since different mechanisms are responsible for heat and mass transfer in
coated channels of rotary wheels, the heat and mass transfer analogy may not be applicable to find
hm. Furthermore, the coating pattern, maldistribution in hydraulic diameter of airflow channels,
and entrance effects alter hm and, consequently, NTUm (Shang & Besant, 2005).
Fathieh et al. (2016a) showed that the heat wheel time constants and weighting factors can
be determined by fitting the double exponential model (DEM) to the transient thermal response of
the wheel. Similarly, the DEM can be used to express the humidity response of the energy wheel
during the single step change in the inlet humidity. Thus, the humidity response of an energy wheel
can be determined as follows:
𝑊(𝑡) = {
1 − 𝛾1𝑒−𝑡 𝜏1⁄ − 𝛾2𝑒
−𝑡 𝜏2⁄ , 0 ≤ 𝑡 ≤ ∞ 𝑠𝑡𝑒𝑝 𝑖𝑛𝑐𝑟𝑒𝑎𝑠𝑒 (𝑑𝑒ℎ𝑢𝑚𝑖𝑑𝑖𝑓𝑖𝑐𝑎𝑡𝑖𝑜𝑛)
𝛾1𝑒−𝑡 𝜏1⁄ +𝛾2𝑒
−𝑡 𝜏2⁄ , 0 ≤ 𝑡 ≤ ∞ 𝑠𝑡𝑒𝑝 𝑑𝑒𝑐𝑟𝑒𝑎𝑠𝑒 (𝑟𝑒𝑔𝑒𝑛𝑒𝑟𝑎𝑡𝑖𝑜𝑛) (4.3)

81
where W(t) is the normalized humidity is:
out init
final init
( )w w
W tw w
(4.4)
And w = (kgwater vapor)/ (kgair) is the air humidity ratio.
In Eq. (4.3) τ is the time constant for wheel response to the step change in inlet humidity.
Two time constants for wheel response are attributed to a fast mass transfer mode (for sorption on
external surfaces and macro pores) followed by a slow mode (for sorption on micropore and
mesopore sorption sites with large diffusion barriers). As for heat wheels, the mass transfer
weighting factors (γ) satisfy the following equation:
𝛾1 + 𝛾2 = 1 (4.5)
Following the analogy presented for the heat wheels in section 2.4, NTUm of an energy wheel can
be expressed by:
𝑁𝑇𝑈m = −1
2Ln [1 − (
2𝜔
𝜋) 𝛾1𝜏1
(1 − 𝑒−π𝜔𝜏1⁄ )
2
1 − 𝑒−2π
𝜔𝜏1⁄− (
2𝜔
𝜋) 𝛾2𝜏2
(1 − 𝑒−π𝜔𝜏2⁄ )
2
1 − 𝑒−2π
𝜔𝜏2⁄] (4.6)
Since the wheel rotates continuously, the inlet humidity alters between the supply and
exhaust humidity values in a periodic manner. Based on the fact that the response characteristics
should be independent of the number of cycles, Abe et al. (Abe et al., 2006a, 2006b) showed that
the time constants and weighting factors obtained through the transient single step test can be used
to predict the NTUm and latent effectiveness of rotary wheels. Therefore, monitoring the humidity
changes across the wheel during the step change, its response characteristics (time constant and
weighting factors) can be determined through Eq. (4.3). Then, the latent effectiveness of a full-
scale exchanger with same matrix materials and geometry can be predicted by Eq. (4.1). More
82
detail on the governing equations, simplifying assumptions, and analytical approach is available
in the literature (Abe et al., 2006a; Fathieh et al., 2016a).
Latent Effectiveness Calculation for the Cyclic Tests
In addition to a single step test, the performance of a parallel-flow energy exchanger was
also studied during dehumidification and regeneration cycles. The procedure for performing the
cyclic experiment is provided in section 3.3.2. In addition, the uncertainty analysis is the same as
section 3.3.2 (Appendix A). The latent effectiveness for the parallel-flow exchanger can be
calculated as the ratio of the amount of moisture recovered in a half of the nth cycle (wout - winit) to
the maximum possible moisture transfer between the dry and humid air streams (whumid - wdry)
within the same period. With the known inlet and outlet humidity profiles, the effectiveness can
be calculated by (Fathieh et al., 2015)
휀PF =
{
𝜔
𝜋∫ (1 −𝑊)𝑑𝑡 𝑑𝑒ℎ𝑢𝑚𝑖𝑑𝑖𝑓𝑖𝑐𝑎𝑡𝑖𝑜𝑛
𝑛+𝑇2
𝑛
𝜔
𝜋∫ 𝑊𝑑𝑡
𝑛+𝑇
𝑛+𝑇2
𝑟𝑒𝑔𝑒𝑛𝑒𝑟𝑎𝑡𝑖𝑜𝑛
(4.7)
With the effectiveness of parallel-flow exchanger obtained from Eq. (4.7), NTUm was determined
by (R. K. Shah and D. P. Sekuli, 2003):
𝑁𝑇𝑈m = −
1
2Ln(1 − 2휀PF) (4.8)
It should be noted that the cyclic tests were performed on the parallel-flow exchanger
whereas the rotary wheels operate under counter-flow conditions. However, since the NTUm is
independent of flow arrangement, Eq. (4.1) can still be applied to determine the latent effectiveness
of the same energy exchanger with counter-flow arrangement. Therefore, finding the NTUm from
Eq. (4.8), the latent effectiveness of counter-flow exchanger can be calculated from Eq. (4.1).

83
Experimental
Materials and Characterization Methods
Silica gel is an amorphous form of silicon dioxide that is widely used as a solid desiccant
for use in dehumidification processes. The Si-O-Si and Si-OH functional groups at the surface of
silica gel adsorb water molecules by dispersion forces and polar forces (Ng et al., 2001). The highly
porous structure of silica gel gives it a specific surface area of 400-700 m2/g. With such a high
specific surface area and a polar surface, silica gel exhibits an excellent adsorption capacity
towards water vapor (0.05-0.30 gwater vapor/gsilica gel at RH = 50%) (Li et al., 2007). In this chapter,
mesoporous silica gel particles (Sigma- Aldrich, mesh 230-400) were used to coat the small-scale
exchanger surface. To specify the surface functional groups of the silica gel, Fourier Transform
infrared (FTIR) spectra were obtained via a BIO-RAD FTS-40 spectrophotometer (operating in
diffuse reflectance mode). Multiple scans were obtained with a 4 cm−1 resolution and corrected
against spectroscopic grade potassium bromide (KBr) background as the sample matrix over the
spectral range of 400–4000 cm−1.
A Mastersizer S Long Bench Particle Size Analyzer (PSA) (Malvern Instruments), was
used to measure the silica gel particle size within a range of 0.05-880 μm. The particle diameter
was obtained by collecting the scattering pattern from 15,000 particles passing through a laser
beam. A range lens (300 RF) focused the scattered laser light onto the array of photo-diode
detectors and the collected data was analyzed to determine the particle size. To determine the
surface area and pore width distribution of silica gel, nitrogen gas adsorption tests were performed
by using a Micromeritics ASAP 2020 (Norcross, GA). The surface area was obtained from the
adsorption isotherms (Copeland et al, 2009) and the de Boer t-plot method was used to calculate
the micropore surface area (Broekhoff, 1968).
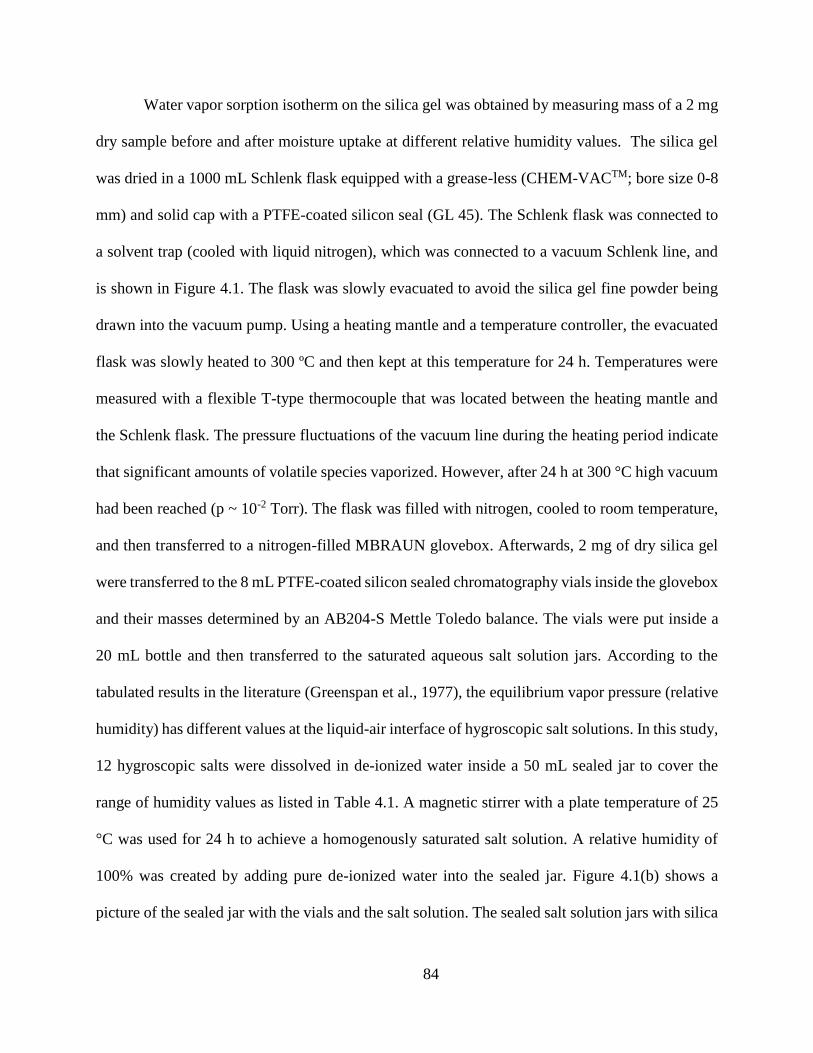
84
Water vapor sorption isotherm on the silica gel was obtained by measuring mass of a 2 mg
dry sample before and after moisture uptake at different relative humidity values. The silica gel
was dried in a 1000 mL Schlenk flask equipped with a grease-less (CHEM-VACTM; bore size 0-8
mm) and solid cap with a PTFE-coated silicon seal (GL 45). The Schlenk flask was connected to
a solvent trap (cooled with liquid nitrogen), which was connected to a vacuum Schlenk line, and
is shown in Figure 4.1. The flask was slowly evacuated to avoid the silica gel fine powder being
drawn into the vacuum pump. Using a heating mantle and a temperature controller, the evacuated
flask was slowly heated to 300 ºC and then kept at this temperature for 24 h. Temperatures were
measured with a flexible T-type thermocouple that was located between the heating mantle and
the Schlenk flask. The pressure fluctuations of the vacuum line during the heating period indicate
that significant amounts of volatile species vaporized. However, after 24 h at 300 °C high vacuum
had been reached (p ~ 10-2 Torr). The flask was filled with nitrogen, cooled to room temperature,
and then transferred to a nitrogen-filled MBRAUN glovebox. Afterwards, 2 mg of dry silica gel
were transferred to the 8 mL PTFE-coated silicon sealed chromatography vials inside the glovebox
and their masses determined by an AB204-S Mettle Toledo balance. The vials were put inside a
20 mL bottle and then transferred to the saturated aqueous salt solution jars. According to the
tabulated results in the literature (Greenspan et al., 1977), the equilibrium vapor pressure (relative
humidity) has different values at the liquid-air interface of hygroscopic salt solutions. In this study,
12 hygroscopic salts were dissolved in de-ionized water inside a 50 mL sealed jar to cover the
range of humidity values as listed in Table 4.1. A magnetic stirrer with a plate temperature of 25
°C was used for 24 h to achieve a homogenously saturated salt solution. A relative humidity of
100% was created by adding pure de-ionized water into the sealed jar. Figure 4.1(b) shows a
picture of the sealed jar with the vials and the salt solution. The sealed salt solution jars with silica
85
gel samples remained within an environmental chamber with T = 23.0 ± 1.0 °C and RH = 45 ± 5%.
The samples were kept inside the jars for 72 h since changes in mass of the samples were observed
to be within the uncertainty bounds of the experiments after this period. The adsorption isotherm
was obtained by measuring silica gel mass before and after the water uptake by using an analytical
balance (Ohaus, AdventureTM Balance, precision ±0.1 mg with 210 g full scale).
(a) (b)
Figure 4.1-The pictures of a) Schlenk line and b) sealed jar used to dry the silica gel
Table 4.1-Equilibrium relative humidity of saturated aqueous salt solutions (Greenspans et
al., 1977) Salt LiBr LiCl KC2H3O2 MgCl KCO3 Mg(NO3)2 NaBr CoCl2 NaCl KCl KNO3 K2SO4 H2O
RH (%) 6.37 11.30 22.51 32.78 43.16 52.89 57.57 64.92 75.29 84.34 93.58 97.30 100
Small-Scale Energy Exchanger
A schematic of the small-scale exchanger is shown in Figure 4.2. The small exchanger was
a parallel-plate energy exchanger comprised of sixteen coated aluminum sheets held in parallel
with a uniform spacing by means of a plastic frame. The exchanger had 15 flow channels, each 4
mm in height and 80 mm in width and a hydraulic diameter of 7.2 mm. The physical properties of
the sheets are given in Table 2.1. The 0.62 mm thick sheet was considerably thicker than the thin
metallic/plastic foil (∼ 0.025 mm thick) substrate often used in industrial wheels. The thicker sheet
avoided any maldistribution in the flow channel and provide a rigid and smooth coating surface.
Schlenk
Flask
Vacuum Schlenk Line
Heating
Mantle(300 °C)
Nitrogen lineVacuum pump
Solvent Trap
Sealed jar
Silica gel sample
Salt crystals
Sample vial
20 mL bottle

86
The aluminum sheets were coated with silica gel particles on both sides. In conventional
industrial coating methods, the particles are bonded to the surface of the substrate by means of a
liquid bonding agent. This results in a multilayer desiccant coating in which a considerable number
of particles are submerged into the bonding agent (Abe et al., 2006a). Consequently, a large
fraction of sorption sites are inaccessible and interactions between the bonding agent and water
vapor are more significant. Due to the aforementioned issue in industrial coatings, a powder
coating method was used to create a monolayer desiccant coating with reduced interaction between
water vapor and the bonding agent. A schematic of the coated surface with the substrate, bonding
agent, and particles is shown in Figure 4.2. In the powder coating method, a 3MTM Super 77 aerosol
adhesive was uniformly sprayed on the surface of aluminum sheets which were cleaned inside an
ultrasonic deionized-water bath for 5 minutes. Next, an annealed aluminum foil tape (3MTM 3381-
1.4 mil, 0.035 mm) backing with acrylic adhesive was attached to the sheet surface from the non-
adhesive side of the tape. The aluminum foil tape created a durable barrier against moisture transfer
over a wide range of temperature and humidity (-23 to 49 °C and 0 to 95% RH). Afterwards, a
pneumatic gravity-fed spray gun (Mastercraft 058-9312-8 model) was used to spray the silica gel
particles on the acrylic adhesive surface of the tape. During this process, the air back pressure was
adjusted to 40 psi to force the particles to inject through ten air jet nozzles (1.4 mm diameter)
towards the target surface located 30 cm away. Finally, a pressurized air jet was used to remove
loose silica gel from the surface. Images of the coated surface were obtained using Hitachi FEG-
SEM SU6600 scanning electron microscope (SEM).

87
Figure 4.2-A schematic of a) coated exchanger and b) coated substrate front view
Test Apparatus and Experimental Procedures
A transient test facility was developed to subject the stationary coated energy exchangers
to a sudden change in the inlet humidity. A schematic of the transient test setup is shown in
Figure 4.3. The small-scale coated exchanger was placed into a test section made of extruded
polystyrene insulation that prevented heat and mass transfer from the exchanger to the external
surroundings. Air was provided by a reciprocating compressor (ITW Devilbiss 120 gal, 454 L)
and then stored in pressurized tank (1800 L) to mitigate flow disturbances. The airstreams at fixed
temperature and flow rate but different humidity values flowed through duct I (humid airstream)
and duct II (dry airstream). These ducts were movable by sliding over a PVC plate located on the
top of the test section. The air flow rates were controlled by a mass flow controller (MKS-Type
1559A) and the temperatures were adjusted by using electrical heaters. A 10 L bubble humidifier
tank was used to humidify the airflow in duct I and the airflow in duct II was dehumidified (RH <
5%) by an industrial dehumidifier (ITW Devilbiss PRO dry).
Temperature measurements were carried out using T-type thermocouples located at the
exchanger inlet and outlet with a sampling rate of 1 s. High accuracy humidity sensors (Honeywell
type HIH-4021) were placed upstream and downstream of the exchanger. The experimental
measurements were taken by a PC-based National Data Acquisition system (Type DAQ-9174).
Aluminum sheet
Silica gel Aluminum tape
Aerosol adhesive Acrylic adhesive
69
.1 m
m

88
The test data were monitored and recorded by a 2011 Lab View software with 1 s sampling rate.
A detailed description of the testing apparatus, calibrations procedure, data acquisition, and
uncertainty analysis is provided elsewhere (Fathieh et al., 2015).
Figure 4.3-Schematic of the test facility with the airflow lines, the measurement
instrumentation, and the test section
Single Step Test Procedure and Operating Conditions
The test conditions and flow rates for single step experiments are listed in Table 4.2. The
following stepwise procedure was followed to perform the transient single step test:
1. Pre-conditioning: The air streams with specified temperature and humidity were passed
through the ducts for at least one hour before the step change to achieve steady-state
conditions in the facility. Steady-state conditions were defined as when the temperature
and humidity variations remained within the sensor uncertainty for a period of 30
minutes. For the dehumidification tests, dry air (RH < 5%) was used for exchanger pre-
conditioning whereas the pre-condition of the exchanger was done by the humid air
(RH = 44%) for the regeneration tests.
RH Relative humidity sensor
TC T-type thermocouples
FC Mass flow controller
Dehumidifier
Ball valve
Flow mixer
Flow straightener
Airflow pipeline
Bypass globe valve
2xFC
2xheater
Du
ct II
Du
ct I
Insulation5xTC
9xTC
5xRH
1xRH
1xTC
5xTC
PVC plates
Exchanger
Air
co
mp
resso
r
Pressu
riz
ed ta
nk
Bubble
humidifier
tank
1xRH
1xTC
By
pa
ss
By
pa
ss
Regeneration
Sliding Direction

89
2. Humidity Step change: In this step, the inlet humidity was altered in less than one
second by sliding the ducts rapidly. For the regeneration tests, after pre-conditioning
the exchanger with humid airflow, the ducts were slid to the right (as shown in
Figure 4.3). As a result, the dry airflow in duct passed through the small-scale
exchanger; whereas, the humid airflow in duct was delivered to the environment
through the bypass flow passage. The dehumidification tests were done by changing
the sliding direction.
3. Transient Measurements: The temperature and humidity at the inlet and outlet of the
test section were recorded until the outlet humidity reached the inlet humidity. These
data represent the transient response of the exchanger.
Table 4.2-Air conditions and the flow rates for the transient single increase
(dehumidification) and step decrease (regeneration) tests Qa (L/min) Vf (m/s) Redh Tair (°C) RHdry (%) RHhumid (%) ΔRHst (%)
15 ± 1 0.050 ± 0.001 26 ± 2
23.0 ± 0.5 4 ± 2 44 ± 2 40 ± 2 25 ± 1 0.091 ± 0.001 43 ± 2 50 ± 1 0.172 ± 0.002 87 ± 2 75 ± 1 0.264 ± 0.003 130 ± 2
100 ± 2 0.344 ± 0.004 174 ± 4
Cyclic Test Procedure and Operating Conditions
In the cyclic test, the small-scale exchanger was exposed to a series of step changes in the
inlet humidity during a cyclic test where all the other conditions were kept constant. The humidity
values, flow rates, and angular speed in the cyclic tests are given in Table 4.3. The cyclic test was
performed by rapidly interchanging duct and duct with specified angular speeds as given in
Table 4.3. The pre-conditioning step was carried out by performing enough cycles so that the outlet
humidity profile became identical for each cycle. It was observed that at ω > 1.5 rpm, the humidity
variations remained within the uncertainty bounds of the humidity sensors.

90
Table 4.3-Airflow conditions and flow rate for the cyclic tests ω (rpm) Qa (L/min) Vf (m/s) Redh Tair (°C) RHdry (%) RHhumid (%) ΔRHst (%)
0.50 ± 0.01
100 ± 2 0.344 ± 0.004 174 ± 2 23.0 ± 0.5 4 ± 2 44 ± 2 40 ± 2 0.75 ± 0.01
1.50 ± 0.02
Sensor Calibration and Uncertainty Analysis
The humidity sensors were calibrated at steady-state conditions for a range of RH (10% <
RH < 90%, with 10% RH increments and at T = 23 °C) by using a Thunder Scientific 1200 mini
two-pressure two-temperature humidity generator with a bias uncertainty of 0.5% RH. The RH
values were measured 40 times at each equilibrium state with a sampling frequency intervals of
30 s. The hysteresis effects were studied by increasing and decreasing the reference RH values in
one loop. Linear regression was used to convert sensor voltage reads to humidity, R2 > 0.99. The
precision uncertainty, Up, of the time constants and weighting factors of humidity sensors were
determined using:
StU p (4.9)
where S is the precision index that equals the square root of standard deviation of data points and
t is the two-tailed student t-factor, t = 2 for 40 data points (Figliola & Beasley, 2006). Using Eq.
(4.9), the maximum precision uncertainty for humidity sensors were found to be ±0.01%. The bias
uncertainty, UB, in humidity measurements at steady-state conditions is due to data reduction, Ufit,
and the bias uncertainty in the reference humidity, Uref. The bias uncertainty was calculated by:
2/12
ref
2
fitB UUU (4.10)
A maximum bias uncertainty of ±1.5% was determined for the relative humidity
measurements. At steady-state conditions, the maximum total uncertainty in the humidity sensor
was found to be less than ±1.6% from the following equation:

91
2/12
B
2
PsteadyT, UUU (4.11)
In addition to the steady-state calibration, transient calibration was required for transient
tests in which the humidity varies with time. According to the literature (Kuse & Takahashi, 2000),
the transient sorption of water vapor on a tin oxide semiconductor humidity sensor may impose an
uncertainty in humidity measurements during the transient testing. Wang et al. (2005) presented
an empirical relation to calibrate the humidity readings and to decouple the exchanger response
from humidity sensor measurements downstream of the exchanger. The same approach was used
in this study for humidity sensor calibration and correcting the exchanger response. In this method,
the sensor time constant and weighting factors should be characterized by fitting the double
exponential model (DEM) to humidity test data when the exchanger is not in the test cell. The
trust-region optimization algorithm was applied to fit the DEM to the sensors data using MATLAB
R2014 (a). For each case, the data reduction uncertainty values were taken from the fitting software
in the 95% of trust-region. The transient characteristics of humidity sensors were also obtained at
each flow rate in Table 4.3. More details on the transient calibration method can be found in the
literature (Wang et al., 2005). To study the repeatability of humidity sensor readings, the sensors
were tested three times at different amplitudes of step change (ΔRH = 10, 20, 30, 40, 50%). Eq.
(4.9) was used to calculate the precision uncertainty of the time constants and the weighting factors
of the humidity sensors. The bias uncertainty in humidity sensor time constants and weighting
factors is due to data reduction, Ufit, and the error in flow rate measurements uncertainties, UQ.
Thus, the bias uncertainty in τ (or γ) was calculated by:
2/12
τQ,
2
τfit,τB, UUU (4.12)
Propagation of error analysis was used to determine UQ,τ for the time constant and weighting factor
as follows:

92
ReτFR, Re
UU
(4.13)
where URe is the uncertainty in Reynolds number given in Table 4.3. To calculate 𝜕𝜏 𝜕𝑅𝑒⁄ , the
time constant was linearly interpolated between the Re intervals listed in Table 4.3. The same
method and set of equations were used to determine the uncertainty in sensors weighting factors.
The humidity sensor transient characteristics are further discussed in section 4.2.
T-type thermocouples were calibrated within the range of 15-85 °C with 5 °C increments
by a Hart Scientific dry-well calibrator (Model 9107). At each reference temperature, 40 readings
with sampling rate of 5 s were taken under steady-state conditions. The measurements were taken
during increasing and decreasing temperature conditions to account for hysteresis effects. The bias
uncertainty was determined from Eq. (4.10) and found to be ± 0.1 °C. A maximum precision error
of 0.03 °C was calculated from Eq. (4.9). Using Eq. (4.11), the maximum total uncertainty in the
thermocouples was found to be less than 0.2 °C.
Results and Discussion
Desiccant Properties and Coating
The IR spectra of silica gel sample is given in Figure 4.4. An intense adsorption band at
1092 cm -1 is seen in the IR spectra, which is attributed to the stretching vibration of the Si-O bond.
In addition, the adsorption band at 803 cm-1 corresponds to the ring structure of SiO4, and the 464
cm-1 band is due to deformation vibration of Si-O-Si (Decottignies et al., 1978; Gallas et al., 1997;
Gillis-D’hamers et al., 1993; Maniar et al., 1990; Almeida & Pantano, 1990; Rumph & Schubert,
1978; Wood & Rabinovich, 1989). In addition to Si-O bands, a very wide band at 3440 cm -1 is
related to the hydroxyl groups which may participate in water vapor sorption significantly. The IR
spectra illustrate that the surface of silica gel used in this study is comprised of Si-O bonds with
small fraction of hydroxyl groups.

93
Figure 4.4-IR spectrum of silica gel (SG55-77)
The volume fraction of the samples at each the particle diameter obtained by using PSA is
shown in Figure 4.5. The particle size measurements illustrate a narrow particle size distribution
for silica gel with a mean particle diameter of 55 μm. The adsorption average pore width (Pw) and
particle surface area (SA), obtained through nitrogen gas adsorption tests are listed in Table 4.4.
According to the pore size distribution (Rouquerol et al., 1994), the silica gel (Pw = 77.5 Å) is
mesoporous. The high specific surface area of silica gel, 478 m2/g, provides a large number of
sorption sites for water vapor sorption.
Figure 4.5-Particle size distribution of silica gel desiccant obtained from PSA
Table 4.4-Silica gel physical properties
Material Density (m3/kg)
𝝆𝒎 Average Particle
Size (μm) Adsorption average
pore width (Å) Available surface
area (m2/g)
Silica Gel 2730* 55 77.5 478
*Data from manufacturer
0
2
4
6
8
10
12
14
16
0.1 1 10 100 1000
Vo
lum
e d
istr
ibu
tio
n (
%)
Particle size (μm)

94
The water vapor adsorption isotherm (at 23.0 °C) for the silica gel sample is shown in
Figure 4.6. It can be seen that the sorption capacity increases almost linearly with relative humidity.
The same trend was observed for mesoporous silica gel samples in the literature (Ng et al., 2001;
Wang et al., 2007; Wang et al. 2004). At the maximum capacity, the silica gel can adsorb up to
0.27 (gw/gSG) at a relative humidity of 100%. However, the sorption isotherm does not provide any
information about sorption kinetics and this plays a key role in moisture recovery in rotary wheels.
In this regard, transient observations, such as single step testing, should be made to investigate the
kinetics of sorption during the dehumidification and regeneration.
Figure 4.6-Adsorption isotherm of water vapor on the mesoporous silica gel at 23.0 °C
The SEM images of the aluminum sheets coated with silica gel particles through the
powder coating method are shown in Figure 4.7. It can be seen that the silica gel particles are
irregular in shape with narrow particle size distribution. Moreover, the SEM images illustrate that
the powder coating method resulted in a uniform layer of coated particles in which the desiccant
particles are not fully submerged into an acrylic bonding agent. In fact, SEM images from
industrial coating in the literature showed a multilayer coating with desiccant particles submerged
into the liquid binder (Shang, 2009c). The enhanced coating improves, both on a per unit mass of
0
0.05
0.1
0.15
0.2
0.25
0.3
0 20 40 60 80 100
Mois
ture
Con
ten
t (g
w/g
sg)
RH (%)

95
particles and surface coverage, the amount of water adsorbed. The amount of silica gel coated on
the exchanger is given in Table 4.5. It was found that the desiccant mass per unit area for the small-
scale exchanger is 1.94 mg/cm2, whereas, industrial wheels have a surface coverage of 0.8-1.6
mg/cm2 (Jeong & Mumma, 2005). Thus, the powder coating technique can be used to effectively
deposit silica gel on the surface of exchanger. Since a portion of substrate surface was not covered
with silica gel particles, the water vapor molecules may also interact with polar groups in the
acrylic resin. However, when testing the substrate covered with only the acrylic bonding agent,
Fathieh et al. (2016b) showed that the bonding agent has insignificant effects on the moisture
transfer during the dehumidification and regeneration processes.
Figure 4.7-SEM images of aluminum substrate coated with silica gel particles through
powder coating at two levels of magnification
Table 4.5-Amount of silica gel coated on the small-scale exchangers through powder
coating
Sample Total mass coated (g) Mass coated per unit
area (mg/cm2) Mass of desiccant to mass
of the matrix (%)
SG55 9.32 ± 0.02 1.941 ± 0.004 1.9
Transient Response of Humidity Sensors
Figure 4.8 depicts the normalized response of the humidity sensor alone (W) versus time
during the single step increase and decrease of ΔRH = 40% and with Re = 87. The step change in
a) ×50 500 μm b) ×250 100 μm

96
the humidity was made after pre-conditioning of the test section and humidity readings were
carried out with sampling frequency interval of 2.5 s. For each case, the trust-region optimization
algorithm was used to fit the double exponential model, Eq. (4.3), to the humidity data using
MATLAB R2014 (a). From the results shown in Figure 4.8, it can be seen that the sensor has a
fast response, with response time 15 s and 16 s (based on 90% of the output) for the increase and
decrease step changes, respectively. The repeatability of the experiment was found by performing
the test three times at different amplitudes of step change and the time constants, weighting factors,
and coefficient of determination (R2) are given in Table 4.6 and Table 4.7. The precision
uncertainty of the humidity sensors was calculated using Eq. (4.9) where the two-tailed student t-
factor has the value of 2.131 for 15 data points (based on 95% of uncertainty bounds) (Figliola &
Beasley, 2006). The average values for the fitting parameters with their precision uncertainty are
given in Table 4.6 and Table 4.7. An R2 value of greater than 0.99 indicates that the DEM can
precisely describe the transient characteristics of the sensors by considering two modes for mass
transfer. The first mode (with smaller time constant and larger weighting factor) is the dominant
process and it can be attributed to the water vapor diffusion from the air to the sensor surface. The
second mode (τ2 > 10τ1 and γ2 < 0.1γ1) seems to be less important and probably is a consequence
of the slow diffusion of water molecules into/out of the sensor material. Based on the results
presented in Table 4.6 and Table 4.7, the time constant and weighting factors do not change
significantly as the amplitude of humidity step change increases from 10 to 50 %.

97
Figure 4.8-Normalized response of RH sensors to the step change in the humidity and fitted
curve obtained through DEM for a) step increase and b) step decrease (ΔRH= 40%, and
Redh = 87, maximum uncertainty in the experimental data is UW = ±0.05)
Table 4.6-The average RH sensor response time constants and weighting factors obtained
through three tests at each amplitude of step increase in the inlet humidity (Redh = 87 and
Tair = 23 °C)
Number of tests ΔRHstep γ1,s τ1,s (s) γ2,s τ2,s (s) R2
3 50 ± 1% 0.94 6.0 0.06 72.5 0.9923
3 40 ± 1% 0.96 6.4 0.04 77.6 0.9904
3 33 ± 1% 0.96 6.7 0.04 102 0.9889
3 20 ± 1% 0.95 6.6 0.05 124 0.9911
3 10 ± 1% 0.96 6.3 0.04 68.1 0.9951
15 Average 0.95 6.4 0.05 88.8 0.9916
Precision ±0.01 ±0.3 ±0.01 ±21.4 -
Table 4.7-The average RH sensor response time constants and weighting factors obtained
through three tests at each amplitude of step decrease in the inlet humidity (Redh = 87 and
Tair = 23 °C)
Number of tests ΔRHst γ1,s τ1,s (s) γ2,s τ2,s (s) R2
3 50 ± 1% 0.97 6.9 0.03 84.3 0.9926
3 40 ± 1% 0.98 7.2 0.02 104.8 0.9879
3 33 ± 1% 0.97 6.6 0.03 69.9 0.9960
3 20 ± 1% 0.97 7.5 0.03 70.3 0.9852
3 10 ± 1% 0.98 7.4 0.02 75.3 0.9918
15 Average 0.97 7.1 0.02 80.9 0.9907
Precision ±0.01 ±0.5 ±0.01 ±13.4 -
0
0.2
0.4
0.6
0.8
1
0 50 100 150 200
W
Time (s)
(a)
Experimental Data
DEM
0
0.2
0.4
0.6
0.8
1
0 50 100 150 200
W
Time (s)
(b)
Experimental Data
DEM

98
The transient characteristics of the humidity sensors were also obtained at different flow
rates by fitting the DEM to humidity test data. The fitting parameters with their total uncertainty
are given in Table 4.8 and Table 4.9. It can be seen that the time constants decrease as the Reynolds
number increases, whereas, there is only slight change in weighting factors. With higher R2 values,
the fitting quality is better at higher Reynolds numbers. The total uncertainty (UT) in the fitting
parameters were calculated by Eq. (4.11). The data reduction uncertainty was obtained by the
fitting software based on the 95% confidence interval and the values and the bias uncertainty were
calculated by Eq. (4.12). Table A.1 and Table A.2 list the Ufit, UQ, and UB for sensor time constants
and weighting factors. The total uncertainty in the time constant and weighting factors were
determined by using Eq. (4.11), where the values are given in Table 4.8 and Table 4.9. In the
uncertainty calculation, the precision of the sensors was assumed to be constant within the range
of tested flow rates.
Table 4.8-RH sensor response to a step increase in the inlet humidity at different flow rates
Re γ1,s τ1,s (s) γ2,s τ2,s (s) R2
26 0.95 ± 0.01 9.9 ± 0.7 0.05 ± 0.01 146.5 ± 56.1 0.9766
43 0.95 ± 0.01 8.4 ± 0.6 0.05 ± 0.01 105.3 ± 54.5 0.9827
87 0.96 ± 0.01 6.4 ± 0.4 0.04 ± 0.01 77.6 ± 35.5 0.9904
130 0.95 ± 0.01 6.0 ± 0.4 0.05 ± 0.01 41.7 ± 12.6 0.9954
174 0.92 ± 0.02 6.0 ± 0.4 0.08 ± 0.02 53.4 ± 13.4 0.9948
Table 4.9-RH sensor response to a step decrease in the inlet humidity at different flow rates
Re γ1,s τ1,s (s) γ2,s τ2,s (s) R2
26 0.98 ± 0.01 9.9 ± 0.8 0.02 ± 0.01 300.0 ± 98.7 0.9796
43 0.98 ± 0.01 9.1 ± 0.7 0.02 ± 0.01 186.9 ± 66.1 0.9840
87 0.98 ± 0.01 7.2 ± 0.6 0.02 ± 0.01 104.8 ± 43.5 0.9876
130 0.95 ± 0.01 6.6 ± 0.6 0.05 ± 0.02 58.6 ± 20.4 0.9982
174 0.97 ± 0.01 7.0 ± 0.6 0.03 ± 0.01 75.4 ± 20.4 0.9940
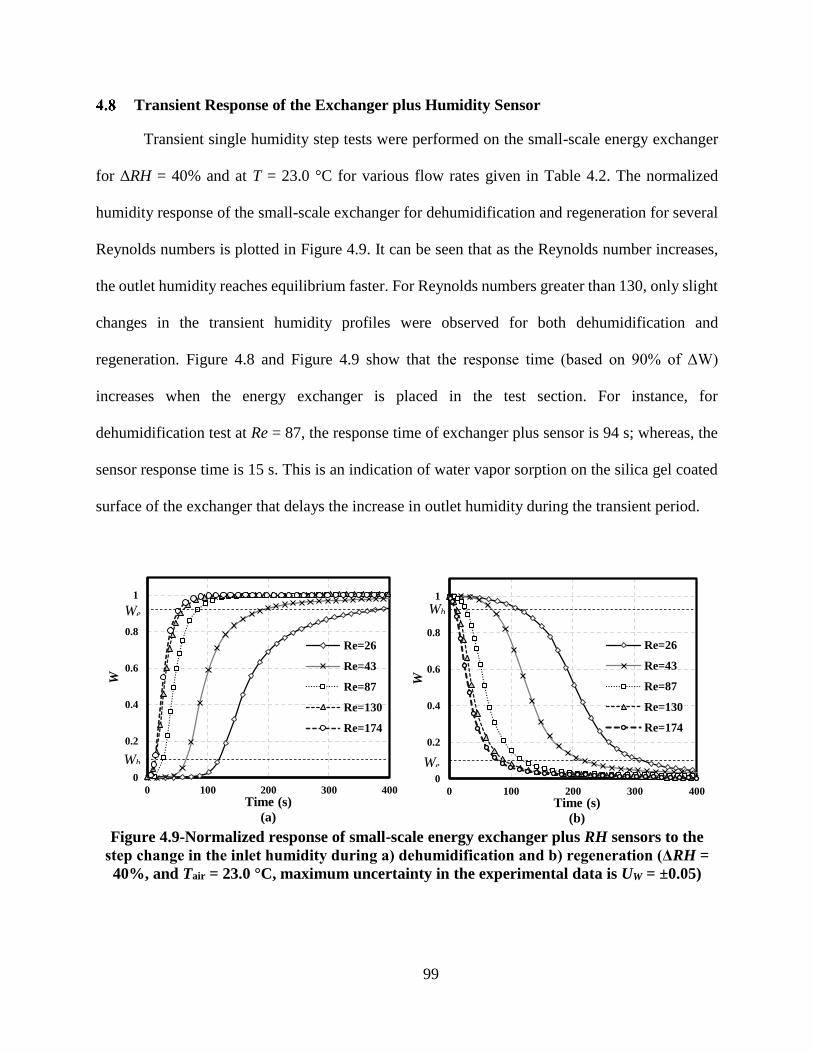
99
Transient Response of the Exchanger plus Humidity Sensor
Transient single humidity step tests were performed on the small-scale energy exchanger
for ΔRH = 40% and at T = 23.0 °C for various flow rates given in Table 4.2. The normalized
humidity response of the small-scale exchanger for dehumidification and regeneration for several
Reynolds numbers is plotted in Figure 4.9. It can be seen that as the Reynolds number increases,
the outlet humidity reaches equilibrium faster. For Reynolds numbers greater than 130, only slight
changes in the transient humidity profiles were observed for both dehumidification and
regeneration. Figure 4.8 and Figure 4.9 show that the response time (based on 90% of ΔW)
increases when the energy exchanger is placed in the test section. For instance, for
dehumidification test at Re = 87, the response time of exchanger plus sensor is 94 s; whereas, the
sensor response time is 15 s. This is an indication of water vapor sorption on the silica gel coated
surface of the exchanger that delays the increase in outlet humidity during the transient period.
Figure 4.9-Normalized response of small-scale energy exchanger plus RH sensors to the
step change in the inlet humidity during a) dehumidification and b) regeneration (ΔRH =
40%, and Tair = 23.0 °C, maximum uncertainty in the experimental data is UW = ±0.05)
0
0.2
0.4
0.6
0.8
1
0 100 200 300 400
W
Time (s)
(a)
Re=26
Re=43
Re=87
Re=130
Re=174
0
0.2
0.4
0.6
0.8
1
0 100 200 300 400
W
Time (s)
(b)
Re=26
Re=43
Re=87
Re=130
Re=174
Wb
We
We
Wb

100
The exchanger plus sensor response was quantified by fitting the DEM to the normalized
humidity profiles. Figure 4.9 (which is a breakthrough curve) shows that the humidity of the air at
the outlet gradually changes to reach the humidity at the inlet. During dehumidification, as water
vapor molecules are adsorbed on the sorption sites, the difference of water vapor concentration
between the air flow and adsorbent surface is reduced and, consequently the driving force for mass
transfer decreases. Thus the breakthrough curve for dehumidification, Figure 4.9(a), is
conventionally divided into three distinct regions distinguished by breakthrough and exhaust
points. The breakthrough point is the point on the breakthrough curves at which the normalized
humidity is less than a specified value (Wb = 0.05-0.15) whereas at the exhaust point the normalized
humidity is We = 0.9-0.95 (Eduardo & Nóbrega, 2014). In the primary sorption zone, W < Wb, a
large fraction of moisture is adsorbed from the humid air stream so that the humidity at the outlet
is has almost the same value as before the step change. Most practical adsorbent beds are designed
to keep the humidity below the breakthrough point (Chang et al., 2005). While W > We, the
moisture sorption occurs slowly, the desiccant is almost saturated, and the mass transfer driving
force approaches zero. At this point, regeneration is required to remove the moisture from the
desiccant. The outlet humidity raises substantially between breakthrough and exhaust points during
which most of the sorption sites are occupied by adsorbate. It has been observed that in desiccant
drying wheels, the temperature and/or humidity variations at the outlet are in the range of Wb < W
< We (Sphaier & Worek, 2004; Zhang & Niu, 2002). In a similar way, the breakthrough and exhaust
points for regeneration were defined when the normalized humidity has the values of 0.95-0.85
and 0.05-0.1, respectively.
The breakthrough and exhaust time, tb and te, of the small-scale exchanger based on Wb =
0.10 and We = 0.95 for dehumidification and Wb = 0.90 and We = 0.05 for regeneration are shown

101
in Figure 4.10. It can be seen that both tb and te follow a similar decreasing trend with increasing
Reynolds number. It can be seen that the exhaust time is one order of magnitude larger than the
breakthrough time for both the dehumidification and regeneration tests. In addition, the
breakthrough time for dehumidification is higher than the breakthrough time for regeneration
which indicates that primary sorption process takes longer during the dehumidification process. In
contrast, the exhaust time is larger for regeneration than dehumidification, except at Re = 15, which
is probably due to the fact that the complete regeneration of the desiccant particles requires more
time.
Figure 4.10-a) Breakthrough and b) exhaust time for the humidity response of the small-
scale exchanger
It was found that the DEM was successful in describing the normalized humidity response
between the breakthrough and exhaust point. Based on the fact that the selection of the
breakthrough time is arbitrary, the starting point after which the DEM can be applied is not well-
defined in this method. For this reason, the DEM was used to correlate the data by varying the
starting point from 0 to 200 s and the coefficient of determination (R2) was evaluated for each
curve fit. Figure 4.11 shows the R2 values as a function of the starting time at Re = 43. The
maximum R2 is at the starting time of 36 s. Since the primary moisture uptake zone is shorter at
0
100
200
300
400
500
0 50 100 150 200
t e (
s)
Re
(b)
dehumidification
regeneration
0
20
40
60
80
100
0 50 100 150 200
t b(s
)
Re
(a)
dehumidification
regeneration

102
higher Re values, the starting time at which R2 reaches its maximum is reduced by flow rate, e.g.
tmax= 4 s at Re = 174. The time constants and weighting factors were obtained using the starting
time that resulted in the highest R2.
To find the repeatability of the transient test and the precision uncertainty in the time
constants and weighting factors, the transient test was performed six times at Re = 87. The
precision of the fitting parameters for exchanger plus sensor were calculated by Eq. (4.9) with
Student’s t = 2.447. Moreover, an uncertainty in time constants and weighting factors was
considered due to the uncertainty in the stating time for the curve fit. From a statistical point of
view, the fitting with R2 > 0.99 is considered a high quality correlation. Thus, comparing the time
constant and weighting factors values obtained from R2max and R2
0.99, the uncertainty was specified
for the fitting parameters. The precision uncertainty and the averaged time constant and weighting
factor values are listed in Table 4.10.
Figure 4.11-R-squared values obtained by applying DEM on the response of small-scale
energy exchanger plus RH sensors to the step increase in the inlet humidity, (ΔRH= 40%,
Re = 43, and Tair = 23.0 °C)
0.96
0.97
0.98
0.99
1
0 20 40 60 80
Co
effi
cien
t o
f d
eter
min
ati
on
Starting time (s)

103
Table 4.10-Precision uncertainty in time constants and weighting factors of the exchanger
plus RH sensor response to step increase in the inlet humidity (Redh = 87 and Tair = 23.0 °C)
Step type γ1,w+s τ1, w+s (s) γ2, w+s τ2, w+s (s)
Increase step Average 0.99 22.3 0.01 100.1
Precision ±0.01 ±2.9 ±0.01 ±21.5
Decrease step Average 0.90 29.8 0.10 234.3
Precision ±0.01 ±2.1 ±0.01 ±42.1
The humidity response at each Reynolds number was fitted by DEM and the fitting
parameters were obtained at the highest value of R2. The time constants, weighting factors, and R2
for dehumidification and regeneration are given in Table 4.11 and Table 4.12. It is observed that
both the time constants decrease as the Reynolds number increases. In the dehumidification
process, the smaller the time constant, the faster the silica gel surface becomes saturated at the
given relative pressure. Moreover, the first weighting factor increases with flow rate and the second
mode diminishes at higher flow rates values. It should be noted that the first time constant is one
order of magnitude larger than the first time constant of the humidity sensors, while the second
time constant have similar order of magnitude values. Another observation is that the fitting
parameters are different for dehumidification and regeneration so that the second mode of mass
transfer is more effective in the desorption process. In Table 4.11 and Table 4.12, the total
uncertainty was determined through the same analysis presented in section 3.3.1 where the
precision errors were taken from Table 4.10.
Table 4.11-Exchanger plus RH sensors response to the step increase in the humidity at
different flow rates (ΔRH = 40% and Tair = 23.0 oC)
Redh γ1,w+s τ1, w+s (s) γ2, w+s τ2, w+s (s) R2
26 0.85 ± 0.02 61.1 ± 6.0 0.15 ± 0.02 445.6 ± 50.2 0.9966
43 0.84 ± 0.01 33.2 ± 3.3 0.16 ± 0.01 162.5 ± 30.0 0.9989
87 0.99 ± 0.01 22.3 ± 2.1 0.01 ± 0.01 100.1 ± 21.5 0.9913
130 1.00 ± 0.00 18.1 ± 1.6 0.00 ± 0.00 - 0.9934
174 1.00 ± 0.00 12.2 ± 1.2 0.00 ± 0.00 - 0.9996

104
Table 4.12-Exchanger plus RH sensors response to the step decrease in the humidity at
different flow rates (ΔRH = 40% and Tair = 23.0 oC)
Redh γ1,w+s τ1, w+s (s) γ2, w+s τ2, w+s (s) R2
26 0.78 ± 0.02 45.1 ± 4.8 0.22 ± 0.02 208.2 ± 45.9 0.9970
43 0.83 ± 0.01 38.6 ± 3.7 0.17 ± 0.01 285.8 ± 61.9 0.9990
87 0.90 ± 0.01 29.8 ± 2.6 0.10 ± 0.01 234.3 ± 50.9 0.9987
130 0.85 ± 0.01 23.7 ± 2.0 0.15 ± 0.01 129.8 ± 28.2 0.9993
174 0.81 ± 0.01 22.9 ± 1.9 0.19 ± 0.01 101.8 ± 22.2 0.9993
Energy Exchanger Response
The humidity sensor readings in the transient testing may affect the exchanger response
and, consequently, alter the calculated time constants and weighting factors. Using the sensors
transient characteristic data, found in Table 4.8 and Table 4.9, and exchanger plus sensor time
constants and weighting factors, found in Table 4.11 and Table 4.12, the exchanger response was
decoupled from sensor response by the method presented by Wang et al. (Wang et al., 2005). The
exchanger response before and after the correction at Re = 87 is shown in Figure 4.12. It can be
seen that the exchanger response is very close to the response of the exchanger plus sensor. This
shows that the sensor response is much faster than the exchanger and the sensor dynamics have
only a small impact on the humidity measurements. The corrected time constants and weighting
factors of the exchanger are listed in Table 4.13 and Table 4.14. The same trend is seen for the
fitting parameters as in Table 4.11and Table 4.12 while the values are slightly different. For
instance, for dehumidification test at Re = 43, the first and second time constant change less than
2.5% and 0.7%, respectively, after decoupling the test data; whereas, the weighting factors are
identical. The uncertainty in the exchanger time constants and weighting factors was calculated
based on the highest uncertainty bounds in the response of the sensor and the exchanger plus sensor
given in Table 4.8 to Table 4.12.

105
Figure 4.12-Decoupled response of the small-scale energy exchanger from humidity sensor
response during a) dehumidification and b) regeneration single step test (ΔRH= 40%, Redh
= 87, and Tair = 23.0 oC)
Table 4.13-Exchanger response to the step increase in the inlet humidity at different flow
rates
Redh γ1,w τ1, w (s) γ2, w τ2, w (s) R2
26 0.86 ± 0.02 60.2 ± 6.1 0.14 ± 0.02 469.3 ± 53.1 0.9998
43 0.84 ± 0.02 33.4 ± 3.4 0.16 ± 0.02 164.4 ± 30.1 0.9998
87 1.00 20.1 ± 2.2 - - 0.9913
130 1.00 16.2 ± 1.6 - - 0.9934
174 1.00 12.2 ± 1.3 - - 0.9996
Table 4.14-Exchanger response to the step decrease in the inlet humidity at different flow
rates
Redh γ1,w τ1, w (s) γ2, w τ2, w (s) R2
26 0.74 ± 0.02 45.0 ± 4.9 0.26 ± 0.02 202.8 ± 49.3 0.9997
43 0.81 ± 0.02 38.6 ± 3.8 0.19 ± 0.02 283.2 ± 62.3 0.9999
87 0.89 ± 0.01 29.7 ± 2.7 0.11 ± 0.01 237.7 ± 51.7 0.9999
130 0.84 ± 0.01 23.5 ± 2.1 0.16 ± 0.01 133.0 ± 29.1 0.9999
174 0.77 ± 0.01 22.3 ± 2.0 0.23 ± 0.01 145.1 ± 22.5 1.0000
Cyclic Test Results
The humidity profiles at Re = 174 and angular speeds ω = 0.5, 0.75, and 1.5 rpm for the
dehumidification and regeneration cycles are shown in Figure 4.13. The humidity profiles in
0.0
0.2
0.4
0.6
0.8
1.0
0 50 100 150 200 250 300
W
Time (s)
(a)
Exchangr plus sensor
Sensor Response
Exchanger response
0.0
0.2
0.4
0.6
0.8
1.0
0 50 100 150 200 250 300
W
Time (s)
(b)
Exchangr response
Sensor Response
Exchanger plus sensor
Exchanger plus sensor Exchanger response

106
Figure 4.13 were obtained when the system reached quasi-steady state. It can be seen that as the
angular speed increases, the amplitudes of the humidity variations decrease, e.g. ΔW = 0.82 at ω
= 0.5 rpm whereas ΔW = 0.22 at ω = 1.5 rpm. In addition, the humidity profiles show, during the
cyclic operation, that the normalized humidity varies within Wb = 0.1 < W < We = 0.95. In contrast
to the transient test, no primary moisture uptake takes place for W < Wb = 0.1. Primary moisture
uptake was observed for the first few cycles when the desiccant was initially dry; however, the
amount of moisture uptake diminished as the cycles were performed and the desiccant adsorbed
moisture. It is suggested that only a portion of sorption sites were occupied during the primary
moisture uptake and only a small fraction of adsorbent surface participates in the transient
dehumidification/regeneration process. This indicates that the sorption process does not take place
at the equilibrium condition as given by the sorption isotherm. Apparently, the intrapore diffusion
time is long compared to the convective flow residence time and that makes a fraction of available
surface area inaccessible during the cyclic sorption process.

107
Figure 4.13-Response of the small-scale energy exchanger to the periodic step
increase/decrease in the inlet humidity at different periods of excitation, (ΔRH = 40%, Tair
= 23.0 °C, Redh = 174, maximum uncertainty in the experimental data is UW = ±0.05)
Latent Effectiveness
The latent effectiveness of energy wheels with the same coating and channel geometry was
predicted using the dehumidification and regeneration test data obtained from the transient testing
of the small-scale energy exchanger. With the exchanger time constants and weighting factors
given in Table 4.13 and Table 4.14 , eqs. (4.6) and (4.1) were used to find NTUm and the latent
effectiveness. The latent effectiveness at different Reynolds numbers is plotted within a
conventional range of wheel angular speeds, 0.1 rpm < ω < 20 rpm, in Figure 4.14. The uncertainty
bounds for latent effectiveness were calculated using the propagation of error analysis based on
0.0
0.1
0.2
0.3
0.4
0.5
0.6
0.7
0.8
0.9
1.0
0 120 240 360 480
W
Time (s)
a) rpm 0.500.0
0.1
0.2
0.3
0.4
0.5
0.6
0.7
0.8
0.9
1.0
0 80 160 240 320 400 480
W
Time (s)
b) rpm 0.75
0.0
0.1
0.2
0.3
0.4
0.5
0.6
0.7
0.8
0.9
1.0
0 120 240 360 480
W
Time (s)
c) rpm 1.5

108
the uncertainty in the exchanger time constants and weighting factors in Table 4.13 and Table 4.14.
The results illustrate that as the wheel angular speed increases, the latent effectiveness increases.
Furthermore, as the Reynolds number increases, latent effectiveness decreases. All these results
are in agreement with the data available in the literature (Angrisani et al., 2012; Eicker et al., 2010;
Enteria et al., 2012). At high angular speeds and Reynolds numbers, ω > 15 rpm and Re > 43, the
effect of flow rate on the latent effectiveness is small and generally within the uncertainty bounds.
It can also be observed that the latent effectiveness has different values for the dehumidification
and regeneration tests. The difference between the regeneration and dehumidification effectiveness
as well as the uncertainty bounds are shown in Figure 4.15. The results show that the regeneration
effectiveness is considerably higher at low angular speeds, ω < 5 rpm. When the angular speed is
greater than 10 rpm, the difference between the results is reduced to less than the experimental
uncertainty bounds. Thus, the determination of the effectiveness by the transient test facility at ω
< 5 rpm is a challenge since the regeneration and dehumidification effectiveness values are not
identical.
Figure 4.14-Latent effectiveness of the exchanger obtained through the step change in the
inlet relative humidity during a) dehumidification and b) regeneration (ΔRH = 40% and
Tair = 23.0 °C)
10
20
30
40
50
60
70
80
90
0 5 10 15 20
ɛ L(%
)
ω (rpm)
Re = 26
Re = 43
Re = 87
Re = 130
Re = 174
10
20
30
40
50
60
70
80
90
0 5 10 15 20
ɛ L(%
)
ω (rpm)
Re = 26
Re = 43
Re = 87
Re = 130
Re = 174

109
Figure 4.15-Difference between the latent effectiveness obtained from regeneration and
dehumidification tests (ΔɛL = ɛL,reg - ɛL,deh)
To explore the effectiveness at lower angular speeds, the dehumidification and
regeneration latent effectiveness obtained from single step tests were compared to the effectiveness
values calculated from cyclic test data. The latent effectiveness of the exchanger was determined
for the steady-state cyclic test using Eq. (4.7). In the Eq. (4.7), the integral corresponds to the area
between the output humidity curve and the forcing function in each half period of excitation. This
area was numerically calculated for six dehumidification and six regeneration cycles based on the
results in Figure 4.13. The average latent effectiveness values for cyclic tests are listed in
Table 4.15. The uncertainty analysis was done by considering the error in the numerical calculation
of the area and the precision in the calculated effectiveness values. In addition, the uncertainty
from the measurements on the cyclic humidity curves were also taken into account. A detailed
description of the uncertainty analysis has been presented elsewhere. (Fathieh et al., 2015). Similar
to the transient results, the latent effectiveness calculated from the regeneration cycles is greater
than the effectiveness obtained from the dehumidification cycles. The difference between the
dehumidification and regeneration effectiveness values increases as the angular speed increases
from 0.5 to 1.5 rpm. Table 4.15 also includes the effectiveness values obtained from the single
0
4
8
12
16
20
0 5 10 15 20
Δɛ L
(%)
ω (rpm)
Δε
Uncertainty bounds

110
step dehumidification and regeneration test at the same angular speeds. Comparing the
effectiveness values calculated from the dehumidification test data of single step and cyclic tests,
it can be seen that the results are consistent and the differences are within the experimental
uncertainty bounds. Moreover, the effectiveness from regeneration tests are in good agreement as
well. It can thus be concluded that the transient single step test is successful for predicting the
moisture recovery in cycles of dehumidification and regeneration. In practice, it is common to
report a single value as a latent effectiveness of rotary regenerators. Thus, the average value of
effectiveness for the regeneration and dehumidification is also reported in Table 4.15.
Table 4.15-Comparison of the latent effectiveness of rotary wheel obtained through the
transient single step test and cyclic test, (ΔRH = 40% and Tair = 23.0 oC)
ω (rpm)
εstep (%) εcyclic (%) εcyclic - εstep (%) εave
εdeh εreg εdeh εreg εdeh εreg εstep εcyclic
0.50 20 ± 5 39 ± 5 23 ± 2 30 ± 2 3 ± 7 -9 ± 7 29 ± 5 26 ± 2
0.75 29 ± 5 48 ± 5 32 ± 3 42 ± 2 3 ± 8 -6 ± 7 39 ± 5 37 ± 3
1.50 46 ± 4 60 ± 4 41 ± 4 54 ± 3 -5 ± 8 -6 ± 7 53 ± 4 48 ± 4
Comparison with Literature Correlation
A correlation found in the literature (Simonson & Besant, 1999) was used to predict the
latent effectiveness of rotary desiccant wheel with the same channel geometry and coatings as the
small-scale exchanger. Using more than 600 simulated data points, Simonson & Besant (1999)
developed a correlation for latent effectiveness that is given by:
*54.0*
mt
51.086.0*
mt
L
11
54.0
11
1 HCrNTUCrNTU
NTU (4.14)
where

111
102,
1111
ehtshtap,
NTUhAhAcm
NTU
(4.15)
103, *
ap,
mp,* Crcm
NMcCr
(4.16)
a
drydes,*
m
NMCrm
(4.17)
66.4
5.0
ave
148213.1*
2.0
0.33
m
58.0**
mt 26.19.47
ave
RH
eCr
RH
uWCrmCr
aveT
(4.18)
and
66,2500 **
H
T
WH
(4.19)
The description of the correlation parameters with their values for the small-scale exchanger are
given in Table 4.16.
Using the correlation in Eq. (4.14) with the values given in Table 4.16, the latent
effectiveness of the small-scale exchanger was calculated at two NTUm values. It should be noted
that in their analysis, Simonson and Besant assumed that the Lewis number was unity, which leads
to the same number of transfer unit for heat and mass transfer (NTU = NTUm). Figure 4.16 presents
the results of the present study within the validity range of the correlation 3 ≤ Cr *≤ 10. The
uncertainty bounds for the correlated effectiveness were obtained by propagating the uncertainty
of each parameter.

112
Table 4.16-The correlation parameters used to determine the latent effectiveness of small-
scale exchanger Parameter Description Values Reference
h [W/(K.m2)]
Convective heat transfer coefficient
28.0 ± 0.5 Ref. (Shah &
London, 1978)
Aht [m2] Total area of heat transfer 0.48 ± 0.008 Measured
M [g] Mass of coated matrix 537.8 ± 0.1 Measured
cp,m [J/(kg.K)]
Specific heat capacity of matrix
893 Al-3003, Ref.
(Bauccio, 1993)
Mdes,dry [g] Total mass of dry desiccant coated on the matrix 9.32 ± 0.002 Measured
Wm [g/g] Maximum moisture content of desiccant 0.27 ± 0.02 Fig. 6
RHave [%] Average relative humidity 24 ± 2 Table 3
(∂u/∂RH)ave Slope of sorption isotherm at average relative
humidity
0.23
Fig. 6
H* Operating condition factor H* >> 1 ΔT is zero
The latent effectiveness from the transient single step test, Table 4.16 , are included in
Figure 4.16 for comparison. Comparing the results it is shown that for NTUm = 3.5 the correlated
effectiveness values lie between the transient test dehumidification and regeneration effectiveness.
At NTUm = 4.3, the difference between correlated and transient effectiveness reaches the
uncertainty bounds of experiment at some angular speeds; however, results are still in agreement
if they are compared to the regeneration results. The discrepancy becomes larger than uncertainty
bounds at higher NTUm where the correlation overestimates the effectiveness. The difference in the
results may be attributed to the simplifying assumptions used in the correlated results. In fact, the
heat and mass transfer analogy cannot fully describe the moisture sorption in the highly porous
structure of silica gel in which Le > 1 (Golubovic et al., 2006). This means that during the
regeneration and dehumidification process the moisture content in silica gel particles may be lower
than its equilibrium value. Therefore, the convective mass transfer coefficient may be smaller than
the convective heat transfer coefficient. In addition, finding the area for mass transfer is a practical

113
challenge, and it was assumed to be identical to the heat transfer area in the correlation.
Furthermore, the heat of sorption was overestimated in their numerical simulation by assuming it
to be equal to heat of phase change. The aforementioned assumptions with the experimental
uncertainty and the error in correlation parameters are expected to be the main reasons for the
deviations in the correlated and transient effectiveness at higher NTUm. According to the correlated
results, it can be concluded that the single step test can be performed on small-scale exchanger to
predict the effectiveness of full-scale wheel when NTUm < 4.3 and ω > 4 rpm. For better validation
of single step test, detailed studies are required at wide range of operating conditions.
Figure 4.16-Comparison of the latent effectiveness obtained through the small-scale
transient testing and the correlation in literature
Summary and Conclusions
In this work, the latent effectiveness of desiccant wheels was predicted by performing
transient testing on a small-scale exchanger. The exchanger matrix is coated with silica gel
particles with particle size of 55 μm and pore width of 77.5 Å. Water vapor adsorption isotherms
on the silica gel showed almost a linear moisture uptake at 23.0 °C. The kinetics of water vapor
sorption on the coated surfaces of an exchanger was studied experimentally using a single step and
cyclic humidity change. Using the transient humidity test data during the single step and cyclic
0
20
40
60
80
100
0 4 8 12 16
ε L(%
)
ω (rpm)
a) NTUm= 4.5
Simonson and Besant
Transient Adsorption Test
Transient Desorption Test
0
20
40
60
80
100
0 4 8 12 16
ε L(%
)
ω (rpm)
b) NTUm= 3.5
Simonson and Besant
Transient Adsorption Test
Transient Desorption Test

114
test, the latent effectiveness was determined. The effectiveness values obtained by both tests were
consistent proving that the transient single step test can produce the same results as steady-state
cyclic operating conditions in rotary wheels. Furthermore, a correlation in the literature was used
to determine the latent effectiveness of a wheel with the same coating and geometry. Good
agreement was found between the effectiveness determined by transient testing and the correlation
at the NTUm < 4.3 and ω > 4 rpm. The discrepancy at higher NTUm is likely due to the simplifying
assumptions in the numerical simulation used to develop the correlation. The uncertainties in the
values of exchanger properties, such as effective area for mass transfer and convective mass
transfer coefficient, have also significant effects on the correlated effectiveness.

115
CHAPTER 5
5 EFFECTS OF DESICCANT PHYSICAL PROPERTIES ON MOISTURE RECOVERY
Overview
In chapter 4, it was shown that transient component testing can be used to accurately predict
the latent effectiveness of a full-scale wheel with the same materials and coating. In this chapter,
the transient component testing is used to identify the influence of physical and sorption properties
of desiccants on the latent effectiveness. Thus, this chapter addresses the fourth objective of the
thesis, “To identify the effects of physical, chemical, and sorption properties of desiccant on the
latent effectiveness of energy wheels”. The performance of exchangers coated with silica gel
samples with different particle sizes and pore widths are presented in this chapter. As in the other
chapters, the effects of airflow rate and wheel angular speed are also studied.
In order to satisfy the goals of this chapter, Mr. M. Nezakat assisted the author in taking
the scanning electron microscope (SEM) images, developing the powder coating method, and
studying the surface morphology. Except the SEM imaging, all the experiments, data acquisition,
and data analysis in this chapter were conducted by the author of the thesis (Farhad Fathieh).
Farhad Fathieh wrote the manuscript and submitted it to the ASME Journal of Heat Transfer in
March 2016. In order to avoid repetition, some parts of the experimental and theoretical analysis
in the original manuscript are not included in this chapter.

116
Effects of Physical and Sorption Properties of Mesoporous Silica Gel on Dehumidification
Performance of Energy Wheels
Farhad Fathieh, Majid Nezakat, R. W. Evitts, Robert W. Besant, Carey J. Simonson
Abstract
Silica gel coated energy wheels are widely used in ventilation systems to reduce the air
conditioning load required for humidification/dehumidification of the supply air in industrial
environments and commercial buildings. In this study, the effects of silica gel microphysical
properties, i.e. pore width (Pw), specific surface area (SA), and particle size (dp), on the moisture
recovery efficiency (latent effectiveness) of energy wheels are investigated. Three silica gels
samples with different particle size and pore width (55 μm-77 Å, 150 μm-63 Å, 160 μm-115 Å)
are selected to coat small-scale energy exchangers. The sorption performance of the exchangers
are determined from their normalized humidity response to a step increase in the inlet humidity at
different flow rates. The results demonstrate that the transient humidity response is mainly
specified by the desiccant pore size distribution, specific surface area, and mass of the coating.
The transient analytical model (DEM) is used to calculate the latent effectiveness (ɛL) of the
exchanger from the transient humidity response. It was found that the exchanger coated with the
smallest pore width (63 Å) has the highest available surface area and the highest latent
effectiveness. With almost the same particle size (dp = 150 μm and 160 μm), the latent
effectiveness increases by 5% (at wheel speed of 20 rpm and Re = 174) as the silica gel pore width
reduces from 150 Å to 63 Å. Increasing the particle size from 55 μm to 150 μm when the pore
widths are almost identical (Pw = 63 Å and 77Å) results in a slight enhancement in the latent
effectiveness. The Yoon-Nelson model is also applied on test data to correlate the adsorption

117
breakthrough curves. The ɛL values calculated from the measured and correlated data agreed within
experimental uncertainty bounds.
Introduction
During the past decade, transient testing was proposed in the literature (Abe et al., 2006a,
2006b) to determine the moisture recovery performance (latent effectiveness) of energy wheels.
The transient test is based on the analytical/empirical model that applies to the wheels response to
a step inlet humidity change. The transient test was found to be faster, less expensive, and easier
to perform with less uncertainty compared to the conventional steady-state test methods
(ANSI/ASHRAE, 2013). Most recently, Fathieh et al. (2016c) performed the transient single step
test on a small-scale exchanger coated with silica gel particles (dp = 55 μm, Pw = 77 Å) to predict
the latent effectiveness of a full-scale wheel with the same coating materials and matrix geometry.
Verifying using correlations in the literature, it was shown that the small-scale transient test could
successfully predict the latent effectiveness within the experimental uncertainty bounds at practical
wheels operating conditions.
The moisture transfer occurs on the external surfaces and internal pores of the coating layer
within the wheel channels. Silica gel is one of the most conventional desiccants for coating
commercial wheels since it has a large specific adsorption surface area, low cost, non-hazardous
interaction with water vapour, and low regeneration temperature (Zheng et al., 2014). Over the
past decades, several works have been conducted to analytically/numerically study the latent
effectiveness of the wheels (Golubovic et al., 2006; Nia et al., 2006; Nóbrega & Brum, 2009;
Simonson & Besant, 1998; Sphaier & Worek, 2004; Wu et al., 2006; Zhang & Niu, 2002; Zhang
et al., 2003). It has been reported that the sorption capacity of desiccants plays an important role
in the performance of the wheels. In this regard, a desiccant with higher sorption capacity with a
linear sorption isotherm is favorable (Simonson & Besant, 1999). It was also found that if the water

118
vapour diffusion into a porous desiccant is numerically modeled, a good agreement between the
simulated results and experimental data is achievable (Sphaier & Worek, 2004). In fact, the
accuracy of the numerical models in predicting the latent effectiveness strongly relies on desiccant
equilibrium sorption capacity (isotherms) and sorption kinetics (rate of sorption). Several surveys
(Gorbach et al., 2004; Harding et al., 1998; Li et al., 2007; Ng et al., 2001; Satoh et al., 1995;
Wang et al., 2004) verify that both the sorption isotherms curves and sorption kinetics are specified
by desiccant physical properties, i.e. particle size, pore width, and porosity. More importantly,
functional groups on the surface of the adsorbate can significantly interact with adsorbate
molecules and substantialy affect the sorption behavior (Bartell & Bower, 1952; Benesi & Jones,
1959; Brunauer et al., 1940). For this reason, the available numerical models in the literature for
latent effectiveness determination are limited to certain types of desiccants with specified physical
and sorptive properties.
In this chapter, three samples of mesoporous silica gel with different particle sizes and pore
widths but the same surface functional groups were selected to construct small-scale coated
exchangers. It is aimed to investigate effects of desiccant microphysical properties on the sorption
characteristic (sorption capacity and kinetics) and the latent effectiveness of the exchangers.
Several tests were performed to characterize the main physical and sorptive properties of the silica
gel samples, i.e. particle size, pore width, sorption isotherm, and moisture removal rate. The latent
effectiveness of energy wheels with the same coating materials and matrix geometry was also
determined through the transient testing of the small-scale exchangers. The outcomes of this
chapter relate the micro-scale desiccant properties to macro-scale performance of energy wheels.
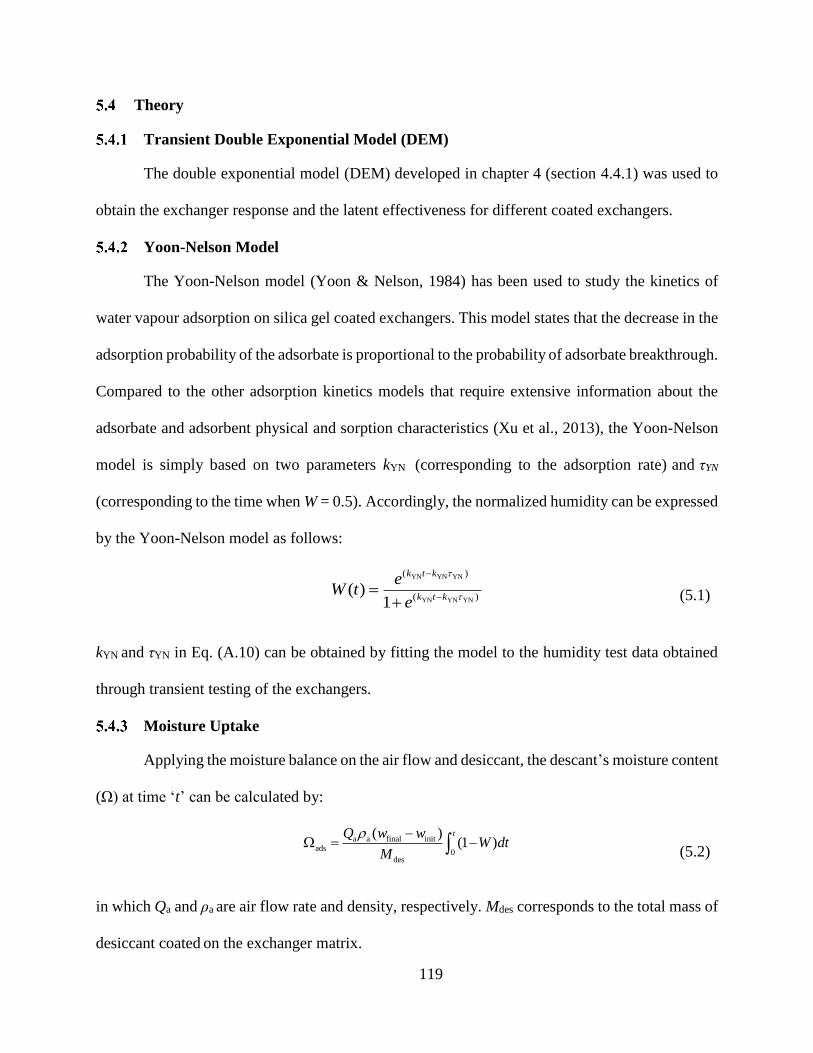
119
Theory
Transient Double Exponential Model (DEM)
The double exponential model (DEM) developed in chapter 4 (section 4.4.1) was used to
obtain the exchanger response and the latent effectiveness for different coated exchangers.
Yoon-Nelson Model
The Yoon-Nelson model (Yoon & Nelson, 1984) has been used to study the kinetics of
water vapour adsorption on silica gel coated exchangers. This model states that the decrease in the
adsorption probability of the adsorbate is proportional to the probability of adsorbate breakthrough.
Compared to the other adsorption kinetics models that require extensive information about the
adsorbate and adsorbent physical and sorption characteristics (Xu et al., 2013), the Yoon-Nelson
model is simply based on two parameters kYN (corresponding to the adsorption rate) and τYN
(corresponding to the time when W = 0.5). Accordingly, the normalized humidity can be expressed
by the Yoon-Nelson model as follows:
YN YN YN
YN YN YN
( )
( )( )
1
k t k
k t k
eW t
e
(5.1)
kYN and τYN in Eq. (A.10) can be obtained by fitting the model to the humidity test data obtained
through transient testing of the exchangers.
Moisture Uptake
Applying the moisture balance on the air flow and desiccant, the descant’s moisture content
(Ω) at time ‘t’ can be calculated by:
a a final initads
0des
( )(1 )
tQ w wW dt
M
(5.2)
in which Qa and ρa are air flow rate and density, respectively. Mdes corresponds to the total mass of
desiccant coated on the exchanger matrix.

120
Experimental
Materials
Three samples of mesoporous silica gel (SG55-77, SG150-63, and SG 160-115) with
different particle sizes (dp) and pore widths (Pw) were selected for the sorption study. To make the
comparison more convenient, the samples were named by their particle size and pore width
through the study, e.g. SG55-77: dp = 55 μm and Pw = 77 Å. Silica gel is an amorphous form of
silicon dioxide with porous internal structure, Figure 5.1. The surface of silica gel is comprised of
polar Si-O and Si-OH groups which adsorb adsorbates such as water and alcohol. The water
molecules are physically bonded on the surface of silica gel by dispersion and polar forces. Due to
the strong affinity of silica gel toward water vapour, silica gel is widely used as a solid desiccant
in energy wheels. It has been reported that the pore width and available surface area are two main
properties that affect the sorption performance of silica gels (Rouquerol et al., 2014). The smaller
the pore width, the higher surface area, and consequently, a greater number of sorption sites. On
the other hand, the kinetics of sorption is mainly limited by intrapore diffusion (Harding et al.,
1998). Thus, sorption rate is lower for silica gel with smaller pore width as the internal diffusion
resistance is larger for water vapour molecules to penetrate into its porous structure (Satoh et al.,
1995). For this reason, a range of pore width values and particle sizes were selected to investigate
the effects of desiccant properties on the performance of energy wheels.
Figure 5.1-A conceptual view of the molecular structure of amorphous silica gel

121
The silica gel particles size was measured by using Mastersizer S Long Bench Particle Size
Analyzer (Malvern Instruments, detecting range of 0.05-880 μm). A range lens (300 RF) focused
the scattering pattern from 15,000 particles passing through a laser beam onto the photo-diode
detectors. The collected data was processed and analyzing with Malvern data analysis software to
determine the particle size. The surface area, pore width distribution, and sorption isotherms of the
silica gels were obtained through nitrogen gas adsorption tests (at 77 K) using a Micromeritics
ASAP 2020 (Norcross, GA) device. The adsorption isotherm data was used to calculated the
surface area (Copeland et al., 2009) and micropore surface area was found by using the de Boer t-
plot method (Broekhoff, 1968).
Small-Scale Energy Exchanger
Three small-scale energy exchangers were built by coating the silica gel samples on the
aluminum substrate. The physical properties of the small-scale exchanger were the same as the
exchanger described in section 4.5.2. To coat the exchangers with silica gel particles, the powder
coating method, described in section 4.5.2 was used.
Transient Test Facility and Test Procedure
The transient test facility, described in section 4.5.3 was used for performing the transient
test on the coated exchangers. The same test procedure was followed as given in section 4.5.4 with
the testing conditions listed in Table 5.1.
Table 5.1-Air conditions and flow rates for the transient single step increase/decrease tests
Qa (L/min) Vf (m/s) Redh Tair (°C) RHdry (%) RHhumid (%) (RHhumid - RHdry)
15 ± 1 0.050 ± 0.001 26 ± 2
23.0 ± 0.5 4 ± 2 44 ± 2 40 ± 2
25 ± 1 0.091 ± 0.001 43 ± 2
50 ± 1 0.172 ± 0.002 86 ± 2
75 ± 1 0.264 ± 0.003 129 ± 2
100 ± 2 0.344 ± 0.004 172 ± 4

122
Results
The IR spectra of the three silica gel samples are presented in Figure 5.2. The IR spectra
of all the samples are very similar which indicates that the silica gels are comprised of the same
surface functional groups. A sharp adsorption band at 1092 cm -1 is for the stretching vibration of
the Si-O bond; whereas, the adsorption band at 803 cm-1 is attributed to the ring structure of SiO4.
The deformation vibration of Si-O-Si was detected through adsorption band at 464 cm-1. A very
wide band at 3440 cm -1 is seen, which can be related to the hydroxyl groups. Hydroxyl groups
may contribute in water vapor sorption significantly through hydrogen bonding. Similar
observations have been reported in the literature (Decottignies et al., 1978; Gallas et al., 1997;
Gillis-D’hamers et al., n.d.; Kamitsos et al., 1993; Maniar et al., 1990; RM & CG, 1990; Rumph
& Schubert, 1978; Wood & Rabinovich, 1989).
Figure 5.2-IR specta of the silica gel samples
The volumetric distributions of the silica gels particle with their particle sizes are presented
in Figure 5.3. The results show a narrow and almost normal distribution for the size of the silica
gel particles. SG150-63 and SG160-115 have almost the identical particle size distributions with
SG55-77
SG160-115
SG150-63

123
average particle diameter of 150 μm and 160 μm, respectively. SG55-77 has the smallest particle
size among the tested silica gels.
The silica gel specific surface area (SA), average pore width (Pw), and average pore volume
(Pv) obtained through nitrogen gas adsorption at 77 K are listed in Table 5.2. According to the
pore width classification recommended by International Union of Pure and Applied Chemistry
(IUPAC), the silica gel samples are all mesoporous (20 Å < Pw < 500 Å) (Rouquerol et al., 1994).
Although smaller particle sizes lead to higher external surface area, the surface area of the
mesoporouse silica gels is mainly due to their internal surfaces. That is why SG150-63 with the
smaller pore width has the a 13% higher SA than SG55-77, even though the particle size of SG150-
63 is nearly three times larger than the particle size of SG55-77. Table 5.2 also shows that the
larger the pore width, the higher the pore volume per unit mass of the silica gels. Accordingly,
SG160-115 has the largest pore volume; whereas, SG150-63 and SG55-77 have almost identical
pore volumes.
Figure 5.3-Particle size distribution of silica gel desiccants obtained from particle size
analyzer
0
5
10
15
20
1 10 100 1000
Vo
lum
e d
istr
ibu
tio
n (
%)
Particle diameter (μm)
SG55-77
SG150-63
SG160-115

124
Table 5.2-Physical properties of the amorphous silica gel samples obtained by laser particle
size analyzer and N2 gas adsorption
Sample Average Particle Size
dp (μm)
Adsorption pore width
Pw (Å)
Accessible surface area
SA (m2/g)
Volume of pores
Pv (cm3/g)
SG55-77 55 77 392 0.759
SG150-63 150 63 442 0.702
SG160-115 160 115 345 0.992
To quantify the influence of pore width, pore volume, and specific surface area, the
nitrogen gas sorption isotherms for the silica gels at 77 K are presented in Figure 5.4. It can be
seen that all the sorption isotherms represent type IV which is common for mesoporous materials
(Haul, 1982). A hysteresis loop in the sorption isotherm is due to the capillary condensation within
the mesopores. At lower partial pressures (P/P0 < 0.6), the sorption process is mainly driven by
interaction between the adsorbent surface and adsorbate molecules that form a monomolecular
layer of adsorbate (Donohue & Aranovich, 1999). Therefore, an adsorbent with relatively higher
specific surface area should exhibit a better sorption performance. This is why the SG160-115 with
the largest Pw and the smallest SA has the lowest sorption capacity at P/P0 < 0.6. On the other hand,
at the higher relative pressures (P/P0 > 0.9), the sorption capacity of silica gels is limited by their
pore volume (Li et al., 2007). Thus, SG160-115 with the largest pore width and pore volume has
the highest sorption capacity for P/P0 < 0.9. This illustrates the importance of internal porosity on
the sorption performance of mesoporous silica gel which may affect the energy wheel performance
operating at climate zones with different moisture partial pressures (relative humidity).

125
Figure 5.4-Sorption isotherms for a) SG55-77, b) SG150-63 and c) SG160-115 obtained
through N2 gas sorption at 77 K
Figure 5.5 shows SEM images of aluminum sheets coated with the silica gel particles. It
can be see that all three silica gel samples have irregular particle shapes and a narrow range of
particle sizes. This narrow particle size distribution was also verified by particle size
measurements. It should be noted that the nanometer-sized pores of silica gel cannot be observed
in SEM images as higher magnification levels are required to visualize the pores. The SEM images
of coated samples also show a monolayer coating with uniform particle distribution. Unlike the
industrial coatings in which a considerable number of desiccant particles are submerged into the
bonding agent (Shang & Besant, 2009c), the powder coating creates an enhanced layer of coating
on the acrylic bonding agent. Partial or full pore blockage, caused by the bonding agent in
industrial coatings, increases the diffusion barriers and substantially reduces the mass transfer in
the pores of desiccant.
0
100
200
300
400
500
600
700
0 0.2 0.4 0.6 0.8 1
Qu
an
tity
ad
sorb
ed
(cm
3/g
N2
ST
P)
Relative pressure (P/Po)
a) SG55-77
AdsorptionDesorption
0
100
200
300
400
500
600
700
0 0.2 0.4 0.6 0.8 1
Qu
an
tity
ad
sorb
ed
(cm
3/g
N2
ST
P)
Relative pressure (P/Po)
b) SGG150-63
AdsorptionDesorption
0
100
200
300
400
500
600
700
0 0.2 0.4 0.6 0.8 1
Qu
an
tity
ad
sorb
ed
(cm
3/g
N2
ST
P)
Relative pressure (P/Po)
c) SG160-115
AdsorptionDesorption

126
Figure 5.5-SEM images of silica gel particles coated on an aluminum substrate
In contrast to industrial coating the powder coating minimizes the pore blockage and
interaction between bonding agent and desiccant by making almost all the sorption sites available
for water vapor sorption. This enables the investigation of the influences of the desiccant internal
pores on the overall performance of the small-scale energy exchanger with minor effects of the
bonding agent. Moreover, the SEM images demonstrate that not all the surface of the substrate is
a) SG55-77 (X50) 1000 µm
b) SG150-63 (X50) 1000 µm
c) SG160-115 (X50) 1000 µm
a) SG55-77 (X250) 200 µm
b) SG150-63 (X250) 200 µm
c) SG160-115 (X250) 200 µm

127
covered with the silica gel particles which may intensify the interaction between the polar groups
in the acrylic resin and the water vapor molecules. Fathieh et al. (2016c) performed a set of
transient humidity step tests on a small-scale exchanger comprised of sheets covered only with a
layer of acrylic bonding agent and found that the bonding agent has a negligible effect on the
sorption process during air dehumidification and desiccant regeneration.
Table 5.3 provides quantified information about the amount of desiccant used to coat the
small-scale exchangers. It was found that when larger particles were used for powder coating,
more mass of desiccant was deposited on the exchanger matrix. The observed effect is in
agreement with the data in the literature on efficacy of powder coating for larger particles (Maniar
et al., 1990). The coating to matrix mass ratio for the small-scale exchangers was determined by
dividing the coated mass by the total mass of the sheets. It should be noted that the mass of
desiccant to matrix is about 20% in commercial wheels but the available coating resulted only in
a mass of 1.9 - 4.5%. In fact, the aluminum sheets used in the small-scale exchanger is 0.60 mm
thick which is considerably thicker than the 0.02 aluminum foil in the commercial wheels. The
thicker aluminum substrate provided a flat and rigid surface for coating and making the parallel-
plate exchanger. However, considering the coating mass to matrix area ratio is between 0.8-1.6
mg/cm2 in commercial wheels, the powder coating results in a higher amount of desiccant coating
per unit area. A higher amount of coated desiccant along with a lower number of submerged
particles into the bonding agent, reveals a good potential for powder coating to be used in the
wheel manufacturing process. However, further studies are required to investigate the stability and
durability of the coating during the production of energy wheels from flat materials and also over
the life span of the wheel in operation.

128
Table 5.3-Mass of coated particles on the sheets of parallel-plate energy exchangers
Exchanger Coated
Desiccant
Total mass of
desiccant coated
(g)
Mass of desiccant
coated per unit
area (mg/cm2)
Mass of desiccant
to mass of the
matrix (%)
EX55-77 SG55-77 9.32 ± 0.02 1.941 ± 0.004 1.9
EX150-63 SG150-63 22.12 ± 0.02 4.604 ± 0.004 4.5
EX160-115 SG160-115 19.07 ± 0.02 3.969 ± 0.004 3.9
Energy Exchanger Response
In this section, the transient response of the small-scale exchangers to a step change in
humidity at different flow rates is presented. The measured humidity downstream of the exchanger
is the coupled response of the exchanger and the humidity sensors using an analytical/empirical
relation presented in the literature (Wang et al., 2005). The transient response of the humidity
sensors was determined elsewhere (Fathieh et al., 2016c) at different flow rates and humidity step
change amplitudes when the exchanger was not in the test section. They used the DEM to
determine the sensor response characteristics and their results are summarized in Table 5.4. The
humidity sensors were found to have a dominant fast mode followed by a slow mode during the
transient humidity measurements (τ1,s < 0.1τ2,s and γ1,s > γ2,s). The sensor response is faster at higher
flow rates and the second mode weighting factor increases with flow rate. In this study, the data in
Table 5.4 was used to decouple the small-scale exchangers responses from the coupled response
of the exchanger and the humidity sensors.
Table 5.4-RH sensor response to a step increase in the inlet humidity at different flow rates
Re γ1,s τ1,s (s) γ2,s τ2,s (s) R2
26 0.95 ± 0.01 9.9 ± 0.7 0.05 ± 0.01 146.5 ± 56.1 0.9766
43 0.95 ± 0.01 8.4 ± 0.6 0.05 ± 0.01 105.3 ± 54.5 0.9827
87 0.96 ± 0.01 6.4 ± 0.4 0.04 ± 0.01 77.6 ± 35.5 0.9904
130 0.95 ± 0.01 6.0 ± 0.4 0.05 ± 0.01 41.7 ± 12.6 0.9954
174 0.92 ± 0.02 6.0 ± 0.4 0.08 ± 0.02 53.4 ± 13.4 0.9948

129
The normalized humidity responses (breakthrough curves) obtained from the transient
testing of the small-scale exchangers at different flow rates are shown in Figure 5.6. In this set of
tests, the inlet humidity of the exchangers was increased in less than a second at time zero and the
gradual changes in the outlet humidity were monitored. This gradual increase in humidity is
attributed to the water vapor adsorption on the desiccant coated exchangers. As the moist air passes
through the exchanger, the higher concentration of water vapor in the air flow forces the water
vapor molecules to diffuse towards the adsorbent surface. When the water vapor molecules are in
the vicinity of the adsorbent polar surface, they are attracted by dispersion and polar forces (Van
der Waals forces) toward the sorption sites on the adsorbent surface. The driving force for mass
transfer reduces with time as more sorption sites are occupied by adsorbate molecules, and
consequently, the water vapor concentration on the adsorption surface approaches the value of the
air stream. The transient behavior of breakthrough curves is commonly described based on the
breakthrough point (Wb = 0.05-0.15) and exhaust points (We = 0.9-0.95) (Eduardo & Nóbrega,
2014). With these points, the breakthrough curves can be divided in three regions, primary sorption
zone (W < Wb), transition zone (Wb < W < We), and saturation zone (W > We). Within the primary
sorption zone, the normalized humidity changes are insignificant, most of the desiccant sorption
sites are unoccupied and the desiccant is able to adsorb almost all the moisture from the humid air
stream. Most commercial packed beds used for dehumidification purposes are operated in this
region (Chang et al., 2005). In the transition zone, the slope of the breakthrough curve gradually
decreases as it approaches the exhaust point. In contrast to packed beds, energy wheels and drying
wheels outlet humidity variations are within the transition zone 0.35 < W < 0.65 (Fathieh et al.,
2016c; Sphaier & Worek, 2004; Zhang & Niu, 2002). In the saturation zone (W > We), most of the
sorption sites are occupied, the desiccant is nearly saturated, and a regeneration process is required.

130
Figure 5.6-Breakthrough curves for water vapor adsorption on the mesoporous silica gels
in the small scale exchangers at different flow rates (ΔRH= 40%, and Tair = 23.1 °C,
maximum uncertainty in the experimental data is UW = ±0.05)
Figure 5.6 also demonstrates a similar trend for all the exchanger breakthrough curves but
different quantities at the given flow rates. For all the exchangers, the outlet humidity reaches
equilibrium conditions sooner as the Reynolds number increases. The duration of the primary
sorption and transition zones become shorter as Re increases. However, influence of flow rate on
the breakthrough curves diminishes as Re increases to more than 130. Comparing the breakthrough
curves of the small-scale exchangers, EX150-63 (the exchanger coated with SG150-63) has the
slowest response at a specified Re. This implies that EX150-63 can adsorb a greater amount of
0
0.2
0.4
0.6
0.8
1
0 100 200 300 400 500 600W
Time (s)
d) Re = 130
0
0.2
0.4
0.6
0.8
1
0 100 200 300 400 500 600
W
Time (s)
e) Re = 174
0
0.2
0.4
0.6
0.8
1
0 100 200 300 400 500 600
W
Time (s)
c) Re = 87
0
0.2
0.4
0.6
0.8
1
0 100 200 300 400 500 600
W
Time (s)
b) Re = 430
0.2
0.4
0.6
0.8
1
0 100 200 300 400 500 600
W
Time (s)
a) Re = 26
EX55-77
EX150-63
EX160-115

131
moisture from the humid airstream during the dehumidification process. The large
dehumidification capacity of EX150-63 can be attributed to the greater specific surface area of
SG150-63 particles (Table 5.2) and the higher amount of desiccant coated on EX150-63, Table 5.3.
The poorest performance is found to be for EX55-77 as it becomes saturated prior to the other
exchangers at the same flow rate. EX55-77 has the smallest mass of desiccant coated on its matrix
which reduces its dehumidification capacity and, consequently, EX55-77 has the shortest primary
zone. However, the duration of the transition zone for EX55-77 is longer compared to that of
EX160-115. It is believed that the sorption sites of EX160-115, with the largest pore width, are
easily accessible and mainly occupied during the primary sorption zone. On the other hand,
diffusion barriers is in larger in the smaller pores of SG55-77, and consequently, the transition
zone is longer for EX55-77. This can explain why the duration and curve slope in transition zones
for EX55-77 and EX150-63, with almost identical pore width but different coating mass, are very
close to each another. Based on the observation from breakthrough curves, following conclusions
can be drawn:
1. The mass of coated desiccant plays a key role in moisture recovery by increasing the
primary sorption zone duration and the dehumidification capacity of the exchangers.
2. The transition sorption zone is mainly controlled by pore width distributions and
accessible sorption sites. The smaller the pore width and the larger specific surface, the
longer the duration of the transition zone.
3. Although the particle size does not affect the sorption properties of materials
significantly, it may substantially change the coating mass which in turn alters the
exchanger dehumidification capacity. With a single layer of desiccant particles, the
larger the particles, the greater the coating mass.

132
To investigate the moisture uptake per unit mass of desiccant, Eq. (5.2) was used to
determine the moisture content of the desiccant (Ω) during the dehumidification test and the results
are shown in Figure 5.7. With the desiccant in equilibrium with the dry air (RHdry < 5%) at the
beginning of the tests, the moisture content values given in Figure 5.7 are relative to the desiccant
moisture content at RH = 5%. It can be seen that increasing Re shortens the transition period;
nevertheless, it does not alter the specific sorption capacity of the exchanger (the moisture content
at equilibrium conditions). This is a reasonable observation as the sorption capacity of materials
at a specific relative humidity only depends on its sorption properties, but not the air flow rate.
The moisture content curves verify that SG150-63 with the largest specific surface area has the
highest sorption capacity. In contrast, SG160-115 has the lowest specific surface area and sorption
capacity. The kinetics of adsorption can also be studied by comparing the slope of moisture uptake
(rate of adsorption) within the transition region in Figure 5.7. In porous materials, the rate of
adsorption is controlled by gas diffusion in the pores which is limited by the pore width (Satoh et
al., 1995). On the other hand, the probability for adsorbate molecules to reach the adsorbent
sorption site increases as the pore width becomes smaller and the surface area increases. Thus, a
higher sorption rate is expected for a desiccant with higher specific surface area (smaller pore
width) and smaller diffusion resistance (larger pore width). It is expected that a certain range of
pore width would results in highest rate of sorption. Accordingly, SG55-77 with larger pore width
(but smaller specific surface area) has higher sorption rate compared to SG150-63 with smaller
pore width (but higher specific surface area),Table 5.2. On the other hand, although SG150-115
has larger pore width than SG55-77, its smaller surface area results in the reduced sorption rate.

133
Figure 5.7-Moisture content in the small scale exchanger with time during the
dehumidification at different flow rates (ΔRH= 40%, and Tair = 23.1 °C)
In order to quantify the transient response of the small-scale exchangers and determine
their latent effectiveness, the DEM and the Yoon-Nelson models were used to fit the breakthrough
curves in Figure 5.6. The trust-region optimization algorithm was applied to obtain the best fit
using MATLAB R2014. Detailed information about the fitting procedure and relevant
uncertainties are provided elsewhere (Fathieh et al., 2016c). The regression curves with the test
data for EX160-115 at different flow rates are shown in Figure 5.8. As discussed, the humidity
response of the wheels during the dehumidification and regeneration cycles are within the range
0
0.01
0.02
0.03
0.04
0.05
0 100 200 300 400 500 600
Ω(g
wv/g
SG
)
Time (s)
e) Re = 174
EX55-77
EX150-63
EX160-115
0
0.01
0.02
0.03
0.04
0.05
0 100 200 300 400 500 600
Ω(g
wv/g
SG
)
Time (s)
a) Re = 26 0
0.01
0.02
0.03
0.04
0.05
0 100 200 300 400 500 600
Ω(g
wv/g
SG
)
Time (s)
b) Re = 43
0
0.01
0.02
0.03
0.04
0.05
0 100 200 300 400 500 600
Ω(g
wv/g
SG
)
Time (s)
c) Re = 870
0.01
0.02
0.03
0.04
0.05
0 100 200 300 400 500 600
Ω(g
wv/g
SG
)
Time (s)
d) Re = 130

134
of 0.35 < W < 0.65. Considering this fact, the DEM was developed to correlate the wheels’ transient
response in this range but the model is not accurate in correlating the humidity data close to the
primary sorption zone. This is clearly shown in Figure 5.8 as the DEM successfully fits the test
data at W > 0.3. As the flow rate increases and primary moisture uptake zone diminishes, DEM
seems to be better in describing the breakthrough curves.
Figure 5.8-Breakthrough curves of water vapor on silica gel coated exchanger EX160-115
at different flow rates (ΔRH= 40%, and Tair = 23.1 °C, maximum uncertainty in the
experimental data is UW = ±0.05)
Table 5.5-5.7 list the time constants, weighting factors, and coefficients of determination
(R2) for the small-scale exchangers obtained from fitting the DEM to the breakthrough curves in
Figure 5.6. Since the DEM cannot model the test data within the primary sorption zone, a start
time should be specified for the DEM. In this regard, a start time was determined that resulted in
the highest fitting R2 and then, the time constants were calculated relative to this starting time
(Fathieh et al., 2016c). It was found that the starting time corresponding to normalized response
between 0.2 < W < 0.4 led to the highest R2. The R2 values are calculated by comparing the
correlated points and test data within the range of 0.25 < W ≤ 1. At Re ≤ 43, the adsorption occurs
0
0.2
0.4
0.6
0.8
1
0 100 200 300 400 500 600
W
Time (s)
Re = 174
Re = 87
Re = 26
Re = 43
DEM
Yoon-Nelson

135
with two modes within all the exchangers. The first mode is observed to be relatively fast (τ1 <<
τ2) and dominant as its weighting factor is considerably greater than the second mode weighting
factor (γ1 > γ2). The second mode diminishes as Re increases which means that the exchanger
responds similar to a linear system to the step change in inlet humidity. As observed in the
breakthrough curves of Figure 5.6, the exchangers reach the saturation zone faster at higher Re
that leads to smaller time constants at higher flow rates. Among the exchangers, EX150-63 has the
largest time constants which are due to the largest amount of coating on this exchanger. The
shortest transition duration and the smallest time constant are for EX160-115 with the largest
particle size and pore width. As discussed previously, the short transition period for EX160-115
may be attributed to SG160-115 with largest pore width and smallest diffusion barriers inside the
pores.
Table 5.5-EX55-77 response characteristics to the humidity step increase at different flow
rates (ΔRH = 40% and Tair = 23 °C)
Redh γ1 τ1 (s) γ2 τ2 (s) R2
26 0.86 ± 0.02 60.2 ± 6.1 0.14 ± 0.02 469.3 ± 53.1 0.9998
43 0.84 ± 0.02 33.4 ± 3.4 0.16 ± 0.02 164.4 ± 30.1 0.9998
86 1.00 ± 0.01 20.1 ± 2.1 0.00 ± 0.00 - 0.9913
129 1.00 ± 0.00 16.2 ± 1.6 0.00 ± 0.00 - 0.9934
172 1.00 ± 0.00 12.2 ± 1.2 0.00 ± 0.00 - 0.9996
Table 5.6-EX150-63 response characteristics to the humidity step increase at different flow
rates (ΔRH = 40% and Tair = 23 °C)
Redh γ1 τ1 (s) γ2 τ2 (s) R2
26 0.96 ± 0.02 74.7 ± 5.3 0.04 ± 0.02 1314.0 ± 89.1 0.9999
43 0.98 ± 0.01 57.5 ± 4.1 0.02 ± 0.01 523.4 ± 48.6 0.9994
86 1.00 ± 0.01 29.3 ± 2.3 0.00 ± 0.00 - 0.9993
129 1.00 ± 0.00 20.1 ± 1.8 0.00 ± 0.00 - 0.9995
172 1.00 ± 0.00 16.2 ± 1.4 0.00 ± 0.00 - 0.9996

136
Table 5.7-EX160-115 response characteristics to the humidity step increase at different
flow rates (ΔRH = 40% and Tair = 23 °C)
Redh γ1 τ1 (s) γ2 τ2 (s) R2
26 0.89 ± 0.02 26.9 ± 2.2 0.11 ± 0.01 315.7 ± 32.1 0.9990
43 0.95 ± 0.01 25.1 ± 2.1 0.05 ± 0.01 145.9 ± 16.3 0.9997
86 1.00 ± 0.01 15.9 ± 1.3 0.00 ± 0.00 - 0.9994
129 1.00 ± 0.00 12.5 ± 1.2 0.00 ± 0.00 - 0.9995
172 1.00 ± 0.00 8.6 ± 0.7 0.00 ± 0.00 - 0.9986
Although the DEM describes the exchanger response precisely above the breakthrough
point, it cannot provide any information on humidity below the breakthrough point. Thus, if the
primary sorption zone is of interest, another model should be employed to accurately predict the
full range of breakthrough curves during the step change. For this reason, the Yoon-Nelson model
was also applied to correlate the breakthrough curves in Figure 5.6 using the trust-region
optimization algorithm MATLAB R2014. The correlated curves for EX160-115 are also shown in
Figure 5.8. It can be seen that the Yoon-Nelson model fits the humidity data very well even in
primary moisture uptake zone; however, the model cannot precisely correlate the test data between
0.9 < W < 0.95 at lower Re (Re ≤ 43). This is probably due to the second mode of sorption, as
observed by DEM, that cannot be correlated by the Yoon-Nelson model. The fitting parameters
for the Yoon-Nelson model are presented in Table 5.8. Similar to the DEM time constants, τYN
reduces considerably as Re increases. On the other hand, the values of kYN increase with Re.
EX150-63 has the greatest τYN which can be explained by its highest coating mass among the
exchangers and the largest specific sorption capacity of SG150-63.

137
Table 5.8-Yoon-Nelson fitting parameters for adsorption of water vapor on the mesoporous
silica gel samples at different flow rates
Re EX55-77 EX150-63 EX160-115
kYN τYN (s) R2 kYN τYN (s) R2 kYN τYN (s) R2
26 0.024 ± 0.001 182 ± 1.4 0.9789 0.021 ± 0.0003 435 ± 0.7 0.9976 0.046 ± 0.002 245 ± 0.4 0.9984
43 0.046 ± 0.002 99 ± 0.9 0.9876 0.029 ± 0.0004 249 ± 0.5 0.9985 0.061 ± 0.002 144 ± 0.4 0.9984
86 0.080 ± 0.003 42± 0.5 0.9933 0.048 ± 0.0005 129 ± 0.2 0.9993 0.094 ± 0.002 71 ± 0.3 0.9991
129 0.110 ± 0.004 30 ± 0.5 0.9936 0.065 ± 0.0010 77 ± 0.3 0.9995 0.110 ± 0.001 51 ± 0.2 0.9992
172 0.129 ± 0.004 26 ± 0.3 0.9925 0.071 ± 0.0010 66 ± 0.2 0.9995 0.114 ± 0.001 42 ± 0.2 0.9994
Latent Effectiveness
The latent effectiveness of an energy wheel with the same coating materials and matrix
geometry as the small-scale exchangers was calculated with the DEM. With the known time
constants and weighting factors given in Table 5.5-5.7, Eq. (4.6) was used to calculate NTUm and
εL was determined by Eq. (4.1). The latent effectiveness of the exchangers at tested flow rates and
four wheel angular speeds are presented in Figure 5.9. It can be seen that as the Re (or face velocity)
increases, the effectiveness decreases. This reduction in the effectiveness is less significant at
lower angular speeds. For instance, when Re increases from 46 to 172 in EX150-63, latent
effectiveness increases by 25% at ω = 0.5 rpm and by 5% at ω = 20 rpm. The same trend is seen
for the other exchangers. The exchanger effectiveness increases substantially as angular speed
increases from 0.5 to 5 rpm, but changing the angular speeds from 5 to 20 causes a minor
enhancement in the effectiveness specially at low face velocities (Re < 43).
It has been observed in the breakthrough curves that EX150-63 has better performance due
to having the greatest coating mass and the largest desiccant specific surface area among the tested
exchangers. In addition, the highest time constant was found for EX150-63 since it has the longest
transition period. According to Eq. (4.6), the greater the time constant, the larger the NTUm, and
the higher the latent effectiveness. This is why EX150-63 has the highest latent effectiveness
among the tested exchangers. On the other hand, EX160-115 has the lowest latent effectiveness
even though the coating mass in EX160-115 is very close to EX150-63 and it has about twice the

138
coating mass of EX55-77. This could be attributed to the lower specific surface area of EX160-
115 compared to the other sample. Even though EX55-77 has less coating mass than EX150-63,
the latent effectiveness of both exchangers are very close at higher angular speeds. This states the
significant effects of pore width and available specific surface area rather than particle size. These
outcomes clearly state that a proper selection of desiccant may result in the same or enhanced
energy wheel with less cost for desiccant materials.
Figure 5.9-Latent effectiveness an equivalent wheel with the matrix coated with the same
desiccant particles at different angular speeds and balanced supply and exhaust flow rate
Numerous data are available in the literature that provide the Yoon-Nelson fitting
parameters for various desiccant packed beds at different operating conditions (Qiu et al., 2009;
Xu et al., 2013). However, more investigations are required to determine the Yoon-Nelson
parameters for desiccant coated matrix and calculate the wheel effectiveness from these data. For
0
10
20
30
40
50
60
70
80
90
100
0 43 86 129 172 215
ε L(%
)
Re
a) ω=0.5 rpm EX55-77
EX150-63
EX16-115
0
10
20
30
40
50
60
70
80
90
100
0 43 86 129 172 215
ε L(%
)
Re
b) ω=1 rpm EX55-77
EX150-63
EX160-115
0
10
20
30
40
50
60
70
80
90
100
0 43 86 129 172 215
ε L(%
)
Re
c) ω=5 rpm
EX55-77
EX150-63
EX160-1150
10
20
30
40
50
60
70
80
90
100
0 43 86 129 172 215
ε L(%
)
Re
d) ω=20 rpm
EX55-77
EX150-63
EX160-115

139
this reason, the DEM was also applied on correlated humidity data predicted by the Yoon-Nelson
model to predict the latent effectiveness. Figure 5.10 presents the latent effectiveness obtained
from transient test data and Yoon-Nelson correlated values at different Re for ω = 0.5 rpm. Good
agreement is seen between the effectiveness values at Re ≥ 86. For lower Re numbers the
discrepancy is within the experimental uncertainty bounds except for EX55-77 at Re = 26. The
difference between the effectiveness values reduces below the uncertainty bounds at higher wheel
angular speeds. This states that if the Yoon-Nelson model parameters are known for a desiccant
coated exchanger, the DEM can be applied on the correlated results to predict the wheel’s latent
effectiveness at different angular speeds.
Figure 5.10-The latent effectiveness of tested exchangers obtained by applying DEM on the
transient test data and Yoon-Nelson correlated data at different Re numbers and wheel
angular speed of ω = 0.5 rpm.
10
20
30
40
50
60
70
0 43 86 129 172 215
ε L(%
)
Re
a) EX150-63
Test data
Yoon-Nelson model
0.5 rpm
10
20
30
40
50
60
70
0 43 86 129 172 215
ε L(%
)
Re
b) EX55-77
Test data
Yoon-Nelson model
10
20
30
40
50
60
70
0 43 86 129 172 215
ε L(%
)
Re
c) EX160-115
Test Data
Yoon-Nelson model

140
Summary and Conclusions
In this study, the influence of pore width, specific surface area, and particle size of silica
gel on the performance of energy wheels were investigated experimentally. Three samples of silica
gel (SG55-77, SG150-63, and SG160-115) were coated on small-scale exchangers. The sorption
performance of the coated exchangers were examined through their transient response
(breakthrough curves) to the inlet humidity step increase at different flow rates during
dehumidification. Using transient analytical/empirical model (DEM), the latent effectiveness of
energy wheels comprised of the same coating and matrix geometry were obtained. The
observations and outcomes of this research lead to the following conclusions:
For the tested silica gel samples with the same functional groups, the size of the particles
has insignificant influence on sorption properties of micron sized, mesoporous silica gels.
However, the larger the particle size, the greater the mass of desiccant that can be deposited
through the powder coating method and, consequently, the higher amount of moisture
removed from the air. However, the effective diffusion coefficient is higher for larger
particles which in turn lower the sorption rate.
Pore width and specific surface area affect the sorption rate, sorption capacity, and the
breakthrough curves. The smaller the pore width and larger the specific surface area, the
longer transition zone in the breakthrough curves. It was suggested that the appropriate
selection of pore width and specific surface area (or desiccant porosity) may lead to an
optimum performance of wheels with economical considerations.
In general, the latent effectiveness increases as the desiccant pore width reduces and the
specific surface area increases. For the silica gel with close pore width (SG55-77 and
SG150-63) the latent effectiveness slightly increases as the desiccant particle size increases

141
from 55 μm to 150 μm. This is due to the greater mass of coating for EX150-63 though the
effective diffusion coefficient is larger in SG150-63.
The latent effectiveness increases when the face velocity reduces or wheel angular speed
increases. At angular speeds of ω > 20 rpm and Re > 129, the difference in latent
effectiveness between the three tested exchangers reduces to less than 4%. This implies
that at higher angular speeds and face velocity, a small enhancement in the latent
effectiveness is achieved where different silica gel were used. However, in the case of
drying wheels with low angular speed and face velocity (ω = 1 rpm and Re = 26), more
than 15% enhancement was observed in the latent effectiveness of exchanger when the
silica pore size reduced from 115 Å to 63 Å.
The Yoon-Nelson model can precisely correlate the breakthrough curves of silica gel
coated exchangers at different flow rates. In addition, good agreement was seen between
the latent effectiveness values obtained from the measured data and Yoon-Nelson
correlated results.
Although the outcomes of this research provide fundamental insights into the sorption
process occurring within energy wheels, the results are only limited to mesoporous silica gel
desiccant.. It should be noted that the surface groups in other desiccant may exhibit different
sorption behavior toward water vapor molecules. In addition to moisture uptake, the regeneration
of the desiccant is as important as dehumidification process in energy wheels. Therefore, the
authors suggest more experimental/numerical studies to fully-understand the transient sorption
process in desiccant wheels.

142
CHAPTER 6
6 EFFECTS OF DESICCANT CHEMICAL COMPOSITION ON MOISTURE RECOVERY
Overview
Chapter 6 completes the fourth objective of this research, “to identify the effects of
physical, chemical, and sorption properties of desiccant on the latent effectiveness of energy
wheels”. In chapter 5, the influences of physical properties of desiccant particles on the latent
effectiveness were studied; whereas, chapter 6 studies the effects of chemical properties of the
desiccants on moisture transfer. A sample of biopolymer starch was selected for coating the
exchanger and transient testing results were compared to the silica gel coated exchangers. With
different chemical functional groups on the surfaces of starch and silica gel, chapter 6 discusses
the chemical composition effects on the sorption process.
Since the investigation of surface functional groups requires a deep knowledge in surface
chemistry, this part of the research was done through a collaborative research with Department of
Chemistry, University of Saskatchewan. Dr. L. Wilson and a Ph.D. student, Ms. L. Dehabadi,
collaborated in this research by providing the starch samples and performing nitrogen gas
adsorption and infrared spectroscopy tests. Moreover, they assisted the thesis author (Farhad
Fathieh) in analyzing the test results. The rest of the tests and data analysis mentioned in this
chapter are performed by Farhad Fathieh. As the lead author of the paper, Farhad Fathieh prepared
and wrote the manuscript which was published in ACS, Sustainable Chemistry & Engineering in
February 2016. It worth mentioning that this collaborative research has resulted in one more
manuscript which has been submitted to ACS, Sustainable Chemistry & Engineering for review,
not included in this Ph.D. thesis.

143
Sorption Study of a Starch Biopolymer as an Alternative Desiccant for Energy Wheels
Farhad Fathieh, Leila Dehabadi, Lee D. Wilson, Robert W. Besant, Richard W. Evitts, Carey J.
Simonson
(Reproduced with permission from ACS, Copyright 2016 American Chemical Society)
Abstract
The sorption of water vapor on high amylose starch was investigated as an alternative
desiccant for air-to-air energy exchangers used in ventilation units. Sorption performance of
micron size mesoporous high amylose starch (HAS15, 15 µm-46 Å) and two mesoporous silica
gel samples (SG13, 13 µm-62 Å and SG55, 55 µm-77 Å) were studied and compared. Transient
water vapor sorption tests were performed using small-scale energy exchangers coated with
HAS15 and the silica gel samples. Although N2 gas adsorption tests showed lower sorption
capacity for HAS15 compared to the silica gel samples, higher sorption rates and uptake capacity
were shown for HAS15, when measured by water vapor transient sorption results. In addition, the
latent effectiveness, an indicator of moisture recovery efficiency for exchangers was calculated for
each exchanger. With the same amount of desiccant coated on the energy exchanger channels, the
latent effectiveness of the HAS coated material was 2-13% greater than that of the silica gel
materials, depending on the operating conditions.
Introduction
The moisture recovery efficiency in energy wheels is typically quantified by latent
effectiveness. The latent effectiveness refers to the actual rate of moisture transfer between the
supply and exhaust airstreams divided by the maximum possible rate of moisture transfer between
the airstreams (Kays & London, 1984). Over the past few decades, numerous theoretical and
experimental studies were carried out to investigate the performance of desiccant coated wheels at
different operating conditions (Angrisani et al., 2012; Eicker et al., 2012; Enteria et al., 2010;

144
Goldsworthy & White, 2012; Narayanan et al., 2011; Nóbrega & Brum, 2009; Zhang & Niu,
2002). In addition, several empirical correlations have been proposed to estimate the effectiveness
of hygroscopic wheels with specific matrix geometry and material composition at defined
operating conditions (Jeong & Mumma, 2005; Nia et al., 2006). Although extensive data is
available on the performance of hygroscopic wheels in the literature, very few investigations have
considered the role of desiccant sorption characteristics (Golubovic, et al., 2006; Simonson &
Besant, 1998; Simonson & Besant, 1999; Simonson & Besant, 1999). However, due to the
complexity of the sorption process, molecular interactions between the adsorbent and adsorbate
were not modeled in these simulations. As a result, the simulated outcome and empirical
correlations are limited to the specified coating pattern and desiccant material. It has been reported
that the desiccant sorption capacity, regeneration temperature, and sorption rate play a key role in
recovering the latent energy in hygroscopic wheels (Colliers et al., 2014). In this regard, extensive
research efforts have been directed toward new types of desiccants with improved sorption
capacity, regeneration ability, and long-term stability. Comparatively few studies have considered
biomaterials as an alternative desiccant (Zheng et al., 2014). It has been reported that
polysaccharides such as starch and cellulose, have great tendency to adsorb water and organic
chemicals in the liquid and vapor phase (Beery & Ladisch, 2001; Westgate & Ladisch, 1993). In
a recent study, Dehabadi and Wilson (Dehabadi & Wilson, 2014) demonstrated that the linear form
of starch displayed greater adsorption capacity with water relative to branched forms of starch.
Most recently, Fathieh et al. (2015) performed transient tests on a energy wheel component
(small-scale heat exchanger) to predict the sensible effectiveness of a full scale energy wheel with
the same matrix geometry, materials, and coating pattern. Without having to construct a full-scale
wheel matrix and a cassette with the sealing, casing, external driving systems, and air ducts, the

145
small-scale transient testing substantially reduces the difficulties associated with the full-scale
testing protocol.
According to a survey of the literature, it is believed that starch may serve as a promising
adsorbent for desiccant energy wheels due to its unique sorption behavior and low cost. In spite of
these considerations, few studies have been carried out to investigate the performance and stability
of starch in this regard. Many previous studies have focused on the measurement of the sorption
performance of different types of starch at equilibrium conditions, however; the moisture
uptake/removal for energy wheels is a transient process. The main objective of this chapter is to
compare the performance of wheels coated with a mesoporous high amylose starch (HAS) and
mesoporous silica gel samples. The physical and sorption properties of the desiccants were
characterized through several methods. In addition, nitrogen and water vapor adsorption was
studied for the desiccant particles and coated exchangers, respectively. Moreover, the latent
effectiveness of the energy wheels was predicted by performing the transient test on the small-
scale exchangers coated with HAS and silica gel samples.
Experimental
Materials
A sample of high amylose starch (HAS15, dp = 15 μm, Pw = 46 Å) was considered for the
water vapor sorption study due to its high water vapor sorption capacity compared to the other
types of starch (Dehabadi & Wilson, 2014). As reference materials for sorption study, two
mesoporous silica gel samples, SG55 (dp = 55 μm, Pw = 77 Å) and SG13 (dp = 13 μm, Pw = 62 Å)
with different particle sizes and pore width were selected. Figure 6.1 shows the molecular structure
of high amylose starch and amorphous silica gel.
Starch is polysaccharide available in two structural forms (i.e. amylose and amylopectin).
The composition of amylose (25%) and amylopectin content (75%) is ca. 1:3 (w/w). Amylose

146
consists of D-glucopyranose monomers connected via α-1,4 glycosidic bonds (Manners, 1985).
Amylopectin has similar molecular structure as amylose but it differs in the position of the
glycosidic linkages (α-1,6) that contributes to branching of the polysaccharide chain (every 25–30
units). This is the main reason for the crystallinity of starch. The ability of starch to adsorb water
is attributed to its interaction with accessible -OH groups along the polysaccharide backbone. In
the case of linear starch, it can adopt a helical arrangement, as evidenced by the formation of
supramolecular complexes in aqueous solution (Vårum & Smidsrod, 2004). The helical assembly
of linear starch involves cooperative electrostatic interactions such as hydrogen bonding, although
capillary condensation makes partial contribution to adsorption of water vapor at specific
conditions (Kulik et al. , 1994; Rebar et al. , 1984; Sair & Fetzer, 1944). Silica gel is an amorphous
form of silicon dioxide which exhibits a very strong affinity for water (Abere et al., 2007). The
surface of silica gel is polar and comprised of Si-O-Si and Si-OH groups that can adsorb water
molecules by dispersion forces and polar forces (Ng et al., 2001). The high porosity of silica gel
particles affords a relatively high surface area (400-600 m2/g) with favourable adsorption capacity
toward water vapor (0.30-0.45 gwater vapor/gsilica gel). In addition to its high adsorptive characteristics,
silica gel can be regenerated by low grade heat sources in the range 50-90 °C, illustrating its utility
as a good adsorbent for energy wheels.
n (a) (b)
Figure 6.1-A conceptual view of the molecular structure of a) high amylose “linear” starch
where the unit in parentheses show the glycosidic linkage of a disaccharide fragment of
starch and the various hydroxyl groups (n reflects the chain length of starch) , and b) a 2-D
perspective of the framework and surface structure of an amorphous silica gel.

147
Characterization of the Samples
In order to specify the surface functional groups of HAS and silica gel samples, Fourier
Transform infrared (FTIR) spectra were obtained with a BIO-RAD FTS-40 spectrophotometer
operating in diffuse reflectance mode. Multiple scans were obtained with a 4 cm−1 resolution and
corrected against spectroscopic grade potassium bromide (KBr) background as the sample matrix
over the spectral range of 400–4000 cm−1. The particle size of the samples were measured by
Mastersizer S Long Bench Particle Size Analyzer (PSA), Malvern Instruments. The particle size
was detected by capturing of the scattering pattern from the sample once they passed through a
laser beam.
To obtain the surface area and pore width distribution of the adsorbents, nitrogen gas
adsorption tests were performed by using a Micromeritics ASAP 2020 (Norcross, GA). The
surface area was calculated from the adsorption isotherm (Copeland et al., 2009) and the micropore
surface area was determined using the de Boer t-plot method (Broekhoff, 1968). Images of the
surface morphology of the exchanger sheets coated with the desiccant materials were obtained
using a scanning electron microscope (SEM) using a Hitachi FEG-SEM SU6600.
Small-Scale Exchanger
To study the transient behavior of the energy wheel, three small-scale exchangers were
built which were coated with HAS15, SG13, and SG55 particles. The geometry and dimensions
of the exchangers were illustrated by the schematic in Figure 4.2. The powder coating method,
discussed in section 4.5.2 was used to coat the aluminum substrate of the exchangers.
Transient Test Facility
The transient test facility, presented in section 4.5.3. was used to subject the stationary
coated energy exchangers to a sudden change in the inlet humidity. The schematic of the transient

148
test setup was shown before in Figure 4.3. To perform the single step transient tests, dry and humid
airstreams were provided, as listed in Table 6.1.
Table 6.1-Air condition properties and the flow rates for the transient
adsorption/desorption tests Volumetric flow rate
(L/min)
Face velocity
(m/s) Redh
Air temperature
(°C)
Patm
(bar)
Dry airstream
RH (%)
Humid airstream
RH (%) ΔRHst (%)
15 ± 1 0.05 ± 0.005 26 ± 1 22.5 ± 0.5 1.01 4 ± 2 44 ± 2 40 ± 2
Results and Discussion
Desiccant and Coated Sheets
The IR spectra of silica gel samples and high amylose starch are shown in Figure 6.2. The
following characteristic IR bands for high amylose starch are observed: O-H stretching ∼3400
cm−1, C-H stretching ∼2900 cm−1, and C-C stretching ∼1600 cm−1 (Crini, 2005). Characteristic
ring vibrations and anomeric C-H deformation bands are observed between 900 and 550 cm−1. The
IR results for the silica gel materials show an intense band at 1092 cm -1 which relate to the
stretching vibration of the Si-O bond, 803 cm-1 band according to the ring structure of SiO4, along
with a 464 cm-1 band due to deformation vibration of Si-O-Si (Decottignies et al., 1978; Gallas et
al., 1997; Gillis-D’hamers et al., 1993; Maniar et al., 1990; Almeida & Pantona, 1990; Rumph &
Schubert, 1978; Wood & Rabinovich, 1989). In addition to Si-O bands, there is a broad band at
3440 cm -1 due to the presence of hydroxyl groups. The spectral frequencies and features for high
amylose starch and silica gel are in agreement with a reported study (Costa et al., 1997).

149
Figure 6.2-IR spectra of the silica gels and high amylose starch samples
Figure 6.3 shows the volume distribution of the samples with respect to the particle size
where the average particle diameter (dp) values are listed in Table 6.2. Based on the particle size
measurements, SG55 has the largest average particle diameter (55 m); whereas, the particle
diameter of SG13 and HAS15 are nearly identical (13-15 m). In Figure 6.3, the results for SG55
and HAS55 indicate a relatively narrow particle size distribution (PSD). The greater band width
observed for SG13 reveals a PSD with a wider range as compared with HAS15 and SG55 in
Table 6.2. Although the samples show mesoporous character, the available SA of HAS15 is
considerably less than the silica gel samples. The nitrogen adsorption isotherms are displayed in
Figure 6.4 where comparatively steep hysteresis loops occur at the relative pressure P/P0= 0.6 for
SG15 and SG13, in agreement with the mesoporous network structure of silica gel. Although the
chemical composition of the silica gel materials are similar, SG13 adsorbs more N2 uptake
compared to SG55 at relative pressures (P/P0) below 0.8. This is attributed to the monolayer
adsorption of N2 onto the silica gel surface. As a result, SG13 with its larger SA (478 m2/g), greater
uptake was observed relative to SG55 (SA = 392 m2/g). On the other hand, at higher relative
pressures (P/P0 > 0.8), the sorption capacity of SG55 increased and converged to values observed

150
for SG13. The results coincide with the larger pore width and pore volume of SG55, which are
the key parameters for such sorption processes at higher P/P0 values (Li et al., 2007). In
comparison to SG samples, the HAS15 shows lower N2 uptake at each P/P0 value, in accordance
with its lower SA. Consequently, reduced interactions may occur between N2 and the HAS15
surface. At P/P0 ∼ 0.8, greater adsorption of N2 occurs due to adsorption at the grain boundaries.
At P/P0 < 0.8, the hysteresis is seen in the sorption isotherms occur such that the moisture content
is lower for desorption curves compared to the adsorption curve at the same P/P0 value. This could
be attributed to shrinkage of the HAS15 polymer framework at low relative pressures and
expansion of the framework at higher relative pressures due to pore filling of the adsorption sites
with nitrogen. This behavior is common for analogous types of network polymers (Ayoub & Rizvi,
2009).
Figure 6.3-Particle diameter distribution of silica gel desiccant obtained from laser particle
size analyzer
Table 6.2-Physical properties of the desiccant samples obtained by laser particle size
analyzer* and N2 gas adsorption†
Sample ID Material dp (μm) Average PW† (Å) Accessible SA†
(m2/g)
Pore volume Pv†
(cm3/g)
HAS15 High Amylose Starch 15 46 0.56 0.0006
SG13 Silica Gel 13 62 478 0.7409
SG55 Silica Gel 55 77.5 392 0.7595
The average pore width (PW) and particle surface area (SA), obtained through N2 gas adsorption tests are listed
0
2
4
6
8
10
12
14
16
0.1 1 10 100 1000
Volu
me d
itrib
uti
on
(%
)
Particle size (µm)
SG 13 μm
SG 55 μm
HAS 15 μm

151
Figure 6.4-Sorption isotherms for a) SG 55, b) SG13 and c) HAS15 obtained through N2
gas sorption test at 77 K (Solid lines serve as an illustrative guide)
Figure 6.5 shows the SEM images of the coated surface of the aluminum sheets used in the
small-scale exchangers. Accordingly, the silica gel particles have irregular shapes with sharp edges
while the starch particles are smoother in shape. The SEM images also show a layer of coated
particles with almost uniform coating pattern for each of the samples. With this coating method,
the particles are not fully submerged into the acrylic bonding agent. The improved coating method
enables investigation of the sorption properties of the particles whilst minimizing small effects due
to the bonding agent. However, the surface of the substrate was not entirely coated with desiccant
particles, potentially contributing to water vapor sorption via polar groups of the acrylic resin. The
effects of bonding agent on the sorption during the dehumidification and regeneration steps are
discussed further in section 3.2.
0
0.2
0.4
0.6
0.8
1
0 0.2 0.4 0.6 0.8 1
Qu
an
tity
ad
sorb
ed
(cm
3H
2O
/gd
es)
Relative pressure (P/P0)
HAS 15 µm, desorption
HAS 15 µm, adsorption
0
150
300
450
600
0 0.2 0.4 0.6 0.8 1
Qu
an
tity
ad
sorb
ed
(cm
3H
2O
/gd
es)
Relative pressure (P/P0)
SG 55 µm, desorption
SG 55 µm, adsorption
0
150
300
450
600
0 0.2 0.4 0.6 0.8 1
Qu
an
tity
ad
sorb
ed
(cm
3H
2O
/gd
es)
Relative pressure (P/P0)
SG 13 µm, desorption
SG 13 µm, adsorption
(a) (b)
(c)

152
Figure 6.5-SEM images of aluminum substrate coated with HAS15, SG13, and SG55 at two
levels of magnification
Table 6.3 gives the total mass of desiccant particles coated onto each exchanger. The
amount of SG55 coated on the sheets is about three-fold larger than SG13 and HAS15. The
observed effect is also supported from a study that relates coating efficacy to particle textural
properties since there is a greater number of particles with fine powder grains, compared with
coarse particle grains (Zhu, & Zhang, 2005). It should be noted that the level of coating for
industrial energy wheels is about 0.8-1.6 mg/cm2 (Jeong & Mumma, 2005) which indicates that
the coating level for the small-scale exchanger described herein is within the acceptable range.
a) SG55 (x50) b) SG55 (x250)
c) SG13 (x50) d) SG13 (x250)
d) HAS15 (x50)
200 µm
200 µm
200 µm
c) HAS15 (x250)
40 µm
40 µm
40 µm

153
Table 6.3-Mass of coated particles on the small-scale coated exchangers
Sample Total mass coated (g) Mass coated per unit
area (mg/cm2)
Mass of desiccant to mass
of the matrix (%)
HAS15 3.20 ± 0.02 0.667 ± 0.004 0.6
SG13 3.12 ± 0.02 0.650 ± 0.004 0.6
SG55 9.32 ± 0.02 1.941 ± 0.004 1.9
Transient Test
The transient relative humidity and temperature curves during the dehumidification and
regeneration tests are shown in Figure 6.6. It can be seen that the relative humidity gradually
increases (for dehumidification test in Figure 6.6 (a)) or decreases (for regeneration test in
Figure 6.6 (b)), it approaches the equilibrium and reaches the inlet relative humidity (RHinlet, deh =
44 ± 2% and RHinlet, reg = 4 ± 2%). The temperature profiles for dehumidification and regeneration
are also presented in Figure 6.6 (c) and Figure 6.6 (d), respectively. A temperature increase during
the dehumidification in Figure 6.6 (c) is a result of heat of adsorption, whereas; the temperature
decreases during the desorption process, Figure 6.6 (d). Based on the results in Figure 6.6, the
temperature at the outlet of SG55 exchanger varies by 1.1 ± 0.2 °C which is substantially larger
than the temperature variations for HAS15 (0.5 ± 0.2 °C) and SG13 (0.1 ± 0.2 °C), which within
the thermocouple uncertainty bounds. This is due to the fact that a higher amount of SG55 was
coated onto the sheets and, consequently, greater moisture sorption occurred within the SG55
exchanger. However, if the sorption temperature variations for SG13 and HAS15 (with only 2.5%
different in their coating mass) are compared, it is realized that the temperature variations are c.a.
4-5 times larger in HAS15. This implies that the enthalpy of the sorption process is greater for
HAS15 which may be due to the stronger bonds between the adsorbed water vapor molecules and
hydroxyl groups on the HAS15 surface. It should be noted that further analytical study can be
applied on the results to determine the enthalpy of sorption for the tested desiccant through the
methods presented in the literature (Tao et al., 1992).

154
Figure 6.6-Relative humidity and temperature variations at the outlet of the exchangers
during the dehumidification and regeneration tests (maximum uncertainty in the
experimental data is URH = ±2 % and UT = ±0.2 °C)
For each test, the exchanger response was decoupled from the humidity response of the
sensors through the method proposed by Wang, et al. (2006). The response of the humidity sensors
was measured by monitoring the readings of the hollow test cell as it was subjected to the step
humidity increase/decrease. The humidity sensor response is illustrated by Figure 6.7. The sensor
response time (based on 90% of output) was estimated to be 22 s for dehumidification and 21 s for
regeneration. To determine if the aluminum substrate and acrylic adhesive participate in the
sorption of water vapor to variable extents, the response of non-coated exchangers with aluminum
sheets and sheets covered with bonding agent are shown in Figure 6.7. The trends demonstrate that
the transient response for both the aluminum sheets and sheets with acrylic adhesive are nearly
identical to the humidity sensor response. This implies that the sheets and adhesive bonding do not
contribute significantly to water vapor sorption for the dehumidification process.
0
10
20
30
40
50
0 1000 2000 3000
RH
ou
tlet
(%)
Time (s)
HAS 15 µm
SG 55 µm
SG 13 µm
21.0
21.5
22.0
22.5
23.0
23.5
24.0
0 500 1000 1500 2000 2500 3000
T(°
C)
Time (s)
HAS 15 µm
SG 55 µm
SG 13 µm
0
10
20
30
40
50
0 500 1000 1500 2000 2500 3000
RH
ou
tlet
(%)
Time (s)
HAS 15 µm
SG 55 µm
SG 13 µm
21.0
21.5
22.0
22.5
23.0
23.5
24.0
0 500 1000 1500 2000 2500 3000T
(°C
)
Time (s)
HAS 15 µm
SG 55 µm
SG 13 µm
(a) Dehumidification (b) Regeneration
(c) Dehumidification (d) Regeneration
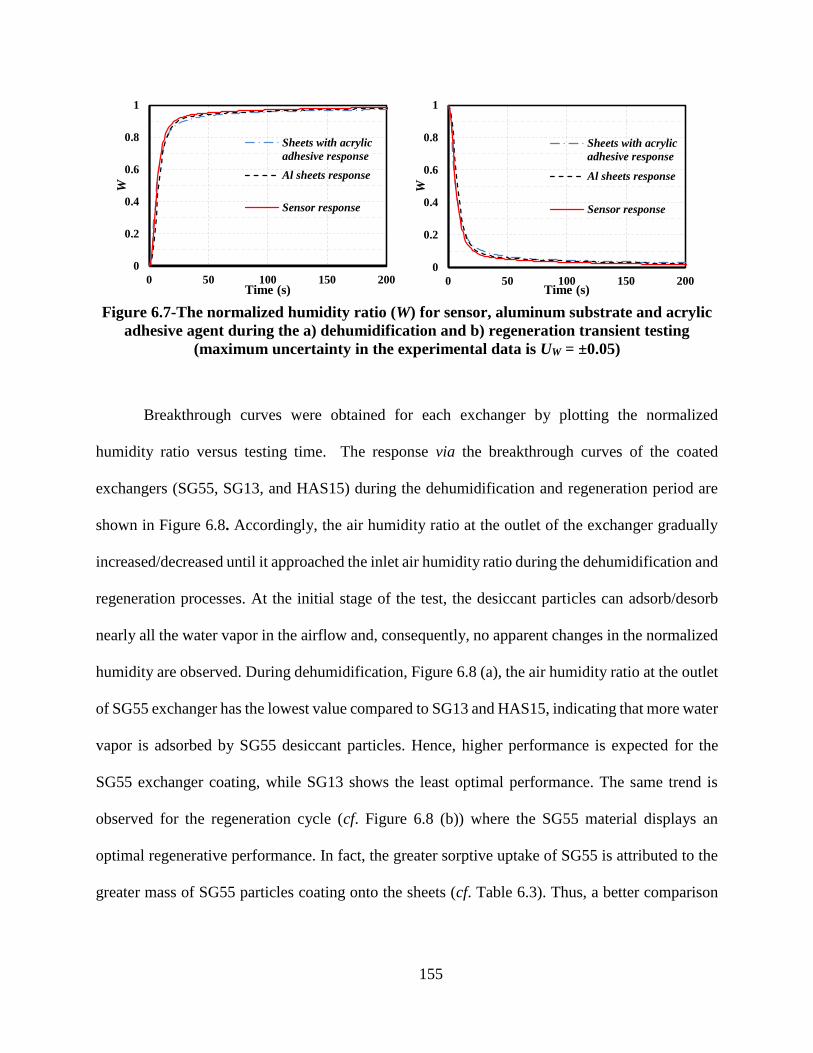
155
Figure 6.7-The normalized humidity ratio (W) for sensor, aluminum substrate and acrylic
adhesive agent during the a) dehumidification and b) regeneration transient testing
(maximum uncertainty in the experimental data is UW = ±0.05)
Breakthrough curves were obtained for each exchanger by plotting the normalized
humidity ratio versus testing time. The response via the breakthrough curves of the coated
exchangers (SG55, SG13, and HAS15) during the dehumidification and regeneration period are
shown in Figure 6.8. Accordingly, the air humidity ratio at the outlet of the exchanger gradually
increased/decreased until it approached the inlet air humidity ratio during the dehumidification and
regeneration processes. At the initial stage of the test, the desiccant particles can adsorb/desorb
nearly all the water vapor in the airflow and, consequently, no apparent changes in the normalized
humidity are observed. During dehumidification, Figure 6.8 (a), the air humidity ratio at the outlet
of SG55 exchanger has the lowest value compared to SG13 and HAS15, indicating that more water
vapor is adsorbed by SG55 desiccant particles. Hence, higher performance is expected for the
SG55 exchanger coating, while SG13 shows the least optimal performance. The same trend is
observed for the regeneration cycle (cf. Figure 6.8 (b)) where the SG55 material displays an
optimal regenerative performance. In fact, the greater sorptive uptake of SG55 is attributed to the
greater mass of SG55 particles coating onto the sheets (cf. Table 6.3). Thus, a better comparison
0
0.2
0.4
0.6
0.8
1
0 50 100 150 200
W
Time (s)
Sheets with acrylic
adhesive response
Al sheets response
Sensor response
0
0.2
0.4
0.6
0.8
1
0 50 100 150 200
W
Time (s)
Sheets with acrylic
adhesive response
Al sheets response
Sensor response

156
is made when the sorption characteristics were reported according to a mass basis (per unit mass
of desiccant).
Figure 6.8-The response (breakthrough curves) of small-scale exchangers a)
dehumidification (RH = 44% and Tair= 22.5 °C) and b) regeneration transient testing (RH =
4% and Tair = 22.5 °C) (maximum uncertainty in the experimental data is UW = ±0.05)
To express the results based on unit mass of desiccant, the moisture uptake (Ωupt) and
moisture removal (Ωreg), the amount of water vapor adsorbed/desorbed by per gram of desiccant
during the dehumidification and regeneration cycle, were calculated by (5.2) The moisture uptake
and removal for coated exchangers is shown in Figure 6.9. Accordingly, it can be seen that the
silica moisture uptake of SG13 is higher than that of SG55 at the beginning of the test, t < 200 s
(Figure 6.9 (a)). Thereafter, the moisture uptake of both the silica gel samples becomes almost
identical, where the effect agrees with the results for the N2 gas uptake isotherms, where SG13
reveals slightly greater N2 uptake at P/Po = 0.45 and T = 77 K. However, a direct comparison
between the N2 and water vapor adsorption is not readily comparable due to difference in size and
dipolar character of each gas along with the relative temperature conditions for the isotherms.
0
0.2
0.4
0.6
0.8
1
0 100 200 300 400 500 600
W
Time (s)
HAS 15 µm
SG 55 µm
SG 13 µm
0
0.2
0.4
0.6
0.8
1
0 100 200 300 400 500 600
W
Time (s)
HAS 15 µm
SG 55 µm
SG13 µm
(a) Adsorption (b) Desorption

157
Figure 6.9-Moisture uptake/removal with time during the a) dehumidification and b)
regeneration transient testing
Despite the fact that HAS15 showed poor performance for N2 gas sorption, it has greater
water vapor sorption capacity compared to the both silica gel samples. This phenomenon cannot
be readily explained due to the microstructure of HAS15 since its pore size closely matches the
silica gels samples, however; the accessible surface area is much lower. In fact, the high moisture
uptake of the starch may be due to the strong dipolar interactions between the hydroxyl functional
groups in HAS15 and the adsorbed water. In addition, new sorption sites would be formed by
expansion of the framework and surface deformation of starch as hydrogen bonding likely occurs
between starch particles and adsorbed water (Ayoub & Rizvi, 2009). It should be noted that the
measured sorption capacities for the samples are typically underestimated since the adsorbents
were not fully evacuated at the start of the adsorption test. The dehumidification and regeneration
capacity can also be determined from Figure 6.9 by examining the moisture uptake and removal
at the equilibrium condition (t > 600 s). The observed HAS15 dehumidification capacity is about
140% greater than that of the silica gel samples over the test period. Another observation from
Figure 6.9 is the difference between the dehumidification capacity (sorption capacity) and
regeneration capacity over the test period at the specified operating condition. In fact, the
(a) Adsorption (b) Desorption
0
0.01
0.02
0.03
0.04
0.05
0.06
0 100 200 300 400 500 600
Up
tak
e (m
gw
v/g
des
)
Time (s)
HAS 15 µm
SG 55 µm
SG 13 µm0
0.01
0.02
0.03
0.04
0.05
0.06
0 100 200 300 400 500 600
Rem
ov
al
(mg
wv/g
des
)
Time (s)
HAS 15 µm
SG 55 µm
SG13 µm

158
dehumidification and regeneration capacity is expected to be identical (for no capillary
condensation), but most of the time this was achieved by performing the test for longer duration
with elevated regeneration temperature. In hygroscopic wheels, a desiccant with better
regeneration transient performance is preferred due to the cyclic nature of the adsorption-
desorption cycle. Based on the results presented in Figure 6.9, the complete regeneration of the
samples with air at 4% RH at 22.5 °C and the same flow rate used for dehumidification is not
apparent which suggests capillary condensation within the desiccant pores. In this situation, a
greater amount of energy (temperature, flow rate, or exposure time) is required to regenerate the
samples. Among the samples, HAS15 revealed the highest regeneration capacity compared to the
silica gel materials. The relatively high water vapor dehumidification and regeneration capacity of
HAS15 compared to silica gel materials indicate that HAS15 is a suitable alternative for energy
wheels.
In addition to sorption capacity, the kinetic rate of sorption for the desiccant plays an
important role in the performance of energy wheels (Abe et al., 2006a, 2006b). From the slope of
moisture uptake/removal curves in Figure 6.9, the sorption rate in all cases was observed to be
highest at the beginning of the test which then decays to approximately zero value as the surface
becomes saturated. With the same surface functional groups, the difference in sorption rate of silica
gel samples are understood by differences in their microstructural features. The fast rate of sorption
at the beginning of the uptake profile is likely due to favorable interactions between the water
vapor and accessible sorption sites on the external sorbent surface (Qiu et al., 2009). The similar
pore width for SG13 (62 Å) and for SG55 (77 Å) indicate that the higher sorption rate observed
for SG13 may be attributed to its greater accessible surface area. As the accessibility of the sorption
sites decrease as the monolayer surface coverage increases for each adsorbate (N2 or H2O), the

159
sorption process is governed by molecular diffusion into micropore domains (Satoh et al., 1995).
For t >170 s, the SG13 and SG55 materials reveal similar kinetic profiles which suggest the role
of intrapore diffusion of water vapor. The highest sorption rate is seen for HAS15 where its greater
sorption rate cannot be accounted for by the microstructural features of the samples. As discussed
above, the surface functional groups play a key role in sorption of water vapor molecules, as
described for the starch-based materials (Rouquerol et al., 2014).
Latent Effectiveness
The time constants and weighting factors associated with the response of HAS15, SG13,
and SG55 small-scale coated exchangers were determined by fitting the DEM, eq. (4.3) to the
breakthrough curves in Figure 6.8. The weighting factors and time constants are listed in Table 6.4.
Using eqs. (4.6) and (4.1), the latent effectiveness of the wheels coated with HAS15, SG13, and
SG55 was predicted for the dehumidification and regeneration cycles at a face velocity of 0.05 m/s
(Re=26) and at different angular speeds, as shown in Figure 6.10. At each angular speed, the SG55
wheel had the highest latent effectiveness compared to the SG13 and HAS15 wheels. According
to the dehumidification results in Figure 6.10 (a), the latent effectiveness of the SG55 wheel is
about 8% more than the HAS15 wheel at ω = 0.5 rpm, which represents a typical angular speed
for such dehumidifiers. For energy wheels with higher angular speeds (ω > 10 rpm), the difference
in the latent effectiveness reduces to less than 2% which is within the experimental bounds of
uncertainty. Since the breakthrough curves cannot be expressed based on a per unit mass of
desiccant, the obtained weighting factors, time constants, and latent effectiveness are estimated to
be mass dependent. It should be noted that since the relative amount of SG55 coating is about 3
greater than that of SG13 and HAS15, the SG55 wheel is expected to have the highest
effectiveness. As silica gel particles are more expensive relative to starch, a detailed study is

160
required to further optimize the wheel design based on the desiccant mass and effectiveness for
greater improvements. Furthermore, if an alternative coating method is available to deposit more
starch particles on the substrates, the effectiveness of HAS15 wheel could be substantially
increased.
Table 6.4-Time constants, weighting factors, and coefficient of determinations (R2) for the
small-scale coated exchangers obtained by fitting the DEM to the breakthrough curves
Wheel
Dehumidification Regeneration
τ1 (s) γ1 τ2 (s) γ2 R2
τ1 (s) γ1 τ2 (s) γ2 R2
HAS15 36.4 0.80 438 0.20 0.9996 29.9 0.78 337 0.22 0.9996
SG13 22.9 0.91 291 0.09 0.9997 23.4 0.88 269 0.12 0.9998
SG55 60.2 0.86 469 0.14 0.9998 45.0 0.74 203 0.26 0.9997
Figure 6.10-Latent effectiveness (εL) of energy wheels predicted through transient testing of
the small-scale coated exchangers at variable conditions; a) dehumidification cycle b)
regeneration cycle and for the balanced supply and exhaust flow rates
0
20
40
60
80
100
HAS 15µm SG 13µm SG 55µm
ε L(%
)
0
20
40
60
80
100
HAS 15µm SG 13µm SG 55µm
ε L(%
)
ω = 0.5 rpm ω = 1.0 rpm
ω = 5.0 rpm ω = 20.0 rpm
(a) Adsorption (b) Desorption

161
In comparison to the SG13 coated wheel, a significant improvement in the latent
effectiveness of the HAS15 wheel coated was seen when using a similar amount of SG13
desiccant. When HAS15 is used instead of SG13 to coat the wheel, the latent effectiveness is
enhanced by 13.0%, 8.3%, and 3.5% at ω = 0.5, 1.0, and 5 rpm, respectively. For ω > 20 rpm, the
difference in the latent effectiveness of HAS15 and SG13 wheels is within the uncertainty bounds
(ca. 2%), where the same trend is seen for the latent effectiveness estimation that was based on
desorption data (regeneration cycle). Comparing the latent effectiveness in Figure 6.10 (a) and (b),
it can be seen that the latent effectiveness during regeneration at ω = 0.5 rpm is ca. 4-5% lower
than the latent effectiveness during the dehumidification step. This may be attributed to capillary
condensation within the pores of desiccants which often requires more energy input when
regenerating the desiccants. Based on these outcomes, it is suggested that the high amylose starch
may serve as a promising alternative desiccant material for energy wheels. However, further
studies are needed to investigate performance and stability of the starch and its modified forms
(Dehabadi & Wilson, 2015) during the dehumidification and regeneration steps at variable
operating conditions.
Summary and Conclusions
The goal of this chapter was to investigate the sorption performance of high amylose starch
(HAS) as an alternative for energy wheels. N2 and water vapor sorption isotherms were obtained
for mesoporous HAS15 (dp = 15 μm, Pw = 46 Å) and silica gel samples, SG55 (dp = 55 μm, Pw =
77 Å) and SG13 (dp = 13 μm, Pw = 62 Å). The N2 gas adsorption isotherm showed that HAS15
has considerably fewer accessible sorption sites and, consequently, less sorption capacity
compared to the silica gel samples. On the other hand, the transient water vapor sorption
experiments at 22.5 °C were conducted on a small-scale exchanger coated with HAS15, SG13, and

162
SG55. The results illustrate that the sorption rate and capacity of HAS15 per unit mass are greater
than the silica gel materials. This was likely the results of favorable electrostatic interactions
between the polar hydroxyl groups on the surface of HAS with water vapor. Using the transient
dehumidification and regeneration results at small-scale testing, the latent effectiveness of wheels
with the same geometry and coating were predicted. It was found that the latent effectiveness was
improved by 13% at angular speeds of 0.5 rpm by coating the wheel with HAS15 rather than SG13
particle grains. Compared to HAS15, the wheel coated with SG55 had a latent effectiveness ca.
8% higher at 0.5 rpm. The apparent difference was reduced to less than 2% as the angular speed
increased to more than 5 rpm. The better performance of SG55 coated wheel is attributed to the
higher mass of SG55 coated on the matrix. The good sorption behavior of high amylose starch
along with its biodegradability, relatively low cost, and potential for chemical modification implies
that this biopolymer desiccant represents a promising material for coating energy wheels.
However, further research is needed to investigate the sorption performance of HAS at different
operating conditions and its durability over a longer life cycle of the device. In addition, further
studies are required to show the effects of HAS on heat transfer within the energy wheels.

163
CHAPTER 7
7 SUMMARY, CONCLUSIONS, CONTRIBUTIONS, AND FUTURE WORK
This Ph.D. thesis investigates the performance of heat/energy wheels by conducting
transient testing on a component of the wheel (i.e. matrix). The main hypothesis is that the steady-
state effectiveness of rotary wheels can be determined from transient measurements on stationary
wheel components. To test the hypothesis, the thesis develops and validates a new transient facility
and data analysis method (including uncertainty) to investigate the effects of operating conditions
and desiccant properties (physical, chemical, sorption) on the performance of heat/energy wheels.
The results in the thesis reveal that the hypothesis is valid for a certain range of operating
conditions. In this chapter, a brief summary of the thesis, notable conclusions, and major
contributions are presented. In addition, the promising topics for future work and further studies
are provided.
Summary
Heat/energy wheels are commonly used in HVAC systems as a heat/energy recovery
exchanger to reduce the sensible and/or latent load needed to achieve indoor thermal comfort. This
Ph.D. research focuses on the feasibility of performing transient tests on a small component of the
heat/energy wheel to predict the performance of a full-scale wheel comprised of the same
components. Transient testing is an effective method to test wheels with reduced testing time and
cost compared to conventional steady-state testing methods. The component used in this study is
a few non-coated sheets for heat wheels and a few desiccant coated sheets for energy wheels.
In chapter 2, the test facility developed to perform the transient component testing on heat
wheels was described. The sensors and data acquisition system were explained and the calibration
process was discussed. In addition, the analytical method used to determine the sensible
effectiveness from the transient data was presented and validated with correlations in the literature.

164
Studying transient heat transfer results with no moisture transfer, this chapter partially covered the
first two objectives of the thesis, “to develop a novel testing facility for performing the transient
testing on heat wheel and energy wheel components” and “to predict the full-scale heat wheel
effectiveness with its uncertainty and to investigate the relationship between the sensible
effectiveness and operating conditions”.
In chapter 3, the analytical model for transient testing was modified to account for a second
mode of heat transfer observed in the transient testing. It was shown that this second mode can be
attributed to the heat loss/gain that occurs during a test. The modified analytical model was used
to decouple the second mode from the results and a sensitivity analysis was performed to study the
effects of heat loss/gain on the sensible effectiveness obtained from the transient component
testing. The effects of heat loss were also studied experimentally for different temperature
differences between the hot and cold airstreams and various face velocities. Chapter 2 and 3,
together, addressed the second objective of the thesis, “to predict the full-scale heat wheel
effectiveness with its uncertainty and to investigate the relationship between the sensible
effectiveness and operating conditions”.
Chapter 4 focused on moisture transfer in energy wheel components while no heat transfer
occurred during the tests. The transient test facility was modified to measure moisture transfer by
adding humidity sensors and a humidifying/dehumidifying system. In addition, chapter 4 described
a novel powder coating method that was used to coat the wheel component with mesoporous silica
gel particles. The moisture uptake/removal occurring in the exchanger and the humidity response
of the coated exchanger were studied during the transient test. With the humidity response of the
wheel, the transient analytical model (developed in chapter 3) was used to analyze the data and
determine the latent effectiveness. The sorption properties of the desiccant at equilibrium were

165
studied from nitrogen and water vapour sorption isotherms. A correlation in the literature was used
to verify the transient testing results. This chapter combined with chapter 2, fully addressed the
first objective of the thesis, “to develop a novel testing facility for performing the transient testing
on heat wheel and energy wheel components”. In addition, the third objective, “to predict the full-
scale energy wheel effectiveness with its uncertainty and to investigate the relationship between
the latent effectiveness and operating conditions”, was also fulfilled in this chapter.
In chapter 5, the transient component testing was used to investigate the effects of physical
and sorption properties of desiccant materials on moisture recovery. Different mesoporous silica
gel samples with a range of particle size and pore widths were coated on the exchanger matrix with
the powder coating method. Similar to chapter 4, the humidity response of the exchangers to the
inlet step humidity change and the transient moisture uptake/removal were obtained at room
temperature (22 °C) and various air flow rates. Applying the modified transient model (developed
in chapter 3), the latent effectiveness values were calculated for the exchangers coated with silica
gel particles with different particle size and pore width. Chapter 5 focused on the fourth objective
of this thesis, “to identify the effects of physical, chemical, and sorption properties of desiccant on
the latent effectiveness of energy wheels”.
In chapter 6, the effects of the chemical functional groups on the moisture sorption was
investigated. A sample of starch was compared with two silica gel samples by coating the small-
scale exchangers (energy wheel component) with the starch and silica gel samples. The transient
component testing was performed on the coated exchangers. Chapter 5 addressed the fourth
objective of this thesis, “to identify the effects of physical, chemical, and sorption properties of
desiccant on the latent effectiveness of energy wheels”.
Conclusions
The following are the major conclusions and outcomes achieved through this Ph.D. research:

166
The transient method of testing the heat wheel component can successfully predict
the sensible effectiveness of full-scale wheels when the heat capacity rate ratio is
higher than 10 and 2 < NTU < 13. For heat capacity rate ratios of less than 0.5, the
modified transient model should be used to account for heat loss/gain in the
transient testing. Comparing the sensible effectiveness values calculated from the
transient testing and the literature correlations, it is observed that the transient
component testing results in the lower sensible effectiveness values (more than 5%
difference at Cr* > 5) if heat losses are not considered.
The transient method of testing the energy wheel component can successfully
predict the latent effectiveness at certain operating conditions. Good agreement is
seen between the effectiveness valued determined by the transient test method and
the literature correlation when NTUm < 4.3 and ω > 4 rpm. It should be noted that
the discrepancy at low wheel angular speeds and higher NTUm is likely due to the
uncertainties involved in the calculation of the exchanger properties, such as
effective area for moisture transfer and convective mass transfer coefficient.
The sorption properties of desiccant particles can substantially affect the latent
effectiveness of energy wheels. Analyzing the latent response of the silica gel
coated exchangers, it was found that the latent effectiveness increases, especially
at lower wheel speeds, as the desiccant pore width reduces and the specific surface
area increases. At ω = 1 rpm and Re = 26, the latent effectiveness increases by
more than 15% when the pore width reduces from 115 Å to 63 Å; whereas, a small
increase is observed in the latent effectiveness at ω = 20 rpm.

167
For the silica gels with similar pore widths (77 Å and 63 Å), the latent effectiveness
slightly increases (3-5% at ω = 20 rpm) as the desiccant particle size increases
from 55 μm to 150 μm. This is due to the greater mass of coating obtained through
the powder coating for larger particles. In general, the influence of particle size on
the latent effectiveness is less important than pore width for mesoporous silica gel
samples.
The sorption rate and capacity of high amylose starch per unit mass are greater
than the mesoporous silica gel samples studied in this thesis. This was likely the
results of favorable electrostatic interactions between the polar hydroxyl groups on
the surface of starch and the water vapor molecule. The predicted latent
effectiveness was 13% higher (at ω = 0.5 rpm) for a wheel coated with starch rather
than silica gel. Almost the same latent effectiveness is observed for starch and
silica gel coated exchangers when ω > 20 rpm. Considering that starch typically
costs less than silica gel, the results show a good potential for the starch to be used
as an alternative desiccant in the energy wheels.
It is suggested that a desiccant material with a higher sorption rate and a higher
sorption capacity will have a higher latent effectiveness. A small pore width and a
high specific surface area will result in a high sorption capacity. However, the
sorption rate reduces as the pore size decreases. For this purpose, the transient
testing of wheel components can be used to test desiccants with a range of
microstructure, and ultimately, would aid in the development of improved wheels
without requiring an entire wheel to be constructed.

168
Contributions
The outcomes of this research contribute towards designing enhanced heat/energy wheels.
The main contributions of this Ph.D. thesis are as listed below:
Transient Component Testing of Heat Wheels and Energy Wheels
A novel test facility was developed to perform transient testing on the components of
heat/energy wheels.
The wheel components for transient tests were designed in the form of a small-scale
parallel-plate exchanger and a powder coating method was developed to deposit micron
size desiccant particles on a laboratory-scale wheel matrix with small interaction with
bonding agent.
Performance Analysis for Wheel Component and Full-Scale Wheel
The transient analytical model was modified and validated specifically for the transient
component testing.
The transient component test data were used to determine the sensible and latent
effectiveness and the results were validated with effectiveness values determined from
correlations of full-scale wheels with the same flow channel geometry, dimensions, and
materials.
The uncertainty bounds for the transient component testing were identified.
The effects of air flow rate, temperature, and humidity on the heat and moisture transfer
were investigated and validity ranges for the transient component testing were determined.
Desiccant Selection based on the Transient Component Testing of Energy Wheels
The kinetics of sorption were investigated using the transient test. While standard
equilibrium tests can determine the sorption capacity of desiccants, the transient test is a
useful method to study the sorption rate and kinetics of moisture transfer.

169
The transient moisture uptake/removal was correlated to the physical, chemical, and
sorption properties of desiccants and the performance of wheels with different desiccant
particles were compared.
The thesis showed that the transient method can be used to study new materials (e.g.
biopolymer starch) and alternative desiccants can be proposed to coat the energy wheels.
Future Work
Coupled Heat and Moisture Transfer Study
Since heat and mass transfer occur simultaneously in energy wheels, it is recommended to
study coupled heat and moisture transfer in energy wheels by performing transient component
testing. The heat of phase change during the sorption process can significantly alter the thermal
response of the wheel. These effects were observed in some of the experiments which were not
presented in this thesis. To account for the changes in sensible effectiveness due to heat of phase
change, the analytical model should be modified. In addition, the influence of temperature on the
sorption properties of desiccants (sorption rate, sorption capacity) could be investigated using the
transient component testing. Further study is required to investigate the effects of thermal
properties of the desiccant on the sensible effectiveness. Increasing the internal porosity while
keeping the pore width constant is expected to reduce thermal conductivity of a desiccant. This
may increase the thermal resistance for heat transfer, and consequently, reduces the sensible
effectiveness.
Modification of Transient Analytical Model and the Test Facility for Counter-Flow
Arrangement
The analytical model developed in this thesis corresponds to the experiments with parallel
airflow. Then, the results were transformed to determine the effectiveness of the wheel with a
counter-flow arrangement. This caused a large uncertainty at some specific operating conditions.

170
Therefore, it is suggested to modify the test facility to allow the component testing to be performed
under a counter-flow arrangement. Furthermore, the analytical model should be modified in order
to relate the thermal and latent response of the wheel component in the counter-flow arrangement
to the sensible and latent effectiveness of full-scale wheels. This would also be beneficial for
performing cyclic tests as the inlet conditions are similar to full-scale wheels.
Transient Component Testing for Desiccant Wheels
Since desiccant drying wheels are widely used in desiccant cooling and dehumidifying
systems, it is recommended to extend the transient testing to study desiccant drying wheel
components. The main challenge in this work would be modeling the significant heat of sorption.
In the case of desiccant wheels, the temperature and humidity profiles along the wheel change
significantly and these need to be accurately estimated. With the temperature and humidity profiles
in the desiccant drying wheel, a similar analytical method, as given in Chapter 2, can be followed
to develop a transient analytical model for desiccant drying wheels in a counter-flow arrangement.
Durability Tests and Life Cycle Analysis
The results presented in Chapter 7 showed that starch has great potential for coating energy
wheels. However, factors such as the feasibility of using industrial processes to coat the starch on
a wheel, the durability of the coating, and desiccant costs were not considered in this chapter.
Further durability and economic studies are recommended for any proposed desiccants over a 5-
10 year life cycle of wheels. In addition, testing the desiccant at extreme conditions (e.g. very hot
and humid) is required to fully address the durability and performance of these materials.

171
REFERENCES
Abe, O. O., Simonson, C. J., & Besant, R. W. (2006a), Relationship between energy wheel speed
and effectiveness and its transient response, part I: mathematical development of the
characteristic time constants and their relationship with effectiveness. ASHRAE
Transactions, 112, 89–102.
Abe, O. O., Simonson, C. J., & Besant, R. W. (2006b), Relationship between energy wheel speed
and effectiveness and its transient response, part II: comparison between mathematical
model predictions and experimental measurements and uncertainty analysis. ASHRAE
Transactions, 112, 103–115.
Abe, O. O., Simonson, C. J.., Besant, R. W., & Shang, W. (2006a), Effectiveness of energy
wheels from transient measurements. Part I: Prediction of effectiveness and uncertainty.
International Journal of Heat and Mass Transfer, 49 (1–2), 52–62.
Abe, O. O., Simonson, C. J., Besant, R. W., & Shang, W. (2006b), Effectiveness of energy
wheels from transient measurements: Part II—Results and verification. International
Journal of Heat and Mass Transfer, 49 (1–2), 63–77.
Abere, T. A., Okeri, H. A., & Okafor, L. A., (2007), Comparative evaluation of selected starches
as adsorbent for Thin-layer Chromatography, Tropical Journal of Pharmaceutical,4 (1),
331-339.
Almeida, R. M., & Pantano, C. G., (1990). Structural investigation of silica gel films by infrared
spectroscopy. Journal of Applied Physics, 68 (8), 4225–4232.
Angrisani, G., Minichiello, F., Roselli, C., & Sasso, M., (2012), Experimental analysis on the
dehumidification and thermal performance of a desiccant wheel. Applied Energy, 92, 563–
572.
ANSI/AHRI, (2014), ARI Standard 1060-2011, Performance rating of air-to-air heat
exchangers for energy recovery ventilation equipment, Arlington: Air-Condition and
Refrigeration Institute.
ANSI/ASHRAE, (2013), Standard 84, Method of testing air-to-air heat/energy exchangers,
Atlanta.
ASHRAE, (2008). ASHRAE, HVAC systems and equipments. Atlanta.
Ashrae, & IES, (2011). ANSI/ASHRAE/IES Standard 90.1-2010 Energy Standard for Buildings
Except Low-Rise Residential Buildings, Ashrae Standard.
Asiedu, Y., Besant, R. W., & Simonson, C. J., (2004), Wheel selection for heat and energy

172
recovery in simple HVAC ventilation design problems, ASHRAE Transactions, 110 (1),
381–398.
Asiedu, Y., Besant, R. W., & Simonson, C. J., (2005), Cost effective design of dual heat and
energy recovery exchangers for 100% ventilation air in HVAC cabinet units, ASHRAE
Transactions, 111 (1), 857–872.
Ayoub, A. S., & Rizvi, S. S., (2009), An Overview on the Technology of Cross-Linking of
Starch for Nonfood Applications. Journal of Plastic Film and Sheeting , 25 (1 ), 25–45.
Baclic, B. S., (1985), The Application of Galerkin Method to the Solution of the Symmetric and
Balanced Counterflow Regenerator Problem, Transactions of ASME, Journal of Heat
Transfer, 107, 221–241.
Bartell, F. E., & Bower, J. E., (1952), Adsorption of vapors by silica gels of different structures.
Journal of Colloid Science, 7 (1), 80–93.
Bauccio, M., (1993), ASM Metals Reference Book, 3rd Ed., Materials Park, OH.
Beery, K. E., & Ladisch, M. R., (2001), Chemistry and properties of starch based desiccants.
Enzyme and Microbial Technology, 28 (7-8), 573–581.
Benesi, H. A., & Jones, A. C., (1959), An infrared study of the water-silica gel system. The
Journal of Physical Chemistry, 63 (2), 179–182.
Bolster, J., (2012), Improved desiccant coating for heat and water vapour transfer on the matrix
surfaces of air-to-air regenerative wheels, M.Sc. Thesis, University of Saskatchewan.
Broekhoff, J., (1968), Studies on pore systems in catalysts XI. Pore distribution calculations from
the adsorption branch of a nitrogen adsorption isotherm in the case of ink-bottle type pores.
Journal of Catalysis, 10 (2), 153–165.
Brunauer, S., Deming, L. S., Deming, W. E., & Teller, E., (1940), On a theory of the van der
Waals adsorption of gases. Journal of the American Chemical Society, 62 (7), 1723–1732.
Buyukalaca, O., & Yilmaz, T., (2002), Influence of rotational speed on effectiveness of rotary-
type heat exchanger, Heat and Mass Transfer, 38, 441–447.
Chang, K.-S., Chen, M. T., & Chung, T.W., (2005), Effects of the thickness and particle size of
silica gel on the heat and mass transfer performance of a silica gel-coated bed for air-
conditioning adsorption systems, Applied Thermal Engineering, 25 (14-15), 2330–2340.
Chua, K. J., & Chou, S. K., (2003), Low-cost drying methods for developing countries, Trends in
Food Science & Technology, 14 (12), 519–528.
Ciepliski, D. L., (1997), Testing an Air-to-Air Energy Recovery Device Using Performance Test
Standards. M.Sc. Thesis, University of Saskatchewan.

173
Collier, R. K. J., (1989), Desiccant properties and their effect on cooling system performance.
ASHRAE Transactions, 95, 823–827.
Copeland, L., Blazek, J., Salman, H., & Tang, M. C., (2009), Form and functionality of starch.
Food Hydrocolloids, 23 (6), 1527–1534.
Costa, T. M. H., Gallas, M. R., Benvenutti, E. V., & da Jornada, J. A. H., (1997), Infrared and
thermogravimetric study of high pressure consolidation in alkoxide silica gel powders,
Journal of Non-Crystalline Solids, 220 (2-3), 195–201.
Crini, G., (2005), Recent developments in polysaccharide-based materials used as adsorbents in
wastewater treatment, Progress in Polymer Science, 30 (1), 38–70.
Decottignies, M., Phalippou, J., & Zarzycki, J., (1978), Synthesis of glasses by hot-pressing of
gels, Journal of Material Science, 13, 2605–2618.
Dehabadi, L., & Wilson, L. D., (2014), Polysaccharide-based materials and their adsorption
properties in aqueous solution, Carbohydrate Polymers, 113, 471–9.
Dehabadi, L., & Wilson, L. D., (2015), An NMR investigation of the fractionation of water-
ethanol mixtures with cellulose and its cross-linked biopolymer forms, Energy & Fuels, 29
(10), 6512-6521.
Donohue, M. D., & Aranovich, G. L., (1999), A new classification of isotherms for Gibbs
adsorption of gases on solids, Fluid Phase Equilibria, 158-160, 557–563.
Eduardo, C., & Nóbrega, L., (2014), Desiccant-Assisted Cooling Fundumentals and Applictions.
London, Springer.
Eicker, U., Schürger, U., Köhler, M., Ge, T., Dai, Y., Li, H., & Wang, R., (2012), Experimental
investigations on desiccant wheels, Applied Thermal Engineering, 42, 71–80.
Enteria, N., Yoshino, H., Satake, A., Mochida, A., Takaki, R., Yoshie, R., Baba, S., (2010),
Experimental heat and mass transfer of the separated and coupled rotating desiccant wheel
and heat wheel, Experimental Thermal and Fluid Science, 34 (5), 603–615.
Fathieh, F., Besant, R. W., Evitts, R. W., & Simonson, C. J., (2015), Determination of air-to-air
heat wheel sensible effectiveness using temperature step change data, International Journal
of Heat and Mass Transfer, 87, 312–326.
Fathieh, F., Besant, R. W., Evitts, R. W., & Simonson, C. J., (2016a), Effects of heat loss/gain on
the transient testing of heat wheels, ASME Journal of Thermal Science and Engineering
Applications, 8 (3), 1003-1015.
Fathieh, F., Dehabadi, L., Wilson, L. D., Besant, R. W., Evitts, R. W., & Simonson, C. J.,

174
(2016b), Sorption study of a strach biopolymer as an alternative desiccant for energy
wheels, ACS Sustainable Chemistry & Engineering, 4 (3), 1262–1273.
Fathieh, F., Rafati Nasr, M., Sadeh, S., Besant, R. W., Evitts, R. W., Müller, J., & Simonson, C.
J., (2016c), Determination of Air-to-Air Energy Wheels Latent Effectiveness Using
Humidity Step Test Data. International Journal of Heat and Mass Transfer, Accepted
manucript.
Figliola, R. S., & Beasley, D. E., (2006), Theory and design for mechanical measurements, New
York: John Wiley & Sons, Inc.
Gallas, M. R., Rosa, A. R., Costa, T. H., & Jornada, J. A. H. da. (1997). High pressure
compaction of nanosize ceramic powders, Journal of Materials Research, 12 (03), 764–768.
Ge, T. S. S., Dai, Y. J. J., & Wang, R. Z. Z., (2014), Review on solar powered rotary desiccant
wheel cooling system. Renewable & Sustainable Energy Reviews, 39, 476–497.
Gillis-D’hamers, I., Vrancken, K. C., Vansant, E. F., & De Roy, G., Fourier-transform infrared
photo-acoustic spectroscopy study of the free hydroxyl group vibration: dependence on the
pretreatment temperature, Journal of the Chemical Society, Faraday Transactions, 88 (14),
2047–2050.
Goldsworthy, M., & White, S. D., (2012), Limiting performance mechanisms in desiccant wheel
dehumidification, Applied Thermal Engineering, 44, 21–28.
Golubovic, M. N., Hettiarachchi, H. D. M. D. M., & Worek, W. M., (2006), Sorption properties
for different types of molecular sieve and their influence on optimum dehumidification
performance of desiccant wheels. International Journal of Heat and Mass Transfer, 49 (17-
18), 2802–2809.
Golubovic, M. N., Madhawa Hettiarachchi, H. D., Belding, W., & Worek, W. M. (2006). A new
method for the experimental determination of Lewis’ relation. International
Communications in Heat and Mass Transfer, 33 (8), 929–935.
Gorbach, A., Stegmaier, M., & Eigenberger, G., (2004), Measurement and Modeling of Water
Vapor Adsorption on Zeolite 4A -Equilibria and Kinetics, 10, 29–46.
Greenspan, L., & others, (1977), Humidity fixed points of binary saturated aqueous solutions.
Journal of Research of the National Bureau of Standards, 81 (1), 89–96.
Harding, A. W., Foley, N. J., Norman, P. R., Francis, D. C., & Thomas, K. M., (1998), Diffusion
Barriers in the Kinetics of Water Vapor Adsorption/Desorption on Activated Carbons.
Langmuir, 14, 3858–3864.
Haul, R., Gregg, S. J., Sing, K. S. W., (1982), Adsorption, Surface Area and Porosity. Auflage,

175
Academic Press, London.
Jeong, J.-W., & Mumma, S. A., (2005), Practical thermal performance correlations for molecular
sieve and silica gel loaded enthalpy wheels, Applied Thermal Engineering, 25 (5-6), 719–
740.
Kamitsos, E. I., Patsis, A. P., & Kordas, G. (1993), Infrared-reflectance spectra of heat-treated
sol-gel-derived silica, Physical Review B, 48 (17), 12499–12505.
Kaplan, W., (1962), Operational Method for Linear Systems. Boston, Addison-Welsley
Proffessional, Inc.
Kays, A. L., & London, W. M., (1984), Compact heat exchanger, New York: McGraw-Hill, Inc.
Kulik, A. S., de Costa, J. R. C., & Haverkamp, J., (1994), Water organization and molecular
mobility in maize starch investigated by two-dimensional solid-state NMR, Journal of
Agricultural and Food Chemistry, 42 (12), 2803–2807.
Kuse, T., & Takahashi, S., (2000), Transitional behavior of tin oxide semiconductor under a
step-like humidity change, Sensors and Actuators B: Chemical, 67 (1-2), 36–42.
Lamberston, T. J., (1958), Performance Factor of a Periodic-Flow Heat Exchanger, Transactions
of ASME, 80, 586–592.
Leech, J. A., Nelson, W. C., Burnett, R. T., Aaron, S., & Raizenne, M. E., (2002), It’s about
time: A comparison of Canadian and American time–activity patterns, Journal of Exposure
Analysis & Environmental Epidemiology, 12 (6), 427.
Li, X., Li, Z., Xia, Q., & Xi, H., (2007), Effects of pore sizes of porous silica gels on desorption
activation energy of water vapour, Applied Thermal Engineering, 27 (5-6), 869–876.
Li, Z., Zhu, J., & Zhang, C., (2005), Numerical simulations of ultrafine powder coating systems.
Powder Technology, 150 (3), 155–167.
Maniar, P. D., Navrotsky, A., Rabinovich, E. M., Ying, J. Y., & Benziger, J. B., (1990),
Energetics and structure of sol-gel silicas, Journal of Non-Crystalline Solids, 124 (1), 101–
111.
Manners, D., (1985), Some aspect of thr structure of starch, Cereal Foods World, 30, 461–467.
Mendell, M. J., & Heath, G. A., (2005), Do indoor pollutants and thermal conditions in schools
influence student performance? A critical review of the literature, Indoor Air, 15 (1), 27–52.
Moré, J.J. & D.C. Sorensen, (1983), Computing a Trust Region Step, SIAM Journal on Scientific
and Statistical Computing, 3, 553–572.

176
Mujahid Rafique, M., Gandhidasan, P., Rehman, S., & Al-Hadhrami, L. M., (2015), A review on
desiccant based evaporative cooling systems, Renewable and Sustainable Energy Reviews,
45, 145–159.
Narayanan, R., Saman, W. Y., White, S. D., & Goldsworthy, M., (2011), Comparative study of
different desiccant wheel designs. Applied Thermal Engineering, 31 (10), 1613–1620.
Natural Resources Canada, (2011), Energy Efficiency Trend in Canada 1990-2009,.
Ng, K. C., Chua, H. T., Chung, C. Y., Loke, C. H., Kashiwagi, T., Akisawa, A., & Saha, B. B.,
(2001), Experimental investigation of the silica gel–water adsorption isotherm
characteristics. Applied Thermal Engineering, 21 (16), 1631–1642.
Nia, F. E., van Paassen, D., & Saidi, M. H., (2006), Modeling and simulation of desiccant wheel
for air conditioning. Energy and Buildings, 38 (10), 1230–1239.
Nóbrega, C. E. L., & Brum, N. C. L., (2009), Modeling and simulation of heat and enthalpy
recovery wheels. Energy, 34 (12), 2063–2068.
Omer, A. M., (2008), On the wind energy resources of Sudan. Renewable and Sustainable
Energy Reviews, 12 (8), 2117–2139.
Qiu, H., Lv, L., Pan, B., Zhang, Q., Zhang, W., & Zhang, Q., (2009), Critical review in
adsorption kinetic models. Journal of Zhejiang University Science, 10 (5), 716-714.
R. K. Shah & D. P. Sekuli., (2003), Fundamentals of heat exchanger design, New York: John
Wiley & Sons, Inc.
Rafati Nasr, M., Fauchoux, M., Besant, R. W., & Simonson, C. J., (2014), A review of frosting
in air-to-air energy exchangers. Renewable and Sustainable Energy Reviews, 30, 538–554.
Rebar, V., Fischbach, E. R., Apostolopoulos, D., & Kokini, J. L., (1984), Thermodynamics of
water and ethanol adsorption on four starches as model biomass separation systems.
Biotechnology and Bioengineering, 26 (5), 513–517.
Romie, F. E., (1988), Transient Response of Rotary Regenerators, Journal of Heat Transfer, 110
(4a), 836–840.
Rouquerol, F., Rouquerol, J., Sing, K. S. W., Llewellyn, P., & Maurin, G., (2014), Adsorption by
Powders and Porous Solids, 2nd Ed., Oxford: Academic Press.
Rouquerol, J., Avnir, D., Fairbridge, C. W., Everett, D. H., Haynes, J. H., Pernicone, N., Unger,
K. K., (1994), Recommendations for the characterization of porous solids, Pure and
Applied Chemistry, 66 (8), 1739–1758.
Rumph, H., & Schubert, H., (1978), Ceramic Processing before Firing, New York: Wiley.

177
Sair, L., & Fetzer, W. R., (1944), Water Sorption by Starches, Industrial & Engineering
Chemistry, 36 (3), 205–208.
Satoh, S., Matsuyama, I., & Susa, K., (1995), Diffusion of gases in porous silica gel, Journal of
Non-Crystalline Solids, 190 (3), 206–211.
Seppanen, O., & Fisk, W. J., (2002), Association of ventilation system type with SBS symptoms
in office workers. Indoor Air, 12 (2), 98–112.
Shah, R. K., & London, A. L. (1978). Advances in heat trnasfer, laminar flow forced convection
in ducts. New York: Academic Press.
Shang, W., & Besant, R., (2009a), Effectiveness of desiccant coated regenerative wheels from
transient response characteristics and flow channel properties-Part II: predicting and
comparing the latent effectiveness of dehumidifier and energy wheels using transient data
and properties. HVAC&R Research, 15 (2), 346–365.
Shang, W., & Besant, R. (2009b), Performance and design of dehumidifier wheels, HVAC&R
Research, 15 (3), 437–460.
Shang, W., & Besant, R. W., (2005), Effects of pore size variations on regenerative wheel
performance. Journal of Engineering for Gas Turbines and Power, 127 (1), 121.
Shang, W., & Besant, R. W., (2008), Theoretical and experimental methods for the sensible
effectiveness of air-to-air energy recovery wheels, HVAC&R Research, 14 (3), 373–396.
Shang, W., & Besant, R. W., (2009c), Effectiveness of desiccant coated regenerative wheels
from transient response characteristics and Flow channel properties -part I: development of
effectiveness equations. HVAC&R Research, 15 (2), 329–346.
Simonson, C.J. and Besant, R. W., (1999), Energy wheel effectiveness-part I: development of
dimensionless groups. International Journal of Heat and Mass Transfer, 42, 2161–2170.
Simonson, C. J., (1998), Heat and moisture transfer in energy wheels, Ph.D. Thesis, University
of Saskatchewan.
Simonson, C. J., & Besant, R. W., (1998), Heat and moisture transfer in energy wheels during
sorption, condensation, and frosting conditions. Journal of Heat Transfer, 120 (3), 699–708.
Simonson, C. J., & Besant, R. W., (1999), Energy wheel effectiveness: part II-correlations.
International Journal of Heat and Mass Transfer, 42, 2171–2185.
Sphaier, L. A., & Worek, W. M., (2004), Analysis of heat and mass transfer in porous sorbents
used in rotary regenerators. International Journal of Heat and Mass Transfer, 47 (14-16),
3415–3430.

178
Sterling, E. M., Arundel, A., & Sterling, T. D., (1985), Criteria for human exposer to humidity in
occupied buildings. ASHRAE Transactions, 91 (1), 611–622.
Sundell, J., Levin, H., Nazaroff, W. W., Cain, W. S., Fisk, W. J., Grimsrud, D. T., Weschler, C.
J., (2011), Ventilation rates and health: multidisciplinary review of the scientific literature.
Indoor Air, 21 (3), 191–204.
Tao, Y. X., Besant, R. W., & Simonson, C. J., (1992), Measurement of the heat of adsorption for
a typical fibrous insulation. ASHRAE Transactions, 6 (3), 495–501.
U.S. Energy Information Administration (EIA), (2015), Annual Energy Outlook 2015.
Vårum, K., & Smidsrod, O., (2004), Structure-Property Relationship in Chitosans,
Polysaccharides, CRC Press.
Wang, X. L., Chua, H. T., & L. Z, G., (2007), A thermogravimetric analyzer for condensable gas
adsorption under subatmospheric conditions. Journal of Thermal Analysis and Calorimetry,
90 (3), 935–940.
Wang, X., Zimmermann, W., Ng, K. C., Chakraboty, A., & Keller, J. U., (2004), Investigation
on the isotherm of silica gel+water systems, Journal of Thermal Analysis and Calorimetry,
76 (2), 659–669.
Wang, Y., (2005), Transient characteristics of humidity sensors and their application to energy
wheels, M.Sc Thesis, University of Saskatchewan.
Wang, Y., Besant, R. W., Simonson, C. J., & Shang, W., (2006), Application of humidity sensors
and an interactive device, Sensors and Actuators B: Chemical, 115 (1), 93–101.
Wang, Y. H., Besant, R. W., & Simonson, C. J., (2005),Transient Humidity Measurements for
Flow Through an Energy Wheel, ASHRAE Transactions, 111, 353–369.
Westgate, P. J., & Ladisch, M. R., (1993), Sorption of organics and water on starch. Industrial &
Engineering Chemistry Research, 32 (8), 1676–1680.
Wood, D. L., & Rabinovich, E. M., (1989), Study of alkoxide silica gels by infrared
spectroscopy. Applied Spectroscopy, 43(2), 263–267.
Wu, Z., Melnik, R. V. N. N., & Borup, F., (2006), Model-based analysis and simulation of
regenerative heat wheel. Energy and Buildings, 38(5), 502–514.
Xu, Z., Cai, J., & Pan, B., (2013), Mathematically modeling fixed-bed adsorption in aqueous
systems. Journal of Zhejiang University Science, 14 (3), 155–176.
Yilmaz, T., & Büyükalaca, O., (2003), Design of Regenerative Heat Exchangers. Heat Transfer
Engineering, 24 (4), 32–38. 4

179
Yilmaz, T., & Cihan, E., (1993), General equation for heat transfer for laminar flow in ducts of
arbitrary cross-sections, International Journal of Heat and Mass Transfer, 36 (13), 3265–
3270.
Yoon, Y. H. E. E., & Nelson, J. H., (1984), Application of gas adsorption kinetics: A theoretical
model for respirator cartridge service life, American Industrial Hygiene Association
Journal, 45 (8), 509–516.
Yu, B. F., Hu, Z. B., Liu, M., Yang, H. L., Kong, Q. X., & Liu, Y. H, (2009), Review of research
on air-conditioning systems and indoor air quality control for human health, International
Journal of Refrigeration, 32 (1), 3–20.
Zhang, L. Z., & Niu, J. L., (2002), Performance comparisons of desiccant wheels for air
dehumidification and enthalpy recovery, Applied Thermal Engineering, 22 (12), 1347–
1367.
Zhang, X. J., Dai, Y. J., & Wang, R. Z., (2003), A simulation study of heat and mass transfer in a
honeycombed rotary desiccant dehumidifier. Applied Thermal Engineering, 23 (8), 989–
1003.
Zheng, X., Ge, T. S., & Wang, R. Z., (2014), Recent progress on desiccant materials for solid
desiccant cooling systems, Energy, 74, 280–294.

180
A. APPENDIX A
CYCLIC TEST UNCERTAINTY ANALYSIS
For the steady state test, the main source of uncertainty comes from the area integration.
To integrate the area between the output and input temperature profiles, the normalized
temperature was precisely fitted by a function 𝑓 with its relevant uncertainty as:
𝜃 = 𝑓(𝑡) ± 𝑈𝜃 (A.1)
Where, 𝑓(𝑡) is a ninth order polynomial and 𝛿𝜃 is the uncertainty in measuring normalized
temperature. Considering normalized temperature defined by eq. (A.1), 𝑈𝜃 can be calculated as
follows:
𝑈𝜃 =
2𝑈𝑇∆𝑇𝑠𝑡
(A.2)
Then, the sensible effectiveness can be found by:
휀𝑃𝐹 =∫ 𝜃𝑑𝑡𝜋𝜔0𝜋𝜔
=∫ 𝑓(𝑡)𝑑𝑡𝜋𝜔0𝜋𝜔
±∫ 𝑈𝜃𝑑𝑡𝜋𝜔0𝜋𝜔
(A.3)
then,
𝑈𝜀𝑃𝐹 =∫ 𝑈𝜃𝑑𝑡𝜋𝜔0𝜋𝜔
= 𝑈𝜃 (A.4)
Using calibration data for 𝑈T = ±0 2 °C and considering ∆𝑇st = 27 6 °C then 𝑈θ is found
to be 0.014. Consequently, the bias uncertainty in the sensible effectiveness can be determined as
𝑈B,εPF = 1 4 % To find the bias uncertainty in the sensible effectiveness of a counter-flow wheel,
the method of propagation of error is used as follows:

181
𝑈𝐵,𝜀𝐶𝐹 =√(𝜕휀𝐶𝐹𝜕𝜃
)2
𝑈𝐵,𝜃2 (A.5)
The derivation of effectiveness with respect to normalized temperature can be found using
the chain rule. Therefore,
𝜕휀𝐶𝐹𝜕𝜃
= (𝜕휀𝐶𝐹𝜕𝑁𝑇𝑈
) (𝜕𝑁𝑇𝑈
𝜕휀𝑃𝐹) (𝜕휀𝑃𝐹𝜕𝜃
) (A.6)
where (𝜕𝑁𝑇𝑈
𝜕𝜀𝑃𝐹) and (
𝜕𝜀𝐶𝐹
𝜕𝑁𝑇𝑈) are found based on Eqs. (2.9) and (2.11) as follows:
𝜕𝑁𝑇𝑈
𝜕휀𝑃𝐹= 𝑒2𝑁𝑇𝑈 (A.7)
And
𝜕휀𝐶𝐹𝜕𝑁𝑇𝑈
=1
(1 + 𝑁𝑇𝑈)2 (A.8)
Using the fact that 𝜕𝜀𝑃𝐹
𝜕𝜃=𝑈𝐵,𝜀𝑃𝐹
𝑈𝐵,𝜃, then eq. (A.5) can be written as:
𝑈𝐵,𝜀𝐶𝐹 = √(𝑒2𝑁𝑡𝑢
(1 + 𝑁𝑇𝑈)2)
2
𝑈𝐵,𝜀𝑃𝐹2 (A.9)
This equation can be expressed in terms of sensible effectiveness of a parallel-flow
exchanger by replacing 𝑁𝑇𝑈 with 휀PF from eq. (2.9):
𝑈𝐵,𝜀𝐶𝐹 = √((1 − 2휀𝑃𝐹)−1 (1 −
1
2𝐿𝑛(1 − 2휀𝑃𝐹))
−2
)
2
𝑈𝐵,𝜀𝑃𝐹2 (A.10)

182
B. APPENDIX B
COPYRIGHT PERMISSIONS
B.1 Permission for Manuscripts Used in Chapters 2
The Manuscript in chapter 2 is published by Elsevier. According to the Elsevier copyright
policies, authors can use their publication for their thesis without a written permission from
Elsevier. Following statement has been directly copied from Elsevier website:
Source: http://libraryconnect.elsevier.com/sites/default/files/lcp0404.pdf (accessed: March 2016)

183
B.2 Permission for Manuscripts Used in Chapters 3
The manuscript used in Chapter 4 is published in ASME Journal of Thermal Science and
Engineering Application. The following is a written permission to include the published
manuscript in this Ph.D. thesis.
“Dear Mr. Fathieh:
It is our pleasure to grant you permission to use all or any part of the ASME paper “Effects
of Heat Loss/Gain on the Transient Testing of Heat Wheels,” by Farhad Fathieh; Robert/W
Besant; Richard W. Evitts; Carey J. Simonson
J. Thermal Sci. Eng. Appl., Accepted Manuscript, 2016, cited in your letter for inclusion in a Ph.
D. thesis to be published by University of Saskatchewan.
Permission is granted for the specific use as stated herein and does not permit further use
of the materials without proper authorization. Proper attribution must be made to the author(s)
of the materials. Please note: if any or all of the figures and/or Tables are of another source,
permission should be granted from that outside source or include the reference of the original
source. ASME does not grant permission for outside source material that may be referenced in
the ASME works. As is customary, we request that you ensure full acknowledgment of this material,
the author(s), source and ASME as original publisher. Acknowledgment must be retained on all
pages printed and distributed.
Sincerely,
Beth Darchi Publishing Administrator ASME 2 Park Avenue, 6th Floor New York, NY 10016-5990 Tel 1.212.591.7700 [email protected]”

184
B.3 Permission for Manuscripts Used in Chapters 4
According to the College of Graduate Studies and Research at the University of Saskatchewan, a
written permission is required from each of the co-authors for unpublished manuscripts. The
manuscript used in Chapter 4 is unpublished, therefore, copyright permissions are obtained from
the co-authors as follows.
Copyright Permission Request Form
I am preparing the publication of a manuscript titled “Determination of Air-to-Air Energy Wheel
Latent Effectiveness in Using Humidity Step Test Data” to be published as the fourth chapter of
my Ph.D. thesis, and to be submitted to the Department of Mechanical Engineering at the
University of Saskatchewan. The authors contributing in the completion of this manuscript are
Farhad Fathieh, Mohamad Rafati Nasr, Saied Sadeh, Robert W. Besant, Richard W.
Evitts, Jens Müller, Carey J. Simonson
I am requesting permission to use the materials described in the aforementioned manuscript in my
Ph.D. thesis and all subsequent editions that may be prepared at the University of Saskatchewan.
Please indicate agreeemnt by signing below:
Permission granted by: Carey Simonson
Signature:
Date:

185
Copyright Permission Request Form
I am preparing the publication of a manuscript titled “Determination of Air-to-Air Energy Wheel
Latent Effectiveness in Using Humidity Step Test Data” to be published as the fourth chapter of
my Ph.D. thesis, and to be submitted to the Department of Mechanical Engineering at the
University of Saskatchewan. The authors contributing in the completion of this manuscript are
Farhad Fathieh, Mohamad Rafati Nasr, Saied Sadeh, Robert W. Besant, Richard W.
Evitts, Jens Müller, Carey J. Simonson
I am requesting permission to use the materials described in the aforementioned manuscript in my
Ph.D. thesis and all subsequent editions that may be prepared at the University of Saskatchewan.
Please indicate agreeemnt by signing below:
Permission granted by: Richard Evitts
Signature:
Date:

186
Copyright Permission Request Form
I am preparing the publication of a manuscript titled “Determination of Air-to-Air Energy Wheel
Latent Effectiveness in Using Humidity Step Test Data” to be published as the fourth chapter of
my Ph.D. thesis, and to be submitted to the Department of Mechanical Engineering at the
University of Saskatchewan. The authors contributing in the completion of this manuscript are
Farhad Fathieh, Mohamad Rafati Nasr, Saied Sadeh, Robert W. Besant, Richard W.
Evitts, Jens Müller, Carey J. Simonson
I am requesting permission to use the materials described in the aforementioned manuscript in my
Ph.D. thesis and all subsequent editions that may be prepared at the University of Saskatchewan.
Please indicate agreeemnt by signing below:
Permission granted by: Robert Besant
Signature:
Date:

187
Copyright Permission Request Form
I am preparing the publication of a manuscript titled “Determination of Air-to-Air Energy Wheel
Latent Effectiveness in Using Humidity Step Test Data” to be published as the fourth chapter of
my Ph.D. thesis, and to be submitted to the Department of Mechanical Engineering at the
University of Saskatchewan. The authors contributing in the completion of this manuscript are
Farhad Fathieh, Mohamad Rafati Nasr, Saied Sadeh, Robert W. Besant, Richard W.
Evitts, Jens Müller, Carey J. Simonson
I am requesting permission to use the materials described in the aforementioned manuscript in my
Ph.D. thesis and all subsequent editions that may be prepared at the University of Saskatchewan.
Please indicate agreeemnt by signing below:
Permission granted by: Jens Müller
Signature:
Date:

188
Copyright Permission Request Form
I am preparing the publication of a manuscript titled “Determination of Air-to-Air Energy Wheel
Latent Effectiveness in Using Humidity Step Test Data” to be published as the fourth chapter of
my Ph.D. thesis, and to be submitted to the Department of Mechanical Engineering at the
University of Saskatchewan. The authors contributing in the completion of this manuscript are
Farhad Fathieh, Mohamad Rafati Nasr, Saied Sadeh, Robert W. Besant, Richard W.
Evitts, Jens Müller, Carey J. Simonson
I am requesting permission to use the materials described in the aforementioned manuscript in my
Ph.D. thesis and all subsequent editions that may be prepared at the University of Saskatchewan.
Please indicate agreeemnt by signing below:
Permission granted by: Mohamad Rafati Nasr
Signature:
Date:

189
Copyright Permission Request Form
I am preparing the publication of a manuscript titled “Determination of Air-to-Air Energy Wheel
Latent Effectiveness in Using Humidity Step Test Data” to be published as the fourth chapter of
my Ph.D. thesis, and to be submitted to the Department of Mechanical Engineering at the
University of Saskatchewan. The authors contributing in the completion of this manuscript are
Farhad Fathieh, Mohamad Rafati Nasr, Saied Sadeh, Robert W. Besant, Richard W.
Evitts, Jens Müller, Carey J. Simonson
I am requesting permission to use the materials described in the aforementioned manuscript in my
Ph.D. thesis and all subsequent editions that may be prepared at the University of Saskatchewan.
Please indicate agreeemnt by signing below:
Permission granted by: Saied Sadeh
Signature:
Date:

190
Copyright Permission Request Form
I am preparing the publication of a manuscript titled “Determination of Air-to-Air Energy Wheel
Latent Effectiveness in Using Humidity Step Test Data” to be published as the fourth chapter of
my Ph.D. thesis, and to be submitted to the Department of Mechanical Engineering at the
University of Saskatchewan. The authors contributing in the completion of this manuscript are
Farhad Fathieh, Mohamad Rafati Nasr, Saied Sadeh, Robert W. Besant, Richard W.
Evitts, Jens Müller, Carey J. Simonson
I am requesting permission to use the materials described in the aforementioned manuscript in my
Ph.D. thesis and all subsequent editions that may be prepared at the University of Saskatchewan.
Please indicate agreeemnt by signing below:
Permission granted by: Jens Müller
Signature:
Date:

191
B.4 Permission for Manuscripts Used in Chapters 5
According to the College of Graduate Studies and Research at the University of Saskatchewan, a
written permission is required from each of the co-authors for unpublished manuscripts. The
manuscript used in Chapter 5 is unpublished, therefore, copyright permissions are obtained from
the co-authors as follows.
Copyright Permission Request Form
I am preparing the publication of a manuscript titled “Effects of Physical and Sorption Properties
of Mesoporous Silica Gel on Dehumidification Performance of Energy Wheels” to be published
as the fourth chapter of my Ph.D. thesis, and to be submitted to the Department of Mechanical
Engineering at the University of Saskatchewan. The authors contributing in the completion of this
manuscript are
Farhad Fathieh, Majid Nezakat, Robert W. Besant, Richard W. Evitts, Carey J. Simonson
I am requesting permission to use the materials described in the aforementioned manuscript in my
Ph.D. thesis and all subsequent editions that may be prepared at the University of Saskatchewan.
Please indicate agreeemnt by signing below:
Permission granted by: Carey Simonson
Signature:
Date:

192
Copyright Permission Request Form
I am preparing the publication of a manuscript titled “Effects of Physical and Sorption Properties
of Mesoporous Silica Gel on Dehumidification Performance of Energy Wheels” to be published
as the fourth chapter of my Ph.D. thesis, and to be submitted to the Department of Mechanical
Engineering at the University of Saskatchewan. The authors contributing in the completion of this
manuscript are
Farhad Fathieh, Majid Nezakat, Robert W. Besant, Richard W. Evitts, Carey J. Simonson
I am requesting permission to use the materials described in the aforementioned manuscript in my
Ph.D. thesis and all subsequent editions that may be prepared at the University of Saskatchewan.
Please indicate agreeemnt by signing below:
Permission granted by: Richard Evitts
Signature:
Date:

193
Copyright Permission Request Form
I am preparing the publication of a manuscript titled “Effects of Physical and Sorption Properties
of Mesoporous Silica Gel on Dehumidification Performance of Energy Wheels” to be published
as the fourth chapter of my Ph.D. thesis, and to be submitted to the Department of Mechanical
Engineering at the University of Saskatchewan. The authors contributing in the completion of this
manuscript are
Farhad Fathieh, Majid Nezakat, Robert W. Besant, Richard W. Evitts, Carey J. Simonson
I am requesting permission to use the materials described in the aforementioned manuscript in my
Ph.D. thesis and all subsequent editions that may be prepared at the University of Saskatchewan.
Please indicate agreeemnt by signing below:
Permission granted by: Robert Besant
Signature:
Date:

194
Copyright Permission Request Form
I am preparing the publication of a manuscript titled “Effects of Physical and Sorption Properties
of Mesoporous Silica Gel on Dehumidification Performance of Energy Wheels” to be published
as the fourth chapter of my Ph.D. thesis, and to be submitted to the Department of Mechanical
Engineering at the University of Saskatchewan. The authors contributing in the completion of this
manuscript are
Farhad Fathieh, Majid Nezakat, Robert W. Besant, Richard W. Evitts, Carey J. Simonson
I am requesting permission to use the materials described in the aforementioned manuscript in my
Ph.D. thesis and all subsequent editions that may be prepared at the University of Saskatchewan.
Please indicate agreeemnt by signing below:
Permission granted by: Majid Nezakat
Signature:
Date:

195
B.5 Permission for Manuscripts Used in Chapters 6
The Manuscript in chapter6 is published by ACS. According to the ACS copyright policies,
authors can use their publication for their thesis without a written permission from Elsevier.
Following statement has been directly copied from Elsevier website:
“If your paper has already been published by ACS and you want to include the text or
portions of the text in your thesis/dissertation, please print the ACS copyright credit line on the
first page of your article:
Authors may reuse all or part of the Submitted, Accepted or Published Work in a thesis or
dissertation that the author writes and is required to submit to satisfy the criteria of degree-
granting institutions. Such reuse is permitted subject to the ACS’ “Ethical Guidelines to
Publication of Chemical Research” (http://pubs.acs.org/page/policy/ethics/index.html); the
author should secure written confirmation (via letter or email) from the respective ACS journal
editor(s) to avoid potential conflicts with journal prior publication*/embargo policies.”