a novel threshold scheme for reducing spatial intersymbol
TRANSCRIPT

Research ArticleA Novel Threshold Scheme for Reducing Spatial IntersymbolInterference in Vehicular Visible Light Communication Based onImage Sensors
Ling Zhan 1,2 and Hong Zhao 2
1Guangxi Key Laboratory of Wireless Broadband Communication and Signal Processing, Guilin University ofElectronic Technology, 541004 Guilin, China2School of Information and Communication, Guilin University of Electronic Technology, 541004 Guilin, China
Correspondence should be addressed to Hong Zhao; [email protected]
Received 14 June 2021; Revised 11 August 2021; Accepted 28 August 2021; Published 22 September 2021
Academic Editor: Renchao Xie
Copyright © 2021 Ling Zhan and Hong Zhao. This is an open access article distributed under the Creative Commons AttributionLicense, which permits unrestricted use, distribution, and reproduction in any medium, provided the original work isproperly cited.
LEDs can be used to communicate under the premise of satisfying illumination, which lays the groundwork for visible lightcommunication (VLC). The application of outdoor VLC has drawn more attention, especially the application of vehicle-to-vehicle(V2V) which can significantly improve traffic safety and information transmission efficiency. The image sensor has thecharacteristics of spatial separation, easily realizes MIMO, and does not need to be strictly aligned with the transmitter, so it isespecially suitable for vehicular VLC. However, because of the diffuseness of LED and the small pixel size of the image sensor, it iseasy to produce the blooming effects and interfering among symbols. When decoding at the receiving terminal, it will judge thestatus Off of LEDs to be the status On. By analysing the blooming effects caused by surrounding LEDs, a novel threshold scheme isproposed in this paper according to the probability distribution of the sum of the optical power of the LED itself and afterinterference. Experiments show that the proposed method has advantages in improving BER compared with the expectedthreshold method and the average method, especially with long-distance communication (70m), and the BER has been improvedby 57% and 39%, respectively.
1. Introduction
With the continuous decline of price and the improvementof lighting efficiency, light-emitting diode (LED) is graduallyreplacing the traditional light source with its long service life,energy saving, and low price [1–4]. In recent years, due tothe lack of radio frequency (RF) bandwidth in traditionalwireless communication, visible light communication(VLC) as a supplement to the future sixth-generation (6G)wireless communication has been drawing people’s attention[5–7]. In VLC, the transmitter can send informationthrough the high-speed flashing of LED. After the channeltransmission, the receiver uses photodiodes (PDs) or imagesensors (IS) to receive the signal. At the present stage ofvehicles, light sources such as headlights, taillights, and
brake lights have been installed, which can increase theillumination in the daytime. These fixed light sources aremostly composed of LEDs. Cameras based on image sensorsused as receivers also appear on most vehicles in the form ofthe dashcam, making it easy to realize vehicle to vehicle(V2V) visible light communication [8–10]. All of thoseprovide convenience for the realization of vehicular VLCwithout adding extra hardware.
The usual applicationmodel of vehicular VLC is presentedin Figure 1. It can be applied mainly in the following ways:
(i) Vehicle to infrastructure (V2I) communication: theLEDs of the headlight and taillight are used as trans-mitters. PDs or image sensors on infrastructure areused as receivers.
HindawiWireless Communications and Mobile ComputingVolume 2021, Article ID 9439514, 10 pageshttps://doi.org/10.1155/2021/9439514
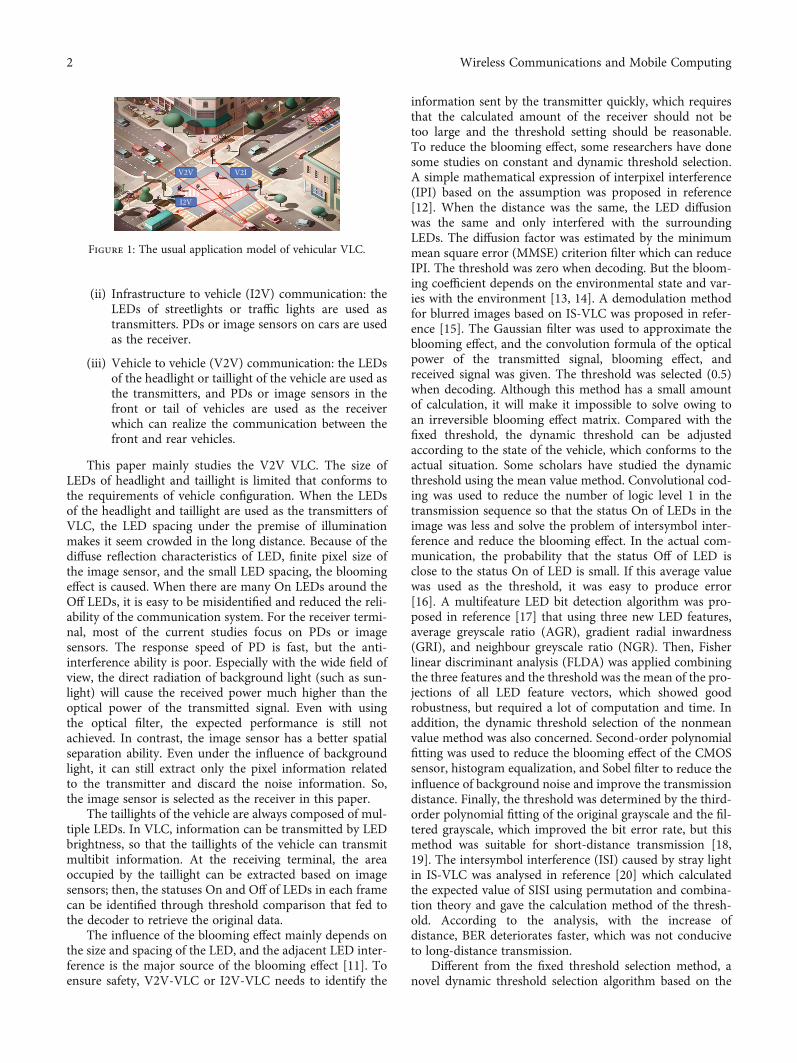
(ii) Infrastructure to vehicle (I2V) communication: theLEDs of streetlights or traffic lights are used astransmitters. PDs or image sensors on cars are usedas the receiver.
(iii) Vehicle to vehicle (V2V) communication: the LEDsof the headlight or taillight of the vehicle are used asthe transmitters, and PDs or image sensors in thefront or tail of vehicles are used as the receiverwhich can realize the communication between thefront and rear vehicles.
This paper mainly studies the V2V VLC. The size ofLEDs of headlight and taillight is limited that conforms tothe requirements of vehicle configuration. When the LEDsof the headlight and taillight are used as the transmitters ofVLC, the LED spacing under the premise of illuminationmakes it seem crowded in the long distance. Because of thediffuse reflection characteristics of LED, finite pixel size ofthe image sensor, and the small LED spacing, the bloomingeffect is caused. When there are many On LEDs around theOff LEDs, it is easy to be misidentified and reduced the reli-ability of the communication system. For the receiver termi-nal, most of the current studies focus on PDs or imagesensors. The response speed of PD is fast, but the anti-interference ability is poor. Especially with the wide field ofview, the direct radiation of background light (such as sun-light) will cause the received power much higher than theoptical power of the transmitted signal. Even with usingthe optical filter, the expected performance is still notachieved. In contrast, the image sensor has a better spatialseparation ability. Even under the influence of backgroundlight, it can still extract only the pixel information relatedto the transmitter and discard the noise information. So,the image sensor is selected as the receiver in this paper.
The taillights of the vehicle are always composed of mul-tiple LEDs. In VLC, information can be transmitted by LEDbrightness, so that the taillights of the vehicle can transmitmultibit information. At the receiving terminal, the areaoccupied by the taillight can be extracted based on imagesensors; then, the statuses On and Off of LEDs in each framecan be identified through threshold comparison that fed tothe decoder to retrieve the original data.
The influence of the blooming effect mainly depends onthe size and spacing of the LED, and the adjacent LED inter-ference is the major source of the blooming effect [11]. Toensure safety, V2V-VLC or I2V-VLC needs to identify the
information sent by the transmitter quickly, which requiresthat the calculated amount of the receiver should not betoo large and the threshold setting should be reasonable.To reduce the blooming effect, some researchers have donesome studies on constant and dynamic threshold selection.A simple mathematical expression of interpixel interference(IPI) based on the assumption was proposed in reference[12]. When the distance was the same, the LED diffusionwas the same and only interfered with the surroundingLEDs. The diffusion factor was estimated by the minimummean square error (MMSE) criterion filter which can reduceIPI. The threshold was zero when decoding. But the bloom-ing coefficient depends on the environmental state and var-ies with the environment [13, 14]. A demodulation methodfor blurred images based on IS-VLC was proposed in refer-ence [15]. The Gaussian filter was used to approximate theblooming effect, and the convolution formula of the opticalpower of the transmitted signal, blooming effect, andreceived signal was given. The threshold was selected (0.5)when decoding. Although this method has a small amountof calculation, it will make it impossible to solve owing toan irreversible blooming effect matrix. Compared with thefixed threshold, the dynamic threshold can be adjustedaccording to the state of the vehicle, which conforms to theactual situation. Some scholars have studied the dynamicthreshold using the mean value method. Convolutional cod-ing was used to reduce the number of logic level 1 in thetransmission sequence so that the status On of LEDs in theimage was less and solve the problem of intersymbol inter-ference and reduce the blooming effect. In the actual com-munication, the probability that the status Off of LED isclose to the status On of LED is small. If this average valuewas used as the threshold, it was easy to produce error[16]. A multifeature LED bit detection algorithm was pro-posed in reference [17] that using three new LED features,average greyscale ratio (AGR), gradient radial inwardness(GRI), and neighbour greyscale ratio (NGR). Then, Fisherlinear discriminant analysis (FLDA) was applied combiningthe three features and the threshold was the mean of the pro-jections of all LED feature vectors, which showed goodrobustness, but required a lot of computation and time. Inaddition, the dynamic threshold selection of the nonmeanvalue method was also concerned. Second-order polynomialfitting was used to reduce the blooming effect of the CMOSsensor, histogram equalization, and Sobel filter to reduce theinfluence of background noise and improve the transmissiondistance. Finally, the threshold was determined by the third-order polynomial fitting of the original grayscale and the fil-tered grayscale, which improved the bit error rate, but thismethod was suitable for short-distance transmission [18,19]. The intersymbol interference (ISI) caused by stray lightin IS-VLC was analysed in reference [20] which calculatedthe expected value of SISI using permutation and combina-tion theory and gave the calculation method of the thresh-old. According to the analysis, with the increase ofdistance, BER deteriorates faster, which was not conduciveto long-distance transmission.
Different from the fixed threshold selection method, anovel dynamic threshold selection algorithm based on the
I2V
V2IV2V
Figure 1: The usual application model of vehicular VLC.
2 Wireless Communications and Mobile Computing

idea of threshold selection of OOK is proposed in this paper.The Gaussian filter is used to approximate the bloomingeffect, and the interferences of surrounding LEDs are ana-lysed. After this, the values of all-possible receiving powerwith different statuses of LEDs are found and two kinds ofreceiving optical power probability distribution curves atthe statuses On and Off of LEDs are given. If two curvesdo not intersect, the mean of the minimum receiving powerof the status On of LED and the maximum receiving powerof the status Off of LED is selected as the threshold. Other-wise, the threshold can be found with the minimum BERusing the probabilistic statistical method. This algorithmsolves the problems of unreasonable value and large compu-tation of the mean value method. Compared with the non-mean value method, the dynamic threshold selectionalgorithm of the proposed algorithm is more suitable forlong-distance transmission. The simulation results show thatthe bit error rate has been better improved.
The structure of this paper is as follows: the second sec-tion introduces the V2V-VLC system, the third sectionintroduces the calculation process of the threshold, thefourth section is the simulation and result analysis, and thefifth section is the summary of this paper.
2. Fundamental of V2V-VLC System
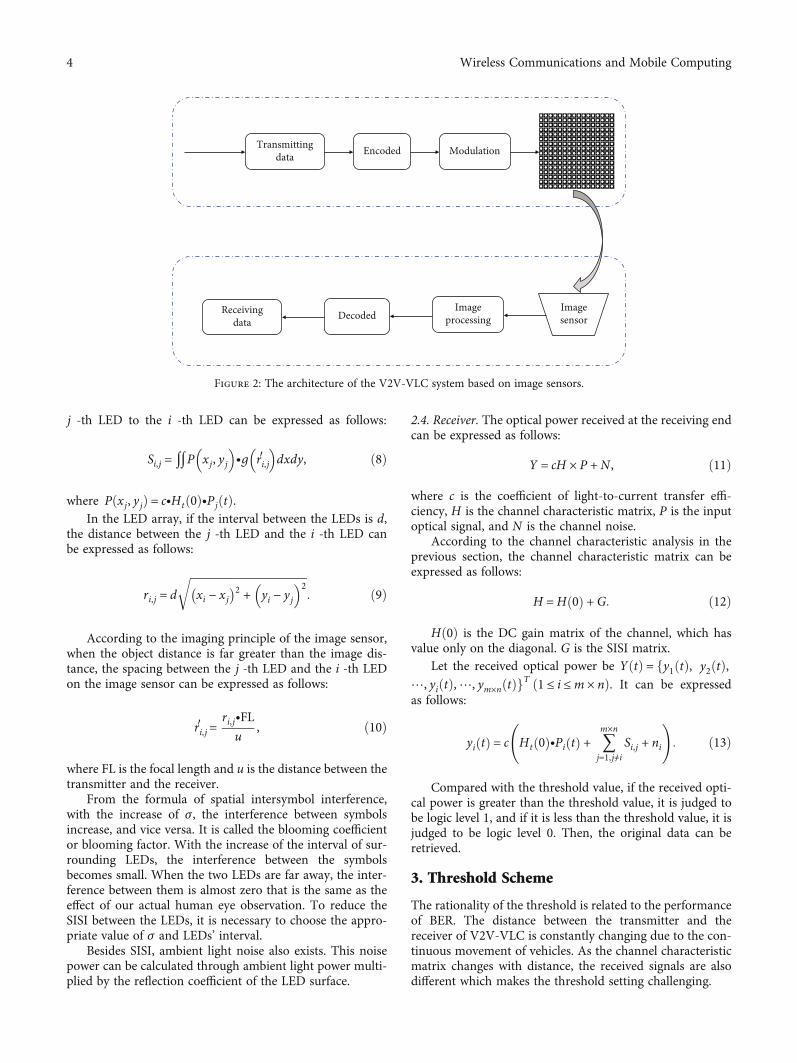
The architecture of the V2V-VLC system based on imagesensors is illustrated in Figure 2. At the transmitting termi-nal, the transmitting data is encoded and modulated firstly,and logic levels 1 and 0 control the statuses On and Off ofLEDs, respectively, in the LED array panel of the taillight.The information is transmitted by high-speed flashing LEDsand through the channel to the receiving terminal. Then, theimage sensors capture the image of the LED array panel.Through digital image processing technology, the receivingpower of each LED is compared with the threshold valuewhich realizes decoding and recovers the original data. If itis greater than the threshold value, it is judged to be logiclevel 1. Otherwise, it is judged to be logic level 0.
2.1. Transmitter. At the transmitter terminal, m × n high-speed flashing LEDs transmit information without causingharm to human eyes. Let the optical power of the LED arraybe PðtÞ = fP1ðtÞ, P2ðtÞ,⋯, PiðtÞ⋯ , Pm × nðtÞgT ð1 ≤ i ≤m× nÞ, the peak optical power of LED be PLED, and Pu,v,k ðk= 1, 2,⋯Þ be the coefficient determining the intensity ofLED with row u and column v which will become logic levels0 and 1 after optical OOK modulation [21]. Then, Pu,vðtÞcan be expressed as follows:
Pu,v tð Þ =〠k
Pu,v,k∙PLED∙f t − k − 1ð ÞTbð Þ: ð1Þ
f ðtÞ is a rectangular pulse function that can be expressedas follows:
f tð Þ =1, 0 ≤ t < Tb,
0, otherwise:
(ð2Þ
2.2. Channel Gain. Due to the large receiving field angle ofthe image sensor, line of sight (LOS) can be easily realized.In this paper, we only focus on the LOS channel when weanalyse the channel characteristics.
The LED-emitting light source can be modeled by theLambert radiation model, and its radiation intensity can beexpressed as follows [22]:
R0 ϕð Þ = m + 1ð Þ2π
∙PLED∙cosm tð Þ, ϕ ∈ −π
2,π
2
h i, ð3Þ
where ϕ is the radiation angle of the LED, m is the Lambertradiation number, and its value is related to the power inten-sity angle of the light source plate, which is expressed as fol-lows:
m = −ln 2
ln cos Φ1/2, ð4Þ
where Φ1/2 is the half-power intensity angle of LED.In the absence of Gaussian blurring and noise interfer-
ence, the DC gain of the LOS channel can be expressed asfollows [23]:
Ht 0ð Þ = Ap
u2∙R0 ϕð Þ∙cos φð Þ, ð5Þ
where φ is the incident angle of LED, u is the distancebetween transmitter and receiver, and Ap is the incidentpupil area of IS lens.
The received optical power of the i-th LED withoutinterference can be expressed as follows:
yo,i tð Þ = c∙Ht 0ð Þ∙Pi tð Þ, ð6Þ
where c is the coefficient of light-to-current transferefficiency.
2.3. Channel Noise. Gaussian blurring is caused by the dif-fuse reflection of LEDs and size limitation of the image sen-sor. After channel transmission, the LED on the imagesensor no longer focuses on a point but diffuses into a circle,which is called Airy disk [24], and its point spread function(PSF) can be approximated as Gaussian function. Theexpression is as follows:
g p, qð Þ = 12πσ2
∙exp −p2 + q2
2σ2
� �, ð7Þ
where σ2 is the variance of Gaussian function and p and qare the horizontal and vertical components of the distanceto the original point.
The point spread of LED affects the reception of adjacentLED, which is called spatial intersymbol interference (SISI),and can be modeled as the convolution of the input signaland Gaussian blurring function. The interference of the
3Wireless Communications and Mobile Computing
j -th LED to the i -th LED can be expressed as follows:
Si,j =∬P xj, yj� �
∙g ri,j′� �
dxdy, ð8Þ
where Pðxj, yjÞ = c∙Htð0Þ∙PjðtÞ.In the LED array, if the interval between the LEDs is d,
the distance between the j -th LED and the i -th LED canbe expressed as follows:
ri,j = d
ffiffiffiffiffiffiffiffiffiffiffiffiffiffiffiffiffiffiffiffiffiffiffiffiffiffiffiffiffiffiffiffiffiffiffiffiffiffiffiffiffiffixi − xj� �2 + yi − yj
� �2r: ð9Þ
According to the imaging principle of the image sensor,when the object distance is far greater than the image dis-tance, the spacing between the j -th LED and the i -th LEDon the image sensor can be expressed as follows:
ri,j′ =ri,j∙FLu
, ð10Þ
where FL is the focal length and u is the distance between thetransmitter and the receiver.
From the formula of spatial intersymbol interference,with the increase of σ, the interference between symbolsincrease, and vice versa. It is called the blooming coefficientor blooming factor. With the increase of the interval of sur-rounding LEDs, the interference between the symbolsbecomes small. When the two LEDs are far away, the inter-ference between them is almost zero that is the same as theeffect of our actual human eye observation. To reduce theSISI between the LEDs, it is necessary to choose the appro-priate value of σ and LEDs’ interval.
Besides SISI, ambient light noise also exists. This noisepower can be calculated through ambient light power multi-plied by the reflection coefficient of the LED surface.
2.4. Receiver. The optical power received at the receiving endcan be expressed as follows:
Y = cH × P +N , ð11Þ
where c is the coefficient of light-to-current transfer effi-ciency, H is the channel characteristic matrix, P is the inputoptical signal, and N is the channel noise.
According to the channel characteristic analysis in theprevious section, the channel characteristic matrix can beexpressed as follows:
H =H 0ð Þ + G: ð12Þ
Hð0Þ is the DC gain matrix of the channel, which hasvalue only on the diagonal. G is the SISI matrix.
Let the received optical power be YðtÞ = fy1ðtÞ, y2ðtÞ,⋯, yiðtÞ,⋯, ym×nðtÞgT ð1 ≤ i ≤m × nÞ. It can be expressedas follows:
yi tð Þ = c Ht 0ð Þ∙Pi tð Þ + 〠m×n
j=1,j≠iSi,j + ni
!: ð13Þ
Compared with the threshold value, if the received opti-cal power is greater than the threshold value, it is judged tobe logic level 1, and if it is less than the threshold value, it isjudged to be logic level 0. Then, the original data can beretrieved.
3. Threshold Scheme
The rationality of the threshold is related to the performanceof BER. The distance between the transmitter and thereceiver of V2V-VLC is constantly changing due to the con-tinuous movement of vehicles. As the channel characteristicmatrix changes with distance, the received signals are alsodifferent which makes the threshold setting challenging.
Transmittingdata Encoded Modulation
Imagesensor
ImageprocessingDecodedReceiving
data
Figure 2: The architecture of the V2V-VLC system based on image sensors.
4 Wireless Communications and Mobile Computing

In Reference [16], the threshold is an average brightness.Before transmitting information, three groups of Barkersequence with the length of 13 are inserted. In the codingmethod, +1 represents that the LED lights in this frame areall On, and -1 represents that the LED lights are all off. Thereare 39 guide frames in total, of which 27 are all On. By cal-culating the total brightness of these 27 images and thendividing by the number of LEDs, an average value isobtained. The average value is used as the threshold valueto judge whether the LED on the receiver is On or Off.The disadvantage of this method is that when the LEDs onthe panel are all On, the mutual interference will increase,and the average value will also increase. In the actual com-munication, the probability that the off LED is close to thefull light of the LED is small. If this average value is usedas the threshold, it is easy to produce misjudgement. Inorder to make the comparison more intuitive, the averagevalue of the LED’s minimum received power with the overallstatus On and the LED’s maximum received power with theoverall status Off is selected as the threshold value that theparameters are consistent with the proposed method inthis paper.
In Reference [20], the expected value of SISI is derivedby permutation and combination theory, and the optimizedthreshold is calculated according to the selection strategy ofjudgment threshold in OOK; hereinafter, this method isreferred to as the expected threshold method. This thresholdis half of the sum of the received value of LOS channel, theaverage value of SISI, and the noise of LED optical power,which reflects the role of SISI in threshold judgment. Inthe actual communication, LED is mainly affected by thesurrounding LED. Therefore, this paper only selects the SISIexpected value of the surrounding LED and then obtains thethreshold according to the method in reference [20], tomaintain the consistency of parameter selection and facili-tate simulation comparison.
SISI is mainly influenced by surrounding LEDs, and itsschematic diagram is shown in Figure 3. LEDR,C is affectedby the surrounding eight LEDs; their illuminance is relatedto the total interference value.
In VLC OOK modulation, the probability of the statusesOn and Off of LEDs is equal to 1/2, so there are two statusesof LEDR,C and a total of 28 = 256 statuses On and Off of theeight neighbour LEDs. Therefore, according to formulas (7)and (8), we can calculate the influence of 256 different light-ing conditions on the surrounding eight LEDs and add thereceived value of LEDR,C itself to get the optical power valueunder the statuses On and Off of LEDs. Through the proba-bility statistics of the optical power value, the distribution ofdifferent statuses is obtained.
There are two kinds of receiving optical power probabilitydistribution curves at the statuses On and Off of LEDs.
(i) The receiving optical power probability distributioncurves do not intersect at two different statuses. Theminimum receiving power of the status On of LEDis greater than the maximum receiving power ofthe status Off of LED, that is YON,min > YOFF,max.
Whether the status is On or Off of LED, the receivedoptical power is quite different. The mean value ofYON,min and YOFF,max can be selected as the thresholdto realize an error-free decision
(ii) The receiving optical power probability distributioncurves intersect at two different statuses. The mini-mum receiving power of the status On of LED is lessthan the maximum receiving power of the status Offof LED, that is, YON,min ≤ YOFF,max. There will existmisjudgement, and the selection of threshold willaffect the BER. In the traditional OOK modulation,the sampling value of the receiver is a Gaussian ran-dom variable, and its one-dimensional probabilitydensity function can be obtained. When the partialderivative is equal to 0, the best threshold can beobtained. By the statuses of the surrounding LEDs,the theoretical value of the received power is discreteand so is the corresponding probability distribution.It is very difficult to fit the curve. Therefore, the tra-ditional OOK threshold selection method is difficultto achieve for V2V VLC. In this paper, the selectionmethod is used to determine the threshold. ForYON,min ≤ YOFF,max, the initial threshold is Thu =YON,min. Calculating the probability of YON < Thuand YOFF≥Thu under this threshold, the sum ofprobability corresponding received power is theBER. Then, the threshold is iterated to the nextreceived optical power value, and the BER is calcu-lated until the iteration goes to YOFF,max. After theiteration, the received optical power with the lowestBER is selected as the threshold Thu
The proposed algorithm is as follows.According to this algorithm, the probability distribution
curves of LED optical power at different communication dis-tances are calculated, as shown in Figure 4.
As can be seen from Figure 4, the intersection of receiv-ing optical power at different distances is also different.When the distance is close, such that the communicationdistance is 30 meters, the two optical power distributions
LEDR–1, C–1 LEDR–1, C LEDR–1, C+1
LEDR, C–1 LEDR,C LEDR, C+1
LEDR+1, C–1 LEDR+1, C LEDR+1, C+1
Figure 3: Schematic diagram of SISI.
5Wireless Communications and Mobile Computing

do not intersect, which shows that the receiving opticalpower at the statuses On and Off of LEDs is quite different.It also shows that the influence of surrounding LEDs issmall, and the receiving optical power of LEDs at the statusOff will not be increased. When the distance is longer, suchas from 50m to 70m, with the increasing distance, more andmore parts of the receiving optical power distributions coin-cide at different statuses. This is because of the increase ofthe distance, the interval between the LEDs in the image sen-sor is getting smaller and smaller, and the surrounding LEDsare getting closer and closer, which makes the influence ofthe adjacent LEDs more and more serious. If the thresholdselection is not reasonable, the status Off of LED will beidentified as On, and the status On of LED may be identifiedas Off, resulting in the deterioration of BER.
4. Results and Discussion
4.1. Simulation Environment. In this paper, computer simu-lation is used to verify the effectiveness of the proposed algo-rithm. The core parameter settings are shown in Table 1.The size of the LED array is 16 × 16 with a total of 256 LEDs.The radius of LEDs is 3mm, the interval is 15mm, the half-power angle is 60 degrees, and the LEDs’ optical power is0.2W, which is the common LED-rated power of automo-bile taillight. The exposure time of the image sensor at thereceiving end is the same as the flashing period of theLED, its focal length is 35mm, the receiving field angle is70 degrees, and the pixel size is 2.2μm, which is the pixelsize that can be achieved at present. The communication dis-
tance is 20-70 meters, which is far greater than the imagedistance. The modulation mode is optical OOK modulation,and the Gaussian blooming coefficient is 3. To verify theeffectiveness of the algorithm, different LED intervals,Gaussian blooming coefficient, and communication distanceare used for simulation, and the BER of the expected thresh-old method, the average threshold method, and the thresh-old proposed in this paper are compared.
4.2. Simulation Results and Analysis
4.2.1. BER Performance with Different LED Intervals.Figure 5 shows the BER performance with different LEDintervals when the communication distance is 60m andthe Gaussian ambiguity coefficient is 3, where the LED inter-val is 5-25mm and the comparison is made every 5mm.
As can be seen from Figure 5, with the increase of LEDinterval, the BER performance of the three methodsimproves continuously. According to Equations (7)–(10),the LED spacing on the image sensor is also increasing withthe increasing of the actual LED interval, causing the inter-ferences of the j-th LED to the i-th LED to decrease whichmakes the receiving optical power difference between thestatuses On and Off larger. When the LED interval is largeenough (over 25mm), the bit error rate is almost zero.Regarding the comparison between the proposed schemeand the existing scheme, the threshold of the proposedscheme is calculated based on the probability distributionof receiving powers with the minimum BER. However, whenYOFF,max is larger than YON,min, the threshold of the average
Given blooming coefficient σ, the interval of neighbour LEDs d, LED transmission power Pi(t), communication distance U, 256 LEDsstatuses matrices L and noise power N.
Initialization transmission distance u.for u=1: U
The optical power without interference is calculated by the formula (6);Using the formula (10) to calculate the spacing ri,j ′ among LEDR,C to eight neighbour LEDs in the image sensor;According to the state matrix L, the sum ISISI of eight surrounding LEDs is calculated using formula (8);if LEDR,C is on,
Received optical power is YON=Yo+ ISISI +N;Yo is calculated using formula (6);Calculate probability distribution of YON;
elseReceived optical power is YOFF= ISISI +N;Calculate probability distribution of YOFF;
endif the probability curves of YON and YOFF distribution intersect,that is YON,min≤YOFF,max
for Thu = YON,min : YOFF,maxThe sum of the probabilities of status misjudgement is calculated, which is the BER;Find out Thu with the minimum BER, and set this value asthe judgment threshold;end
elseSet the threshold value Thu equals to the mean value of the YON,min and YOFF,max;
endend
Algorithm 1: Threshold calculation algorithm based on probability distribution.
6 Wireless Communications and Mobile Computing

value method is the mean value of YON,min and YOFF,max, andit is easier to misjudge. Also, the threshold of the expectedthreshold method is related to the expected value of SISIwhich is a large difference. It can be seen from the
comparison that the proposed threshold scheme is superiorto the other two methods; especially when the interval is15mm or 20mm, the BER improvement speed is signifi-cantly faster than the expected threshold method and theaverage value method.
Although the performance of BER is improved obviouslywith the increasing of LED spacing, it cannot increase with-out limit, which is not in line with the actual application ofvehicles. Because of the size limitation of the car taillightpanel, the larger LED spacing will reduce the number ofLEDs. In order to meet the needs of lighting, we need toincrease the power of LED, and the increasing power ofLED will also increase the interference of adjacent LED.Therefore, it is necessary to jointly optimize the LED spacingand number in future research to meet the requirements oflighting and better communication simultaneously.
4.2.2. BER Performance with Different Blooming Coefficients.Figure 6 shows the BER performance of different LEDblooming coefficients when the communication distance is60m and the LED spacing is 18mm. The blooming
4×10⁻¹⁰ 4.5×10⁻¹⁰ 5×10⁻¹⁰ 5.5×10⁻¹⁰ 6×10–100.00
0.02
0.04
0.06
0.08
Receiving power of LED
Prob
abili
ty
OnOff
LED luminance probability distributionwhen communication distance is 30 meters
(a)
1×10⁻¹⁰ 1.5×10⁻¹⁰ 2×10⁻¹⁰ 2.5×10⁻¹⁰ 3×10–100.00
0.02
0.04
0.06
0.08
Receiving power of LED
Prob
abili
ty
OnOff
LED luminance probability distributionwhen communication distance is 50 meters
(b)
0.00
0.02
0.04
0.06
0.08
Receiving power of LED
Prob
abili
ty
OnOff
LED luminance probability distributionwhen communication distance is 60 meters
0 5×10–11 1×10⁻¹⁰ 1.5×10⁻¹⁰ 2×10⁻¹⁰ 2.5×10⁻¹⁰
(c)
0.00
0.02
0.04
0.06
0.08
Receiving power of LED
Prob
abili
ty
OnOff
LED luminance probability distributionwhen communication distance is 70 meters
0 5×10–11 1×10⁻¹⁰ 1.5×10⁻¹⁰ 2×10⁻¹⁰
(d)
Figure 4: The receiving optical power distribution curves with different communication distances. (a) The communication distance is 30m;(b) the communication distance is 50m; (b) the communication distance is 60m; (b) the communication distance is 70m.
Table 1: Core parameter setting for simulation.
LED array 16 × 16Led radius 3mm
Led spacing 18mm
Half power angle 60 degrees
Rated power 0.2W
Focal length 35mm
Receiving field angle 70 degrees
Pixel size 2:2μm× 2:2μmGaussian blooming coefficient 3
Communication distance 20-70m
Modulation mode OOK
7Wireless Communications and Mobile Computing

coefficient is 2-6, and the BER performance is comparedevery time the blooming coefficient increases by 1.
It can be seen from Figure 6 that the BER performancedeteriorates with the increase of the blooming coefficients.According to Equations (7) and (8), with the increase ofthe blooming coefficient, the interferences of the j-th LEDto the i-th LED increase which makes the receiving opticalpower difference between the statuses On and Off smaller.While the blooming coefficient increases, there are moreintersecting points between the two curves. Especially forthe status Off of LEDs, if there are several On LEDs nearby,the received power will be increased which makes YOFF,maxlarger than YON,min. In this simulation range, the thresholdstrategy proposed in this paper is superior to the other twomethods. When the blooming coefficient is less than 3, theimprovement effect is more obvious. When the bloomingcoefficient is 3, the proposed method is 65.5% and 50.4%
better than the expected threshold method and the averagevalue method, respectively, which confirms that the pro-posed method has strong ability with the blooming coeffi-cients changing.
The restoration of blurring images is one of the currentresearch hotspots. Different from ordinary image processing,in V2V VLC based on image sensors, it needs to recover anddetect the received image quickly, which needs a more accu-rate algorithm to achieve. The noise in the channel is mainlyGaussian blur and ambient light noise. Gaussian blurring isa kind of multiplicative noise, and the ambient light noiseis additive noise. When the combination of the two affectsthe communication performance, additive noise can be con-sidered to approximate multiplicative noise, so that the noisein the channel is all additive noise, and the receiver can filterit easily. In addition, blank pixels can be artificially insertedinto the received image, and the Gaussian mixture modelis used to fit the received signal to improve the influence ofGaussian blurring.
4.2.3. BER Performance with Different CommunicationDistances. Figure 7 shows the BER performance with differ-ent communication distances when the LED spacing is18mm and the Gaussian ambiguity coefficient is 3, wherethe communication distance is 20-70m and the comparisonis made every 5m.
As can be seen from Figure 7, the BER performancedeteriorates with the increase of communication distance.According to Equations (7)–(10), with the increasing ofcommunication distance, the area occupied by the wholeLED array on the image sensor is getting smaller, the spacingbetween the LEDs is getting closer, and the surroundingLED interference is getting bigger and bigger. Most times,we can only recognize the area of the LED array panel onthe image sensor and divide the area equally in that eachblock represents an LED. It is possible that YOFF,max is largerthan YON,min. In this simulation range, the proposed thresh-old strategy is better than the other two methods and can
5 10 15 20 25LED interval (mm)
10–5
10–4
10–3
10–2
10–1
100BE
R
Expectation threshold methodAverage threshold methodProposed method
Figure 5: BER performance with different LED intervals.
2 32.5 43.5 4.5 5.55 6Blooming effect level
10–5
10–4
10–3
10–2
10–1
100
BER
Expectation threshold methodAverage threshold methodProposed method
Figure 6: BER performance with different blooming coefficients.
Communication distance (m)
10–5
10–4
10–3
10–2
10–1
100
BER
Expectation threshold methodAverage threshold methodProposed method
20 3025 4035 45 5550 7060 65
Figure 7: BER performance with different communicationdistances.
8 Wireless Communications and Mobile Computing
achieve no errors before 44m. With the increase of distance,the BER improvement effect is more and more obvious. At70m, the BER of the proposed scheme is improved by 39%and 57% compared with the average threshold method andthe expected threshold method, respectively, which confirmsto be more suitable for long-distance communication.
Although the BER performance is better when the com-munication distance is close, in order to meet the needs ofsafety, vehicles must keep a certain distance from each other.Especially when driven on the highway, vehicles must bekept at a safe distance to avoid accidents. In future research,we can reduce the number of On LEDs in the LED arrayusing pre-coding (such as convolutional coding), especiallythe number of On LEDs around the Off LEDs, to reducethe interference between LEDs. However, the reduction ofthe number of bright LEDs will cause a lack of lighting func-tion. Under the condition of meeting the lighting conditions,the appropriate layout optimization of the status On or OffLEDs needs more in-depth research. In addition, multipleLED light groups can transmit 1-bit information, whichreduces the transmission rate, but improves the BER.
5. Conclusions
SISI is an important factor affecting the bit error rate of V2VVLC, which mainly depends on the parameters such as LEDspacing, ambiguity coefficient, and communication distance.With different parameters, the influence of SISI is also differ-ent. The smaller the LED interval, the larger the bloomingcoefficient or the longer the communication distance willcause the increase of SISI and then affect the final decision.
This paper analyses the communication framework ofV2V VLC based on image sensors, calculates the possibleSISI caused by surrounding LEDs, and proposes a thresholdselection strategy, which is verified by simulation. By chang-ing the influence factors of SISI such as LED spacing,blooming coefficient, and communication distance, theBER performances of the proposed threshold method, theexpected threshold method, and the average thresholdmethod are compared. The proposed method is superior tothe other two methods; especially, it can be error-free before44m, and the BER is improved significantly. In a future work,we can use mathematical methods to fit the probability distri-bution curve of the received power and calculate the optimalsolution. We can also explore new coding methods to reason-ably configure the ratio of the statuses On and Off of LEDs ineach frame or optical filtering methods to reduce interferenceand further improve BER.
Data Availability
The data used to support the findings of this study are avail-able from the corresponding author upon request.
Conflicts of Interest
The authors declare that there is no conflict of interestregarding the publication of this paper.
Acknowledgments
This research was funded by the National Natural ScienceFoundation of China (grant number 61961007); the Basic Abil-ity Improvement Project of Young and Middle-aged Teachersin Guangxi Universities (grant number 2021KY0217); theDean Project of the Guangxi Key Laboratory ofWirelessWide-band Communication; the Dean Project of Ministry of Educa-tion Key Lab. of Cognitive Radio and Information Processing(grant number CRKL170110); and the School of Informationand Communication, Guilin University of Electronic Technol-ogy, Guilin, China.
References
[1] J. J. Shea, “Book reviews [6 books reviewed],” IEEE ElectricalInsulation Magazine, vol. 37, no. 3, pp. 45–47, 2021.
[2] P. He, Y. X. Shi, T. Meng et al., “Recent advances in whitelight-emitting diodes of carbon quantum dots,” Nanoscale,vol. 12, no. 8, pp. 4826–4832, 2020.
[3] M. Usman, S. Malik, andM. Munsif, “AlGaN-based ultravioletlight-emitting diodes: challenges and opportunities,” Lumines-cence, vol. 36, no. 2, pp. 294–305, 2021.
[4] R. Z. Liu and K. Xu, “Blue perovskite light-emitting diodes(LEDs): a minireview,” Instrumentation Science & Technology,vol. 48, no. 6, pp. 616–636, 2020.
[5] S. Arai, M. Kinoshita, and T. Yamazato, “Optical wireless com-munication: a candidate 6G technology?,” IEICE Transactionson Fundamentals of Electronics, Communications and Com-puter Sciences, vol. E104.A, no. 1, pp. 227–234, 2021.
[6] S. Ariyanti and M. Suryanegara, “Visible light communication(VLC) for 6G technology: the potency and research chal-lenges,” in 2020 Fourth World Conference on Smart Trendsin Systems, Security and Sustainability (WorldS4), pp. 490–493, London, UK, 2020.
[7] N. Chi, Y. Zhou, Y. Wei, and F. Hu, “Visible light communica-tion in 6G: advances, challenges, and prospects,” IEEE Vehicu-lar Technology Magazine, vol. 15, no. 4, pp. 93–102, 2020.
[8] A. Memedi and F. Dressler, “Vehicular visible light communi-cations: a survey,” IEEE Communications Surveys and Tuto-rials, vol. 23, no. 1, pp. 161–181, 2021.
[9] E. Eso, Z. Ghassemlooy, S. Zvanovec, J. Sathian, M. M. Abadi,and O. I. Younus, “Performance of vehicular visible light com-munications under the effects of atmospheric turbulence withaperture averaging,” Sensors, vol. 21, no. 8, p. 2751, 2021.
[10] S. Caputo, L. Mucchi, F. Cataliotti, M. Seminara, T. Nawaz,and J. Catani, “Measurement-based VLC channel characteri-zation for I2V communications in a real urban scenario,”Vehicular Communications, vol. 28, p. 100305, 2021.
[11] T. H. Do and M. Yoo, “Multiple exposure coding for short andlong dual transmission in vehicle optical camera communica-tion,” IEEE Access, vol. 7, pp. 35148–35161, 2019.
[12] T. Kasashima, T. Yamazato, H. Okada, T. Fujii, T. Yendo, andS. Arai, “Interpixel interference cancellation method for road-to-vehicle visible light communication,” in 2013 IEEE 5thInternational Symposium on Wireless Vehicular Communica-tions (WiVeC), pp. 1–5, Dresden, Germany, 2013.
[13] T. Yamazato, “Overview of visible light communications-withemphasis on image sensor communications,,” in 2017 23rdAsia-Pacific Conference on Communications (APCC), pp. 1–6, Perth, WA, Australia, 2017.
9Wireless Communications and Mobile Computing

[14] M. Kinoshita, T. Yamazato, H. Okada et al., “Motion modelingof mobile transmitter for image sensor based I2V-VLC, V2I-VLC, and V2V-VLC,” in 2014 IEEE Globecom Workshops(GC Wkshps),, pp. 450–455, Austin, TX, USA, 2014.
[15] Y. Ohira, S. Arai, T. Yendo et al., “Novel demodulation schemebased on blurred images for image-sensor-based visible lightcommunication,” in 2015 IEEE Globecom Workshops (GCWkshps), pp. 1–6, San Diego, CA, USA, 2015.
[16] D. Vuong and M. Yoo, “Interpixel interference mitigation invisible light communication using image sensor,” IEEE Access,vol. 6, pp. 45543–45551, 2018.
[17] T. H. Do andM. Yoo, “Amulti-feature LED bit detection algo-rithm in vehicular optical camera communication,” IEEEAccess, vol. 7, pp. 95797–95811, 2019.
[18] C. W. Chow, C. Y. Chen, and S. H. Chen, “Enhancement ofsignal performance in LED visible light communications usingmobile phone camera,” IEEE Photonics Journal, vol. 7, no. 5,pp. 1–7, 2015.
[19] C. W. Chow, C. Y. Chen, and S. H. Chen, “Visible light com-munication using mobile-phone camera with data rate higherthan frame rate,” Optics Express, vol. 23, no. 20, pp. 26080–26085, 2015.
[20] P. Liu, P. Zheng, S. Yang, and Z. Chen, “Modeling and analysisof spatial inter-symbol interference for RGB image sensorsbased on visible light communication,” Sensors, vol. 19,no. 22, 2019.
[21] S. Arai, S. Mase, T. Yamazato et al., “Experiment on hierarchi-cal transmission scheme for visible light communication usingLED traffic light and high-speed camera,” in 2007 IEEE 66thVehicular Technology Conference, pp. 2174–2178, Baltimore,MD, USA, 2007.
[22] M. Akanegawa, Y. Tanaka, and M. Nakagawa, “Basic study ontraffic information system using LED traffic lights,” IEEETransactions on Intelligent Transportation Systems, vol. 2,no. 4, pp. 197–203, 2001.
[23] T. Yamazato, M. Kinoshita, S. Arai et al., “Vehicle motion andpixel illumination modeling for image sensor based visiblelight communication,” IEEE Journal on Selected Areas in Com-munications, vol. 33, no. 9, pp. 1793–1805, 2015.
[24] B. Zhang, J. Zerubia, and J. C. Olivo-Marin, “A study of Gauss-ian approximations of fluorescence microscopy PSF models,”in Proceedings of Conference on Three-Dimensional and Multi-dimensional Microscopy-Image Acquisition and ProcessingXIII, San Jose, CA, USA, 2006.
10 Wireless Communications and Mobile Computing