a novel markov chain approach to rank aggregation
TRANSCRIPT
A Novel Markov-Chain Approach to Rank
Aggregation
Andrew Huang

Introduction
Ranking is everywhere
Provides information
Ranking would be:[webpage 1, 2, 3, … ]
More formally, a ranking is a set of alternatives (whatever is being ranked) that is ranked according to a metric (what criteria the alternatives are being ranked by) [1].

However, by looking at just one source of information, we are subject to its biases. But by looking at multiple sources of information and combining, or aggregating, the rankings - we reduce the bias any one source has.
The Rank Aggregation Problem: given this information, what is the best way to aggregate it?
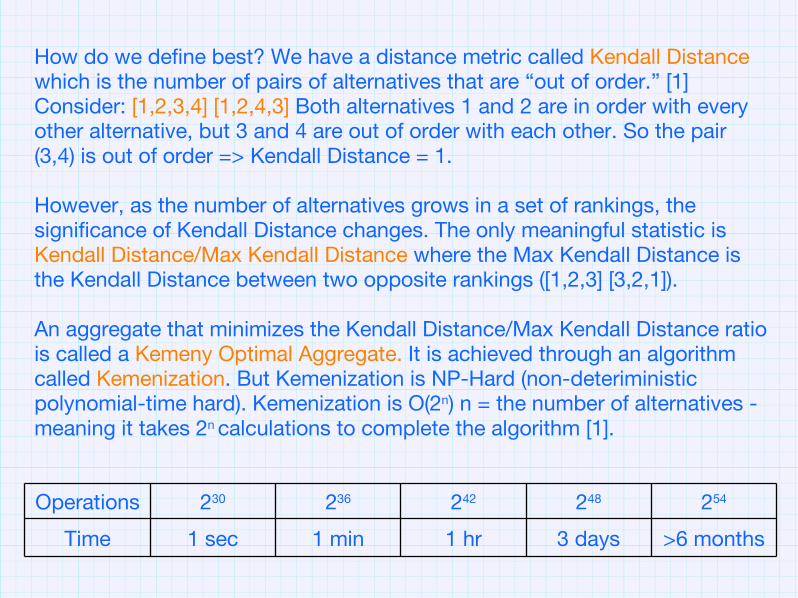
How do we define best? We have a distance metric called Kendall Distance which is the number of pairs of alternatives that are “out of order.” [1] Consider: [1,2,3,4] [1,2,4,3] Both alternatives 1 and 2 are in order with every other alternative, but 3 and 4 are out of order with each other. So the pair (3,4) is out of order => Kendall Distance = 1.
However, as the number of alternatives grows in a set of rankings, the significance of Kendall Distance changes. The only meaningful statistic is Kendall Distance/Max Kendall Distance where the Max Kendall Distance is the Kendall Distance between two opposite rankings ([1,2,3] [3,2,1]).
An aggregate that minimizes the Kendall Distance/Max Kendall Distance ratio is called a Kemeny Optimal Aggregate. It is achieved through an algorithm called Kemenization. But Kemenization is NP-Hard (non-deteriministic polynomial-time hard). Kemenization is O(2n) n = the number of alternatives - meaning it takes 2n calculations to complete the algorithm [1].
>6 months3 days1 hr1 min1 secTime
254248242236230Operations

While Kemenization is the best rank aggregation algorithm in terms of accuracy, it lacks efficiency and feasibility [1].
A property of Kemeny Optimal Rankings that is useful in Rank Aggregation is called the Condorcet Criterion. It states that if an alternative “a” defeats an alternative all others in pair-wise distance (essentially Kendall Distance), then “a” should be the winner [2].
We can extend this to the Extended Condorcet Criterion which states that if a group of alternatives “α” defeats another group of alternatives “β” in pair-wise distance, then “α” should be ranked above “β” [3].
Each of the criteria implies that a majority of rankings supports the alternative or group of alternatives over the other alternatives.

Problem
To create a rank aggregation algorithm that has a low Kendall Distance ratio compared to other algorithms and satisfies the Extended Condorcet Criterion

MethodsThere have been Rank Aggregation algorithms in the past which have used Markov Chains.Markov Chain: distribution of probabilities with origin states and transition states
The number in each square represents the probability to transition from the origin state to the transition state.
Imagine that there were a population of beavers in the east and a population of gazelles in the west. The Markov Chain describes the two populations movements throughout one year. 25% of animals who start in the east stay in the East, whereas 75% of them move west. 50% of animals who start in the west move to the east, and 50% of the animals stay in the west. To get the second year the Markov Chain would be squared.
0.50.5
0.750.25
East West
East
West

0.50.5
0.750.25
East West
East
West
0.50.5
0.750.25
East West
East
West
0.6250.375
0.56250.4375
0.25 * 0.25 = 0.0625
0.5 * 0.75 = 0.375
0.0625 + 0.375 = 0.4375
The remaining probabilities would be calculated in the same fashion.
To get n years, the Markov Chain would be raised to the nth power.
0.50.5
0.750.25
East West
East
West
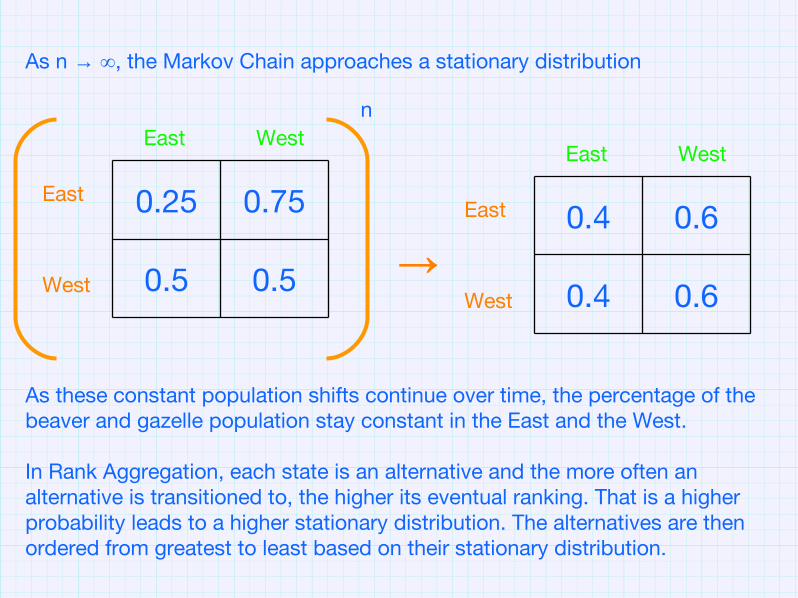
As n → ∞, the Markov Chain approaches a stationary distribution
n
→0.60.4
0.60.4
East West
East
West
As these constant population shifts continue over time, the percentage of the beaver and gazelle population stay constant in the East and the West.
In Rank Aggregation, each state is an alternative and the more often an alternative is transitioned to, the higher its eventual ranking. That is a higher probability leads to a higher stationary distribution. The alternatives are then ordered from greatest to least based on their stationary distribution.

The best single-method Rank Aggregation method thus far is MC4
MC4 - if an alternative “a” is ranked above another “b” in a majority of rankings, then “b” transitions to “a” [1].
Consider: [1,2,3,4,5,6,7,8,9,10] [3,1,2,4,5,6,7,8,9,10] [2,3,4,5,6,7,8,9,10,1]
MC4 says that alternative “2” should transition to alternative “1” - however from an intuitive point of view, we see that in the first two rankings, “1” and “2” are essentially tied, but in the third ranking “2” defeats “1” by a very large margin and therefore, “1” should transition to “2”
Proposition: MC5 - if the Kendall Distance between an alternative “a” and an alternative “b” (this distance is added to the lower ranked alternative) is lower for “a” then “b” transitions to “a”
[1,2,3,4,5,6,7,8,9,10] => (1,2) = 1[3,1,2,4,5,6,7,8,9,10] => (1,2) = 1[2,3,4,5,6,7,8,9,10,1] => (2,3) (2,4) … (2,1) (1,3) (1,4) (1,5) .. (1,10) = 17
Swap Distance for “2” = 1 + 1 = 2 Swap Distance for “1” = 17 17 > 2 therefore “1” transitions to “2”

To test which algorithm is more accurate, we would run the same set of data through each to form Markov Chains, raise the Markov Chains to a sufficiently large power to achieve a stationary distribution, and then order the stationary distributions and the corresponding alternative from greatest to least.
MaterialsMATLAB - the programming of MC4 and MC5 as well as assorted programsData - 28 Mutual Funds ranked according to percent return over 10 years. The data is ranked according to sector of the economy, with each sector being a separate and biased source of information.
[1,2,3,4,5,6,7,8,9,10,11] Max KD = 55[3,12,6,13,14,15,16,17,18,8,11,19,20,10,21,22] = 120 [7,23,1,4,21,24,9,18,6] = 36[1,6,8,25,20,7,13,17,10,16,18,11,4,22,26,9] = 120 [23,6,27,8,28,16,26,11,18] = 36 [18,10,2,8,21,3,25,6,5,24,19,28,27,7] = 91[8,16,6,17,11] = 10[18,6,16,11] = 6[6,16,11] = 3[4,16,25,18,6,22,11] = 21
Total Kendall Distance = 55 + 120 + 36 + … + 21 = 498
HighMarkICONDWSAIMOld MutualMunderVan KampenSaratogaFBRAmerican CenturyVanguardJohn HancockForwardDavis
1516171819202122232425262728
1234567891011121314
Jennison ING Ivy BlackRockColumbiaFidelityFranklinT. RowePutnamMorgan StanleyRydexWaddell & ReedAllianzSeligman
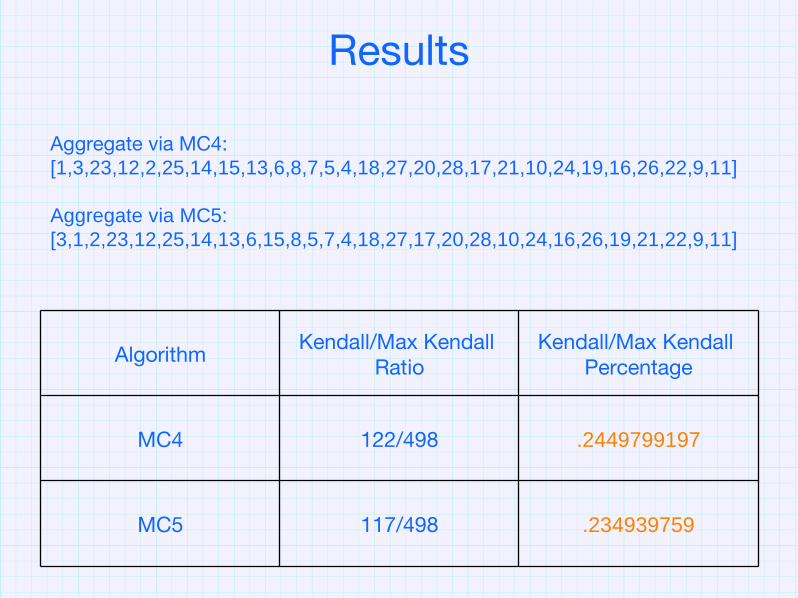
Results
Aggregate via MC4: [1,3,23,12,2,25,14,15,13,6,8,7,5,4,18,27,20,28,17,21,10,24,19,16,26,22,9,11]
Aggregate via MC5: [3,1,2,23,12,25,14,13,6,15,8,5,7,4,18,27,17,20,28,10,24,16,26,19,21,22,9,11]
.234939759117/498MC5
.2449799197122/498MC4
Kendall/Max Kendall Percentage
Kendall/Max Kendall Ratio
Algorithm

DiscussionMC5 aggregated a result that was 1% more accurate than MC4’s result. MC4 was the best rank aggregation method therefore, an improvement of 1% is very significant. In addition, applications in the real world deal with thousands of alternatives so the absolute difference between MC4 and MC5 grows even more.
MC4 uses the heuristic - “Wins are good” and “Wins against higher ranked alternatives are better.” MC5 uses the heuristic - “Winning by a large margin is good” and “Winning against a higher ranked alternative by a large margin is better.” MC5’s heuristic takes into account more than just a “win” but the strength of a “win”
MC5 can also be applied to: creating a better system of grading than G.P.A., creating a meta-search engine, and helping companies who use rankings to give recommendations to consumers.

Future Research
MC5 was shown to be a more accurate rank aggregation algorithm than MC4 due to its more holistic heuristic.
Conclusion
Refine MC5 to further increase accuracy and to apply the algorithm to different data sets.

Literature[1] Cynthia Dwork, Ravi Kumar, Moni Naor, D. Sivakumar, Rank Aggregation
Methods for the Web. 2001.
[2] M.J. Condorcet. Essai sur l’ application de l’ analyse a la probabilite des decisions rendues a la pluralite des voix. 1785.
[3] M. Truchon. An extension of the Condorcet Criterion and Kemeny Orders. 1998