a novel blood test for the early detection of alzheimer’s ... · journal of alzheimer’s disease...
TRANSCRIPT
Journal of Alzheimer’s Disease 23 (2011) 1–21IOS Press
1
Supplementary Data
A Novel Blood Test for the Early Detectionof Alzheimer’s Disease
Phil. D. Ryea,1,2, Birgitte Boonstra Booija,1,3, Gisle Gravea, Torbjørn Lindahla, Lena Kristiansena,Hilde-Marie Andersena, Peter O. Horndalsveenb, Harald A. Nygaardc,d, Mala Naikd,e,Dagne Hoprekstadf, Peter Wetterbergg, Christer Nilssonh, Dag Aarslandi, Praveen Sharmaa
and Anders Lönneborga,∗aDiaGenic ASA, Oslo, NorwaybMemory Clinic, Sanderud Hospital, Ottestad, NorwaycNKS Olaviken Hospital for Old Age Psychiatry, Erdal, NorwaydSection for Geriatric Medicine, Department of Public Health and Primary Health Care,University of Bergen, Bergen, NorwayeGeriatric Section, Haraldsplass Deaconess Hospital, Bergen, Norwayf Geriatric Clinic, Stavanger University Hospital, Stavanger, NorwaygMemory Clinic, Department of Geriatrics, Medical Division, Ullevål University Hospital, Oslo, NorwayhDepartment of Clinical Sciences, Lund University Hospital, Lund, SwedeniStavanger University Hospital, and Akershus University Hospital, Department of Psychiatry,Division of Mental Health Services, and Institute of Clinical Medicine, University of Oslo, Lørenskog, Norway
Accepted 8 September 2010
SUPPLEMENTARY METHODS
Data pre-processing
The raw data generated from the real-time PCRanalysis was processed prior to statistical analysis tocalculate accurate quantification cycle (Cq) values andquality check the data to eliminate failed measure-ments/missing values. The SDS files generated fromthe 7900HT Fast Real-Time PCR System were loaded
1 Authors contributed equally to the manuscript.2 Present address: Phil. D. Rye, GE Healthcare Medical Diagnos-
tics, Nycoveien 2, P.O. Box 4220, Nydalen, 0401 Oslo, Norway.3 Present address: Birgitte Boonstra Booij, Clavis Pharma,
Parkveien 53 B, 0256 Oslo, Norway.∗Correspondence to: Dr. A. Lönneborg, DiaGenic ASA, Gren-
seveien 92, 0663 Oslo, Norway. E-mail: [email protected].
into the Sequence Detection Systems software dis-tributed by Applied Biosystems. Clipped and Resultsfiles are exported for each SDS file. The Clipped-filecontains the baseline-corrected normalized reportersignal (Rn) values and the Results file contains thethreshold and the Cq values automatically assigned bythe software.
The threshold is adjusted to a value above thebackground and significantly below the plateau ofan amplification plot. It must be placed within thelinear region of the amplification curve, which rep-resents the detectable log-linear range of the PCR.One threshold value is set for each assay, as describedbelow.
1. Log2 is calculated for all available Rn values.2. Any Log2(Rn) values found to be below −6,
are set to NA (not available).
ISSN 1387-2877/11/$27.50 © 2011 – IOS Press and the authors. All rights reserved

2 P.D. Rye et al. / A Novel Blood Test for Alzheimer’s Disease
3. If there are three or more Rn points availablefrom the amplification curve, a linear model,Y = aX + b, are fitted to three and three of theavailable Log2(Rn) points, beginning with thelowest three points and moving up one point at atime.
4. All linear models are checked whether theirslopes and residuals are within pre-defined lim-its. If so, the corresponding Log2(Rn) pointsinvolved in models which pass the quality control(QC) criteria, are saved in a register.
5. An upper limit value is set. This value is the high-est possible threshold value (Log2(Rn)) foundin the register for this particular assay and sam-ple combination. A lower limit is set in the samemanner choosing the lowest possible thresholdvalue (Log2(Rn)).
The following step is done for each assay across allsamples:
6. A suggested threshold value is calculated: themean of all upper limits is calculated and twostandard deviations (SD) are subtracted. Themean of all lower limits is calculated and twostandard deviations are added. A threshold valueis suggested to be set at upper 15% of the distancebetween these two values. Suggested thresh-old = meanlower + 2 SDlower + ((meanupper−2 SDupper) − (meanlower + 2 SDlower)) ×(1−15%).
7. All upper and lower limits are plotted along withthe suggested threshold.
All sample-assay pairs in the data are subjected tothe following procedure to set the Cq values.
1. The intersection point between the given thresh-old and the Log2(Rn) curve is found.
2. A linear model, Y = aX + b, is fitted to the closestLog2(Rn) point below the intersection, alongwith two of the closest points above.
3. Another linear model is fitted to the closestLog2(Rn) point above the intersection, alongwith two of the closest points below.
4. A QC test is performed on both models to seewhether the model’s slope is above a prede-fined value and the residual is below a predefinedvalue.
5. If either one of the models passes the QC testcriteria, the intersection point is set as the Cqvalue.
6. The results are saved to a postscript file.
7. Each Cq value along with the correspondingassay and sample name is stored for further sta-tistical data analysis.
Component selection and decision boundarycalculation
PLSR and LOOCV were used for model buildingand to estimate classification accuracy of the cali-bration set. Two components were finally selected asgiving the optimum LOOCV efficacy (data not shown),with the -coefficients for the final PLS model usedfor classification in the range from −3.46 to +3.32.From this LOOCV plot the results are skewed towardshigher specificity than sensitivity, which could be com-pensated by changing the decision boundary (cut-off)from the default value of 0. The ROC for the finalPLS model is shown in Fig. 2. From the LOOCV clas-sifications observed using the calibration samples, apossible decision boundary could be −0.077, whichwould provide an accuracy of 72.6%. However, fromthe LOOCV classifications, any value between −0.077and −0.029 would give both sensitivity and specificityabove 70%. Therefore after calculation of the mid-points, a plateau value of −0.04155 was chosen asthe decision boundary in the final model. Classificationvalues above −0.04155 are thus classified as AD, whilevalues below −0.04155 are classified as cognitivelyhealthy.
Diagnostic accuracy calculation and simulationmodel
The estimation of accuracy in the calibration andvalidation analyses were performed using clinical diag-nosis as the ‘gold standard’, which has been assumed tobe 100% correct. However, this assumption is overesti-mated, given that an accurate diagnosis in Alzheimer’sdisease (AD) may vary from 60% at GP clinics to over90% at some specialized clinics [1–3]. Using the clini-cal diagnosis as reference will therefore underestimatethe sensitivity and specificity of the test under evalu-ation. Therefore, a simulation model was prepared todetermine the expected accuracy based on the approachproposed by Albert [4] that focuses on joint model-ing of multiple tests, but also includes the test-specificestimators. From the article:
P(Yij, Ti) =∑
P(Yij|Ti, di = l)P(Ti|di = l)P(di = l) (1)
where i is the index for subject and j the index for thetest, while P(Ti |di) is estimated from a previous study.
P.D. Rye et al. / A Novel Blood Test for Alzheimer’s Disease 3
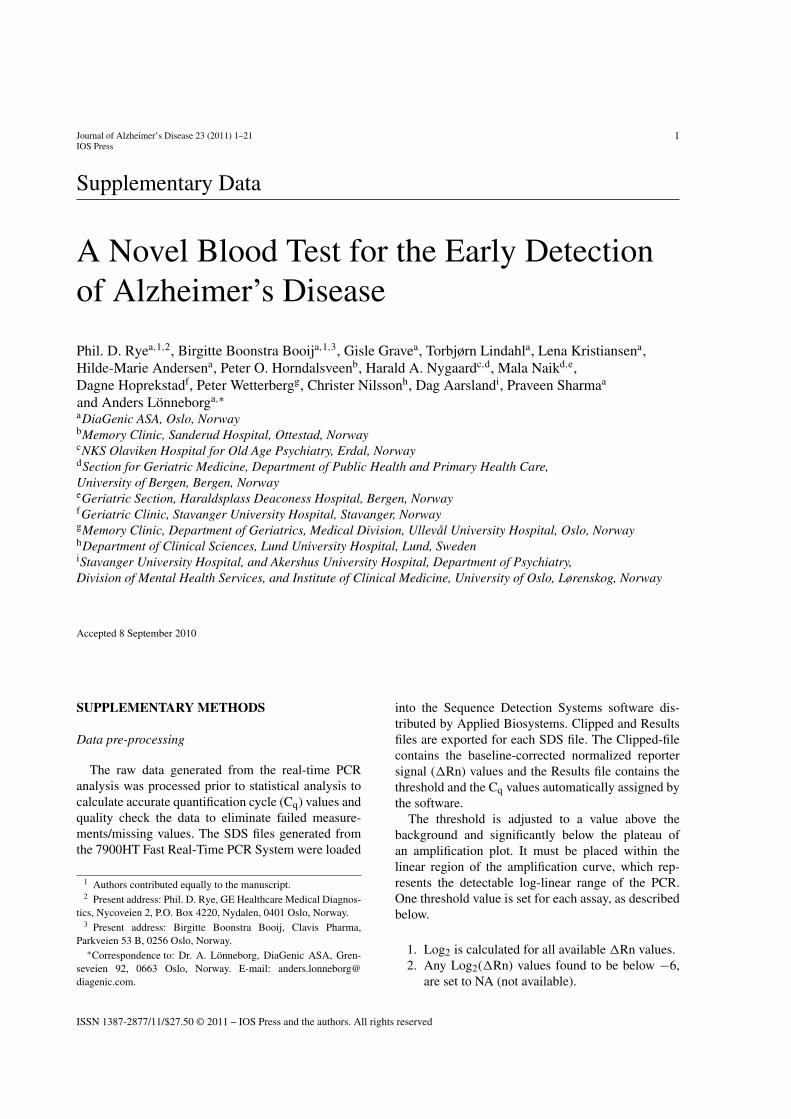
Supplementary Figure 1. Biological processes represented by theproducts of the genes on the array. 1) Apoptosis, 2) Biological pro-cess unclassified, 3) Carbohydrate metabolism, 4) Cell cycle, 5)Cell proliferation and differentiation, 6) Cell structure and mobility,7) Developmental processes, 8) Electron transport, 9) Homeostasis,10) Immunity and defense, 11) Intracellular protein traffic, 12) Lipid,fatty acid and steroid metabolism, 13) Miscellaneous, 14) Nucle-oside, nucleotide and nucleic acid metabolism, 15) Oncogenesis,16) Other metabolism, 17) Protein metabolism and modification,18) Protein targeting and localization, 19) Sensory perception,20) Signal transduction, 21) Transport.
In both the joint modeling and test-specific modeling,this approach simplifies when P(Yi |Ti,di) = P(Yi |di).According to Albert the sensitivity and specificity forthe j’th test can be estimated by maximizing the log-likelihood of (1) separately for each test.
In our study there is only one reference test, theclinical diagnosis. Thus for our analysis the 96-geneassay test is Y, the clinical diagnosis is T and d is theprevalence. If we assume that Y and T are independent,the equations can be written as:
P(Yi, Ti) =1∑
l=0
P(Yi|di = l)P(Ti|di = l)P(di = l) (2)
From previous studies we have an estimate ofP(Yi,Ti) (the overall accuracy) and have made someassumptions regarding the clinically accuracy. If weassume the sensitivity and specificity are the same inthe clinical setting, then P(Ti|di = l) will have the samevalue for both l’s in the above equation. If the assumedsensitivity and specificity are the same, the prevalence,P(di = l), for this population will be 50%.
With an overall accuracy of 0.726, the assumed sen-sitivity and specificity of clinical diagnosis of 0.80 anda prevalence of 0.50, then equation (2) can be solvedfor P(Yi|di = 1) and P(Yi|di = 0). As these are the onlyfunctions of the equation, the maximum likelihood iscalculated as normal. The sum of these must equal1.815, giving possible combinations ranging from 0.82to 1.0 for each of the two probabilities. However, theoverall accuracy will be the same for all these combi-nations, 0.91.
In order to have an overview of the possible impact ofan imperfect gold standard some data simulations havebeen performed. The following method/algorithm wasused:
1. One hundred samples were set to have true ADand 100 as true healthy.
2. Each of these 200 samples was diagnosed asAD or healthy, with a probability of 80% beingaccording to true diagnosis (simulation of theclinical diagnosis).
3. Each of the original 200 samples was diagnosedas AD or healthy, with different probabilities(from 60 to 100%) of being in agreement with thetrue diagnosis (simulation of the 96-gene assayor similar test).
4. The results from 3 were then evaluated using 2 asthe gold standard, and the sensitivity accordingto clinical diagnosis was calculated.
5. Step 1–4 was repeated 100,000 times for eachprobability used in 3.
The results from the simulations, at an assumed clin-ical accuracy of 80% are shown below:
Assumed Clinical Accuracy
60% 70% 75% 80% 85% 90% 95% 100%
Min 0.340 0.398 0.446 0.480 0.514 0.564 0.604 0.655Mean 0.560 0.621 0.651 0.681 0.711 0.741 0.771 0.801Median 0.560 0.621 0.650 0.680 0.711 0.740 0.771 0.800Max 0.771 0.813 0.844 0.868 0.888 0.912 0.924 0.943
From this table it can be seen that the mean valueand the medians are very similar, and therefore itcan be concluded that the underlying distributions aresymmetric. Minimum and maximum values should beinterpreted in light of 100,000 simulations for eachlevel of accuracy and are therefore expected to be eithervery low or very high.
Considering the mean values, a true accuracy of 85%would be expected to give an observed accuracy of71% when compared with the clinical diagnosis, while100% accuracy would be expected give an observedaccuracy of 80%. In the calibration and validation stud-

4 P.D. Rye et al. / A Novel Blood Test for Alzheimer’s Disease
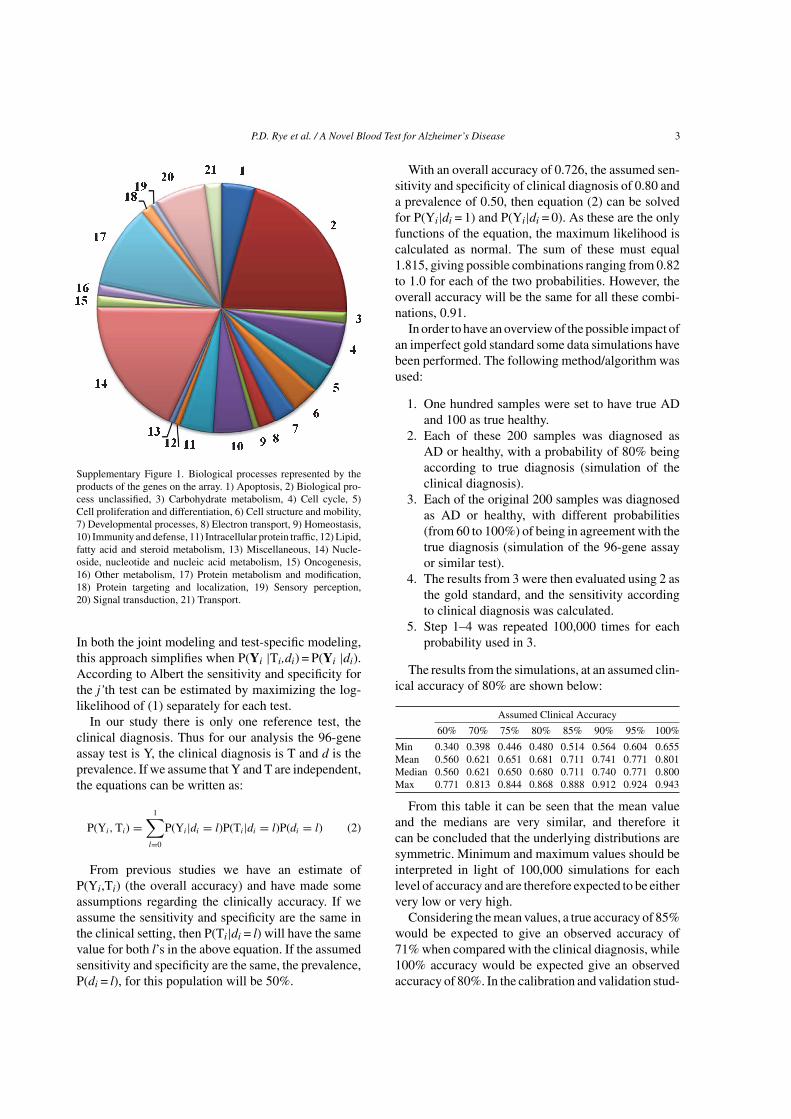
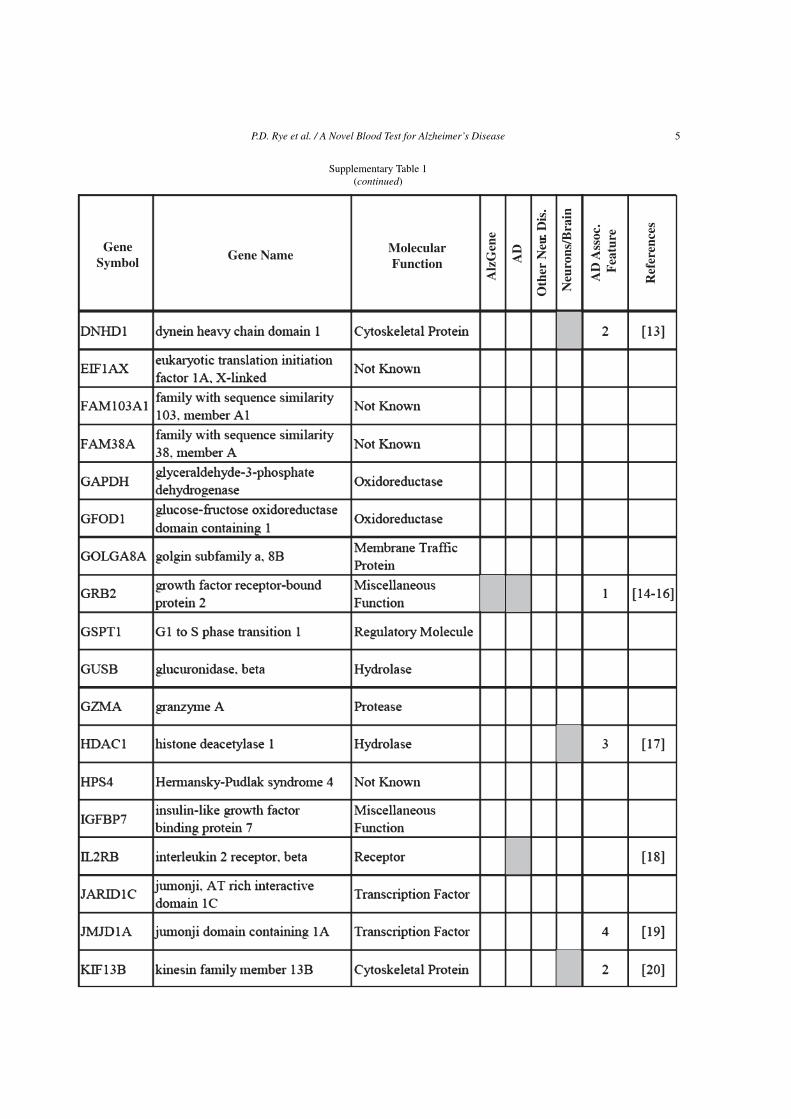
Supplementary Table 1Genes of known function represented by the probes included in the model. Probes present in the AlzGene list or are associated with AD, otherneurological diseases, neurone or brain functions are indicated in gray shade. AD associated features are indicated with numbers; 1) Amyloid-,
2) Tau or microtubules, 3) Mitochondrial function, 4) Oxidative stress, 5) Calcium regulation or 6) Inflammation
GeneSymbol Gene Name Molecular
Function
Alz
Gen
e
AD
Oth
er N
eur.
Dis
.
Neu
rons
/Bra
in
AD
Ass
oc.
Fea
ture
Ref
eren
ces
P.D. Rye et al. / A Novel Blood Test for Alzheimer’s Disease 5
Supplementary Table 1(continued)
GeneSymbol Gene Name Molecular
Function
Alz
Gen
e
AD
Oth
er N
eur.
Dis
.
Neu
rons
/Bra
in
AD
Ass
oc.
Fea
ture
Ref
eren
ces

6 P.D. Rye et al. / A Novel Blood Test for Alzheimer’s Disease
Supplementary Table 1(continued)
GeneSymbol Gene Name Molecular
Function
Alz
Gen
e
AD
Oth
er N
eur.
Dis
.
Neu
rons
/Bra
in
AD
Ass
oc.
Fea
ture
Ref
eren
ces

P.D. Rye et al. / A Novel Blood Test for Alzheimer’s Disease 7
Supplementary Table 1(continued)
GeneSymbol Gene Name Molecular
Function
Alz
Gen
e
AD
Oth
er N
eur.D
is.
Neu
rons
/Bra
in
AD
Ass
oc.
Fea
ture
Ref
eren
ces
8 P.D. Rye et al. / A Novel Blood Test for Alzheimer’s Disease
Supplementary Table 1(continued)
GeneSymbol Gene Name Molecular
Function
Alz
Gen
e
AD
Oth
er N
eur.D
is.
Neu
rons
/Bra
in
AD
Ass
oc.
Fea
ture
Ref
eren
ces
ies an accuracy of 72.6% was observed when comparedwith the clinical diagnosis. According to the simula-tions this would correspond to accuracy slightly largerthan 85%. It should also be noted that the mean valuesare all smaller than the assumed test accuracy, whichmeans that the observed accuracy, when comparingwith the clinical diagnosis, is most likely underesti-mated.
Therefore, comparing the results of the 96-geneassay test with an imperfect gold standard will mostlikely underestimate the accuracy. Assuming an accu-racy of 80% for the clinical diagnosis compared withthe truth, the above calculations and simulations sug-gest that the accuracy of the 96-gene assay test is in therange 85%–90% when compared with the underlyingtruth.

P.D. Rye et al. / A Novel Blood Test for Alzheimer’s Disease 9
Supplementary Table 2Patient data for calibration cohort
10 P.D. Rye et al. / A Novel Blood Test for Alzheimer’s Disease
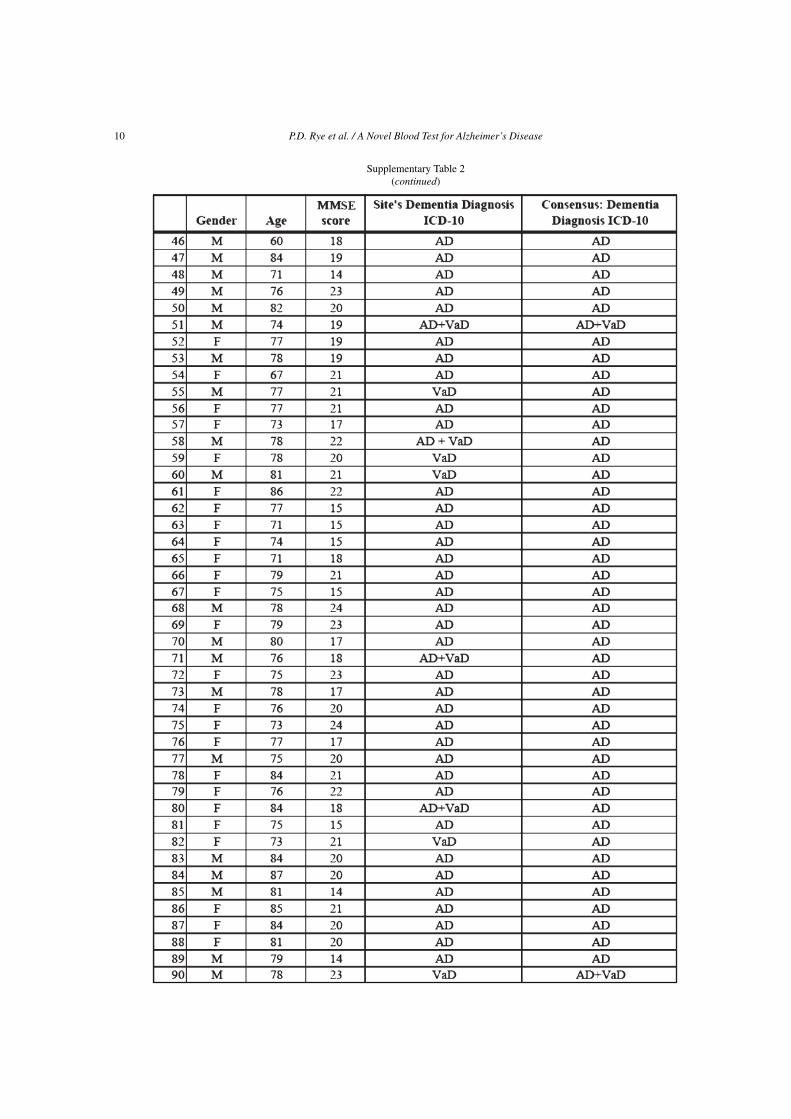
Supplementary Table 2(continued)

P.D. Rye et al. / A Novel Blood Test for Alzheimer’s Disease 11
Supplementary Table 2(continued)

12 P.D. Rye et al. / A Novel Blood Test for Alzheimer’s Disease
Supplementary Table 2(continued)

P.D. Rye et al. / A Novel Blood Test for Alzheimer’s Disease 13
Supplementary Table 2(continued)
14 P.D. Rye et al. / A Novel Blood Test for Alzheimer’s Disease
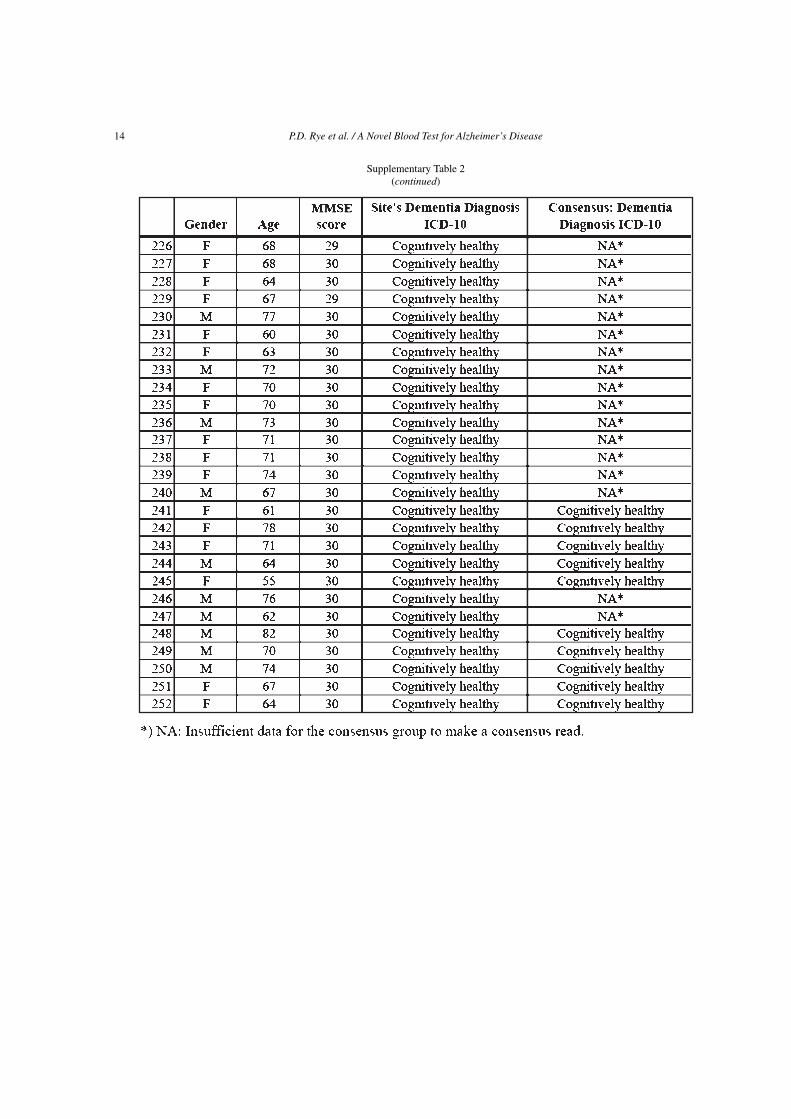
Supplementary Table 2(continued)

P.D. Rye et al. / A Novel Blood Test for Alzheimer’s Disease 15
Supplementary Table 3Patient data for initial validation cohort
16 P.D. Rye et al. / A Novel Blood Test for Alzheimer’s Disease
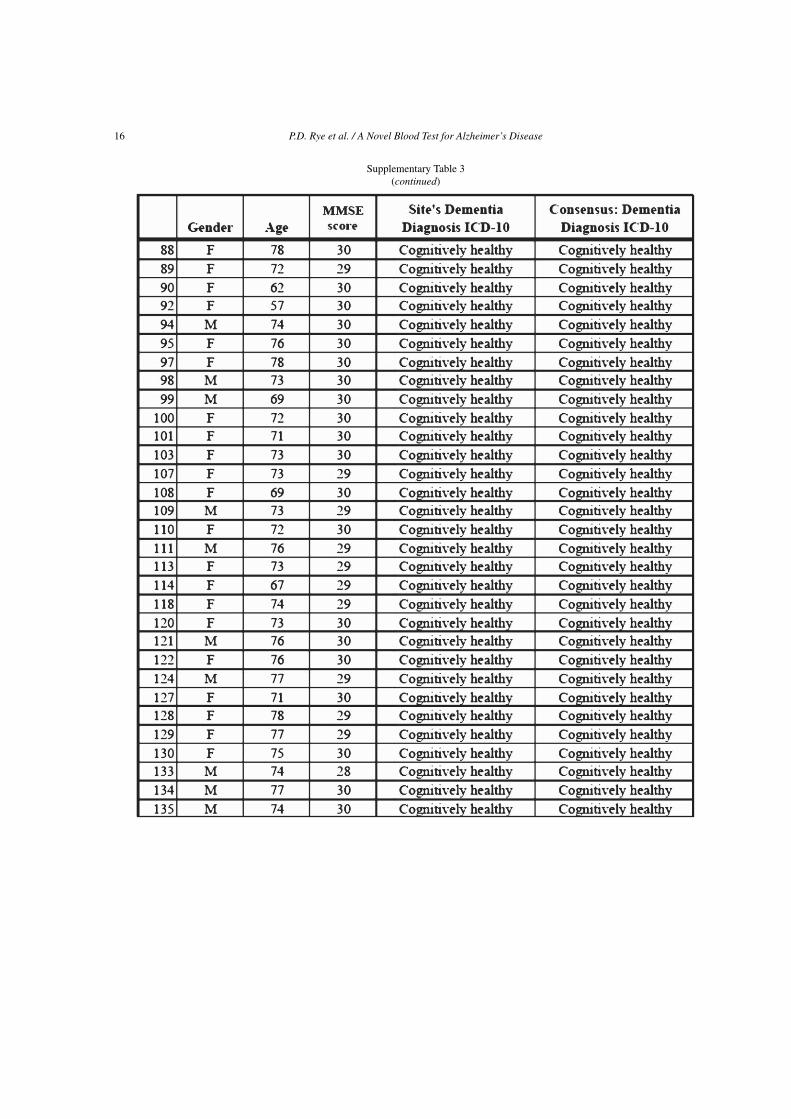
Supplementary Table 3(continued)
P.D. Rye et al. / A Novel Blood Test for Alzheimer’s Disease 17
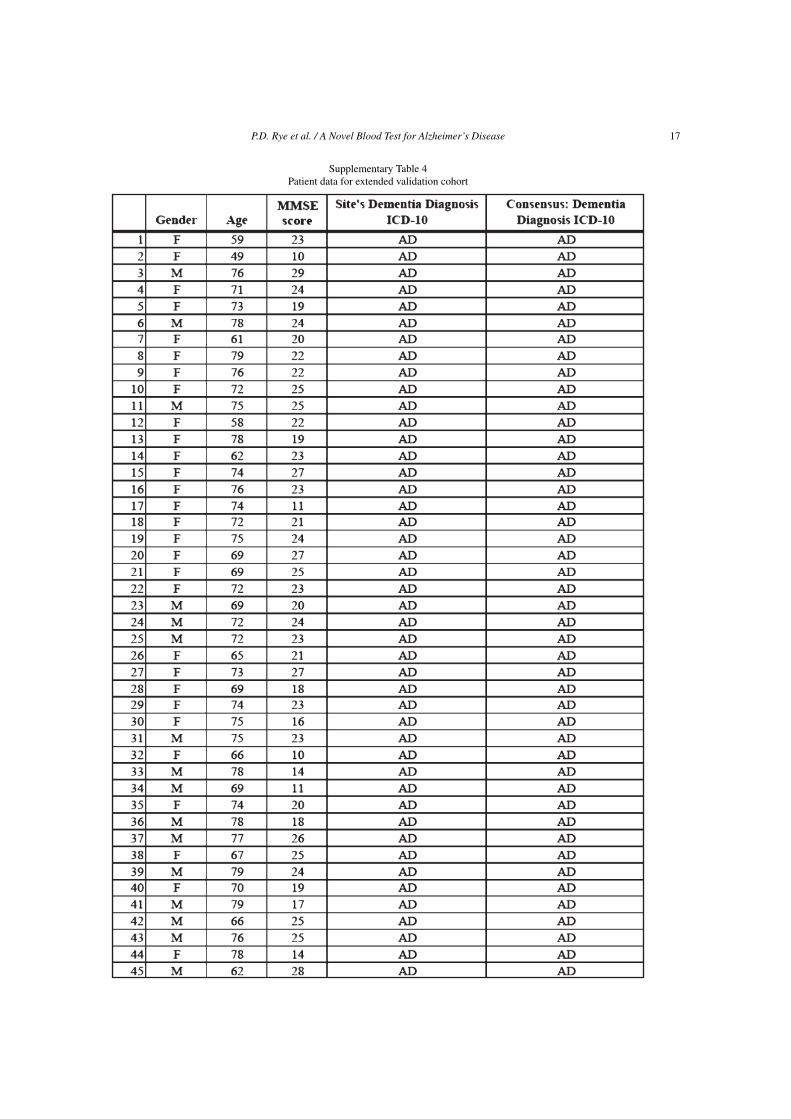
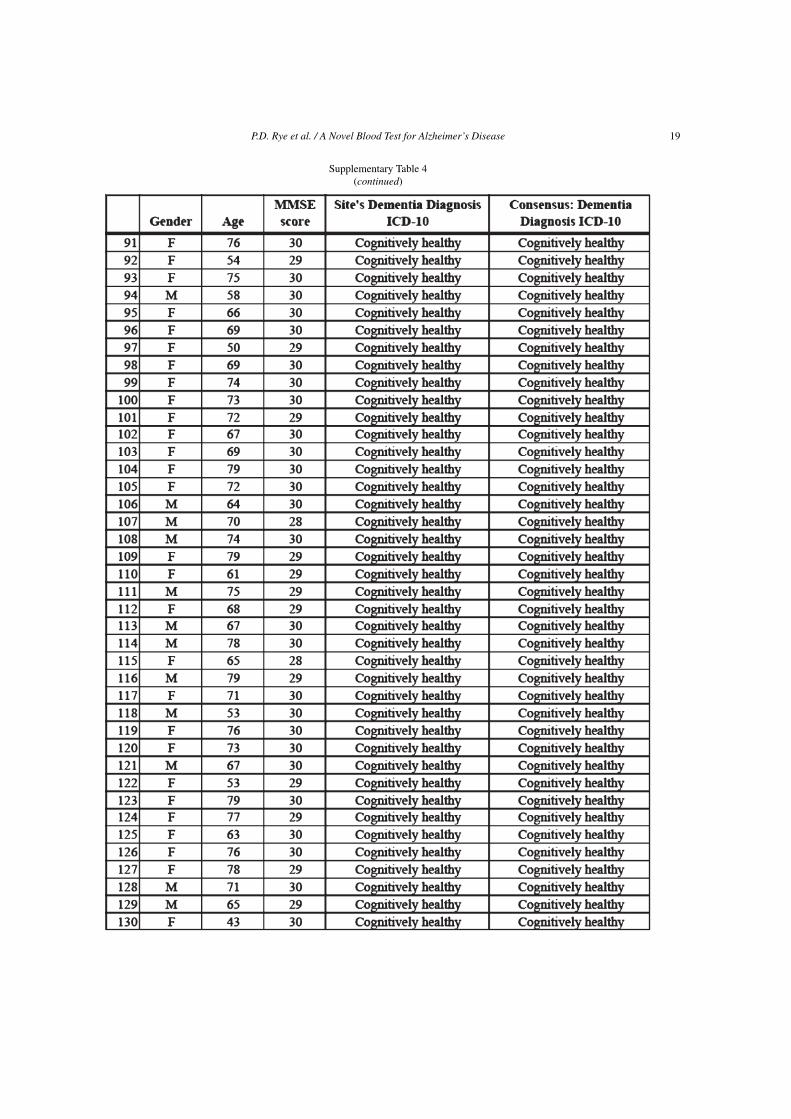
Supplementary Table 4Patient data for extended validation cohort

18 P.D. Rye et al. / A Novel Blood Test for Alzheimer’s Disease
Supplementary Table 4(continued)
P.D. Rye et al. / A Novel Blood Test for Alzheimer’s Disease 19
Supplementary Table 4(continued)

20 P.D. Rye et al. / A Novel Blood Test for Alzheimer’s Disease
REFERENCES
[1] Li Y, Rinne JO, Mosconi L, Pirraglia E, Rusinek H,DeSanti S, Kemppainen N, Nagren K, Kim BC, Tsui W,de Leon MJ (2008) Regional analysis of FDG and PIB-PET images in normal aging, mild cognitive impairment, andAlzheimer’s disease. Eur J Nucl Med Mol Imaging 35, 2169-2181.
[2] Mok W, Chow TW, Zheng L, Mack WJ, Miller C (2004)Clinicopathological concordance of dementia diagnoses bycommunity versus tertiary care clinicians. Am J AlzheimersDis Other Demen 19, 161-165.
[3] Zekry D, Duyckaerts C, Belmin J, Geoffre C, Moulias R,Hauw JJ (2002) Alzheimer’s disease and brain infarcts in theelderly. Agreement with neuropathology. J Neurol 249, 1529-1534.
[4] Albert PS (2009) Estimating diagnostic accuracy of multiplebinary tests with an imperfect reference standard. Stat Med28, 780-797.
[5] Yamamoto S, Wajima T, Hara Y, Nishida M, Mori Y (2007)Transient receptor potential channels in Alzheimer’s disease.Biochim Biophys Acta 1772, 958-967.
[6] Solomon B, Koppel R, Jossiphov J (2001) Immunostainingof calmodulin and aluminium in Alzheimer’s disease-affectedbrains. Brain Res Bull 55, 253-256.
[7] Krauthammer M, Kaufmann CA, Gilliam TC, RzhetskyA (2004) Molecular triangulation: bridging linkage andmolecular-network information for identifying candidategenes in Alzheimer’s disease. Proc Natl Acad Sci U S A 101,15148-15153.
[8] O’Day DH, Myre MA (2004) Calmodulin-binding domains inAlzheimer’s disease proteins: Extending the calcium hypoth-esis. Biochem Biophys Res Commun 320, 1051-1054.
[9] Taanman JW, Schrage C, Ponne NJ, Das AT, Bolhuis PA, deVries H, Agsteribbe E (1990) Isolation of cDNAs encodingsubunit VIb of cytochrome c oxidase and steady-state levelsof coxVIb mRNA in different tissues. Gene 93, 285-291.
[10] Fernandez MR, Porte S, Crosas E, Barbera N, Farres J,Biosca JA, Pares X (2007) Human and yeast zeta-crystallinsbind AU-rich elements in RNA. Cell Mol Life Sci 64,1419-1427.
[11] Marshall C, Mamary AJ, Verhoeven AJ, Marshall BE (1996)Pulmonary artery NADPH-oxidase is activated in hypoxicpulmonary vasoconstriction. Am J Respir Cell Mol Biol 15,633-644.
[12] Del Villar K, Miller CA (2004) Down-regulation of DENN/MADD, a TNF receptor binding protein, correlates with neu-ronal cell death in Alzheimer’s disease brain and hippocampalneurons. Proc Natl Acad Sci U S A 101, 4210-4215.
[13] Vallee RB, Seale GE, Tsai JW (2009) Emerging roles formyosin II and cytoplasmic dynein in migrating neurons andgrowth cones. Trends Cell Biol 19, 347-355.
[14] Russo C, Venezia V, Repetto E, Nizzari M, Violani E, Carlo P,Schettini G (2005) The amyloid precursor protein and its net-work of interacting proteins: physiological and pathologicalimplications. Brain Res Brain Res Rev 48, 257-264.
[15] Bertram L, McQueen MB, Mullin K, Blacker D, TanziRE (2007) Systematic meta-analyses of Alzheimer diseasegenetic association studies: the AlzGene database. Nat Genet39, 17-23.
[16] Nizzari M, Venezia V, Repetto E, Caorsi V, Magrassi R,Gagliani MC, Carlo P, Florio T, Schettini G, Tacchetti C,Russo T, Diaspro A, Russo C (2007) Amyloid precursorprotein and Presenilin1 interact with the adaptor GRB2 andmodulate ERK 1,2 signaling. J Biol Chem 282, 13833-13844.
[17] Kim JY, Shen S, Dietz K, He Y, Howell O, Reynolds R,Casaccia P (2010) HDAC1 nuclear export induced by patho-logical conditions is essential for the onset of axonal damage.Nat Neurosci 13, 180-189.
[18] Bonotis K, Krikki E, Holeva V, Aggouridaki C, CostaV, Baloyannis S (2008) Systemic immune aberrations inAlzheimer’s disease patients. J Neuroimmunol 193, 183-187.
[19] Wellmann S, Bettkober M, Zelmer A, Seeger K, Faigle M,Eltzschig HK, Buhrer C (2008) Hypoxia upregulates the his-tone demethylase JMJD1A via HIF-1. Biochem Biophys ResCommun 372, 892-897.
[20] Yoshimura Y, Terabayashi T, Miki H (2010) Par1b/MARK2phosphorylates kinesin-like motor protein GAKIN/KIF13Bto regulate axon formation. Mol Cell Biol 30, 2206-2219.
[21] Orban-Nemeth Z, Simader H, Badurek S, Trancikova A,Propst F (2005) Microtubule-associated protein 1S, a shortand ubiquitously expressed member of the microtubule-associated protein 1 family. J Biol Chem 280, 2257-2265.
[22] Jung MY, Lorenz L, Richter JD (2006) Translational controlby neuroguidin, a eukaryotic initiation factor 4E and CPEBbinding protein. Mol Cell Biol 26, 4277-4287.
[23] Saito K, Fujiwara T, Katahira J, Inoue K, Sakamoto H (2004)TAP/NXF1, the primary mRNA export receptor, specificallyinteracts with a neuronal RNA-binding protein HuD. BiochemBiophys Res Commun 321, 291-297.
[24] Mackenzie KF, Topping EC, Bugaj-Gaweda B, Deng C,Cheung YF, Olsen AE, Stockard CR, High Mitchell L, BaillieGS, Grizzle WE, De Vivo M, Houslay MD, Wang D, BolgerGB (2008) Human PDE4A8, a novel brain-expressed PDE4cAMP-specific phosphodiesterase that has undergone rapidevolutionary change. Biochem J 411, 361-369.
[25] Chen Q, Wang S, Thompson SN, Hall ED, Guttmann RP(2006) Identification and characterization of PEBP as a cal-pain substrate. J Neurochem 99, 1133-1141.
[26] George AJ, Holsinger RM, McLean CA, Tan SS, ScottHS, Cardamone T, Cappai R, Masters CL, Li QX (2006)Decreased phosphatidylethanolamine binding protein expres-sion correlates with Abeta accumulation in the Tg2576 mousemodel of Alzheimer’s disease. Neurobiol Aging 27, 614-623.
[27] Winter L, Abrahamsberg C, Wiche G (2008) Plectin isoform1b mediates mitochondrion-intermediate filament networklinkage and controls organelle shape. J Cell Biol 181,903-911.
[28] Boom A, Pochet R, Authelet M, Pradier L, Borghgraef P,van Leuven F, Heizmann CW, Brion JP (2004) Astrocyticcalcium/zinc binding protein S100A6 over expression inAlzheimer’s disease and in PS1/APP transgenic mice models.Biochim Biophys Acta 1742, 161-168.
[29] Zimmer DB, Chaplin J, Baldwin A, Rast M (2005) S100-mediated signal transduction in the nervous system andneurological diseases. Cell Mol Biol (Noisy-le-grand) 51,201-214.
[30] Hwang DY, Cho JS, Oh JH, Shim SB, Jee SW, Lee SH, SeoSJ, Lee SK, Lee SH, Kim YK (2005) Differentially expressedgenes in transgenic mice carrying human mutant presenilin-2 (N141I): sorrelation of selenoprotein M with Alzheimer’sdisease. Neurochem Res 30, 1009-1019.
[31] Bellinger FP, He QP, Bellinger MT, Lin Y, Raman AV, WhiteLR, Berry MJ (2008) Association of selenoprotein p withAlzheimer’s pathology in human cortex. J Alzheimers Dis 15,465-472.
[32] Berleth ES, Masso-Welch PA, Kazim LA, Ip MM, Mihich E,Ehrke MJ (2001) Expression, tissue distribution, and cellularlocalization of the antiapoptotic TIP-B1 protein. J LeukocBiol 69, 995-1005.
P.D. Rye et al. / A Novel Blood Test for Alzheimer’s Disease 21
[33] Takahashi T, Yamashita H, Nagano Y, Nakamura T, OhmoriH, Avraham H, Avraham S, Yasuda M, Matsumoto M (2003)Identification and characterization of a novel Pyk2/relatedadhesion focal tyrosine kinase-associated protein that inhibitsalpha-synuclein phosphorylation. J Biol Chem 278, 42225-42233.
[34] Koga M, Ishiguro H, Yazaki S, Horiuchi Y, Arai M, NiizatoK, Iritani S, Itokawa M, Inada T, Iwata N, Ozaki N, UjikeH, Kunugi H, Sasaki T, Takahashi M, Watanabe Y, SomeyaT, Kakita A, Takahashi H, Nawa H, Muchardt C, Yaniv M,Arinami T (2009) Involvement of SMARCA2/BRM in theSWI/SNF chromatin-remodeling complex in schizophrenia.Hum Mol Genet 18, 2483-2494.
[35] Gustavsson N, Han W (2009) Calcium-sensing beyond neuro-transmitters: functions of synaptotagmins in neuroendocrineand endocrine secretion. Biosci Rep 29, 245-259.
[36] Kabashi E, Valdmanis PN, Dion P, Spiegelman D, McConkeyBJ, Vande Velde C, Bouchard JP, Lacomblez L, PochigaevaK, Salachas F, Pradat PF, Camu W, Meininger V, Dupre N,Rouleau GA (2008) TARDBP mutations in individuals withsporadic and familial amyotrophic lateral sclerosis. Nat Genet40, 572-574.
[37] Liscic RM, Grinberg LT, Zidar J, Gitcho MA, Cairns NJ(2008) ALS and FTLD: two faces of TDP-43 proteinopathy.Eur J Neurol 15, 772-780.
[38] Del Bo R, Ghezzi S, Corti S, Pandolfo M, Ranieri M, SantoroD, Ghione I, Prelle A, Orsetti V, Mancuso M, Soraru G, BrianiC, Angelini C, Siciliano G, Bresolin N, Comi GP (2009)TARDBP (TDP-43) sequence analysis in patients with famil-ial and sporadic ALS: identification of two novel mutations.Eur J Neurol 16, 727-732.
[39] Uittenbogaard M, Chiaramello A (2002) Expression of thebHLH transcription factor Tcf12 (ME1) gene is linked to theexpansion of precursor cell populations during neurogenesis.Brain Res Gene Expr Patterns 1, 115-121.
[40] Dixon J, Jones NC, Sandell LL, Jayasinghe SM, Crane J, ReyJP, Dixon MJ, Trainor PA (2006) Tcof1/Treacle is requiredfor neural crest cell formation and proliferation deficienciesthat cause craniofacial abnormalities. Proc Natl Acad SciU S A 103, 13403-13408.
[41] Sakai D, Trainor PA (2009) Treacher Collins syndrome:unmasking the role of Tcof1/treacle. Int J Biochem Cell Biol41, 1229-1232.
[42] Wood HB (2010) TMEM106B is a susceptibility locus forFtld. Nat Rev Neurol 6, 184.
[43] Jimenez S, Baglietto-Vargas D, Caballero C, Moreno-Gonzalez I, Torres M, Sanchez-Varo R, Ruano D, VizueteM, Gutierrez A, Vitorica J (2008) Inflammatory response inthe hippocampus of PS1M146L/APP751SL mouse model ofAlzheimer’s disease: age-dependent switch in the microglialphenotype from alternative to classic. J Neurosci 28, 11650-11661.
[44] Yang L, Lu R, Jiang L, Liu Z, Peng Y (2009) Expression andgenetic analysis of tumor necrosis factor-alpha (TNF-alpha)G-308A polymorphism in sporadic Alzheimer’s disease in aSouthern China population. Brain Res 1247, 178-181.
[45] Kassner SS, Bonaterra GA, Kaiser E, Hildebrandt W, MetzJ, Schroder J, Kinscherf R (2008) Novel systemic markersfor patients with Alzheimer disease? – a pilot study. CurrAlzheimer Res 5, 358-366.
[46] Baranowska-Bik A, Bik W, Wolinska-Witort E, MartynskaL, Chmielowska M, Barcikowska M, Baranowska B (2008)Plasma beta amyloid and cytokine profile in women withAlzheimer’s disease. Neuro Endocrinol Lett 29, 75-79.
[47] Vu TH, Hoffman AR (1997) Imprinting of the Angelman syn-drome gene, UBE3A, is restricted to brain. Nat Genet 17,12-13.
[48] Yamasaki K, Joh K, Ohta T, Masuzaki H, Ishimaru T, Mukai T,Niikawa N, Ogawa M, Wagstaff J, Kishino T (2003) Neuronsbut not glial cells show reciprocal imprinting of sense andantisense transcripts of Ube3a. Hum Mol Genet 12, 837-847.
[49] Wishart TM, Paterson JM, Short DM, Meredith S, RobertsonKA, Sutherland C, Cousin MA, Dutia MB, GillingwaterTH (2007) Differential proteomics analysis of synaptic pro-teins identifies potential cellular targets and protein mediatorsof synaptic neuroprotection conferred by the slow Wal-lerian degeneration (Wlds) gene. Mol Cell Proteomics 6,1318-1330.
[50] Hochstrasser M (2009) Origin and function of ubiquitin-likeproteins. Nature 458, 422-429.