a new shock absorber model with an application in … · figure 1. steady-state shock absorber...
TRANSCRIPT

400 Commonwealth Drive, Warrendale, PA 15096-0001 U.S.A. Tel: (724) 776-4841 Fax: (724) 776-5760 Web: www.sae.org
SAE TECHNICALPAPER SERIES 2003-01-3411
A New Shock Absorber Model with anApplication in Vehicle Dynamics Studies
Richard van KasteelZF Sachs AG
Wang Cheng-guo, Qian Lixin, Liu Jin-zhao and Zhan Wen-zhangChina Academy of Railway Sciences
Reprinted From: Vehicle Dynamics, Braking, Steering and Suspensions(SP–1814)
2003 SAE International Truck and BusMeeting and Exhibition
Fort Worth, TexasNovember 10-12, 2003
All rights reserved. No part of this publication may be reproduced, stored in a retrieval system, ortransmitted, in any form or by any means, electronic, mechanical, photocopying, recording, or otherwise,without the prior written permission of SAE.
For permission and licensing requests contact:
SAE Permissions400 Commonwealth DriveWarrendale, PA 15096-0001-USAEmail: [email protected]: 724-772-4891Tel: 724-772-4028
For multiple print copies contact:
SAE Customer ServiceTel: 877-606-7323 (inside USA and Canada)Tel: 724-776-4970 (outside USA)Fax: 724-776-1615Email: [email protected]
ISBN 0-7680-1333-XCopyright © 2003 SAE InternationalPositions and opinions advanced in this paper are those of the author(s) and not necessarily those of SAE.The author is solely responsible for the content of the paper. A process is available by which discussionswill be printed with the paper if it is published in SAE Transactions.
Persons wishing to submit papers to be considered for presentation or publication by SAE should send themanuscript or a 300 word abstract of a proposed manuscript to: Secretary, Engineering Meetings Board, SAE.
Printed in USA

2003-01-3411
A New Shock Absorber Model with an Application in Vehicle Dynamics Studies
Richard van Kasteel ZF Sachs AG
Wang Cheng-guo, Qian Lixin, Liu Jin-zhao and Zhan Wen-zhang China Academy of Railway Sciences
Copyright © 2003 SAE International
ABSTRACT
The shock absorber plays a vital role in reducing the vertical and horizontal motions of the vehicle in order to have good handling and ride features. A good representation of the damper behaviour is very important in vehicle dynamics studies. The damper force of a shock absorber is indirectly generated by pressure-oil flow relationships through hydraulic valves, which are a part of the inner structure. A completely new aspect is the representation of damper force by mathematical expressions on the basis of a formula. A series of measurements have been carried out with aid of a hydraulic flow bench. The data obtained is fitted on the formula with coefficients, which describe some of the typical quantities of a shock absorber such as damping rate, blow-off factor and secondary damping rate with great accuracy. With the coefficients it is possible to obtain a relationship between the valve setting and shape of the damper characteristic, which is a relationship between damper force and piston velocity. In this way a new and compact empirical model is obtained, enabling vehicle dynamics studies being carried out to optimize shock absorber and vehicle design. This paper is a result of a joined project between ZF Sachs AG and the China Academy of Railway Science (CARS) in Beijing in China.
INTRODUCTION
When developing new trucks and buses, more and more vehicle dynamics studies are carried out to improve handling and ride comfort. Also the predictability of the vehicle behavior is more and more important because modern vehicles can drive faster. In order to do so one needs an accurate and detailed vehicle model. The accuracy of this model is greatly determined by the accuracy of the shock absorber model. As a matter of fact, the shock absorber plays a vital role in the vertical and horizontal motion of the vehicle. The design process of a shock absorber has several aspects such as structure, geometry, durability and functionality.
The functional aspect stands for valve tuning, which nowadays is still done by means of ride work. During ride work ride engineers test several prototypes to obtain better ride and handling features for the vehicle. The valve tuning is very complex and the training process of learning about the relationship between damper characteristic and valve setting is based on practical experience, which is very time consuming and expensive.
A shock absorber characteristic is defined as relationship between shock absorber force and piston velocity. There are all kinds of shock absorber characteristics for the axles of heavy vehicles, busses, trucks and also for the damping of truck cabins, which is shown in figure 1.

Figure 1. Steady-state shock absorber characteristics for different applications
For this reason a good representation of the damper characteristic is necessary to improve the tuning process and to improve knowledge about the relationship between valve setting and characteristic, which is a completely new aspect in this field. A series of measurements has been carried out with aid of a hydraulic flow bench. The data obtained has been represented by mathematical expressions on the basis of a formula. The proposed method makes use of a formula with coefficients, which describe some of the typical quantities of a shock absorber such as the damping rate at low piston speeds and the blow-off factor for the secondary damping rate. The formula is capable of describing the damper characteristics of all kinds of shock absorbers, with different characteristics for bus and truck axles as well as cabin shock absorbers.
THE FORMULAE
In order to describe the shock absorber behaviour under quasi-static conditions the formula should be able to fulfill the following requirements:
• To describe all possible damper characteristics • To be fitted easily on measured data. • To have a physical meaning. The parameter should
characterize some typical quantities such as damping rate, blow-off point and secondary damping rate. This feature makes it possible to investigate changes of these quantities upon the handling and ride comfort of the vehicle
• To show a relationship between the shape of the characteristic and the valve setting. This is an important feature for the reduction of design times and improves transparency of the design process.
• To calculate the performance of the characteristic. It is important to know how much energy is dissipated in relation to the vehicle dynamics behaviour and it is also important to know if the shock absorber is able to lead away enough heat in extreme conditions.
• To be compact and easy to use • To contribute to a better understanding of shock
absorber behaviour. We can describe the damper characteristics with polynomials, but these have several disadvantages such as:
• A coefficient in a polynomial doesn’t have any physical or practical meaning.
• It is difficult to extrapolate beyond the measurement data, because it can start to fluctuate due to the high order of the polynomial.
We have used of another possibility: a representation by a special function that is based on the so-called Magic Formula, representing tyre behaviour [1,2]1.
4
5
XepsXx++++
==== (1)
H7 )arctan(Bx)-G(BxD}])Bx(arctanK
)arctan(Bx)-(BxE-{BxarctanCsin[D)x(Y
⋅⋅⋅⋅++++⋅⋅⋅⋅
++++⋅⋅⋅⋅⋅⋅⋅⋅⋅⋅⋅⋅====(2)
with Y(x) representing either the damper force or pressure drop and x denoting piston velocity or oil flow. This formula has the following favourable properties:
• It fits characteristics for truck shock absorbers, cabin shock absorbers and all kind of characteristics of shock absorbers in railway applications such as primary vertical-, secondary vertical/horizontal, yaw- and inter vehicle shock absorbers.
• Only a few coefficients are needed to get a very good curve fit.
• The coefficients can describe the valve setting. • The coefficients represent typical quantities of a
shock absorber characteristic, such as the damping rate, the blow-off factor and the secondary damping rate.
• The fitted curves are very smooth, which implies that the change of the slope is realistic.
• The function behaves well beyond the fitted range. • The function can be treated analytically, so we can
calculate directly properties such as dissipated energy and performance.
1 Numbers in parentheses in the text designate reference at the end of the paper.
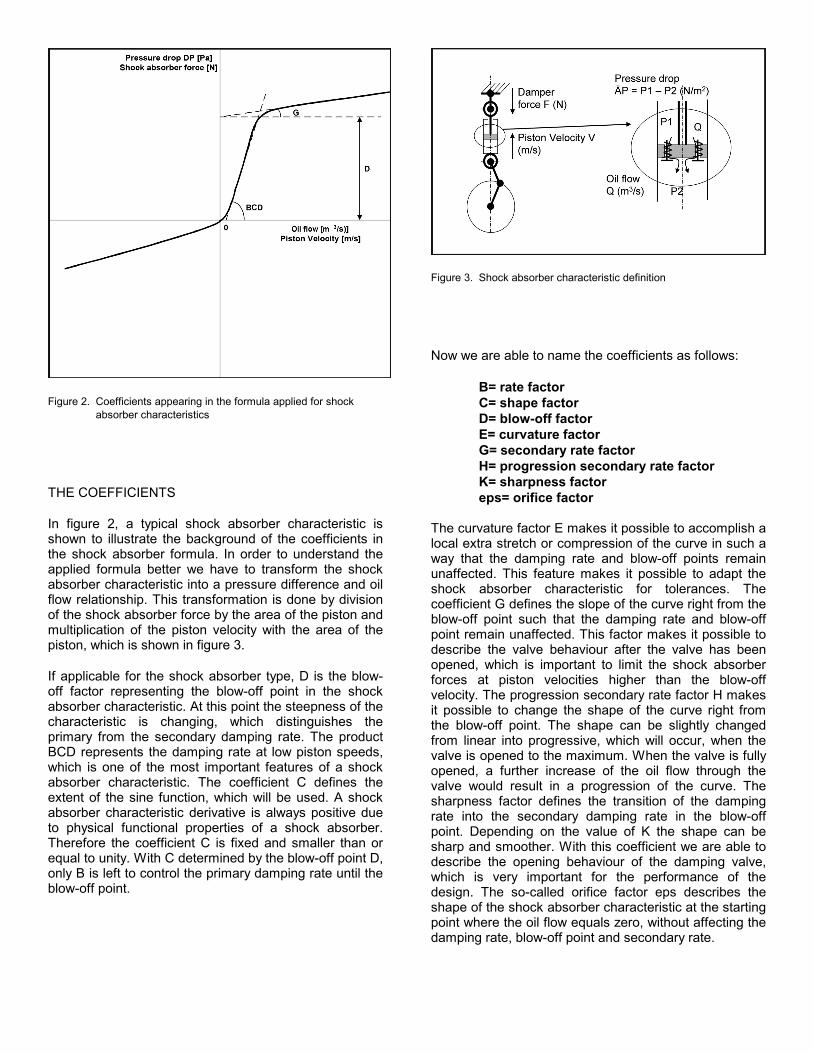
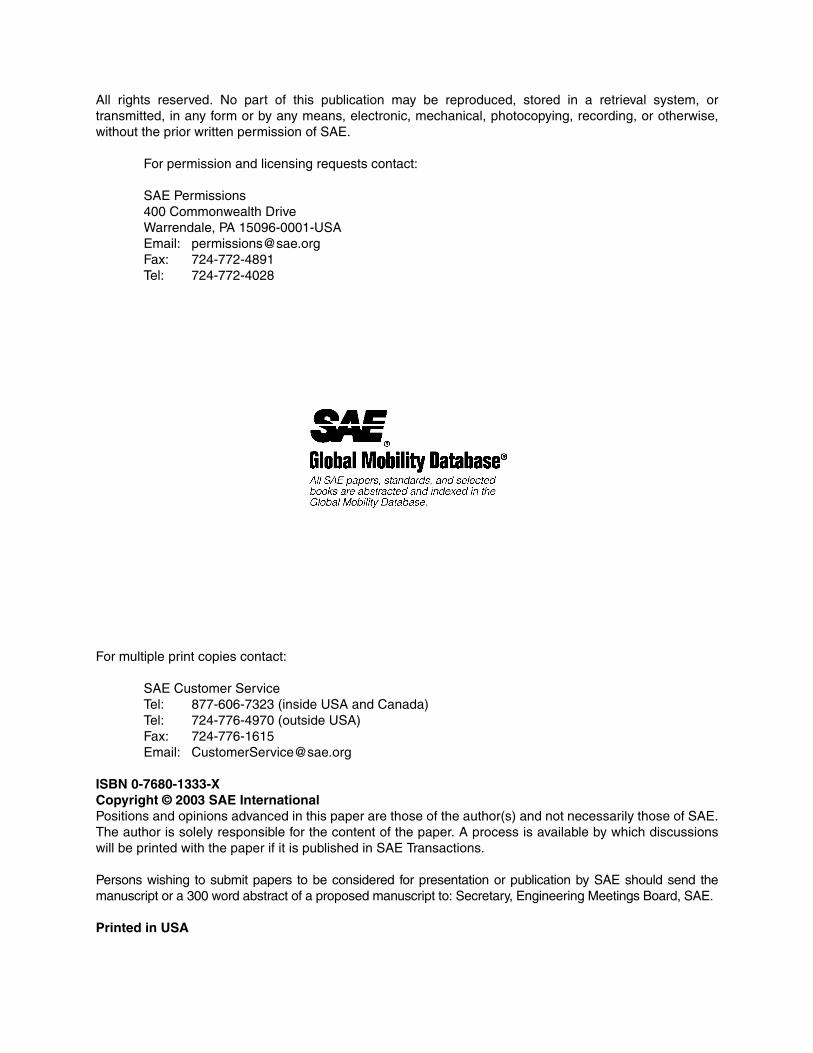
Figure 2. Coefficients appearing in the formula applied for shock absorber characteristics
THE COEFFICIENTS
In figure 2, a typical shock absorber characteristic is shown to illustrate the background of the coefficients in the shock absorber formula. In order to understand the applied formula better we have to transform the shock absorber characteristic into a pressure difference and oil flow relationship. This transformation is done by division of the shock absorber force by the area of the piston and multiplication of the piston velocity with the area of the piston, which is shown in figure 3.
If applicable for the shock absorber type, D is the blow-off factor representing the blow-off point in the shock absorber characteristic. At this point the steepness of the characteristic is changing, which distinguishes the primary from the secondary damping rate. The product BCD represents the damping rate at low piston speeds, which is one of the most important features of a shock absorber characteristic. The coefficient C defines the extent of the sine function, which will be used. A shock absorber characteristic derivative is always positive due to physical functional properties of a shock absorber. Therefore the coefficient C is fixed and smaller than or equal to unity. With C determined by the blow-off point D, only B is left to control the primary damping rate until the blow-off point.
Figure 3. Shock absorber characteristic definition
Now we are able to name the coefficients as follows:
B= rate factor C= shape factor D= blow-off factor E= curvature factor G= secondary rate factor H= progression secondary rate factor K= sharpness factor eps= orifice factor The curvature factor E makes it possible to accomplish a local extra stretch or compression of the curve in such a way that the damping rate and blow-off points remain unaffected. This feature makes it possible to adapt the shock absorber characteristic for tolerances. The coefficient G defines the slope of the curve right from the blow-off point such that the damping rate and blow-off point remain unaffected. This factor makes it possible to describe the valve behaviour after the valve has been opened, which is important to limit the shock absorber forces at piston velocities higher than the blow-off velocity. The progression secondary rate factor H makes it possible to change the shape of the curve right from the blow-off point. The shape can be slightly changed from linear into progressive, which will occur, when the valve is opened to the maximum. When the valve is fully opened, a further increase of the oil flow through the valve would result in a progression of the curve. The sharpness factor defines the transition of the damping rate into the secondary damping rate in the blow-off point. Depending on the value of K the shape can be sharp and smoother. With this coefficient we are able to describe the opening behaviour of the damping valve, which is very important for the performance of the design. The so-called orifice factor eps describes the shape of the shock absorber characteristic at the starting point where the oil flow equals zero, without affecting the damping rate, blow-off point and secondary rate.

Figure 4. Progression secondary rate factor appearing in shock absorber characteristic.
Figure 5. Sharpness factor K appearing in shock absorber characteristic
Figure 6. Orifice factor appearing in shock absorber characteristic
Figure 7. Angle φ of valve seat and thickness h of valve disc in a shock absorber.
.

Figure 8. Comparison measured shock absorber characteristic and fitted characteristic for different setting.
MEASUREMENTS
In order to verify the shock absorber formula, measurements have been carried out on a flow bench. Four different pistons have been measured in total with different settings. A setting consists of a number of discs with varying thickness h that are fixed on the valve seat by the piston rod through the center of the piston. The pre-tension of valve is realized by a small angle φ of the valve seat. See figure 7.
The experiments were conducted on a flow bench, which is specially designed to measure flow-pressure characteristics for hydraulic shock absorbers under steady conditions.
The measurements have been carried out in two directions, an increasing flow and a decreasing flow. This was necessary to neutralize any hystheresis that might occur during the measurements. The maximum flow applied in the measurements was between 300 and 500 cm3/s depending of the setting of the valve. The tests included different angles φ of the valve seat.
FITTING THE MEASURED DATA
A special optimization program has been used for fitting the measured data. For one of the measured dampers, the results are shown in figure 8. The figure shows comparisons between measurements and fitted characteristics for one specific angle φ of the valve seat.
SET BFIT (⋅⋅⋅⋅105) BCALC (⋅⋅⋅⋅105) Differ. (%)0,0625 0,5051 0,4935 +2,290,0791 0,4337 0,4204 +3,060,1250 0,3034 0,2939 +3,190,1875 0,2038 0,2087 -2,400,2500 0,1617 0,1618 -0,060,3125 0,1329 0,1321 +0,600,3750 0,1120 0,1117 +0,260,6250 0,0691 0,0691 -0,070,6400 0,0685 0,0676 +1,310,8000 0,0548 0,0546 +0,361,2500 0,0357 0,0356 +0,281,5625 0,0290 0,0287 +1,03
a1=-2,632⋅⋅⋅⋅10-6 a2=2,233⋅⋅⋅⋅10-4 a4=6,149⋅⋅⋅⋅10-6
BCALC=1/(a1SET2+a2SET+a3)
Table 1. Comparison between calculated and fitted rate factor (B) for different settings of the piston
The result is very satisfactory: the formula is able to describe all the measured characteristics.
INFLUENCE OF THE NUMBER OF VALVES AND THICKNESS OF THE VALVE DISCS.
We can calculate pressures with different settings from the values used in the measurements and we can reduce the total number of quantified coefficients if we include the thickness h and number of valve discs explicitly in the formula. So the coefficients have been written as a function of the setting (SET).
h),f(SET φφφφ==== (3)
SET: A number dependent on the setting of the valve. A setting consists of several valve discs with different thickness, mounted on the shock absorber piston with a valve seat angle φ. The value of SET is depends on the number of valve discs, the thickness of the valve discs and the valve seat angle φ.
The rate factor (B) can be described as a function of the thickness and number of valve discs:
322
1 aSETaSETa1B
++++++++==== (4)
The calculated rate factor and fitted rate factor has been tabulated in table 1. It shows that there is a small difference between both values of B.

SET DFIT (⋅⋅⋅⋅105) DCALC (⋅⋅⋅⋅105) Differ. (%)0,0625 3,001 2,992 +0,300,0791 3,501 3,527 -0,740,1250 5,003 5,009 -0,120,1875 7,003 7,027 -0,340,2500 90,003 90,441 -0,490,3125 11,004 11,060 -0,510,3750 13,004 13,081 -0,590,6250 21,001 21,150 -0,710,6400 21,502 21,631 -0,600,8000 27,002 26,801 +0,741,2500 41,506 41,321 +0,441,5625 51,502 51,414 +0,17
a3=32,277⋅⋅⋅⋅105 a4=0,975⋅⋅⋅⋅105 DCALC=a3SET+a4
Table 2. Comparison between calculated and fitted blow-off factor (D) for different settings of the piston
Like the rate factor B, the blow-off factor (D) can be described as a function of the thickness and number of valve discs too:
43 aSETaD ++++==== (4)
The calculated blow-off factor and fitted blow-off factor have been tabulated in table 1. The results are very good: There is a small difference between both values of D.
The shape factor (C) appears to be practically independent from the setting. We take C=1,0. For the measurements and type of valve we could fix the curvature factor E between 1.0 and 0.0 depending on the tolerances of the geometry of the valve and its seat.
The secondary rate factor (G) can also be described as a function of the setting, but is restricted to only one maximum opening of the valve. If the maximum (possible) opening of the valve is fixed, the secondary rate factor can be written as a function of the setting:
76
a)04.0SET(aG −−−−φφφφ
==== (5)
322
16 bbb
1a++++φφφφ++++φφφφ
==== (6)
322
17 ccc
1a++++φφφφ++++φφφφ
==== (7)
SET GFIT GCALC Differ. (%)0,0625 0,3767 0,3841 -1,960,0791 0,1347 0,1354 -0,510,1250 0,3298 0,3378 -2,420,1875 0,6280 0,6162 +1,870,2500 0,2899 0,2865 +1,170,3125 0,2719 0,2715 +0,140,3750 0,5327 0,5278 +0,910,6250 0,6361 0,6328 +0,510,6400 0,4184 0,4117 +1,600,8000 0,3867 0,3884 -0,431,2500 0,5214 0,5151 +1,201,5625 0,4872 0,4845 +0,55
b1=-7,099⋅⋅⋅⋅10-2 b2=5,348⋅⋅⋅⋅10-1 b3=8,634⋅⋅⋅⋅10-1
c1=-8,66⋅⋅⋅⋅10-2 c2=4,744⋅⋅⋅⋅10-1 c3=0,2685⋅⋅⋅⋅101
a6=1/(b1φφφφ2+b2φφφφ+b3) a7=1/(c1φφφφ2+c2φφφφ+c3)
GCALC=a6(SET/φφφφ-0,04)a7
Table 3. Comparison between calculated and fitted secondary rate factor (G) for different settings of the piston
Figure 9. Coefficient a6 and a7 as function of the valve seat angle φ
The calculated and fitted secondary rate factors are tabulated in table 3. It shows that the results are

satisfactory. The coefficients a6 and a7 are depending on the angle φ of the valve seat, which is shown figure 9.
The relationship between the sharpness factor K and the setting is still a matter of further research.
POSSIBLE EXTENSIONS
The model developed so far addresses a typical damper valve system. Alternative systems exist that are described in literature. It is still a problem is to explain the friction between the valve discs which is expressed in the hystheresis in the characteristic. The model may be extended with this phenomenon, which is not yet fully understood. In the measurements results shown in the present paper hystheresis was eliminated.
CONCLUSION
The formula shows not only to be very precise in describing measured data.
It also includes the ability to characterize typical quantities of the shock absorber such as damping rate, blow-off point and secondary damping rate. It is also possible to calculate the characteristic in conditions, which deviate from those imposed during the actual measurements. Compared with other methods, such as polynomials with coefficients without a physical meaning, this is a great step forward. Because of the physical meaningful coefficients of the representation, it is easy to vary some coefficients of the shock absorber. Simulations can be done with a virtual shock absorber. In this way the performance of the shock absorber can be easily computed and judged.
This mathematical representation is just the beginning of describing the shock absorber. The method can be useful to optimize damper valve and its settings in relation to dynamic behaviour of the vehicle in which the damper is applied. A second useful application could be the reduction of effort in designing the shock absorber during the application engineering, because the setting can be computed in advance. And last, but not least, the importance of an accurate model of the shock absorber in vehicle models can be justified because the shock absorber plays an important role in controlling the vertical and horizontal motions of the vehicle.
ACKNOWLEDGMENTS
The authors would like to thank Mr. H.B. Pacejka for his help developing this new model, especially formula 1 and 2, Mr. Guong Ye, Mr. Henri Medenblik, Mr. Matthias Raulf, Mr. Friedhelm Riemenschneider, Mr. Dietmar Clemens, ZF Sachs AG and Mr. Wang Cheng-guo, Mr. Qian Lixin, China Academy of Railway Sciences for their contribution in this joined project.
REFERENCES
1. E. Bakker, L. Nyborg, H.B. Pacejka: Tyre Modelling for Use in Vehicle Dynamics Studies. SAE paper No. 870421, Feb. 1987.
2. H.B. Pacejka: Tyre and Vehicle Dynamics. Butterworth-Heinemann, Oxford, 2002