a new quantitativeinterpretation oftpd spectra ofa...
TRANSCRIPT

Chern. Anal. (Warsaw), 41, 1057 (1996)
A New Quantitative Interpretation of TPD Spectraof a Heterogeneous Surface Based
on the Statistical Theory of the Rateof Interfacial Transport
by wtadystaw Rudzhiski*, Tadeusz Borowiecki,Anna Dominko and Marla Zientarska
Faculty o/Chemistry UMCS, Pl. Marii Curie-Sklodowskiej3,20-031 Lublin, Poland
Key words: TPD, nickel cat.1Iyst, chemisorption, surface heterogeneity
It is shown that the application of the theory of Activated Adsorption-Desorption leadsto some fundamental difficulties in the theoretical interpretation of TPD spectra froman energetically heterogeneous solid surface. 'nlis has not been realized sufficiently inthe theoretical works published so far. A new theoretical method is proposed in this paperfor a quantitative analysis of surface energetic hl:lcrogeneity from TPD spectra. Themodel is based on the Statistical Theory of the Rail: of Interfacial Transport developedby Ward and Findlay, and is illustrated by a quantitative analysis of hydrogendesorptionspectrum from an alumina supported nickel catalyst.
Wykazano, ze zastosowanie teorii aktywowanej adsorpcji-desorpcji prowadzi do podstawowych trudnosci w teoretycznej interpretacji widm TPD dla energetycznie heterogenicznych powierzchni cial stalych. Dotychczas nie bylo to dostarczaj~co
uwzglttdniane w publikacjach. W artykule zaproponowano now~ teoretyczn~ metodtti1osciowej analizy powierzchniowej heterogenicznosci powierzchni zwidm TPD,opar~
na statystycznej teorii szybkosci transportu mittdzyfazowego zaproponowanej przezWarda i Findlaya, kt6r~zilustrowanona przyktadzie analizy ilosciowej widma desorpcjiwodoru z katalizatora nikJowego na nosniku tlenku glinu.
* Author to whom the correspondence should be addressed.

1058 w: Rudzinski et al.
The Temperature Programmed Desorption (TPD) is nowadays one of the mostpopular and frequently used methods to characterize the energetic properties ofadsorbent and catalyst surfaces. The principles of that method were published byAmenomiya and Cvetanovic in 1963 [1], and 9 years later the first theoretical paperon the application of that experiment to study energetic surface heterogeneity waspublished by Cvetanovic and Amenomiya [2]. The number of the papers reportingon application of this technique started to grow rapidly, and one could quote nowdozens of relevant papers published in this field. As our paper proposes an essentiaHynew theoretical approach to the problem, we referr only to the most exhaustivereviews by Falconer and Schwarz [3], Kreuzer [4], Bhatia et at. [5] and by Cerofolini[6] presenting the approaches which have been used so far in the theoretical interpretation of TPD spe.ctra. Tovbin [7] has reviewed the achievements of Russian scientistsin this field.
The theories of TPD were based commonly on the theory of activated desorption(adsorption). In fact, the TPD technique was used first of all to study the surfaceenergetic heterogeneity of catalysts and adsorbents. The various peaks observed onTPD diagrams were ascribed to various kinds of surface adsorption sites characterized by different activation energies for desorption. In most cases, researchers werehappy with such a qualitative infonnation about the surface energetic heterogeneity.Only few papers reported on more ambitious attempts to draw a quantitative information about surface heterogeneity from the experimental TPD spectra.~---ezHmll'~Jml~~r.-ll1~r8t-evetanovic and AmenOllllya rzr;--carterT~D"""'=a=w=sc=oc=nc--ce=tc--c. a-=lT-.~
[10] and Tokoro et. af. [11] assumed that the surface energetic heterogeneity mani-fests itself as a linear variation (decrease) of the activation energy for desorption withdecreasing surface coverage.
King (12] was the first to assume that the activation energy for desorption maybe more complex function of the surface coverage. Also Tokaro et. at. followed thatassumption in their second work on that problem [13]. An interesting paper in thisfield was published by Knozinger and Ratnasamy [14].
After 1980, some papers concerning that problem were published by Davydovet. af. [15], Unger et. at. [16], Malet et. al. [17], Leary et. at. [18], Ma et. af. [19] andby Salvador and Merchan [20]. Very interesting reports concerning that problem havebeen presented during the "Second International Symposium on Surface Heterogeneity Effects in Adsorption and Catalysis on Solids" held in Zakopane-Levoca(Poland-Slovakia) in autumn 1995 [21].
In spite of an advanced mathematical treatment seen in some of these papers, allof them inherr certain simplifications, or even inconsistencies which are introducedby the use of the theory of activated adsorption-desorption. For instance, on theground of this theory, it was not possible to develop rigorously the Elovich equationfor adsorption kinetics, used so commonly to describe the adsorption kinetics in theactual adsorption systems. Some other fundamental difficulties related to the application of that theory will be discussed in the theoretical section.
A real progress toward a satisfactory description of adsorption (desorption)kinetics was made ten years ago by Ward and Findlay [22]. They have formulated an

New interpretation ofTPD spectra 1059
advanced statistical theory of the rate of interfacial transport, including the transportbetween gas and a solid surface.
Starting from that theory, Rudzinski and Aharoni were able to provide a satisfactory theoretical explanation for many features of adsorption kinetics which could notbe explained in terms of the theory of activated de.(ad)sorption [23]. For instance,they have presented a first fully rigorous derivation of the Elovich equation foradsorption kinetics.
It seems, however, that the fundamental works by Ward and coworkers did notreceive enough attention. It may surprise us, for instance, that in spite of more thanten years which have passed since Ward and coworkers published their works, no onetried to apply their theory to interpret TPD data.
This paper presents a first attempt to provide such an interpretation.
Theory
We start by discussing the fundamental equation for the rate of the interfacialtransport, offered by the Theory of Activated Adsorption (Desorption) (TAAD). Forthe purpose of clarity, we consider first the simplest case when one molecule isadsorbed on one site. Then, according to the TAAD
(1)
where t is time, a is fractional surface coverage,p is pressure inthegas phase,Ea andEd are activation energies for adsorption aild desorption respectively, Ka;Kd areappropriate (slightly temperature dependent) constants. Tand kare absolute temperature and the Boltzmann constant, respectively.
The first term on the r.h.s. of eq. (1) represents the rate of adsorption, and thesecond tenn represents the desorption rate.
At equilibrium (ae/at) =0, and we arrive at Langmuir adsorption isotherm, e(e),
e(e)(p,T) = .Kp exp {E/kT} (2)1 + Kp exp {E/kT}
where K =Ka/Kd, E=(Ed - Ea), and the superscript (e) stands for equilibrium.At low (partial) pressures p, and high coverages a (the conditions which are met
usually in TPD experiments), the first term is expected to be small compared withthe second one. So, to a good approximation, the experimentally observed desorptionrate should be given by
avd _~ aad
_ ~mKda exp {-Ed/kT}at - m at - (3)
where Vm is the maximum adsorbed amount when a=1. Experimentally, the desorption rate is monitored as the concentrationof the desorbed species in the carrier gas,c,so

1060 l¥. Rudzinski et at.
-av--=Fcat
(4)
(Sa)
where F is the volumetric flow rate of that carrier gas.Of course, eq. (3) is valid for a hypothetical homogeneous solid surface with the
same constant desorption energy Ed across the surface. Generally, it was observedthat while applying eq. (3), the estimated Ed values change with surface coverage, so,Ed in eq. (3) was considered to be rather a function of 8, EdCe). The authors trying togeneralize eq. (3) for the case of the actual, energetically heterogeneous solidsurfaces, wrote it in the following form [19]
aet- iii = Kd f e(Ed) exp{-EikT} X(Ed) dEd (5)Q
where X(Ed) is distribution of the number of adsorption sites among various valuesof Ed, normalized to unity, and the subscript "t" in ast/at means the average of aSt/atover the "total" heterogeneous surface. Then
f X(Ed) dEd = 1Q
where Q is the physical domain of Ed.Equation (5) could be treated as an integral equation for X(Ed), provided that the
kerneIB(Ed) is known, and provided that there eXIsts a functIonal relatIonshIp betweenEd and Ea on a heterogeneous solid surface.
The existance of such a relationship is a mystery which, to our knowledge, hasbeen considered in only one theoretical paper [20] by Salvador and Merchan. Onecan even rise the question whether Ea and Ed on various adsorption sites are correlatedat at. What is only sure, is the fact, that Langmuirian kinetics of adsorption [represented by the first term on the r.h.s of eq. (1)] is not found in real adsorption systems.Instead, Elovich, Power Law or other equations for adsorption kinetics must beapplied, and they were reviewed inthe exhaustive article by Law [24]. In terms ofTAAD it means that there must exist a dispersion of Ea values on different adsorptionsites. The concept of the dispersion of the activation energies for adsorption wasaccepted as fundamental by all the authors trying to explain the theoretical origin ofthese empirical equations [25-27]. TPD experiments on the other side reveal adispersion of Ed values on the actual solid surfaces.
So, generally, the correct generalization of eq. (3) should read
aet-at =Kd f f SeEmEd) exp{-Ed/kT } X(Ea,Ed) dEd dEa (6)Q
where X(Ea,Ed) is a two-dimensional adsorption energy distribution. (The differentialdistribution function of the number of adsorption sites among corresponding pairs ofvalues of Ea and Ed.)

New interpretation ofTPDspectra 1061
However, the theoretically correct equation (6) is, in fact, useless, because theTAAD does not provide us with any analytical expression for e(Ea,Ed)' Statisticaltheories of adsorption (at equilibrium) provide one with e as a function of (Ed - Ea).
The interpretation of TPD spectra from a heterogeneous solid surface was basedon an intuitive assumption which was correct to some extent, under certain conditions, as we will see it soon, but had no theoretical background within the frames ofTAAD approach. It seems, that this fact did not receive a suitable attention so far.
That common interpretation was based on the assumption that, at every moment,(at every adsorbed muount), the observed desorption rate can still be described byeq. (3). The value of Ed corresponding to that adsorbed amount was still called"desorption energy" and was given the same physical meaning as for a homogeneoussolid surface characterized by this Ed value. Looking to eq.(6) one can deduce easilythat such an interpretation could be accepted only, if the following two conditionsare fulfilled:
1. There exists a functional relationship between Ed and Ea,
2. The desorption proceeds in an ideally stepwise fashion, in the sequence ofincreasing activation energies for desorption.
The first condition is a mystery as we have mentioned it already, and the secondcondition ca nnot be proved, because TAAD does not offerany expression for e(Ed,Ea),
which could be used to prove the second assumption.So, it is time to realize, that the common interpretation of TPD spectra is
half-intuitive, and that the TAAD approach does not provide a clear justification forthat common interpretation. Below, we are going to show that the application of theStatistical Theory of the Rate of Interfacial Transport provides a partial justificationfor that common intuitive interpretation of TPD spectra and allows for arigorousinterpretation of TPD spectra from a heterogeneous solid surface.
By assuming that the transport between two phases at thermal equilibrium resultsprimarily from single molecular events, the equation for the rate of transport betweengas and a solid phase was developed by Ward and Findlay [22], using a first-orderperturbation analysis of the Schrodinger equation, and the Boltzmann definition ofentropy
ae 'at = Kgs [ exp{(~g - ~S)/kT } - exp{(~S - ~~/kT}) (7)
where ~g and ~s are the chemical potentials of the adsorbate in the gas phase, and inthe adsorbed molecules, respectively. Then, it was emphasized that eq. (7) does notapply at very low, and very high (close to unity) values of e.
Let ~g be the chemical potential of an ideal gas
(8)
and !J.s be the expression corresponding to Langmuir model of adsorption (one-site-occupancy monolayer adsorption with no interactions between the adsorbed molecules). Then

1062 w. Rudzinski et ai.
eJ.ts=kT In---if(1 - e)
(9)
where if is the molecular partition function of the adsorbed molecules. Equation (7)takes then the following form
ae ' 1 - S ,ISat =KaP-e- - Kd p 1- e (10)
where, ',..s s
Ka = Kgs '1. exp{ J.tOIkT}
, KgsKd = exp{!Jt'kT}
if
(11)
(12)
The energetic heterogeneity of the actual solid surfaces is demonstrated mainlyas the variation of the adsorption energy e in the molecular partition function qS[19,20]
if =c/o exp{e/kT}
With this notation eq. (10) takes the form
ae 1 - e 1 e~~~~-a-t -K;1P S -exIT~fkT} .Ka p 1-- e exp{ t:,/k1}
where
, di sK a = Kgs LIQ exp{~kT}
and
KKd =~ exp{-!Jt'kT}
.c/o
(13)
(14)
(15)
(16)
As we mentioned it already, in typical TPD experiments the (partial) pressure ofthe desorbed species, (concentration c in the carrier gas), is usually small, so, thedesorption rate can be well represented by the second term on the r.h.s. of eq. (14).
Although we have already at hand a more general treatment which takes intoaccount a possibility of readsorption, we will neglect it in the present publication forthe purpose of clarity of presentation the main idea of using the Ward's theory. So,we assume that in the case of a homogeneous solid surface having adsorption energy E
as 1 eat = - KdP1 _ e exp{ -e/kT}
Equation (17) can be rewritten to the following fo~n
sf T e as) _ xp exp {e/kT}~P, .' , at. - 1 +xp exp {e/kT}
(17)
(18)

New interpretation ofTPD spectra
where
1 a8X=---
Kd atThe function 8(p, T, ~~ in eq. (18) can be written as follows
exp HE - Ec)/kT}8(E) = 1 ( )
.L + exp { E- Ec;lkT}
where
'c= -kTln(xp) =kTln [~~~]
Figure 1 shows the temperature dependence of the function 8(Ec)
exp {Elt}8(E)------
- 1 + exp {Elt}
1063
(19)
(20)
(21)
(22)
where Er =(E - Ec)/kTo, and 't =T/Toare appropriate dimensionless values.Figure 1 shows also that the kernel 8(E) becomes a step-function in the hypothe
tical low-temperature limit
It means, that at not too high temperatures, the desorption from a heterogeneoussolid surface proceeds in a stepwise-like fashion. This assumption was intuitivelymade in the hitherto interpretation of TPD spectra, but this is the Statistical Theoryof Interfacial Transport which provides now, for the first time, a rigorous proof forthat intuitive common assumption. The step on 8(E,Ec) will appear at E = Ec• Then theobserved "total" desorption rate from the whole heterogeneous surface will begoverned by the "local" rate of desorption from the sites the adsorption energy ofwhich is equal to Ee•
t=l
0.40
0.20
0.00 -m"TTT'1MTT"ITTTT1'Tr'l'"TT1'TTT1I'TT1"'I"TTT...,.,.,..........
- 20.00 -10.00 0.00 10.00 20.00€r. kJ mol-1
Figure 1. The temperature dependence of the functioll H(£,9c)

1064 W Rudzinski et al.
The observed "total" rate of desorption (as/at) will be proportional to that localdesorption rate on the sites where E =Ec, and to the fraction of these sites on thesurface. Thus
(24)
(26a)
where
exp {(E - Ec)/k1)St =f 1 + exp{(E _ E
c)/k1} X(E) dE (25)
Q
While expressing (as/at) in eq. (21) by (aSt/at) defined in eq. (24), we obtain
Ee = -kTlil [l X(:e) (aa~tJ (26)
where Kd =const Kd' Alternatively, eq. (26) can be rewritten to the following form
aSt -Kd {-E }-=-X(E )exp _Cat p C kT
The above equation is to be compared with the equation
aSt _ K S {-Ed(St)} (26b)at - - d t exp kT
which is commonly used to analyze TPD spectra from heterogeneous solid surfaces.(We consider for the moment the simplest case of one site-occupancy adsorption.)Although it is usually not said explicitly, or perhaps even not realized sometimes, theinterpretation of TPD spectra based on eq. (26b) is based on the assumption of anideally stepwise character of the desorption process.
For our further purposes, we will rewrite eq. (26)"in the following form
X(Ee) = exp {EJkT} [l aa~t] (27)
In the limit T -- 0 the kernel SeE) in eq. (25) becomes the step function (23), so,St takes the following simple fonn.
00
(28)
where
(28a)
The function Xc{Ec) calculated from the relation

New interpretation ofTPD spectra 1065
(29)
is usually called the "Condensation Approximation" for the actual adsorption energydistribution X(E). It becomes the exact function X(E), and is defined as follows:
00
x.:(ed =£U:) x(e)de (30)
In the limit T - 0 the derivative as/aE becomes the Dirac delta function ()(E-Ec),and Xc(Ec) becomes the exact function X(E).
One of the common approximations used in the theoretical description of adsorption equilibria on heterogeneous solid surfaces is to replace the true kernel in eq. (25)by the step function 8C(€,Ec) [28--30]. The essential condition for this approximation,to be applicable, is not solely the condition T - 0 but the condition «()o/()x) < 1, where()o is the variance of the derivative cae/aE), and ()x is the variance ofX(E). Thus, to acertain degree of accuracy the function Xc(Ec), talculated in eq. (29) can be comparedwiththe function X(£c) calculated in eq. (27). In the limit T - 0 or in the limit of avery heterogeneous solid surface, they will become equal. Then, from the comparisonof eq. (29) and (27) we obtain
___-a~"Vi-a=~-.:=·c-·)~-----e-f=-+=-~:;=-~=--+--GAl1-+-;;;-=~+---At every temperature T, the still existing adsorbed amount V(1), is found from
the relation
where Bis the heating rate
T
V(1)= Vo-~ f c(T)dTTo
B= dTdt
(32)
(313)
In a typical TPD experiments p is a constant.Also, at any temperature T, the corresponding value of Ec can be calculated from
the desorption rate, if the value Kd and Ec(1) are known.The preparatory steps to calculate Xc(Ec) are the following:1. To eliminate the noise in the experimental TPD curve, which would be
multiplied in the subsequent differentiations, the TPD spectrum is approximated bya sum of gaussian-like functions:
(33)
where
1066 lY. Rudzinski et at.
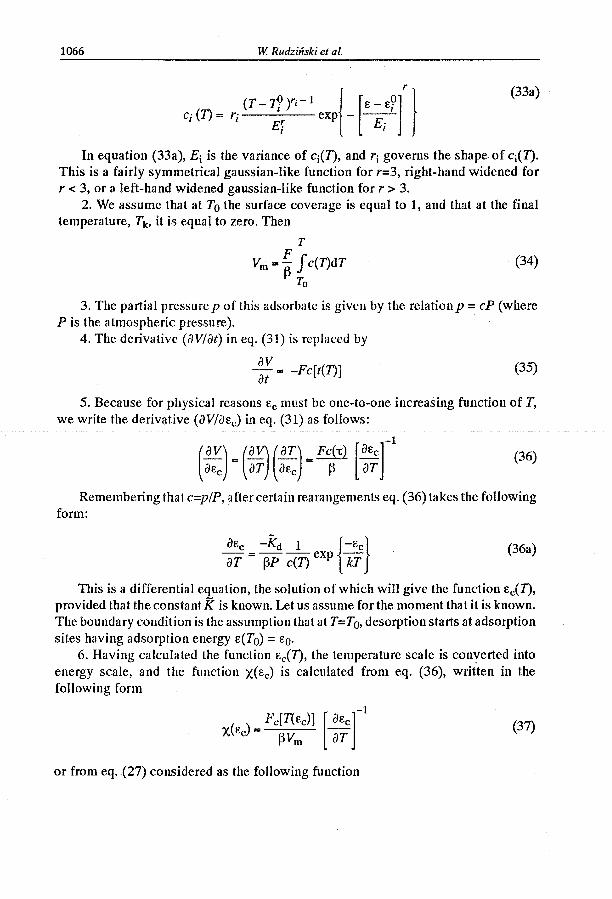
(33a)
In ~quation (33a), Ej is the variance of Cj(1), and rj governs the shape of Cj(1).This is a fairly symmetrical gaussian-like function for r=3, right-hand widened forr < 3, or a left-hand widened gaussian-like function for r > 3.
2. We assume that at To the surface coverage is equal to 1, and that at the finaltemperature, Tk , it is equal to zero. Then
T
Vm = F f c(T)dTPTo
(34)
3. The partial pressure p of this adsorbate is given by the relation p =eP (whereP is the atmospheric pressure).
4. The derivative (av/at) in eq. (31) is replaced by
av---at = -Fe[t(T)] (35)
5. Because for physical reasons Ec must be one-to-one increasing function of T,we write the derivative (aV/aEc) in eq. (31) as follows:
(av) =(a~ (aT) = Fc{-t) [
aEcj-laEc aT) aEc p aT
(36)
Remembering that c=p/P, after certain rearangements eq. (36) takes the followingform:
aEC -Kd 1 {-Ec} (36a)aT = PP e(T) exp kT
This is a differential equation, the solution of which will give the function Ec(1),provided that the constant K is known. Let us assume for the moment that it is known.The boundary condition is the assumption that at T=To,desorption starts at adsorptionsites having adsorption energy E(To) =EO.
6. Having calculated the function Ec(1), the temperature scale is converted intoenergy scale, and the function X(Ec) is calculated from eq. (36), written in thefollowing form
(37)
or from eq. (27) considered as the following function

New interpretation ofTPDspectra
_ [ c2
(T(Ec»FP] {~}X(Ec) - -K Vm exp kT
1067
(38)
While considering the limit T ~O we had the purpose in mind to illustrate in aneasy way the basic features of our new theoretical approach. In the actual TPDexperiments, e(T) is measured at finite temperatures. So, let us consider now this realphysical situation.
Equation (36) does not change, as it is valid for any temperature. Changes willappear in eq. (26) which was obtained by inserting eq. (24) into eq. (21). To find therelation between the "local" rate of desorption, (aS/at), and the "total" rate, (aSt/at),at finite temperatures, we consider the following obvious relation
00
~;l = 13 :il = 13 £(:i) X(E)dE
Then, we repl3ce (aS/aT) under the integral by the following product
::_(:~) (:~c) __ (::) (:~c)where
(39)
(40)
(::c) = [:~:~:!':ir-(::) (41)
Because (aEc/aT) is not a function of E, the r.h.s. of eq. (39) can be rewritten tothe following fonn
(42)
(43)
,where the function Xc(Ee) is the same "condensation" function as that on the l.h.s. ofeq. (29). Now let us consider the "local" rate of desorption on the sites the adsorptionenergy of which is equal Ce, (as/at)f.=f.e
(as) (as) (as) (aEC)at E
e= B aT E
e= BaEc E ar
e
Because, according to eq. (41)
U:c) = ~~ and (as) _ -1L(aCC)
at E
e- - 4kT aT (44)
we replace now (ace/aT) in eq. (44) by its value calculated from equations (39) and(42)

1068 lv. Rudzinski et al.
(45)
(46)
Equation (44) takes then the following form
(ast)
(as) 1 \ atiii Ec = 4kT Xc(Ec)
In the limit T - 0 the fully accurate expression (46) reduces to the approximateexpression (24) used previously by us. It means that the value of const in eq. (24) issimply 4kT. We should remember that for E =Ec the expression (17) reduces to theexpression (21) because S(E =Ec) =1. It means, that at finite temperatures eq. (37) isstill valid, but the function X(E) calculated next from eq. (27), (29) and from (37) hasthe fully rigorous meaning of the "Condensation Approximation" Xc(Ec), for the trueadsorption energy distribution X(E).
Having calculated Xc{Ec) one can easily calculate X{Ec) using the methods developed by Rudzinski and Jagiello [31-34]. In many cases sufficiently accuratevalues of X{Ec) are obt;lined by using the Rudzinski-Jagiello approach
~---- ....... -----x<€~XJEJ+:(k7)21~:E~ct--~147) -------~
Eq. (47) is valid for the Langmuiric model of the "local" adsorption, assumedhere by us. Rudzinski et of. showed that the inclusion of interactions between theadsorbed molecules leads to more complicated expressions in calculation of X(EC),from Xc(Ec), the latter function being always the key information about surfaceenergetic heterogeneity [32,35].
Their considerations were based on the assumption, that lateral interactionsparameters for a molecule adsorbed on cerblin adsorption site does not depend on theadsorption energy of that site. Such an assumption seems to be fairly reasonable inthe case of one-modal adsorption energy distributions. However, the actual TPDspectra from many solid surfaces are multimodal. They look like a number of moreor less overlapping peaks, corresponding to various groups of sites existing on thestudied solid surface. Thus, in many cases a certain generalization of the methoddeveloped by Rudzinski et al. will be necessary, to account properly for the interactions between adsorbed molecules.
A first necessary step toward such generalization, will be "decomposition" of thecalculated condensation function Xc(cc) into overlapping one-modal distributionscorresponding to a certain kind of adsorption sites.
In the present treatment we neglect diffusional effects, which may be responsiblefor some broadening of these overlapping peaks compared to their true shape givenby the function {as/ac)Cj. Diffusional effects are, however, usually neglected in thepublished analyzes of TPD spectra from heterogeneous surfaces. This reflects the

New interpretation ofTPD spectra 1069
general belief that this is the energetic surface heterogeneity which predominantlygoverns the shape of a TPD diagram.
A decomposition of the condensation function Xc(Ec) was done by Cases and\linebreak coworkers [36] for a number of adsorption systems. It appeared then thatsuch decomposition can be successfully done only for some systems, and fails as ageneral decomposition method.
Later, these authors came to a conclusion that the general physical situation willbe following. If even one may distinguish, on a given surface, a number of distinctkinds of adsorption sites (or surface domains), there will still exist a certain distribution of surface properties (adsorption energies) within e.ach group. Therefore, oneshould consider the following representation for an actual adsorption energy distribution X(E)
n
X(E) = L ytXi(E),i=l
n
LYi= 1i=l
(48)
where Xi(E) is the adsorption energy distribution for i-th kind of adsorption sites.The condensation function Xc(E) calculated from a TPD diagram will then have
the form
(49)
where 8j(E) is the isotherm equation for adsorption on the i-th kind of adsorption sites.Even, if it is still the Langmuir-like function (18), it may have a different value ofthe constant Kd, compared with other kinds of adsorption sites.
In their improved decomposition (DIS) method [37] Cases et. al. used thefollowing DA functions to represent Xci(E)
r,{E - E?)n - 1 {[E _E?]r }Xci(E) = E': exp - T,
(50)
(51)
Although diffusional effects are commonly neglected, they can also be taken intoaccount. Huang and Schwarz [38] showed that in the absence of intraparticle diffusion the more accurate description of the mass transfer effect on TPD spectra requiresconsidering a nonsteady mass balance which includes both axial dispersion andconvective transport. The equations that describe the concentration in the bulk fluid,C, and on the surface St, are given by
aC = D a2c _ l~ _ 1 - pay avat e az2 az p at
where De is an effective diffusion coefficient (m2 s-l), u is a temperature dependentconstant, p is the porosity (cm3/cm3), and V =VmSt• Equation (53) is subjected to theboundary conditions

1070
and the initial conditions
~ Rudzinski et aJ.
del - 0dZ z-Lo-
c(Z, 0) = 8t(z, 0)= 0
(52)
(53)
(54)
It is known, that in addition to diffusional effects outside the solid phase, TPDspectra may be affected by the intraparticle diffusion and lateral interactions betweenthe adsorbed molecules. It is suspected that the two effects mentioned above may besource of some extra peaks on TPD diagrams.
EXPERIMENTAL RESULTS AND DISCUSSION
We are planning a variety of TPD experiments, and some of them are alreadybeen carried out. They will be reported in our furthcoming publications. The purposeof the present, first publication, is to demonstrate the applicability of our newtheoretical approach for a quantitative study of surface energetic heterogeneity from
-~~-TPD spectra. For that reason, and for the Inmteovolume onne publIcaTIon, we Wlrr-------
limit here ourselves to demonstrate applicability of our new approach by analyzingone TPD diagram of hydrogen desorbed from alumina-supported nickel catalysts.After presenting the fundamentals in the present first publication, our next publica-tions will report on application of our new approach to a variety of chemisorptionsystems.
Temperature Programmed Desorption measurements were conducted with anAMI1 equipment (Altamira Instruments). A thermal conductivity detector was usedas a detector.
Experimen"ts were conducted with an alumina-supported nickel catalyst (15% Ni)obtained by impregnation of a-A1203 INS Pulawy (surface area 3.3 m2g-l) by nickelnitrate solution. The catalyst made in this way was calcinated at 400°C and reducedright before the experiment. Hydrogen was purified onOXICLEAR deoxidant madeby PIERCE CHEMICAL Co., and passed through activated carbon absorber used asa reducing agent.
The carrier gas was argon (99.99% pure) additionally purified over the sameOXICLEAR deoxidant, and then with molecular sieves 4A and 5A, and with MnO/y-AI20 3•
The experimental procedure was as follows: At first, a sample of 0.5 g catalystwas heated to 700°C with 25 K min-1 heating rate in the stream of inert gas flowingat a rate of 30 cm3 min-I. After obtaining the desired temperature, argon was replacedwith hydrogen. The reduction process lasted 3 hours. Then, the sample was cooledin the hydrogen stream to 25°C. Next, hydrogen was replaced with argon for 20 minutes.

New interpretation ofTPDspectra 1071
After that, the temperature programmed desorption was carried out at a heating rateof 20 K min-I.
Figure 2 shows the decomposition of the TPD diagram for hydrogen desorptionfrom the alumina-supported nickel catalyst, done by using a linear combination [eq. (33)]of five functions Ci(1) defined.in eq. (33a). The parameters found by computer fittingin the course of that decomposition are collected in Table 1.
80.00
2000.000
20.00
~.!i. 80.00?:i•:s 40.00
400 800 8001,°C
____.e.-FI--<2·gure 2. The decomposition of the experimental TPD diagram C=) by the linear combination (33) ofthe function (33a) (- - - - ), done by using the parameters collected in Table 1. The values 1,2,3, 4, 5 at the maxima of the composite functions Ci(1) denote the value of the index i, in eq.(33) and in Table 1
Tuble 1. The parameters found by computer fitting in the course of the decomposition defined in eqs. (33)and (33a) of the TPD diagram of hydrogen desorbed from the alumina supported nickel catalyst
No eli n t!,oC Ei,deg
;=1 10604 2.22 35.56 127.15
;=2 1405 2.32 278.67 107.49
;=3 2139 2.71 141.00 88.04
;=4 2004 2.71 218.50 84.47
;=5 1154 1.90 384.51 213.93
Figure 3 shows the function Ec(T) calculated by solving the differential equation(37) for three values of the parameter Kd' the temperature dependence of which wasneglected. The choice of the parameters Kd in our model calculation was dictated bythe obvious requirement that the Ecvalues should lie in a physically reasonable range.We are facing here a situation, which is similar to that in the papers reporting on thecalculation of X(E) from the equilibrium adsorption isotherms. There, the calculationof X(E) requires the knowledge of the Langmuir constant. Changing the assumedvalues of Kd resulted there primarily in shifting the calculated function X(E) on theenergy scale toward higher or smaller values of E. In the case of X(E) calculated here

1072 W Rudziriski et al.
from TPD spectra, changing the assumed value of results both in shiftin ~ ( e ) on the energy scale, and in a simultaneous broadening of ~ ( e ) , as it is shown in Figure 4.
Figure 3. The functions F , . . calculated from eq. Figure 4. The condensation functions xdeC) calcu- (37) by assuming efl(To) = 0, for three values of lated from eq. (37) with the functions (OeJaT) = the parameter I$ Kd ; the curve 1 is obtained by Rec), found by numerical differentiation of the assuming that Kd = los, the curve 2 is for /id = functions eC(?) presented in Fig. 3. The numbers lo4, and the curve 3 corresponds to Kd = lo3 1,2,3 correspond to the same values of the pa-
rameter Kd as in Figure 3 *
A similar effect, on the calculated function ~ ( e ) , has the choice of the parameter EO = &(To). Figure 5 shows the solution of the differential equation (37) for three values of EO, and Figure 6 shows the corresponding calculated functions x(E).
Figure 5. The functions ~ ~ ( 7 ' ) calculated from eq. (37) by assuming that & = lo4, for three values of the parameter EQ, 0 (the curve I), 5 kJ m o l l (the curve 2) and 10 kJ m o l l (the curve 3)
While thinking about a possibility of determining the parameters & in an independent way, one might eventually consider independent calorimetric xneasure- ment. Calorimetric studies of adsorption equilibria show that the main contribution

New interpretation of TPD spectra 1073
to the isosteric heat of adsortpion q̂ comes from energies of adsorption. That possibility deserves obviously further theoretical studies.
G, k~ mol-1
Figure 6. The condensation functions xc(sJ, calculated from eq. (37) by assuming that zd = lo4, for three values of the parameter € The numbers 1, 2, 3 correspond to the same values of the pa-rameter ₠a s those in Figure 5
Table 2 collects the parameters yi, ri, $ f o u n d by computer fitting, while decomposing the function xc(ec) calculated by assuming &(To) = 0, and = lo4. Figure 7 shows this condensation function along with its composite functions xc^&). Table 2. The parameters found by computer fitting, while decomposing the function u,.) calculated by
assumi ng €(T = 0, and Rd = lo4
Figure 7. The cJecomposition of the condensation function X ~ E ~ ) , calculated by assuming that e(To)=O, and Kd = lo4. The broken lines are the composite functions yixcOc)

1074 lY. Rudzinski et al.
REFERENCES
1. Amenomiya Y and Cvetanovic R.J., J. Phys. Chem., 67, 144 (1963).2. Cvetanovic R.J. and Amenomiya Y, Catal. Rel~ Sci. Eng., 6, 21 (1972).3. Falconer J. L and Schwarz J.A, Catal. Rev. Sci. Eng., 25,141 (1983).4. Kreuzer RJ., Langmuir, 8, 774 (1992).5. Bhatia S., Beltramini N. and Do D.O., Catal. Today, 8, 309 (1990).6. Cerofolini G., Langmuir (in press).7. Tovbin Yu., in Equilibria and Dynamics ofGas Adsorption on Heterogeneous Solid Surfaces {Rudzi6ski
W., Steele W.A. and Zgrablish G., Eds.), Elsevier (in press).8. Czanderna A.W., Biegen J.R. and Kollen W.,J. Colloid Interface Sci., 34, 406 (1970).9. Carter G., Vacuum, 12, 245 (1962).
10. Dawson D.T. and Peng Y.K, Surface Sci., 33,565 (1972).11. Tokoro Y, Misol1o M., Uchijima 1: and Yoneda Y.,Bull. Chem. Soc. Japan, 51, 85 (1978).12. King D.A., Surface Sci., 47, 384 (1975).13. Tokoro Y., Uchijima 1: and Yoneda Y.,J. Catal., 56,110 (1979).14. Knozinger H. and Ratnasanmy P., Catal R(..~ Sci. Eng., 17,31 (1978).15. Davydov V:Ya., Kiselev A.V:,Kiselev S.A, Polotryuk V:O.V:,J. Coli. Interface Sci., 74, 378 (1980).16. Unger KK, Kittelman U.R.. and Kreis W.K,J.Chem. Techn. Biotechnol., 31,435 (1981).17. Malet P. and Munuera G., in Adsorption at the Gas-Solid and Liquid-Solid Interface (Rouquerol J. and
Sing KS.W., Ed..), p.383, Elsevier, Amsterdam 1982.18. Leary'K.J., Michaels J.N. and St.1CY AM.,AIChEJ., 34, 263 (1988).19. Ma M.C., Brown 1:c. and Haynes B.S.,Surf. Sci., 297, 312 (1993).20. Salvador E and Merchan D., React. Kinet. Catal. Lett., 52, 211 (1994).21. Proceedings of the Second International Symposium on Surface Heterogeneity Effects in Adsorption
and Catalysis on Solids, Z1kopane-LevoCa, Poland-Slovakia, held in autumn 1995 (Brunovska A,Rudzinski W. and Wojciechowski B.W., Eds.).
-----'£22AVard-e.A-,-Fi-ndta-y-R-;f}.-a-nd-Rizk-M~;f.--C-Jrenr.PJzys:;_76,s_6-24-(1982r~~~-~~---------~~
23. Rudziriski W. and Aharoni c., Pol. J. Chem., 69, 1066 (1995).24. Low MJ.D., Chem. Rev., 60, 267 (1960).25.Alharoni C. and Ungarish M.,J.C.S. Faraday Trans, I, 73,1943 (1977); 74,1507 (1978).26. Aharoni C. and SUZill Y.,J.C.S. Faraday Trans. I, 78, 2329 (1982).27. Cerofolini G., in Adsorption and Chemisorption on Inorganic Sorbent.. (D<\browski A. and Tertych VaA.,
Eds.), Elsevier, Amsterdam 1996.28. Roginsky S. and Todes O.,Acta Phisicochim. USSR, 21, 519 (1946).29. Harris LB., Surface Sci., 10, 129 (1968); 13,377 (1968); 15,182 (1969).30. Cerefolini G.E, Surface Sci., 24, 391 (1971).31. Rudziti..ki W. and Jagiello J.,J. Low Temp. Phys., 45, 1 (1981).32. Rudzinski W. and Jagiello J.,J. Low Temp. Phys., 45, 1 (1981).33. Jagiello J., Linger G. and Papirer E.,J. Colloid Interface Sci., 137,128 (1990).34. Jagiello J. and Schwarz J.A.,J. Colloid Interface Sci., 146,415 (1991).35. Rudzinski W. and Everett D.H., Ad'iorption of Gases on Heterogeneous Surfaces, Academic Press,
London 1992.36. Villeras E, Cases J.M., Francois M., Miehot L.J. and 1110mas E, Langmuir, 8, 1789 (1992).37. Villeras E, Michot L.J., Cases J.M., Francois M. and Rudzinski W., Langmuir, in press.38. Huang Y.l. and Shwarz J.A, J. Catal., 99, 149 (1986).39. TalbotJ., Jin X. and Wang N.-H.L, Langmuir, 10, 663 (1994).
Received February 1996Accepted May 1996