a new method to determine trabecular bone elastic … new method to determine trabecular bone...
TRANSCRIPT

A new method to determine trabecular bone elasticproperties and loading using micromechanical finite-element modelsvan Rietbergen, B.; Weinans, H.; Huiskes, H.W.J.; Odgaard, A.
Published in:Journal of Biomechanics
DOI:10.1016/0021-9290(95)80008-510.1016/0021-9290(94)E0047-7
Published: 01/01/1995
Document VersionPublisher’s PDF, also known as Version of Record (includes final page, issue and volume numbers)
Please check the document version of this publication:
• A submitted manuscript is the author's version of the article upon submission and before peer-review. There can be important differencesbetween the submitted version and the official published version of record. People interested in the research are advised to contact theauthor for the final version of the publication, or visit the DOI to the publisher's website.• The final author version and the galley proof are versions of the publication after peer review.• The final published version features the final layout of the paper including the volume, issue and page numbers.
Link to publication
Citation for published version (APA):Rietbergen, van, B., Weinans, H., Huiskes, H. W. J., & Odgaard, A. (1995). A new method to determinetrabecular bone elastic properties and loading using micromechanical finite-element models. Journal ofBiomechanics, 28(1), 69-81. DOI: 10.1016/0021-9290(95)80008-5, 10.1016/0021-9290(94)E0047-7
General rightsCopyright and moral rights for the publications made accessible in the public portal are retained by the authors and/or other copyright ownersand it is a condition of accessing publications that users recognise and abide by the legal requirements associated with these rights.
• Users may download and print one copy of any publication from the public portal for the purpose of private study or research. • You may not further distribute the material or use it for any profit-making activity or commercial gain • You may freely distribute the URL identifying the publication in the public portal ?
Take down policyIf you believe that this document breaches copyright please contact us providing details, and we will remove access to the work immediatelyand investigate your claim.
Download date: 16. Jun. 2018
Pergamon
0021-9290(94) E0047-7
J. Biomechanics, Vol. 28, No. 1, pp. 69-81, 1995. Elsevier Science Ltd
Printed in Great Britain. 0021-9290/95 $7.00+.00
A NEW METHOD TO DETERMINE TRABECULAR BONE ELASTIC PROPERTIES AND LOADING USING
MICROMECHANICAL FINITE-ELEMENT MODELS
B. van Rietbergen,* H. Weinans,* R. Huiskes* and A. Odgaardt
*Biomechanics Section, Institute of Orthopaedics, University of Nijmegen, The Netherlands; and ~'Biomechanics Laboratory, Orthopaedic Hospital, University of Aarhus, Denmark
Abstract--The apparent mechanical behavior of trabecular bone depends on properties at the tissue or trabecular level. Many investigators have attempted to determine trabecular tissue properties and loading. However, accuracy and applicability of all methods reported are limited. The small size of the trabeculae and a possible size effect are complicating factors when using traditional testing methods on single trabeculae. Other methods reported, using models that describe the trabecular structure, are of limited value because they consider bone as a repetitive structure in order to describe a reasonably large region of bone.
The present study introduces a new finite-element method strategy that enables analysis of reasonably large regions of trabecular bone in full detail. The method uses three-dimensional serial reconstruction techniques to construct a large-scale FE model, by directly converting voxels to elements. A 5 mm cube of trabecular bone was modeled in this way, resulting in a FE model that consists of 296,679 elements. Special strategies were developed to solve the set of equations that results from the FE approach.
Using this model in combination with experimental apparent data taken from the literature, the upper and lower boundaries for the tissue modulus were calculated to be 10.1 and 2.23 GPa, respectively. From the local stress and strain distributions it was concluded that the deformation mode of the trabeculae in the present cube was predominantly in bending. It was concluded that the method developed offers new perspectives for the study of trabecular bone.
INTRODUCTION
Trabecular bone distributes load from articular surfa- ces to cortical bone through its bone matrix. The trabeculae in this matrix constitute the actual load- carrying construction. The material properties of the trabeculae, in combination with their architecture, determine the strength and stiffness of trabecular bone Under loading, these properties determine the strains at microstructural levels that are believed to regulate the biological adaptive processes in trabecu- lar bone (Frost, 1987; Martin and Burr, 1989). In spite of their importance, little is known about the micro- structural properties and loading of the individual trabeculae.
Several attempts have been described in the litera- ture to determine the trabecular tissue material prop- erties. In these studies a wide range of possible values was reported, with many studies suggesting that the actual tissue modulus is much less than generally accepted for cortical bone (16-20 GPa). Methods re- ported include traditional tensile and bending tests applied to single trabeculae or similar sized speci- mens. Ryan and Williams (1989) used tensile testing experiments on single trabeculae, and found a tra-
Received in final form 14 February 1994. Corresponding address: Rik Huiskes, Biomechanics Sec-
tion, Institute of Orthopaedics, University of Nijmegen, P.O. Box 9101, 6500 HB Nijmegen, The Netherlands.
69
becular tissue modulus of 0.4-3.6 GPa. Other studies, using three or four point bending experiments, have resulted in tissue values of 3.81-5.72 GPa (Choi and Goldstein, 1992; Choi et al., 1990; Kuhn et al., 1989). Recently, Rho et al. (1993) determined the Young's tissue modulus of single trabeculae, using microtensile testing and ultrasonic techniques, finding a tissue modulus of 10.4-14.8 GPa. An indirect way to deter- mine the tissue properties uses a numerical or analyti- cal model representing a typical piece of trabecular bone, in combination with apparent experimental data. These models can also be used to determine the stresses and strains in the trabeculae. Williams and Lewis (1982) used a two-dimensional FE model of a trabecular cross-section in combination with experi- mental results. They found a trabecular tissue modulus of 1.3 GPa. In later studies, three-dimen- sional models were used to model the trabecular structure. Gibson (1985) considered trabecular bone as a cellular material, and used different analytical cell models to represent the trabecular architecture. She found that cancellous bone develops four types of structures, dependent on its density. Beaupr6 and Hayes (1985) also modeled trabecular bone as a re- petitive cellular structure. They used a three-dimen- sional FE model of the cellular structure to calculate the apparent stiffness and the tissue stress and strain distribution. Recently, Hollister et al. (1991) introduc- ed homogenization theory in combination with the FEM for modeling large regions of trabecular bone in

70 B. van Rietbergen e t al.
detail. This theory assumes trabecular bone to be a structure of unit cells, each having the same micro- structural morphology. The unit cells can either be simplified, regular structures (Hollister et al., 1991), or represent the detail of trabecular morphology (Hollis- ter and Kikuchi, 1992). The accuracy and applicabil- ity of all methods reported is limited. Methods using single trabeculae or similar sized machined specimens suffer from size effects or irregularities due to the cutting of the specimens. Also, these methods cannot be used to determine in situ tissue stresses and strains. The accuracy of methods that use a trabecular bone model depends on their capability to describe a realis- tic trabecular architecture. Two-dimensional models can only represent realistic bone morphology in those rare cases that trabecular bone has a cylindrical struc- ture of constant cross-section. All three-dimensional microstructural models mentioned above assume tra- becular bone to be built of identical unit cells. How- ever, it is clear that such a repetitive structure is very rare for trabecular bone.
A more accurate way for determining tissue stresses and strains in a specific piece of trabecular bone can be obtained if the structure of a large region of bone can be modeled in detail. Two methods are presently available to measure and represent the trabecular structure on a microlevel. One is a nondestructive method, using micro-CT-scanning, with a typical voxel size of 50/zm (Feldkamp et al., 1989). The other technique for routine three-dimensional reconstruc- tion involves automated serial sectioning, which can provide a resolution of about 1/1000 of the specimen size, i.e. 10/~m for a 10 mm specimen. Hollister and Kikuchi (1992), Hollister et al. (1992), Fyhrie et al. (1992), Edidin et al. (1993) and Fyhrie and Hamid (1993) have used voxel data sets to construct detailed FE models of small pieces (up to 2.3 mm cubes) of trabecular bone. Until recently, however, efforts to represent a substantial piece of bone in a FE model, for example the size of mechanical test specimen, have failed due to restrictions in computer memory and CPU time. In order to relate local strains in bone to those on the apparent level, a bone specimen must be large enough to allow for a sensible definition of apparent (continuous) properties. Harrigan et al. (1988) have shown that this condition is met for speci- mens that span at least five intertrabecular lengths.
In the present study a newly developed FE strategy is introduced which does enable such a full, realistic three-dimensional analysis. The purpose of the pres- ent study was twofold. First, to demonstrate how this strategy can be used to determine the tissue modulus as a function of the apparent modulus by simulating a compressive test, similar to those reported fre- quently in the literature. Second, to compare local trabecular stresses and strains and other quantities, to those on the apparent level. The same full three-di- mensional FEM model of a trabecular cube was used in both cases, with different boundary conditions, and the newly developed FE solution strategy was ap- plied.
METHODS
A 7 x 7 x 7 mm trabecular bone cube was sectioned out of a proximal human tibia. The three-dimensional microstructure of this cube was obtained by digitizing 176 slices, using a resolution of 176x248pixels (Odgaard et al., 1990). A three-dimensional recon- struction of this bone cube is shown in Fig. 1. The rectangular voxels in the digitized cross-sections were converted to equally sized eight-node brick elements using a three-dimensional FE preprocessor developed in our laboratory. To eliminate rough boundaries and to reduce the data set, only 128 x 128 x 128 voxels taken from the center of the reconstruction were used to construct the FE model, representing a 5.15 x 3.64 x 5.12 mm cube. The connectivity of the resulting
element mesh was checked for elements not connected to the main structure, also using a special-purpose program. All elements in the model are rectangular and equally sized: 40.26 x 28.44 x 40/zm in the x-, y- and z-directions, respectively. The cube has 128 voxels at each side (Fig. 2), and hence (128) 3 voxels in total, of which 296,679 represent bone. Accordingly, the vol- ume fraction of the bone equals V~ = 296,679/(128) a = 0.14. The total number of degrees of freedom equals 1,381,602.
A special-purpose FE code was developed to solve the set of equations that results from the finite-ele- ment approach: Ku=f , with K the global stiffness matrix, u the displacement vector, and f the external forces. The conjugate gradient iterative solving tech- nique, with diagonal scaling as a preconditioner (Hughes et al., 1987; Strang, 1986), was used to calcu- late the unknown displacement vector u. Each iter- ation requires a multiplication of the global stiffness matrix K with a direction-vector p. The memory re- quired to solve this problem was reduced by three separate strategies. First, the entire global stiffness matrix is never actually computed. Instead, an ele- ment by element (EBE) approach (Hughes et al., 1987) is applied which allows for the multiplication at ele- ment level Kp=~Kepe, where Ke is the element stiff- ness matrix (order 24) and p~ the decomposed vector p. Second, because all elements are identical in size and have the same orientation, the global structure can be described by the element connectivity alone. Hence, no nodal coordinate data have to be stored. Finally, all elements have identical material properties which allows for an identical element stiffness matrix K, for all elements. This reduction even applies when each element would have a different Young's modulus, because the isotropic element stiffness matrix is a linear function of this modulus. Compared to traditional EBE solving techniques which must store all element stiffness matrices, the required core size is drastically reduced as only one element stiffness matrix has to be stored. This can be demonstrated for the present model, where instead of 296,679 element stiffness matrices, now one element stiffness matrix has to be stored, or a reduction in memory require- ments by 99.99966%.

Fig. 1. The 7 x 7 x 7 nun three-dimensional reconstruction of the bone cube taken from the proximal human tibia plateau. A 5.15 x 3.64 x 5.12 nun part of it represents the FE mesh as well, since each voxel is
represented by a brick element in the FE model, which has 296,679 elements in total.
~--hx--~l t
~--128 ~ [~---~x voxels Fig. 2. Definition of the dimensions of the cube.
71

22
Fig. 4. Detail of the FE model, showing the element size relative to the trabecular size.
72

> 5 0 ..... i~i ii
40:iliiiii
1 3 0 !i
iii~i
2 0
10
0
u t / u a
Fig. 9. Contour plot for the tissue strain energy density distribution U t in a ten-element thick cross-section taken from the middle of the cube. White areas are highly loaded (Ut> 50 Ua), black areas are unloaded.
73


Micromechanical finite-element models 75
To reduce the CPU time, vectorization schemes as described by Hughes et al. (1987) and Hayes and Devloo (1986) were applied to the global stit~ess matrix-vector product, taking full advantage of the CRAY-YMP computer which was used for the calcu- lations. To monitor the convergence of the process the norm of the residual force vector II f,®, II was calculated every increment. The iterative process was terminated as soon as this norm was less than 1E-6 N. After calculating the reaction forces, the accuracy of the results was determined by calculating the ratio II f~=, II/II f~o,° II, with II f,=ffio II the norm of the reaction force vector. The solution was considered suffmiently accurate if this ratio was less than 1E-5.
The validity of the algorithms developed was checked by calculating stresses, strains and strain en- ergy densities in a much smaller FE model, consisting of 1497 elements, representing a typical part of 20 x 20 x 20 voxels taken from the trabecular struc- ture. This model was analyzed using both the MARC FE code (MARC Analysis Corporation, Palo Alto, CA) and the methods described here. The results using the newly developed EBE strategy compared exactly to those found using the MARC FE code within the accuracy of the computer. The validity of the algo- rithms for larger problems was checked by simulating unconfined compression experiments on solid (V, ffi 1) square cube models of up to 100 x 100 x 100 elements. The results matched the analytical solution for this problem.
Boundary conditions of the FE model were varied to represent the situation in a compressive-test setup first, and in in situ conditions later. In the compres- sive-test model, a displacement Up of -0.0512 mm was prescribed to the top face (in the z-direction), equivalent to 1% strain for the cube as a whole. At the bottom face the displacements in the z-direction were constrained. All other faces of the cube were uncon- strained (Fig. 3). This case simulates a compression test on the cube, with zero friction between the test platens and the bone. Hence, the cube is in a state of uniaxial stress at the apparent level. In the in situ model, the displacements of the other faces were sup- pressed as well, but only in the directions perpendicu- lar to the cup faces (Fig. 3). Linde and Hvid (1989) demonstrated that the increase in stiffness due to these rigid side-contraints is in the same order of magni- tudes as found in situ where bone is side-constrained by surrounding bone. The same displacement Up as in the compressive-test model was applied to the top face. So, in effect this model simulates confined com- pression.conditions and a state of uniaxial strain on the apparent level. The loading axis, in this case, coincides with the longitudinal axis of the tibia, and the uniaxial displacement represents the displacement under the tibial plateau, due to articular loading.
All elements in the model were given isotropic ma- terial properties with an arbitrarily chosen Young's modulus of 1000 MPa and a Poisson's ratio of 0.3. Since the analysis is linear elastic, the results can be
B o u n d a r y cond i t i ons
in situ comprmudon-test
z y _ ~ r ~ o f ~
suppra=~l ± faoe
no o0nlllldnts
Fig. 3. The constraints applied to the in situ model (left) and the compression-test model (fight). For both models a pre- scribed displacement up was applied at the top face while displacements were suppressed at the bottom face, but only
in the direction perpendicular to this face.
scaled to any isotropic Young's modulus with the same Poisson's ratio.
Stresses, strains, Von Mises equivalent stresses and strain energy densities were calculated at tissue and at apparent levels. Tissue values will be presented in histograms as ratios between the tissue and the appar- ent value. To obtain more accurate results for the strain energy density, this value was calculated dir- ectly from the element nodal displacements and forces rather than from the element stresses and strains. The apparent strain energy density was calculated from the external nodal forces and the corresponding dis- placements.
The apparent Young's modulus in the z-direction for the specimen as a whole was calculated from the formula E~ffi ~=/~=, where ~= is the apparent StreSS
and ~= the apparent strain in the z-direction. The apparent stress was calculated from ¢~:--Fr/(hxhy), where Fr is the total reaction force at the top face, the
g w apparent strain from e=:-up/hffi, where Up is the pre- scribed displacement; hx, h, and h= represent the ex- ternal dimensions of the cube in the x-, y- and z- directions, respectively (Fig. 2). The apparent Young's modulus was calculated for the compressive-test model only; the set of boundary conditions for the in situ model will not allow for a proper apparent Young's modulus calculation.
The geometry of the FE model was such that the average individual trabecular cross-section as seen in the model was covered with at least four elements. A typical detail of the FE model (Fig. 4) shows the jagged boundaries that are present in the digitized mesh. To investigate possible inaccuracies in the cal- culations when using a digitized mesh, Hollister et al. (1992) used a two-dimensional model of a void struc- ture that was analyzed using both a smooth and a digitized mesh. They found that the errors in the
76 B. van Rietbergen et al.
stiffness determination resulting from the digitization will be less than 10% for images with 50 #m cubic voxels where the major structures are 100-200 gm in thickness. To estimate the error due to digitization for realistic three-dimensional trabecular structures, a mesh convergence test was performed. For this test, another piece of trabecular bone of 2 x 2 x 2 mm was digitized using different resolutions. The voxel size was set to 20, 40, 60, 80, 100 and 120 gm. The models thus obtained consisted of 321,341, 38,658, 11,551, 4955, 2625 and 1271 elements, respectively. For each model the FE problem was solved and the apparent stiffness for the cube as a whole was calculated. The error in the tissue stress and strain distribution was assessed by comparing tissue stress and strain histo- grams for each model to those obtained for the model with the smallest voxel size.
RESULTS
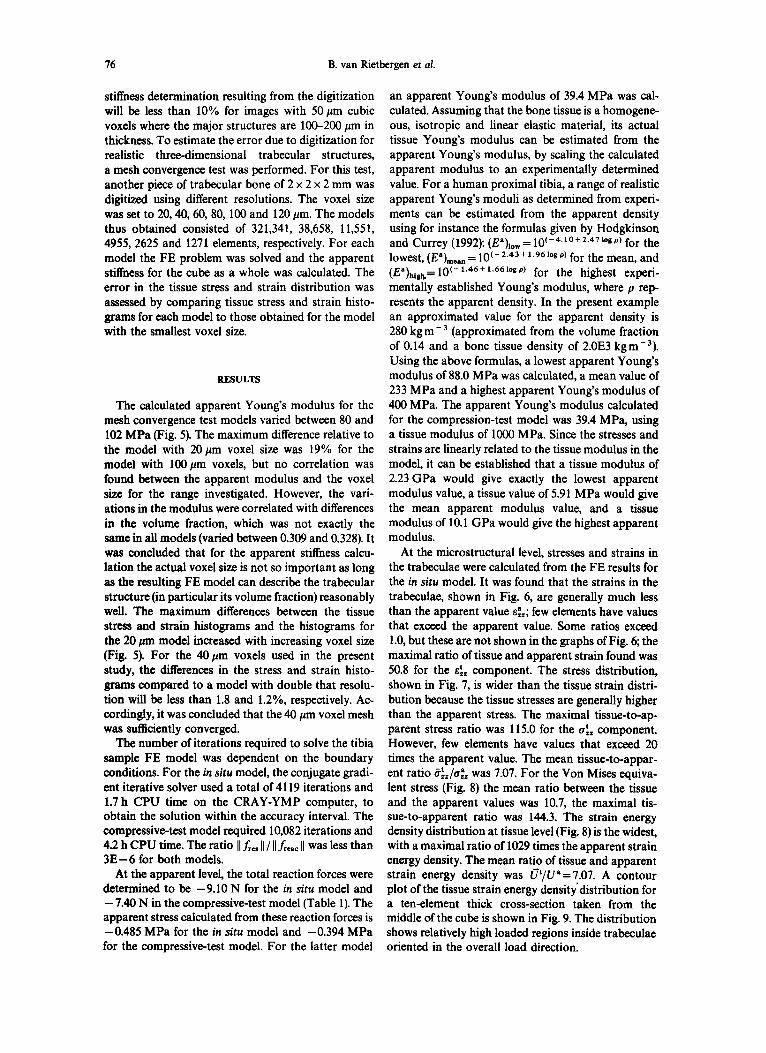
The calculated apparent Young's modulus for the mesh convergence test models varied between 80 and 102 MPa (Fig. 5). The maximum difference relative to the model with 20 #m voxel size was 19% for the model with 100 #m voxels, but no correlation was found between the apparent modulus and the voxel size for the range investigated. However, the vari- ations in the modulus were correlated with differences in the volume fraction, which was not exactly the same in all models (varied between 0.309 and 0.328). It was concluded that for the apparent stiffness calcu- lation the actual voxel size is not so important as long as the resulting FE model can describe the trabecular structure (in particular its volume fraction) reasonably well. The maximum differences between the tissue stress and strain histograms and the histograms for the 20/an model increased with increasing voxel size (Fig. 5). For the 40 #m voxels used in the present study, the differences in the stress and strain histo- grams compared to a model with double that resolu- tion will be less than 1.8 and 1.2%, respectively. Ac- cordingly, it was concluded that the 40 #m voxel mesh was sufficiently converged.
The number of iterations required to solve the tibia sample FE model was dependent on the boundary conditions. For the in situ model, the conjugate gradi- ent iterative solver used a total of 4119 iterations and 1.7 h CPU time on the CRAY-YMP computer, to obtain the solution within the accuracy interval. The compressive-test model required 10,082 iterations and 4.2 h CPU time. The ratio II f~,, II/II f,,,c II was less than 3 E - 6 for both models.
At the apparent level, the total reaction forces were determined to be -9 .10 N for the in situ model and -7 .40 N in the compressive-test model (Table 1). The apparent stress calculated from these reaction forces is -0.485 MPa for the in situ model and -0.394 MPa for the compressive-test model. For the latter model
an apparent Young's modulus of 39.4 MPa was cal- culated. Assuming that the bone tissue is a homogene- ous, isotropic and linear elastic material, its actual tissue Young's modulus can be estimated from the apparent Young's modulus, by scaling the calculated apparent modulus to an experimentally determined value. For a human proximal tibia, a range of realistic apparent Young's moduli as determined from experi- ments can be estimated from the apparent density using for instance the formulas given by Hodgkinson and Currey (1992): (Ea)low = 10 ~-4'10+2"471°gp) for the lowest, (Ea)m~an = 10 ~- 2.43 + 1.96 los p) for the mean, and (Ea)his%= 10 ( - 1.46 + 1.66 log p) for the highest experi- mentally established Young's modulus, where p rep- resents the apparent density. In the present example an approximated value for the apparent density is 280 kg m - 3 (approximated from the volume fraction of 0.14 and a bone tissue density of 2.0E3 kgm-3). Using the above formulas, a lowest apparent Young's modulus of 88.0 MPa was calculated, a mean value of 233 MPa and a highest apparent Young's modulus of 400 MPa. The apparent Young's modulus calculated for the compression-test model was 39.4 MPa, using a tissue modulus of 1000 MPa. Since the stresses and strains are linearly related to the tissue modulus in the model, it can be established that a tissue modulus of 2.23 GPa would give exactly the lowest apparent modulus value, a tissue value of 5.91 MPa would give the mean apparent modulus value, and a tissue modulus of 10.1 GPa would give the highest apparent modulus.
At the microstructural level, stresses and strains in the trabeculae were calculated from the FE results for the in situ model. It was found that the strains in the trabeculae, shown in Fig. 6, are generally much less than the apparent value ~ ; few elements have values that exceed the apparent value. Some ratios exceed 1.0, but these are not shown in the graphs of Fig. 6; the maximal ratio of tissue and apparent strain found was 50.8 for the et: component. The stress distribution, shown in Fig. 7, is wider than the tissue strain distri- bution because the tissue stresses are generally higher than the apparent stress. The maximal tissue-to-ap- parent stress ratio was 115.0 for the at~ component. However, few elements have values that exceed 20 times the apparent value. The mean tissue-to-appar- ent ratio -t a~/trzz was 7.07. For the Von Mises equiva- lent stress (Fig. 8) the mean ratio between the tissue and the apparent values was 10.7, the maximal tis- sue-to-apparent ratio was 144.3. The strain energy density distribution at tissue level (Fig. 8) is the widest, with a maximal ratio of 1029 times the apparent strain energy density. The mean ratio of tissue and apparent strain energy density was Ut/U'=7.07. A contour plot of the tissue strain energy density' distribution for a ten-element thick cross-section taken from the middle of the cube is shown in Fig. 9. The distribution shows relatively high loaded regions inside trabeculae oriented in the overall load direction.

Micromechanical finite-element models 77
W
Apparent modulus
E a MPa
0 . 3 ' ~ . . . . . . . 7 ............................... ~ ...... 1 2 0
0 . 2 , ~ i i i i i i 80 ................................. ~ . . ~ . u . ! u s . . ( E . a ) .
0.1 ....................................................................... 40
0 20 4() 6() 8() 1(~ 120 0
Voxel size (micron)
Tissue stress and strain histograms Al~oluta difference relstlve ~o 20 micron voxe181ze
2 0 ~ . . . . . . . . . . . . . . . . . . . . . . . . . . . . . . . . . . . . . . . . . . . . . . . . . . . . . . . . . . . . . . . . . . . . . . . . . . . .
0 % 40 ~ e0 lOO 12o Voxel size (micron)
Fig. 5. Results of the mesh convergence test: on the left the calculated apparent modulus as a function of the voxel size; on the right the absolute differences (in percent) between the stress and strain histograms for the
20/~m model when compared to the other models.
Table 1. The apparent values calculated for both models; the displacement at the top and thus the strain in the z-direction were prescribed
In situ model Compressive-test model
Displacement top Total force top Strain z-direction Stress z-direction Strain energy density
up = - 0.0512 m m Fr = - 9 . 1 0 N ~:= = - 0 . 0 1 a~= = - 0 . 4 8 5 MPa U a = 0 .242E- 02 N m m - 2
Up=--0.0512 mm Fr = - 7.40 N e~z = - 0.01 a~= = - 0 . 3 9 4 MPa Ua = 0 . 1 9 7 E - 0 2 N m m -2
Tissue strain distributions in situ model
#1~mmra In Interval I Nol #Elements in Interval I Nol #Elements in Interval I Nol
40% ......................................... 40°A . . . . . . . . . . . . . : ~ I 40% _ ......................................................... . . . . ~ I1
~o% ,o%1 . . . . . . . . . I n - ,o% ................................................
0% . . . . . . . . . . . . . . . . . . . o%. _ , l l f l l ,_ . .o%, , - " ' , -1.0 -0.5 0 0.5 1.0 -1.0 -0.5 0 0.5 1.0 -1.0 -0.5 0 0.5 1.0
t a ~ / ~ ~ / c ~ ~, /~ , , #Elements in Interval I Nel #Elements in interval I Nol #Elomont~ In Interval I Nel
40%] . . . . . . . 40%J . . . . . . . . . . . . . . . . . . . . . . . . . . .
10% 10% ......................... I ~ l ~ .. . . . . . . . 10% . . . . . . . . . . . . . . . . . . . . . . . . . . . . . . . i
O " . . . . . . . . . . . . . . . . . . . . . O" ~ = ' ' ' ' ' ' l . . . . ! ' ' ' ' ' " q o%L--..,dm,,.--:., -1.0 -0.5 0 0.5 1.0 -1.0 -0.5 0 0.5 1.0 -1.0 -0.5 0 0.5 1.0
t a ~,/~zz ~/e~z ~ l e ~
Fig. 6. Histograms showing the distribution of the tissue strain components in the in situ model. On the horizontal axis the ratio between the tissue strain component and the longitudinal apparent strain is indicated, on the vertical axis the number of elements in a bin as a percentage of the total number of elements Nel. The bin width is set to 0.1e~',. Note that the apparent strain is the same in all histograms.

78 B. van Rietbergen et al.
Tissue stress distributions in situ m o d e l
#Ekanonm In Imenml I Nel 40~ ............................................................
0 % . . . . = , , , , h . . . . . . . . . . . . . . . . . . I , , , , I . . . .
-20 -10 0 10 t a O x/O=
#Elements In Intsnml I Nel 40% ..........................................................
30% ...........................................
-'1o. : iii i 0% .... I . . . . . . . . . . . . . . . . . . . . . . . . . . . . . . . . . ;
20 -20 -10 0 10 t a o,,/o=
~ In Intsrval I Nel
0% .... i , , , . i , , , , i . . . . . . . . . . . . . . . . . . . . . . . . . 20 -20 -10 0 10 20
o'-/o" #l=-ammnW In Intsrval I Nel
40~ ............................................................
~0~ ............................................. i ~ "
10% .......................................................... I l
-20 -10 0 10 t a
#Elenmms In InWrval I Nel #Elements In Intewal I Nel
20 . . . . . . . . . . . . . . . . . . . . . . . . . . . . . . . . . . . . . . . . . . . . . . . . . . . . . . . .
10 ..................................................... 10%~ .......................................................
. . . . . Z I h . . . . . 0 % . . . . I , , , , J , , ~ . . . . . . . . . ~ 1 , : . . . . [ , F , , I
20 -20 -10 0 10 20 -20 -10 0 10 20 t a o /o= ' "
Fig. 7. Histograms showing the distribution of the tissue stress components in the in situ model. On the horizontal axis the ratio between the tissue stress component and the longitudinal apparent stress is indicated, on the vertical axis the number of elements in a bin as a percentage of the total number of elements Nel. The bin width is set to 1.(b-~',. Note that the apparent stress is the same in all histograms•
Strain energy density
#Elements in interval / Nel
Yon Mises
#Elements In interval I Nel
1 5 % -
10% .............................................................................................
5 % - 5 % .........................................................
0 % ...................... T;....., ;.,, J,~ .................... 0 % .............................. I ......... I ......... I ......... 0 10 20 30 40 50 0 10 20 30 4 0 50 ut/u
Fig. 8. Histograms showing the distribution of the tissue strain energy density and the tissue Von Mises equivalent stress in the in situ model. On the horizontal axis the ratio between the tissue component and the corresponding apparent value is indicated, on the vertical axis the number of elements in a bin as a percentage of the total number of elements NoI. The bin width is set to 1.0U = for the strain energy density
distribution and to 1•0~, M for the Von Mises distribution•
DISCUSSION
• Q
In the present paper we have in t roduced a new approach to analyze t rabccular bone structures using large-scale FE models, const ructed from voxel data. By using the fact tha t all elements in the resulting F E
model are the same, it became possible to analyze a piece of t rabecular bone tha t is large enough (of the size of a test sample) to ob ta in relevant apparen t results (Harr igan et al., 1988). Using this model, it is possible to est imate the tissue stress and strain distri- bu t ion at any locat ion in the bone. In addit ion, it is

Micromechanical finite-element models 79
possible to estimate the tissue material properties as functions of the apparent material properties.
Some limitations of the present model have to be discussed. First, the model has a smallest dimension of 3.64 mm. It can be questioned if this is large enough for a continuum assumption. Harrigan et al. (1988) have determined that averaging over five trabecular lengths should provide sufficiently average continuum quantities. From the cross-section shown in Fig. 9 it can be estimated that this condition is met for the present sample size. Second, the accuracy of the tissue stress and strain calculation for the 40 pm voxel size used in the present model was investigated by com- paring the calculated histograms for digitized models with different resolution. It should be noted that this mesh convergence test cannot be used to investigate the error in the tissue stress and strain values at a specific boundary location. Jacobs et al. (1993) have shown that tissue strains at the boundaries of a digitized mesh can differ substantially from those found for a smooth mesh, and that this error is not necessarily reduced when the element size is reduced. However, the error in the histograms will be reduced with smaller elements, because the fraction of ele- ments in the jagged area is reduced, and thus the accuracy of the histograms is verified. Third, the exact in situ boundary conditions for the present bone sample are unknown. It is possible that realistic in situ conditions would allow for some more deformation at the sides of the specimen than the confined compres- sion condition imposed at the in situ model used in the present study. To check for this, tissue strain histo- grams were also determined for the compressive-test model, which allows for more deformation than the in situ situation. It was found that the histograms for the compressive-test model are very similar to those shown in Fig. 6, and thus that the actual conditions at the side of the cube hardly affect the conclusions.
In the present study we used average experimental values to calculate a realistic range for the tissue Young's modulus: 2.23-10.1 GPa. A mean value of 5.91 MPa was calculated. This value is in good agree- ment with the experimentally established trabecular tissue modulus in the proximal tibia of 4.59 GPa found by Choi et al. (1990) and of 5.72 GPa found by Choi and Goldstein (1992). However, the comparison between direct measurements on small specimens and the values as determined in the present study can be misleading. The small size of single trabeculae speci- mens and damage effects due to machine cutting of small specimens will likely lead to an underestimation of the bulk tissue modulus. The indirect measurement method presented here does not suffer from these effects, and thus a significant higher tissue modulus would be expected. The fact that a higher value is not found in the present study can possibly be explained by systematic errors in the determination of the apparent modulus in compression experiments. Odgaard and Linde (1991) and Keaveny et al. (1993) have demonstrated that artifacts at the bone-platen
interface may result in a substantial underestimation of the experimentally established apparent moduli and thus of the tissue modulus as determined in the present study. Therefore it is expected that a realistic tissue modulus is closer to the upper boundary of the range determined.
Although not the aim of the present study, the methods presented here can be used to exclude the damage artifact error. This can be done by creating a full size model of a specimen that was experi- mentally tested, thereby also modeling the damaged zone with platen-specimen boundary conditions chosen exactly as in the experiment. Such full size models can also be used to determine material proper- ties that are nonlinear functions of the deformations, such as the Poisson's ratios.
At the tissue level, the ratios between the mean tissue stress and the apparent stress in the load direc- tion and between the mean tissue and the apparent strain energy density must equal lIVe, where Vv is the volume fraction of the cube (Appendix A). Indeed it was found in the present analysis that trzz/tr~z-t a _- 7.07 and Ut/Ua= 7.07, which is precisely equal to 1IVy for Vv =0.14 in the present model. In fact, this result confirms the validity of the stress and strain energy density calculation for the present FE model. Carter et al. (1987) have introduced the mean tissue strain energy density in the bone tissue U~/Vv as the objec- tive function for bone remodeling. The present analy- sis shows that the actual strain energy density in the trabeculae can be much higher (up to 1029V~ = 144 times higher) than the mean tissue strain energy den- sity. Since the effect of mechanically induced bone remodeling is considered at the apparent level (by the change in apparent density) the actual distribution of the objective function may be of lesser importance. However, for processes that are initiated by the max- imum tissue strain energy density or maximum tissue effective stress, for example microdamage processes, the mean tissue value is not a good measure. The ratio between the mean tissue Von Mises equivalent stress and the apparent Von Mises stress, #~M/tr~,M, does not equal lIVe, indicating that the mean tissue Von Mises stress cannot be estimated from the apparent Von Mises stress divided by the volume fraction (Appendix A).
From the tissue stress and strain distributions as shown in Figs 6 and 7, a number of conclusions can be derived. First , it can be seen that the axial deforma- tion in the tissue material (etz) is smaller than the apparent deformation (e~); very few elements have a tissue-to-apparent ratio greater than 1.0 (Fig. 6). Gibson (1985) has shown that this result is typical for asymmetric structures, in which the deformation mode is in bending rather than in axial deformation. From this, it can be concluded that the trabecular structure investigated in the present study can be characterized as an asymmetric structure rather than a columnar one. Due to bending effects, trabeculae can be tensile strained under compressive apparent loading (Fig. 10), resulting in tissue-to-apparent stress

80 B. van Rietbergen et al.
l-
~ z > 0
Z
Fig. 10. Tissue tensile strains (e'~z>O) can occur under com- pressive apparent loading (e~z < O) due to bending effects.
and strain ratios in the load direction which are less than zero. From Figs 6 and 7 it can be seen that such deformation modes are indeed present in the struc- ture. This paradoxical effect of trabeculae being ten- sile strained under compressive apparent loading was found earlier by Odgaard and Linde (1991), when using optical strain measurement on the individual trabeculae. Second, for the bin width chosen, the stress distributions show a peak at zero for all compo- nents, i.e. at many locations in the tissue the indi- vidual stress components are very small. The Von Mises stress distribution, however, shows no high peak at zero. This indicates that at most locations the elements are distorted, thus implying that most trabeculae are load carrying. High tissue-to-apparent ratios are found for the Von Mises stress and for the strain energy density, although the number of ele- ments with excessive values is relatively small. It is possible that a more physiological loading condit ion (for instance obtained from multiaxial load cases) will reduce the maximal Von Mises and strain energy density values.
The applications of the new method discussed here are, of course, only examples of its applicability. Other examples are the investigation of various bench tests for trabecular bone by simulating the test conditions. For example, the boundary effects in compressive tests can be evaluated. Secondly, the method can be useful to estimate tissue stresses in rive, in various circumstances and locations. It can be used to study damage-accumulation processes by successively elim- inating elements that are overloaded from the model, and bone remodeling processes at the tissue level. Finally, it can be applied as a link between mechanics at the whole-bone level and the microscopic level.
Acknowledgements--This project was sponsored by The Netherlands Foundation for Research (NWO/Medical Sciences), by the National Computing Facilities Foundation (NCF), and by the Danish Rheumatism Association (233- 588). The authors gratefully acknowledge the selection of this paper for the Selvik Award by the European Ortho- paedic Research Society (EORS), London, 11 April, 1994.
REFERENCES
Beaupr6, G. S. and Hayes, W. C. (1985) Finite element analysis of a three-dimensional open-celled model for tra- becular bone. J. biomech. Engng 107, 249-256.
Carter, D. R., Fyhrie, D. P. and Whalen, R. T. (1987) Tra- becular bone density and loading history: regulation of connective tissue biology by mechanical energy. J. Bio- mechanics 20, 785-794.
Choi, K. and Goldstein, S. A. (1992) A comparison of the fatigue behavior of human trabecular and cortical bone tissue. J. Biomechanics 25, 1371-1381.
Choi, K., Kuhn, J. L., Ciarelli, M. J. and Goldstein, S. A. (1990) The elastic moduli of human subchondral, trabecu- lar, and cortical bone tissue and the size dependency of cortical bone modulus. J. Biomechanics 23, 1103-I 113.
Edidin, A. A., Dawson, J. M., Zhu, M. and Chinchalkar, S. (1993) Direct estimation of the modulus of cancellous bone using a variable-stiffness FE model. Trans. 39th A. Meet- ing Orthop. Res. See., p. 589.
Feldkamp, L. A., Goldstein, S. A., Parfitt, A. M., Jesion, G. and Klecrekoper, M. (1989) The direct examination of three dimensional bone architecture in vitro by computed tomography. J. Bone Min. Res. 4, 3-11.
Frost, H. M. (1987) Vital biomechanics. Proposed general concepts for skeletal adaptations to mechanical usage. Calcif. Tissue Int. 42, 145-156.
Fyhrie, D. P. and Hamid, M. S. (1993) The probability distribution of trabecular level strains for vertebral cancel- lous bone. Trans~ 39th A. Meeting Orthop. Res. Soc., p. 175.
Fyhrie, D. P., Hamid, M. S., Kuo, R. F. and Lang, S. M. (1992) Direct three-dimensional finite element analysis of human vertebral cancellous bone. Trans. 38th A. Meetino Orthop. Res. See., p. 551.
Gibson, L. J. (1985) The mechanical behavior of cancellous bone. J. Biomechanics 18, 317-328.
Harrigan, T. P., Jasty, M., Mann, R. W. and Harris, W. H. (1988) Limitations of the continuum assumption in cancel- lous bone. J. Biomechanics 21, 269-275.
Hayes, L. J. and Devloo, P. (1986) A vectorized version of a sparse matrix-vector multiply. Int. J. Numer. Methods Engng 23, 1043-1056.
Hodgkinson, R. and Currey, J. D. (1992) Young's modulus, density and material properties in cancellous bone over a large density range. J. Mater. Sci. Mater. Med. 3, 377-381.
Hollister, S. J., Brennan, J. M. and Kikuchi, N. (1992) Recent Advantages in Computer Methods in Biomechanics and Biomedical Engineering, pp. 308-317. Books and Journals Int. Ltd. Swansea, U.K.
Hollister, S. J., Fyhrie, D. P., Jepsen, K. J. and Goldstein, S. A. (1991) Application of homogenization theory to the study of trabecular bone mechanics. J. Biomechanics 24, 825-839.
Hollister, S. J. and Kikuchi, N. (1992) Direct analysis of trabecular bone stiffness and tissue level mechanics using an element-by-element homogenization method. Trans. 38th A. Meeting Orthop. Res. Soc., p. 559.
Hughes, J. R., Ferencz, R. M. and Hallquist, J. O. (1987) Large-scale vectorized implicit calculations in solid mech- anics on a cray X-MP/48 utilizing EBE preconditioned conjugate gradients. Comput. Methods appl. Mech. Engng 61, 215-248.
Jacobs, C. R., Mandell, J. A. and Beaupr6, G. S. (1993) A comparative study of automatic finite element mesh generation techniques in orthopaedic biomechanics. Bio- engng Conf. ASME, BED-24, 512-514.
Keaveny, T. M., Botchers, R. E., Gibson, L. J. and Hayes, W. C. (1993) Theoretical analysis of the experimental artifact in trabecular bone compressive modulus. J. Biomechanics 26, 599q507.
Kuhn, .I.L., Goldstein, S. A., Choi, K. W., London, M., Feldkamp, L. A. and Mattbews, L. S. (1989) Comparison

Micromechanical finite-element models 81
of the trabecular and cortical tissue moduli from the human iliac crests. J. orthop. Res. 7, 876-884.
Linde, F. and Hvid, I. (1989) The effect of constraint on the mechanical behaviour of trabecular bone specimens. J. Biomechanics 22, 485-490.
Martin, R. B. and Burr, D. B. (1989) Structure, Function and Adaptation of Compact Bone. Raven Press, New York.
Odgaard, A., Andersen, K., Melsen, F. and Gundersen, H. J. G. (1990) A direct method for fast three-dimensional serial reconstruction. J. Microscopy 159, 335-342.
Odgaard, A. and Linde, F. (1991) The underestimation of Young's modulus in compressive testing of cancellous bone specimens. J. Biomechanics 24, 691-698.
Rho, J. Y., Ashman, R. B. and Turner, C. H. (1993) Young's modulus of trabecular and cortical bone material: ultra- sonic and microtensile measurements. J. Biomechanics 26, 111-119.
Ryan, J. C. and Williams, J. L. (1989) Tensile testing of rod- like trabeculae excised from bovine femoral bone. J. Bio- mechanics 22, 351-355.
Strang, G. (1986) Introduction to Applied Mathematics. Wel- lesley-Cambridge Press, Wellesley, Massachusetts.
Williams, J. L. and Lewis, J. L. (1982) Properties and an anisotropic model of cancellous bone from the proximal tibia epiphysis. J. biomech. Enon 9 104, 50-56.
APPENDIX A
RATIO BETWEEN MEAN TISSUE AND APPARENT VALUE FOR STRESSES AND STRAIN ENERGY DENSITY
The ratio for the mean tissue to apparent stress in the load direction can be determined for a cube with no constraints in the load direction at the sides of the cube. The average tissue
stress in the z-direction equals
where V t = V, V" is the tissue volume as a function of the volume fraction V~ and the apparent volume ~ , and A'= VsA is the tissue area at a cross-section perpendicular to the load direction, with a surface fraction Vs. The total apparent force F, in the z-direction must balance the total tissue force in that direction in each perpendicular cross- section:
F~=la,,' dA'. (2)
From equations (1) and (2) it follows that
_-r if dz=hzFz V'Fz 1 , . . = ~ F. V' V'A V~ *~'' (3)
where h, is the size of the cube in the z-direction. The same ratio holds for the stress component in the x- and y-direc- tions as long as the equilibrium equation (2) holds in each cross-section perpendicular to the corresponding direction. For the Von Mises equivalent stress, however, such an equi- librium equation, in general, cannot be found, and therefore the average tissue Von Mises equivalent stress cannot be determined from the apparent value and the volume fraction.
For the strain energy density another equilibrium equa- tion can be used based on the total apparent energy V" U" that must equal the total internal energy in the tissue mater- ial V t 0 t, where LTt is the average tissue strain energy density; thus
V a L7t=__ 1 U ' = - - U a . (4) V' V~
BM 28-I-F