a new method for non-parametric multivariate analysis of variance
TRANSCRIPT
INTRODUCTION
The analysis of multivariate data in ecology is becom-ing increasingly important. Ecologists often need to testhypotheses concerning the effects of experimentalfactors on whole assemblages of species at once. Thisis important for core ecological research and in studiesof biodiversity or environmental impacts in manyhabitats, including marine subtidal environments(Warwick et al. 1988; Gray et al. 1990; Chapman et al.1995; Glasby 1997), mangroves (Skilleter 1996;Kelaher et al. 1998), freshwater systems (Faith et al.1995; Quinn et al. 1996) and terrestrial systems (Oliver& Beattie 1996; Anderson & Clements, in press).
Univariate analysis of variance (ANOVA) provides anextremely powerful and useful tool for statistical testsof factors and their interactions in experiments(Underwood 1981, 1997). Partitioning variation, as inmultifactorial ANOVA, is particularly important for test-ing hypotheses in complex ecological systems with nat-ural temporal and spatial variability. This partitioningis also needed to test multivariate hypotheses in ecol-ogy for experimental designs involving several factors.
This paper describes a new non-parametric test ofthe general multivariate hypothesis of differences in thecomposition and/or relative abundances of organismsof different species (variables) in samples from differ-ent groups or treatments. This test is a significantadvance on previous methods because it can be basedon any measure of dissimilarity and can partitionvariation directly among individual terms in a multi-factorial ANOVA model. The test is applicable to anysituation where the simultaneous responses of manypotentially non-independent variables (usually abun-dances of species in an assemblage) have been meas-ured in samples from a one-factor or multifactorialANOVA design.
Powerful multivariate statistical methods, such as thetraditional multivariate analysis of variance (MANOVA),have existed for decades (Hotelling 1931; Wilks 1932;Fisher 1936; Bartlett 1939; Lawley 1939; Pillai 1955),but tests using these statistics rely on assumptions thatare not generally met by ecological data. The assump-tion that the data conform to a multivariate normal dis-tribution is particularly unrealistic for most ecologicaldata sets. This is because the distributions of abun-dances of individual species are usually highly aggre-gated or skewed (e.g. Gaston & McArdle 1994). Also,abundances take discrete values rather than beingcontinuous, species with small means often haveasymmetric distributions because they are necessarily
Austral Ecology (2001) 26, 32–46
A new method for non-parametric multivariate analysis of variance
MARTI J. ANDERSONCentre for Research on Ecological Impacts of Coastal Cities, Marine Ecology Laboratories A11,University of Sydney, New South Wales 2006, Australia
Abstract Hypothesis-testing methods for multivariate data are needed to make rigorous probability statementsabout the effects of factors and their interactions in experiments. Analysis of variance is particularly powerful forthe analysis of univariate data. The traditional multivariate analogues, however, are too stringent in their assumptionsfor most ecological multivariate data sets. Non-parametric methods, based on permutation tests, are preferable.This paper describes a new non-parametric method for multivariate analysis of variance, after McArdle andAnderson (in press). It is given here, with several applications in ecology, to provide an alternative and perhapsmore intuitive formulation for ANOVA (based on sums of squared distances) to complement the description pro-vided by McArdle and Anderson (in press) for the analysis of any linear model. It is an improvement on previousnon-parametric methods because it allows a direct additive partitioning of variation for complex models. It doesthis while maintaining the flexibility and lack of formal assumptions of other non-parametric methods. The test-statistic is a multivariate analogue to Fisher’s F-ratio and is calculated directly from any symmetric distance ordissimilarity matrix. P-values are then obtained using permutations. Some examples of the method are given fortests involving several factors, including factorial and hierarchical (nested) designs and tests of interactions.
Key words: ANOVA, distance measure, experimental design, linear model, multifactorial, multivariate dissimilarity,partitioning, permutation tests, statistics.
*Present address: Department of Statistics, University ofAuckland, Private Bag 92019, Auckland, New Zealand (Email:[email protected]).
Accepted for publication March 2000.
truncated at zero, and rare species contribute lots ofzeros to the data set. MANOVA test statistics are notparticularly robust to departures from multivariate nor-mality (Mardia 1971; Olson 1974; Johnson & Field1993). Finally, many of these test statistics are simplyimpossible to calculate when there are more variablesthan sampling units, which often occurs in ecologicalapplications.
Many non-parametric methods for tests of differ-ences among a priori groups of observations (as inMANOVA) have been developed (Mantel 1967; Mantel& Valand 1970; Hubert & Schultz 1976; Mielke et al.1976; Clarke 1988, 1993; Smith et al. 1990; Excoffieret al. 1992; Edgington 1995; Pillar & Orlóci 1996;Legendre & Anderson 1999). These methods gener-ally have two things in common. First, they are basedon measures of distance or dissimilarity between pairsof individual multivariate observations (which I willrefer to generally as distances) or their ranks. A statis-tic is constructed to compare these distances amongobservations in the same group versus those in differ-ent groups, following the conceptual framework ofANOVA. Second, they use permutations of the obser-vations to obtain a probability associated with the nullhypothesis of no differences among groups.
These non-parametric methods generally fall intotwo categories. First, there are those that can be basedon any chosen distance measure. There are many suchmeasures and these have different properties, whichmake them appropriate for different kinds of data(Legendre & Legendre 1998). For example, to expressdifferences in community structure, the semimetricBray–Curtis measure of ecological distance (Bray &Curtis 1957) or Kulczynski’s (1928) semimetric meas-ure are generally preferred over metric measures, likeEuclidean distance (Odum 1950; Hajdu 1981; Faithet al. 1987; Clarke 1993). The methods that are flexi-ble enough to be used with any such distance measure(e.g. Mantel 1967; Hubert & Schultz 1976; Smith et al. 1990; Clarke 1993) have much to recommendthem for this reason.
The drawback to using these methods is that they arenot able to cope with multifactorial ANOVA. That is, theyare not able to partition variation across the manyfactors that form part of the experimental design.Consequently, for most complex designs, one mustanalyse data as one-way analyses in multiple subsetswithin particular levels of factors. These multiple one-way analyses and qualitative interpretations of ordin-ation plots are then used to infer something aboutinteractions or variability at different spatial scales (e.g.Anderson & Underwood 1994; Kelaher et al. 1998).
Some of the proposed non-parametric methods doallow partitioning for a complex design (e.g. Excoffieret al. 1992; Edgington 1995; Pillar & Orlóci 1996), butthese are restricted for use with metric distance meas-ures, which are not ideal for ecological applications.
Furthermore, even if these statistics were to be used,there has been disagreement concerning appropriatepermutational strategies for complex ANOVA, particu-larly for tests of interactions (e.g. Edgington 1995;Manly 1997). There have been some recent examplesof direct statistical analyses of Bray–Curtis distances(Faith et al. 1995; Underwood & Chapman 1998).These are restricted, however, to very specific experi-mental designs or hypotheses and cannot be used forany multifactorial ANOVA design.
Ecologists need a non-parametric multivariatemethod that can partition variation based on any dis-tance measure in any ANOVA design. The method needsto be robust, interpretable by reference to the experi-mental design, and should lack formal assumptionsconcerning distributions of variables. The purpose ofthis paper is to outline just such a method and to givesome ecological examples of its use. The more generalmathematical theory underlying this method, alongwith simulations and a comparison with the relatedapproach of Legendre and Anderson (1999), isdescribed elsewhere (McArdle & Anderson, in press).
STRATEGY FOR NON-PARAMETRICMULTIVARIATE ANALYSIS
An outline for a general approach to the analysis ofmultivariate data in ecology was given by Clarke andGreen (1988) and Clarke (1993). For experimentaldesigns used to test hypotheses defined a priori, thereare essentially four steps: (i) a choice is made con-cerning an appropriate transformation and/or standard-ization (if any) to apply to the data, given the hypothesisand the scales and nature of the species variables; (ii)a choice is made concerning the distance measure tobe used as the basis of the analysis (e.g. Bray–Curtis,Euclidean, x2 or other measure); (iii) ordination(and/or clustering) is performed in order to visualizepatterns of resemblance among the observations basedon their community composition; and (iv) a non-parametric multivariate test for differences amonggroups is done to obtain a rigorous probabilistic statement concerning multivariate effects of a priorigroups. Note that (iii) is not essential in terms of the statistical test; ordination simply gives a visual representation by reducing the dimensionality of thedata. In this paper, I focus on step (iv) of this pro-cedure, which currently poses a problem for multi-factorial designs.
DESCRIPTION OF THE TEST: ONE-WAYDESIGN
The two essential considerations for the test are: (i) theconstruction of the test-statistic, and (ii) the calculation
NON-PARAMETRIC MANOVA FOR ECOLOGY 33
of a P-value using some method of permutation. I willdescribe the method, which I shall simply call non-parametric MANOVA, first for the one-way design andthen for more complex designs, followed by some eco-logical examples. I deal here only with the case ofbalanced ANOVA designs, but analogous statistics for anylinear model, including multiple regression and/orunbalanced data, can be constructed, as described byMcArdle and Anderson (in press).
The test statistic: an F-ratio
The essence of analysis of variance is to compare vari-ability within groups versus variability among differentgroups, using the ratio of the F-statistic. The larger thevalue of F, the more likely it is that the null hypothesis(H0) of no differences among the group means (i.e.locations) is false. For univariate ANOVA, partitioningof the total sum of squares, SST, is achieved by calcu-lating sums of squared differences (i) between indiv-idual replicates and their group mean (SSW, thewithin-group sum of squares; Table 1a), and (ii)between group means and the overall sample mean(SSA, the among-group sum of squares). Next, considerthe multivariate case where p variables are measuredsimultaneously for each of n replicates in each of agroups, yielding a matrix of data where rows are obser-vations and columns are variables. A natural multi-variate analogue may be obtained by simply adding upthe sums of squares across all variables (Table 1b). AnF-ratio can then be constructed, as in the univariatecase.
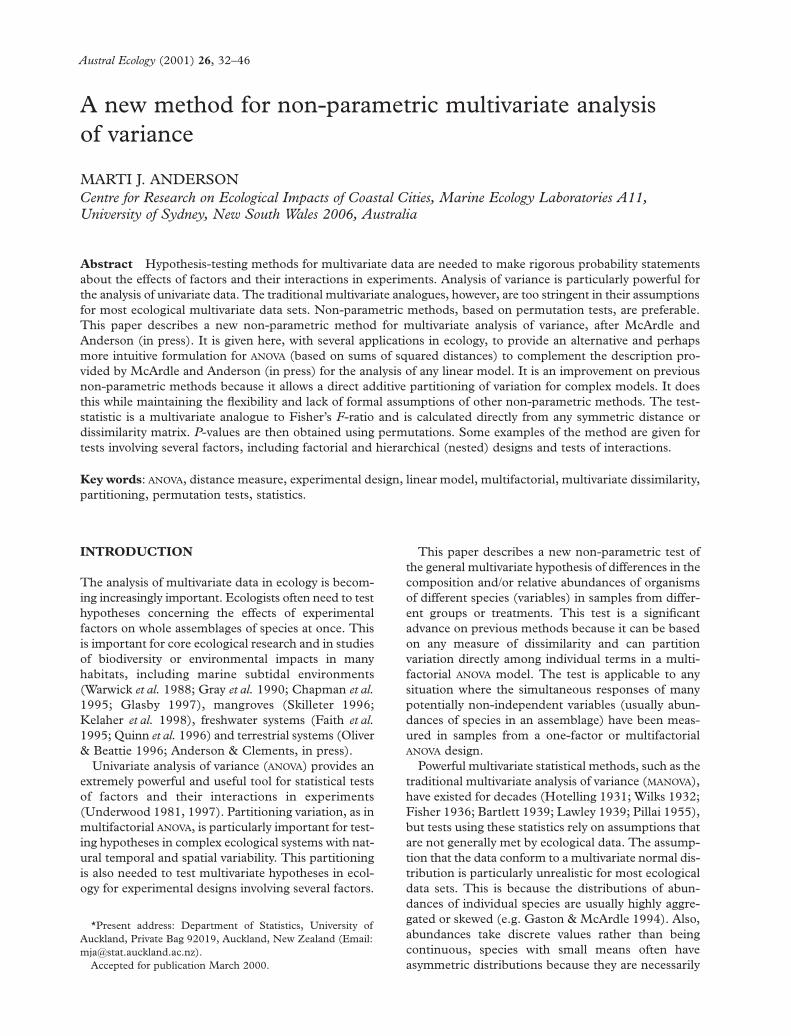
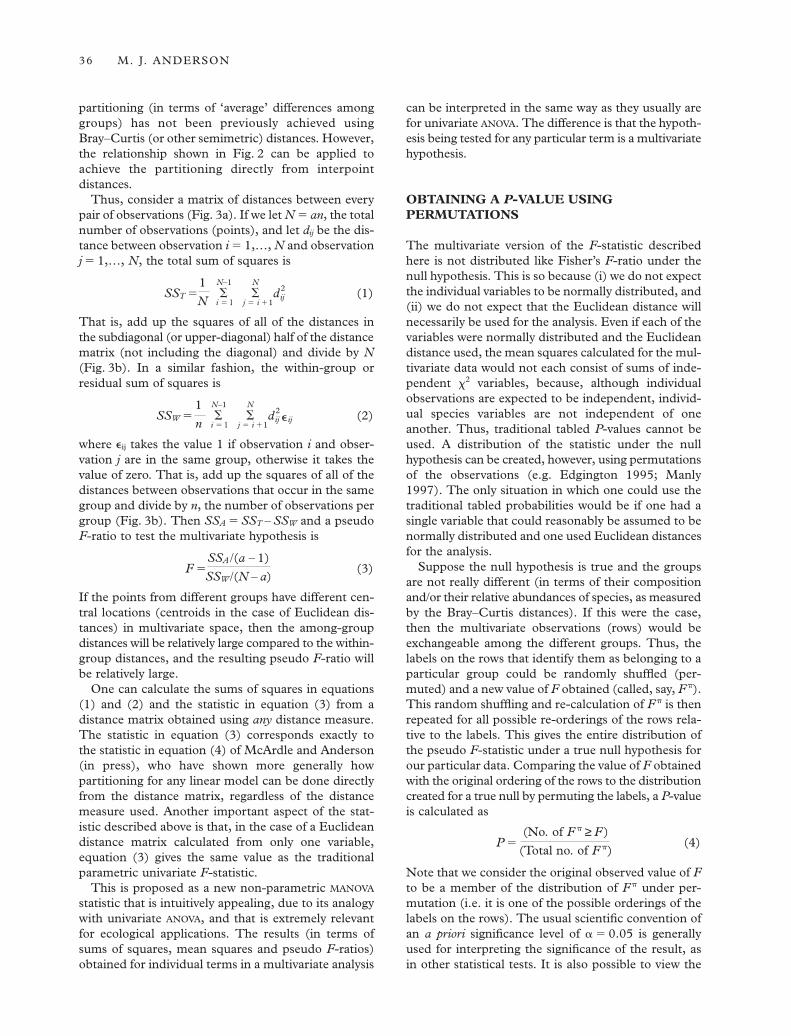
This multivariate analogue can also be thought ofgeometrically (e.g. Calinski & Harabasz 1974; Mielkeet al. 1976; Edgington 1995; Pillar & Orlóci 1996), asshown in Fig. 1 for the case of two groups and two vari-ables (dimensions). Here, SSW is the sum of thesquared Euclidean distances between each individualreplicate and its group centroid (the point corres-ponding to the averages for each variable, Fig. 1 and
34 M. J. ANDERSON
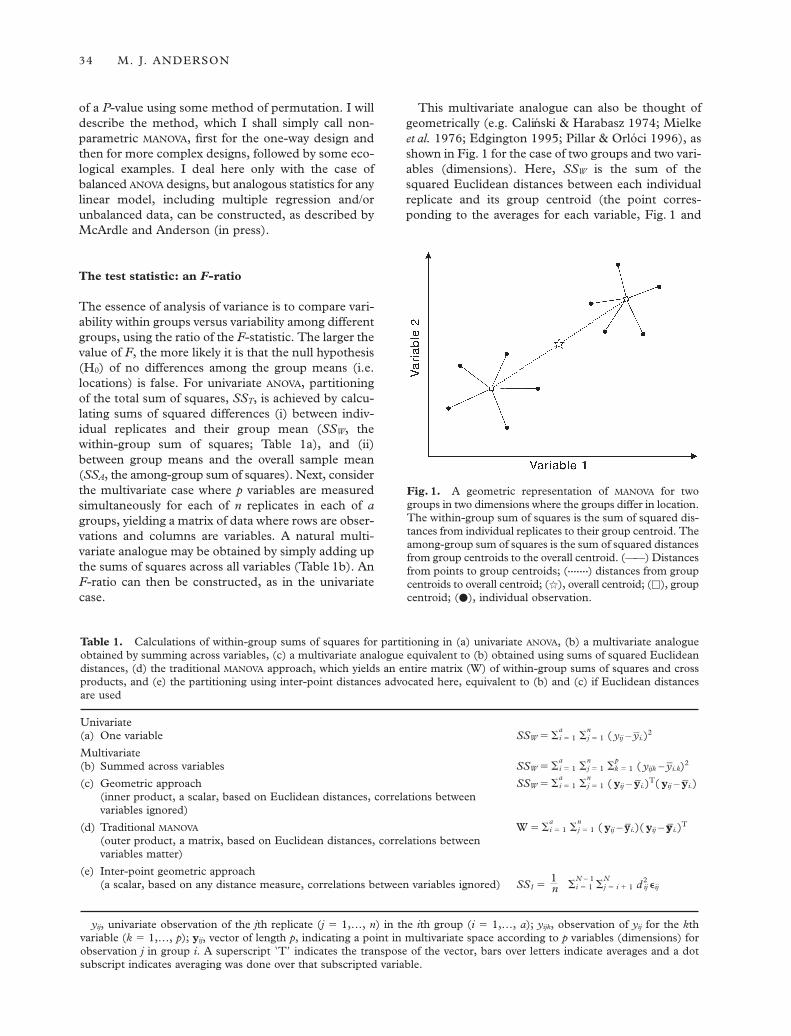
Table 1. Calculations of within-group sums of squares for partitioning in (a) univariate ANOVA, (b) a multivariate analogueobtained by summing across variables, (c) a multivariate analogue equivalent to (b) obtained using sums of squared Euclideandistances, (d) the traditional MANOVA approach, which yields an entire matrix (W) of within-group sums of squares and crossproducts, and (e) the partitioning using inter-point distances advocated here, equivalent to (b) and (c) if Euclidean distancesare used
Univariate(a) One variable SSW 5 S
ai 5 1 S
nj 5 1 ( yij – y–i.)2
Multivariate(b) Summed across variables SSW 5 S
ai 5 1 S
nj 5 1 S
pk 5 1 ( yijk – y–i.k)2
(c) Geometric approach SSW 5 Sai 5 1 S
nj 5 1 ( yij – y–i.)T( yij – y–i.)
(inner product, a scalar, based on Euclidean distances, correlations between variables ignored)
(d) Traditional MANOVA W 5 Sai 5 1 S
nj 5 1 ( yij – yy–i.)( yij – yy–i.)T
(outer product, a matrix, based on Euclidean distances, correlations between variables matter)
(e) Inter-point geometric approach(a scalar, based on any distance measure, correlations between variables ignored) SS1 5
1S
N – 1i 5 1 S
Nj 5 i 1 1 d2
ij eijn
yij, univariate observation of the jth replicate (j 5 1,…, n) in the ith group (i 5 1,…, a); yijk, observation of yij for the kthvariable (k 5 1,…, p); yij, vector of length p, indicating a point in multivariate space according to p variables (dimensions) forobservation j in group i. A superscript )T9 indicates the transpose of the vector, bars over letters indicate averages and a dotsubscript indicates averaging was done over that subscripted variable.
Fig. 1. A geometric representation of MANOVA for twogroups in two dimensions where the groups differ in location.The within-group sum of squares is the sum of squared dis-tances from individual replicates to their group centroid. Theamong-group sum of squares is the sum of squared distancesfrom group centroids to the overall centroid. (——) Distancesfrom points to group centroids; (•••••••) distances from groupcentroids to overall centroid; (q), overall centroid; (h), groupcentroid; (d), individual observation.
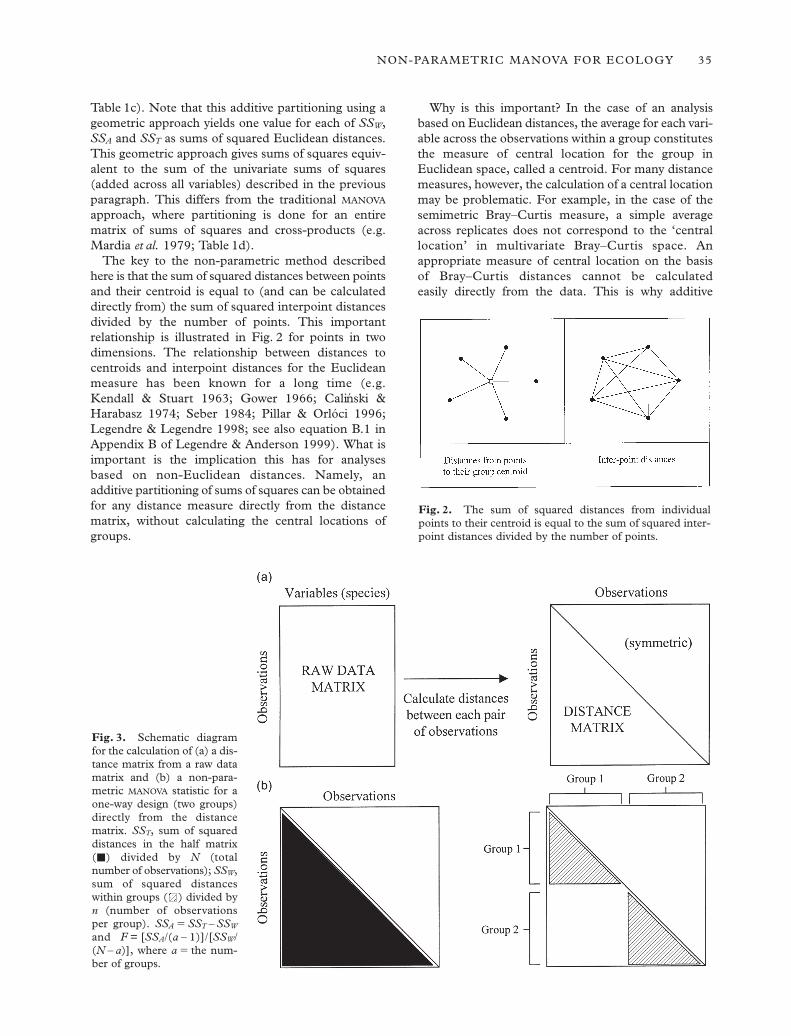
Table 1c). Note that this additive partitioning using ageometric approach yields one value for each of SSW,SSA and SST as sums of squared Euclidean distances.This geometric approach gives sums of squares equiv-alent to the sum of the univariate sums of squares(added across all variables) described in the previousparagraph. This differs from the traditional MANOVA
approach, where partitioning is done for an entirematrix of sums of squares and cross-products (e.g.Mardia et al. 1979; Table 1d).
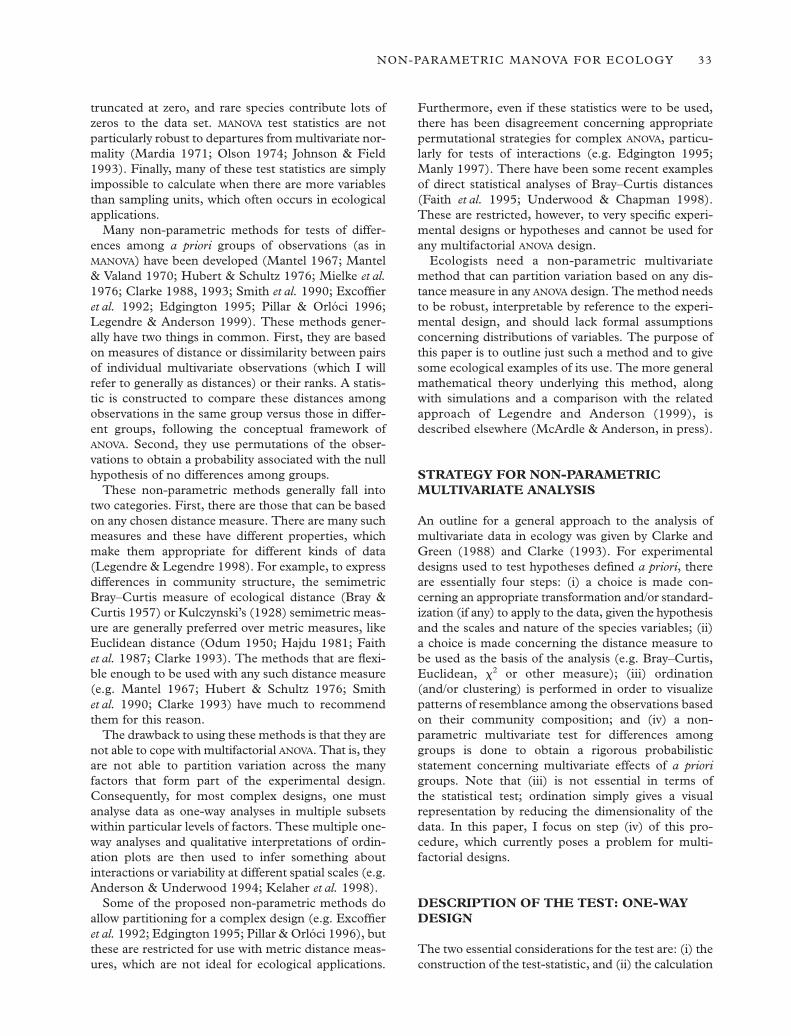
The key to the non-parametric method describedhere is that the sum of squared distances between pointsand their centroid is equal to (and can be calculateddirectly from) the sum of squared interpoint distancesdivided by the number of points. This importantrelationship is illustrated in Fig. 2 for points in twodimensions. The relationship between distances tocentroids and interpoint distances for the Euclideanmeasure has been known for a long time (e.g. Kendall & Stuart 1963; Gower 1966; Calinski &Harabasz 1974; Seber 1984; Pillar & Orlóci 1996;Legendre & Legendre 1998; see also equation B.1 inAppendix B of Legendre & Anderson 1999). What isimportant is the implication this has for analyses based on non-Euclidean distances. Namely, an additive partitioning of sums of squares can be obtainedfor any distance measure directly from the distancematrix, without calculating the central locations ofgroups.
Why is this important? In the case of an analysisbased on Euclidean distances, the average for each vari-able across the observations within a group constitutesthe measure of central location for the group inEuclidean space, called a centroid. For many distancemeasures, however, the calculation of a central locationmay be problematic. For example, in the case of thesemimetric Bray–Curtis measure, a simple averageacross replicates does not correspond to the ‘centrallocation’ in multivariate Bray–Curtis space. Anappropriate measure of central location on the basis of Bray–Curtis distances cannot be calculated easily directly from the data. This is why additive
NON-PARAMETRIC MANOVA FOR ECOLOGY 35
Fig. 2. The sum of squared distances from individualpoints to their centroid is equal to the sum of squared inter-point distances divided by the number of points.
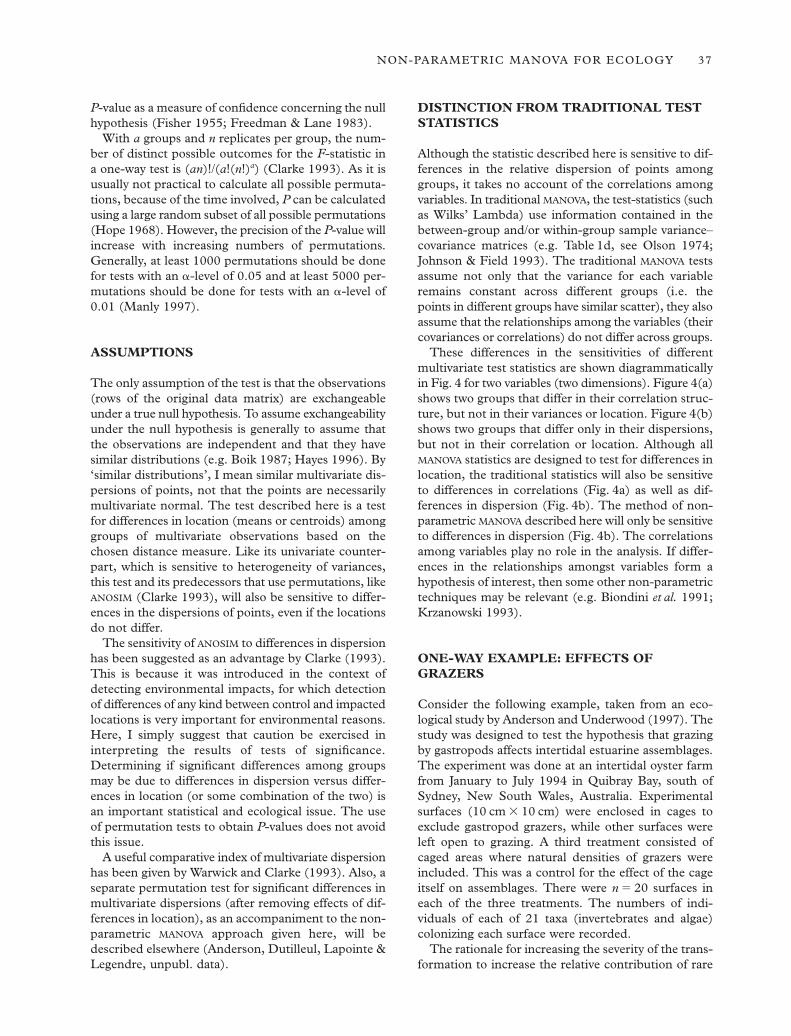
Fig. 3. Schematic diagramfor the calculation of (a) a dis-tance matrix from a raw datamatrix and (b) a non-para-metric MANOVA statistic for aone-way design (two groups)directly from the distancematrix. SST, sum of squareddistances in the half matrix(j) divided by N (total number of observations); SSW,sum of squared distanceswithin groups ( ) divided byn (number of observations per group). SSA 5 SST – SSW
and F = [SSA/(a – 1)]/[SSW/(N – a)], where a 5 the num-ber of groups.
partitioning (in terms of ‘average’ differences amonggroups) has not been previously achieved usingBray–Curtis (or other semimetric) distances. However,the relationship shown in Fig. 2 can be applied toachieve the partitioning directly from interpointdistances.
Thus, consider a matrix of distances between everypair of observations (Fig. 3a). If we let N 5 an, the totalnumber of observations (points), and let dij be the dis-tance between observation i 5 1,…, N and observationj 5 1,…, N, the total sum of squares is
1SST 5 S
N–1
i 5 lSN
j 5 i 11d2
ij (1)N
That is, add up the squares of all of the distances inthe subdiagonal (or upper-diagonal) half of the distancematrix (not including the diagonal) and divide by N(Fig. 3b). In a similar fashion, the within-group orresidual sum of squares is
1SSW 5 S
N–1
i 5 lSN
j 5 i 11d2
ij eij (2)n
where eij takes the value 1 if observation i and obser-vation j are in the same group, otherwise it takes thevalue of zero. That is, add up the squares of all of thedistances between observations that occur in the samegroup and divide by n, the number of observations pergroup (Fig. 3b). Then SSA 5 SST – SSW and a pseudoF-ratio to test the multivariate hypothesis is
SSA /(a – 1)F 5 (3)
SSW /(N – a)
If the points from different groups have different cen-tral locations (centroids in the case of Euclidean dis-tances) in multivariate space, then the among-groupdistances will be relatively large compared to the within-group distances, and the resulting pseudo F-ratio willbe relatively large.
One can calculate the sums of squares in equations(1) and (2) and the statistic in equation (3) from a distance matrix obtained using any distance measure.The statistic in equation (3) corresponds exactly to the statistic in equation (4) of McArdle and Anderson(in press), who have shown more generally how partitioning for any linear model can be done directlyfrom the distance matrix, regardless of the distancemeasure used. Another important aspect of the stat-istic described above is that, in the case of a Euclideandistance matrix calculated from only one variable,equation (3) gives the same value as the traditionalparametric univariate F-statistic.
This is proposed as a new non-parametric MANOVA
statistic that is intuitively appealing, due to its analogywith univariate ANOVA, and that is extremely relevantfor ecological applications. The results (in terms ofsums of squares, mean squares and pseudo F-ratios)obtained for individual terms in a multivariate analysis
can be interpreted in the same way as they usually arefor univariate ANOVA. The difference is that the hypoth-esis being tested for any particular term is a multivariatehypothesis.
OBTAINING A P-VALUE USINGPERMUTATIONS
The multivariate version of the F-statistic describedhere is not distributed like Fisher’s F-ratio under thenull hypothesis. This is so because (i) we do not expectthe individual variables to be normally distributed, and(ii) we do not expect that the Euclidean distance willnecessarily be used for the analysis. Even if each of thevariables were normally distributed and the Euclideandistance used, the mean squares calculated for the mul-tivariate data would not each consist of sums of inde-pendent x2 variables, because, although individualobservations are expected to be independent, individ-ual species variables are not independent of oneanother. Thus, traditional tabled P-values cannot beused. A distribution of the statistic under the nullhypothesis can be created, however, using permutationsof the observations (e.g. Edgington 1995; Manly1997). The only situation in which one could use thetraditional tabled probabilities would be if one had asingle variable that could reasonably be assumed to benormally distributed and one used Euclidean distancesfor the analysis.
Suppose the null hypothesis is true and the groupsare not really different (in terms of their compositionand/or their relative abundances of species, as measuredby the Bray–Curtis distances). If this were the case,then the multivariate observations (rows) would beexchangeable among the different groups. Thus, thelabels on the rows that identify them as belonging to aparticular group could be randomly shuffled (per-muted) and a new value of F obtained (called, say, Fp).This random shuffling and re-calculation of Fp is thenrepeated for all possible re-orderings of the rows rela-tive to the labels. This gives the entire distribution ofthe pseudo F-statistic under a true null hypothesis forour particular data. Comparing the value of F obtainedwith the original ordering of the rows to the distributioncreated for a true null by permuting the labels, a P-valueis calculated as
(No. of F p ≥ F)P 5 (4)
(Total no. of F p)
Note that we consider the original observed value of Fto be a member of the distribution of Fp under per-mutation (i.e. it is one of the possible orderings of thelabels on the rows). The usual scientific convention ofan a priori significance level of a 5 0.05 is generallyused for interpreting the significance of the result, asin other statistical tests. It is also possible to view the
36 M. J. ANDERSON
P-value as a measure of confidence concerning the nullhypothesis (Fisher 1955; Freedman & Lane 1983).
With a groups and n replicates per group, the num-ber of distinct possible outcomes for the F-statistic ina one-way test is (an)!/(a!(n!)a) (Clarke 1993). As it isusually not practical to calculate all possible permuta-tions, because of the time involved, P can be calculatedusing a large random subset of all possible permutations(Hope 1968). However, the precision of the P-value willincrease with increasing numbers of permutations.Generally, at least 1000 permutations should be donefor tests with an a-level of 0.05 and at least 5000 per-mutations should be done for tests with an a-level of0.01 (Manly 1997).
ASSUMPTIONS
The only assumption of the test is that the observations(rows of the original data matrix) are exchangeableunder a true null hypothesis. To assume exchangeabilityunder the null hypothesis is generally to assume thatthe observations are independent and that they havesimilar distributions (e.g. Boik 1987; Hayes 1996). By‘similar distributions’, I mean similar multivariate dis-persions of points, not that the points are necessarilymultivariate normal. The test described here is a testfor differences in location (means or centroids) amonggroups of multivariate observations based on thechosen distance measure. Like its univariate counter-part, which is sensitive to heterogeneity of variances,this test and its predecessors that use permutations, likeANOSIM (Clarke 1993), will also be sensitive to differ-ences in the dispersions of points, even if the locationsdo not differ.
The sensitivity of ANOSIM to differences in dispersionhas been suggested as an advantage by Clarke (1993).This is because it was introduced in the context ofdetecting environmental impacts, for which detectionof differences of any kind between control and impactedlocations is very important for environmental reasons.Here, I simply suggest that caution be exercised ininterpreting the results of tests of significance.Determining if significant differences among groupsmay be due to differences in dispersion versus differ-ences in location (or some combination of the two) isan important statistical and ecological issue. The useof permutation tests to obtain P-values does not avoidthis issue.
A useful comparative index of multivariate dispersionhas been given by Warwick and Clarke (1993). Also, aseparate permutation test for significant differences inmultivariate dispersions (after removing effects of dif-ferences in location), as an accompaniment to the non-parametric MANOVA approach given here, will bedescribed elsewhere (Anderson, Dutilleul, Lapointe &Legendre, unpubl. data).
DISTINCTION FROM TRADITIONAL TESTSTATISTICS
Although the statistic described here is sensitive to dif-ferences in the relative dispersion of points amonggroups, it takes no account of the correlations amongvariables. In traditional MANOVA, the test-statistics (suchas Wilks’ Lambda) use information contained in thebetween-group and/or within-group sample variance–covariance matrices (e.g. Table 1d, see Olson 1974;Johnson & Field 1993). The traditional MANOVA testsassume not only that the variance for each variableremains constant across different groups (i.e. thepoints in different groups have similar scatter), they alsoassume that the relationships among the variables (theircovariances or correlations) do not differ across groups.
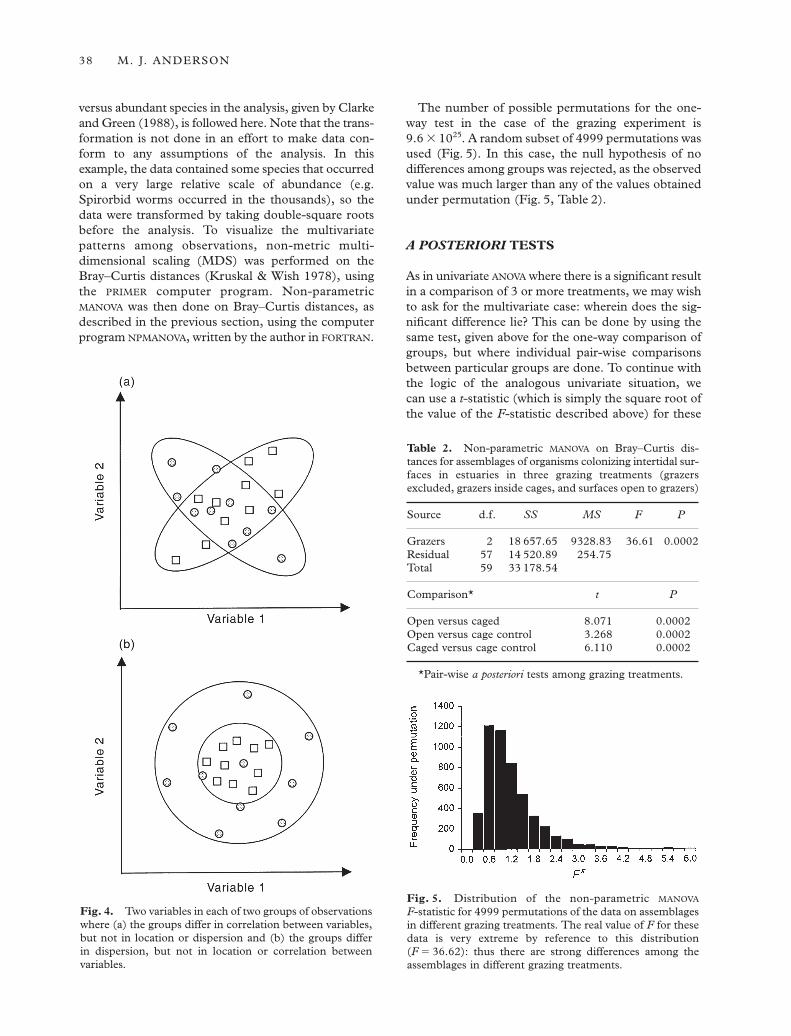
These differences in the sensitivities of differentmultivariate test statistics are shown diagrammaticallyin Fig. 4 for two variables (two dimensions). Figure 4(a)shows two groups that differ in their correlation struc-ture, but not in their variances or location. Figure 4(b)shows two groups that differ only in their dispersions,but not in their correlation or location. Although allMANOVA statistics are designed to test for differences inlocation, the traditional statistics will also be sensitiveto differences in correlations (Fig. 4a) as well as dif-ferences in dispersion (Fig. 4b). The method of non-parametric MANOVA described here will only be sensitiveto differences in dispersion (Fig. 4b). The correlationsamong variables play no role in the analysis. If differ-ences in the relationships amongst variables form ahypothesis of interest, then some other non-parametrictechniques may be relevant (e.g. Biondini et al. 1991;Krzanowski 1993).
ONE-WAY EXAMPLE: EFFECTS OFGRAZERS
Consider the following example, taken from an eco-logical study by Anderson and Underwood (1997). Thestudy was designed to test the hypothesis that grazingby gastropods affects intertidal estuarine assemblages.The experiment was done at an intertidal oyster farmfrom January to July 1994 in Quibray Bay, south ofSydney, New South Wales, Australia. Experimentalsurfaces (10 cm 3 10 cm) were enclosed in cages toexclude gastropod grazers, while other surfaces wereleft open to grazing. A third treatment consisted ofcaged areas where natural densities of grazers wereincluded. This was a control for the effect of the cageitself on assemblages. There were n 5 20 surfaces ineach of the three treatments. The numbers of indi-viduals of each of 21 taxa (invertebrates and algae) colonizing each surface were recorded.
The rationale for increasing the severity of the trans-formation to increase the relative contribution of rare
NON-PARAMETRIC MANOVA FOR ECOLOGY 37
versus abundant species in the analysis, given by Clarkeand Green (1988), is followed here. Note that the trans-formation is not done in an effort to make data con-form to any assumptions of the analysis. In thisexample, the data contained some species that occurredon a very large relative scale of abundance (e.g.Spirorbid worms occurred in the thousands), so thedata were transformed by taking double-square rootsbefore the analysis. To visualize the multivariate patterns among observations, non-metric multi-dimensional scaling (MDS) was performed on theBray–Curtis distances (Kruskal & Wish 1978), usingthe PRIMER computer program. Non-parametricMANOVA was then done on Bray–Curtis distances, asdescribed in the previous section, using the computerprogram NPMANOVA, written by the author in FORTRAN.
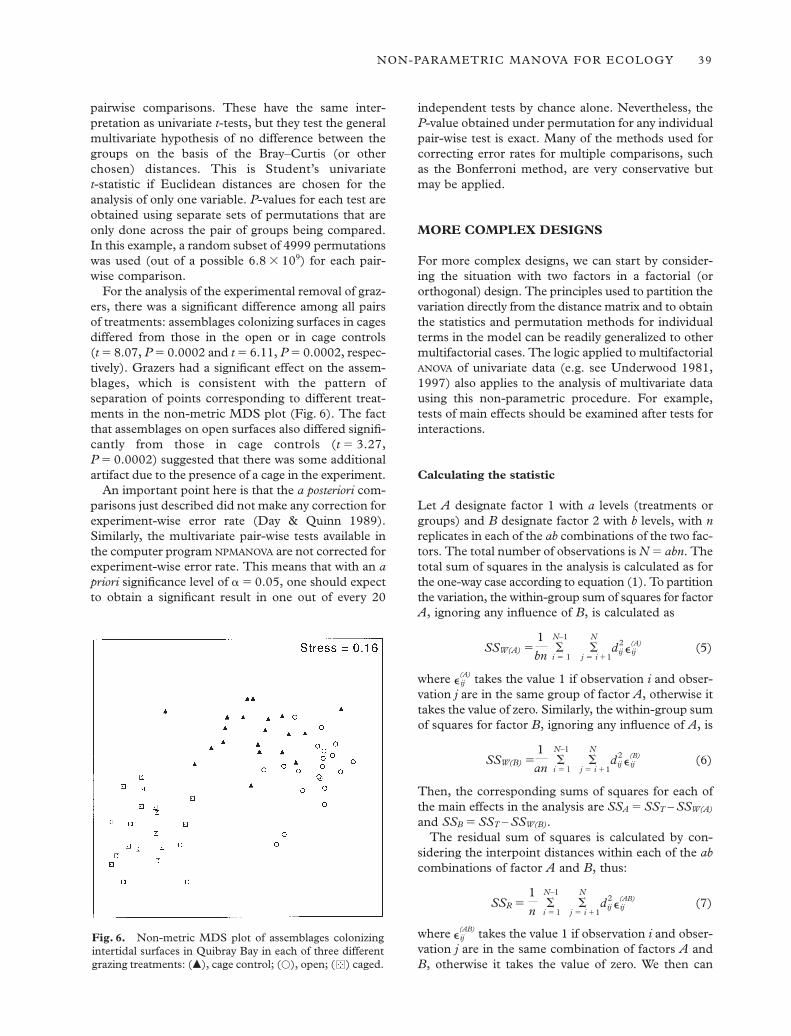
The number of possible permutations for the one-way test in the case of the grazing experiment is9.6 3 1025. A random subset of 4999 permutations wasused (Fig. 5). In this case, the null hypothesis of nodifferences among groups was rejected, as the observedvalue was much larger than any of the values obtainedunder permutation (Fig. 5, Table 2).
A POSTERIORI TESTS
As in univariate ANOVA where there is a significant resultin a comparison of 3 or more treatments, we may wishto ask for the multivariate case: wherein does the sig-nificant difference lie? This can be done by using thesame test, given above for the one-way comparison ofgroups, but where individual pair-wise comparisonsbetween particular groups are done. To continue withthe logic of the analogous univariate situation, we can use a t-statistic (which is simply the square root ofthe value of the F-statistic described above) for these
38 M. J. ANDERSON
Fig. 4. Two variables in each of two groups of observationswhere (a) the groups differ in correlation between variables,but not in location or dispersion and (b) the groups differ in dispersion, but not in location or correlation betweenvariables.
Fig. 5. Distribution of the non-parametric MANOVA
F-statistic for 4999 permutations of the data on assemblagesin different grazing treatments. The real value of F for thesedata is very extreme by reference to this distribution(F 5 36.62): thus there are strong differences among theassemblages in different grazing treatments.
Table 2. Non-parametric MANOVA on Bray–Curtis dis-tances for assemblages of organisms colonizing intertidal sur-faces in estuaries in three grazing treatments (grazersexcluded, grazers inside cages, and surfaces open to grazers)
Source d.f. SS MS F P
Grazers 2 18 657.65 9328.83 36.61 0.0002Residual 57 14 520.89 254.75Total 59 33 178.54
Comparison* t P
Open versus caged 8.071 0.0002Open versus cage control 3.268 0.0002Caged versus cage control 6.110 0.0002
*Pair-wise a posteriori tests among grazing treatments.
pairwise comparisons. These have the same inter-pretation as univariate t-tests, but they test the generalmultivariate hypothesis of no difference between thegroups on the basis of the Bray–Curtis (or otherchosen) distances. This is Student’s univariate t-statistic if Euclidean distances are chosen for theanalysis of only one variable. P-values for each test areobtained using separate sets of permutations that areonly done across the pair of groups being compared.In this example, a random subset of 4999 permutationswas used (out of a possible 6.8 3 109) for each pair-wise comparison.
For the analysis of the experimental removal of graz-ers, there was a significant difference among all pairsof treatments: assemblages colonizing surfaces in cagesdiffered from those in the open or in cage controls(t 5 8.07, P 5 0.0002 and t 5 6.11, P 5 0.0002, respec-tively). Grazers had a significant effect on the assem-blages, which is consistent with the pattern ofseparation of points corresponding to different treat-ments in the non-metric MDS plot (Fig. 6). The factthat assemblages on open surfaces also differed signifi-cantly from those in cage controls (t 5 3.27,P 5 0.0002) suggested that there was some additionalartifact due to the presence of a cage in the experiment.
An important point here is that the a posteriori com-parisons just described did not make any correction forexperiment-wise error rate (Day & Quinn 1989).Similarly, the multivariate pair-wise tests available inthe computer program NPMANOVA are not corrected forexperiment-wise error rate. This means that with an apriori significance level of a 5 0.05, one should expectto obtain a significant result in one out of every 20
independent tests by chance alone. Nevertheless, theP-value obtained under permutation for any individualpair-wise test is exact. Many of the methods used forcorrecting error rates for multiple comparisons, suchas the Bonferroni method, are very conservative butmay be applied.
MORE COMPLEX DESIGNS
For more complex designs, we can start by consider-ing the situation with two factors in a factorial (ororthogonal) design. The principles used to partition thevariation directly from the distance matrix and to obtainthe statistics and permutation methods for individualterms in the model can be readily generalized to othermultifactorial cases. The logic applied to multifactorialANOVA of univariate data (e.g. see Underwood 1981,1997) also applies to the analysis of multivariate datausing this non-parametric procedure. For example,tests of main effects should be examined after tests forinteractions.
Calculating the statistic
Let A designate factor 1 with a levels (treatments orgroups) and B designate factor 2 with b levels, with nreplicates in each of the ab combinations of the two fac-tors. The total number of observations is N 5 abn. Thetotal sum of squares in the analysis is calculated as forthe one-way case according to equation (1). To partitionthe variation, the within-group sum of squares for factorA, ignoring any influence of B, is calculated as
1SSW(A) 5 S
N–1
i 5 1SN
j 5 i 11d2
ij eij(A) (5)
bn
where eij(A) takes the value 1 if observation i and obser-
vation j are in the same group of factor A, otherwise ittakes the value of zero. Similarly, the within-group sumof squares for factor B, ignoring any influence of A, is
1SSW(B) 5 S
N–1
i 5 lSN
j 5 i 11d2
ij eij(B) (6)
an
Then, the corresponding sums of squares for each ofthe main effects in the analysis are SSA 5 SST – SSW(A)
and SSB 5 SST – SSW(B).The residual sum of squares is calculated by con-
sidering the interpoint distances within each of the abcombinations of factor A and B, thus:
1SSR 5 S
N–1
i 5 lSN
j 5 i 11d2
ij eij(AB) (7)
n
where eij(AB) takes the value 1 if observation i and obser-
vation j are in the same combination of factors A andB, otherwise it takes the value of zero. We then can
NON-PARAMETRIC MANOVA FOR ECOLOGY 39
Fig. 6. Non-metric MDS plot of assemblages colonizingintertidal surfaces in Quibray Bay in each of three differentgrazing treatments: (m), cage control; (s), open; ( ) caged.

easily obtain the sum of squares corresponding to theinteraction term: SSAB 5 SST – SSA – SSB – SSR. It maybe easier to consider the squared distances beingsummed in equations (5) through (7) by reference totheir physical location in the distance matrix itself, asillustrated in Fig. 7.
In the case of a two-factor design where one factoris nested in the other, the same general approach isused. In this case, however, there is no interaction termin the analysis and we have instead SSB(A) 5 SST – SSA
– SSR, where B(A) denotes that factor B is nested infactor A.
Having obtained appropriate sums of squares, theconstruction of the pseudo F-statistic for each term inthe analysis for non-parametric MANOVA then followsthe same rules and formulae as it would for the usualunivariate ANOVA. The construction of the F-ratiodepends on the experimental design, that is, whetherfactors are nested or factorial and whether they are fixedor random, exactly as for univariate ANOVA (e.g.Underwood 1981, 1997; Winer et al. 1991).
Doing the permutations
The method of permutation required to obtain an exacttest is not so simple if there is more than one factor inthe design. The choice of an appropriate permutationmethod is not trivial and should be considered care-fully for each term in the model. Indeed, the lack ofexact tests or knowledge of how the available approxi-mate permutation tests might behave for complexmodels has been a sticking point in the developmentof multivariate non-parametric methods (e.g. Crowley1992; Clarke 1993). To construct exact tests, twoimportant issues must be considered (Anderson & terBraak, unpublished data). First, which units should bepermuted (i.e. what are exchangeable under the nullhypothesis) and second, should any restrictions beimposed on the permutations to account for otherfactors in the design?
In many important situations, such as tests of inter-actions, no exact permutation test can be done. Also,there are times when the exact test imposes so many
40 M. J. ANDERSON
Fig. 7. Schematic diagram of the interpoint distances usedto partition the variability in the multivariate data set and tocalculate the sum of squares for each term in a two-factororthogonal design (each factor has two groups or levels). (a)SSW(A) 5 sum of squared distances within groups of A (j),divided by (bn). (b) SSW(B) 5 sum of squared distances within groups of B ( ), divided by (an). (c) SSR 5 sum ofsquared distances within combinations of AB ( ), dividedby (n) (residual sum of squares). SST 5 sum of squared distances in the total half matrix, divided by (abn), SSA 5 SST – SSW(A), SSB 5 SST – SSW(B), SSAB 5 SST – SSA –SSB – SSR.
restrictions as to render the test meaningless, due tothere being too few possible permutations left. In thesecases, approximate permutation tests should be used,of which there are several alternatives, includingpermutation of residuals and permutation of raw dataacross all terms in the analysis (e.g. Freedman & Lane1983; ter Braak 1992; Manly 1997). Some empiricalcomparisons of these methods are provided byGonzalez and Manly (1998) and Anderson andLegendre (1999).
ECOLOGICAL EXAMPLES
Two-way factorial design
The first example is from an experiment in MiddleHarbour (part of Sydney Harbour) to test for the effectof shade and proximity to the seafloor on assemblagesof invertebrates and algae colonizing subtidal hard sur-faces near marinas (Glasby 1999). The experiment wasa two-way crossed (orthogonal) design with n 5 4 repli-cate settlement plates (15 cm 3 15 cm sandstone)either far from or near to the seafloor (the factor of‘position’; all plates were at a similar depth of approxi-mately 2 m below low water) and in one of three shading treatments: (i) shade (an opaque plexiglassroof), (ii) a procedural control (a clear plexiglass roof),and (iii) no shade. Organisms colonizing the plates after33 weeks were counted and a total of 46 taxa wereincluded in the analyses. Organisms that occurred only once across the entire data set were not included.Non-parametric MANOVA was done on Bray–Curtis distances calculated from double-root transformed datausing the FORTRAN program NPMANOVA. The samplesize was reasonably small for this study (n < 5), so the
test was done using unrestricted permutation of rawdata (e.g. Manly 1997; Gonzalez & Manly 1998) with4999 random permutations. Similar results wereobtained using permutation of residuals under areduced model (not shown).
There was no significant interaction of shade andposition, but both main effects were significant(Table 3, Fig. 8). It was then of interest to compare thegroups corresponding to different shading treatmentsusing a posteriori tests (Table 3). It was not necessaryto do this for the effect of position, because this factoronly had two groups. Assemblages of organisms onsettlement plates near the bottom were extremely differ-ent from those far away from the bottom (Fig. 8). Also,assemblages on shaded plates were significantly differ-ent from those on either the procedural control or onunshaded plates, which themselves did not differ(Table 3, Fig. 8). This analysis also shows how the effectof position relative to the bottom was much greater thanthe effect of shading on assemblages in this experiment(compare the values of their mean squares in Table 3).The non-parametric approach advocated here allowstests of significance, but it also allows relative sizes ofeffects to be compared directly through the partitioningof the variation and examination of mean squares.
Three-way design, including nesting
The second example comes from an experiment to testthe hypothesis that the size of a patch available for
NON-PARAMETRIC MANOVA FOR ECOLOGY 41
Table 3. Non-parametric MANOVA on Bray–Curtis dis-tances for assemblages of organisms colonizing subtidal sand-stone settlement panels after 33 weeks in an estuary atdifferent distances from the seafloor (positions either near orfar) and in three different shading treatments
Source d.f. SS MS F P
Position 1 5595.40 5595.40 13.536 0.0002Shade 2 3566.44 1783.22 4.314 0.0006Position 3 2 1238.94 619.47 1.499 0.1394
shadeResidual 18 7440.66 413.37Total 23 17 841.43
Comparison* t P
Shade versus control 1.783 0.0154Shade versus no shade 1.987 0.0018Control versus no shade 0.866 0.5560
*Pair-wise a posteriori tests among shading treatments.
Fig. 8. Two-factor non-metric MDS plot of subtidal assemblages colonizing sandstone settlement plates after 33 weeks in Middle Harbour that were either near to or farfrom the seafloor and in one of three shading treatments. (r),Shaded; ( ), control; (s), no shade; 1, far from the sea floor;2, close to the sea floor.
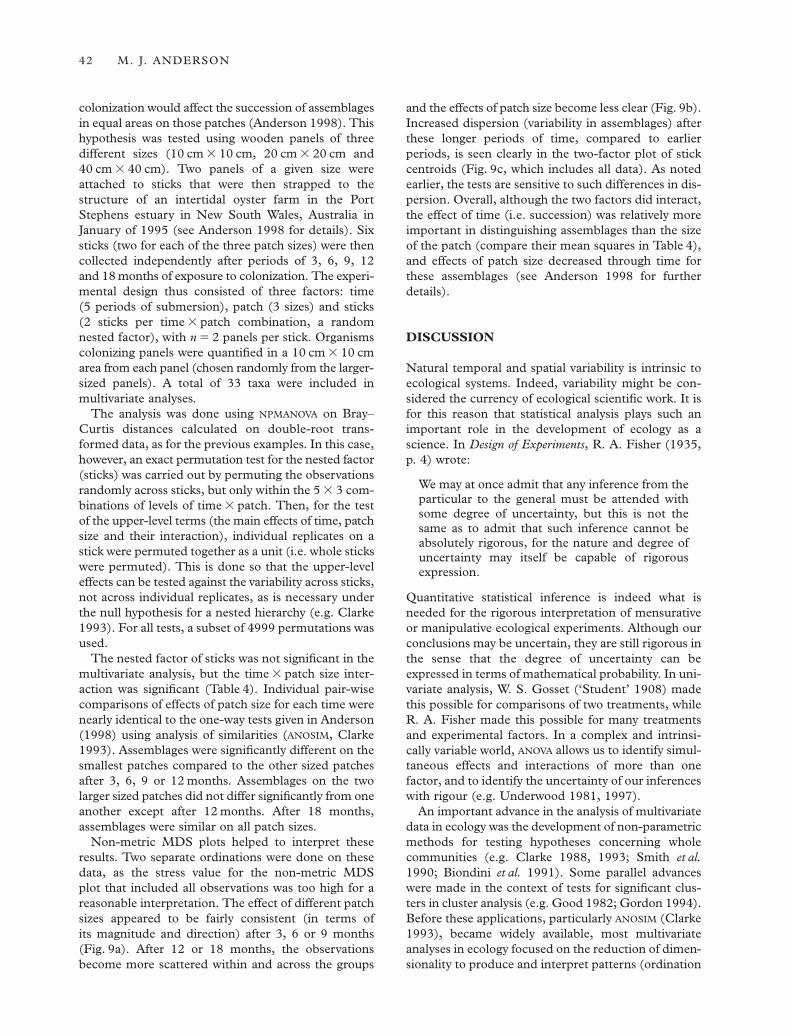
colonization would affect the succession of assemblagesin equal areas on those patches (Anderson 1998). Thishypothesis was tested using wooden panels of three different sizes (10 cm 3 10 cm, 20 cm 3 20 cm and40 cm 3 40 cm). Two panels of a given size wereattached to sticks that were then strapped to the structure of an intertidal oyster farm in the PortStephens estuary in New South Wales, Australia inJanuary of 1995 (see Anderson 1998 for details). Sixsticks (two for each of the three patch sizes) were thencollected independently after periods of 3, 6, 9, 12 and 18 months of exposure to colonization. The experi-mental design thus consisted of three factors: time (5 periods of submersion), patch (3 sizes) and sticks(2 sticks per time 3 patch combination, a randomnested factor), with n 5 2 panels per stick. Organismscolonizing panels were quantified in a 10 cm 3 10 cmarea from each panel (chosen randomly from the larger-sized panels). A total of 33 taxa were included in multivariate analyses.
The analysis was done using NPMANOVA on Bray–Curtis distances calculated on double-root trans-formed data, as for the previous examples. In this case,however, an exact permutation test for the nested factor(sticks) was carried out by permuting the observationsrandomly across sticks, but only within the 5 3 3 com-binations of levels of time 3 patch. Then, for the testof the upper-level terms (the main effects of time, patchsize and their interaction), individual replicates on astick were permuted together as a unit (i.e. whole stickswere permuted). This is done so that the upper-leveleffects can be tested against the variability across sticks,not across individual replicates, as is necessary underthe null hypothesis for a nested hierarchy (e.g. Clarke1993). For all tests, a subset of 4999 permutations wasused.
The nested factor of sticks was not significant in themultivariate analysis, but the time 3 patch size inter-action was significant (Table 4). Individual pair-wisecomparisons of effects of patch size for each time werenearly identical to the one-way tests given in Anderson(1998) using analysis of similarities (ANOSIM, Clarke1993). Assemblages were significantly different on thesmallest patches compared to the other sized patchesafter 3, 6, 9 or 12 months. Assemblages on the twolarger sized patches did not differ significantly from oneanother except after 12 months. After 18 months,assemblages were similar on all patch sizes.
Non-metric MDS plots helped to interpret theseresults. Two separate ordinations were done on thesedata, as the stress value for the non-metric MDS plot that included all observations was too high for areasonable interpretation. The effect of different patchsizes appeared to be fairly consistent (in terms of its magnitude and direction) after 3, 6 or 9 months(Fig. 9a). After 12 or 18 months, the observationsbecome more scattered within and across the groups
and the effects of patch size become less clear (Fig. 9b).Increased dispersion (variability in assemblages) afterthese longer periods of time, compared to earlierperiods, is seen clearly in the two-factor plot of stickcentroids (Fig. 9c, which includes all data). As notedearlier, the tests are sensitive to such differences in dis-persion. Overall, although the two factors did interact,the effect of time (i.e. succession) was relatively moreimportant in distinguishing assemblages than the sizeof the patch (compare their mean squares in Table 4),and effects of patch size decreased through time forthese assemblages (see Anderson 1998 for furtherdetails).
DISCUSSION
Natural temporal and spatial variability is intrinsic toecological systems. Indeed, variability might be con-sidered the currency of ecological scientific work. It isfor this reason that statistical analysis plays such animportant role in the development of ecology as ascience. In Design of Experiments, R. A. Fisher (1935,p. 4) wrote:
We may at once admit that any inference from theparticular to the general must be attended withsome degree of uncertainty, but this is not thesame as to admit that such inference cannot beabsolutely rigorous, for the nature and degree ofuncertainty may itself be capable of rigorousexpression.
Quantitative statistical inference is indeed what isneeded for the rigorous interpretation of mensurativeor manipulative ecological experiments. Although ourconclusions may be uncertain, they are still rigorous inthe sense that the degree of uncertainty can beexpressed in terms of mathematical probability. In uni-variate analysis, W. S. Gosset (‘Student’ 1908) madethis possible for comparisons of two treatments, whileR. A. Fisher made this possible for many treatmentsand experimental factors. In a complex and intrinsi-cally variable world, ANOVA allows us to identify simul-taneous effects and interactions of more than onefactor, and to identify the uncertainty of our inferenceswith rigour (e.g. Underwood 1981, 1997).
An important advance in the analysis of multivariatedata in ecology was the development of non-parametricmethods for testing hypotheses concerning wholecommunities (e.g. Clarke 1988, 1993; Smith et al.1990; Biondini et al. 1991). Some parallel advanceswere made in the context of tests for significant clus-ters in cluster analysis (e.g. Good 1982; Gordon 1994).Before these applications, particularly ANOSIM (Clarke1993), became widely available, most multivariateanalyses in ecology focused on the reduction of dimen-sionality to produce and interpret patterns (ordination
42 M. J. ANDERSON
methods) and the use of numerical strategies for placingobservations into natural groups (clustering). Thesemethods, although extremely useful towards theirpurpose, do not rigorously express the nature anddegree of uncertainty concerning a priori hypotheses.Methods like Mantel’s test (Mantel 1967), ANOSIM
(Clarke 1993) and multiresponse permutation pro-cedures (Mielke et al. 1976) allow such rigorousprobabilistic statements to be made for multivariateecological data.
The drawback to such non-parametric tests is thatthey cannot easily be extended to the multifactorialdesigns so common now in ecological studies. Twosticking points prevented this: (i) the lack of a gener-alized statistic for partitioning variation, and (ii) the lackof appropriate permutation methods (e.g. Clarke 1993;Legendre & Anderson 1999). Although traditional test-statistics used for MANOVA allow partitioning, their restrictive assumptions have prevented theireffective use in ecology. The method of distance-based redundancy analysis (Legendre & Anderson
NON-PARAMETRIC MANOVA FOR ECOLOGY 43
Table 4. Non-parametric MANOVA on Bray–Curtis dis-tances for assemblages of organisms colonizing woodensettlement panels of three different sizes after 3, 6, 9, 12 or18 months on an intertidal oyster farm
Source d.f. SS MS F P
Time 4 30 305.71 7576.43 20.50 0.0002Patch Size 2 6414.99 3207.49 8.68 0.0002Time 3 patch 8 6224.03 778.004 2.10 0.0062Sticks (time 3 15 5544.66 369.64 1.28 0.3384
patch)Residual 30 8697.09 289.90Total 59 57 186.48
3 6 9 12 18Comparison months months months months months
Small versus 2.24* 1.86* 1.48* 2.00* 1.38medium
Small versus 2.30* 2.87* 2.38* 2.54* 3.02*large
Medium versus 1.49 1.47 1.69 1.75* 1.43large
*P < 0.05; pair-wise a posteriori tests among patch sizeswithin each time using the t-statistic. Sticks were ignored inthe pair-wise tests. There were 35 possible permutations foreach.
Fig. 9. Two-factor non-metric MDS plots of assemblagescolonizing intertidal wooden settlement panels of three dif-ferent sizes for (a) periods of 3, 6 or 9 months and (b) peri-ods of 12 or 18 months for raw data and (c) where centroidswere plotted corresponding to each stick across all combi-nations of time 3 patch size. The points corresponding toassemblages after particular times of submersion (numbersindicate the period in months) have been outlined for clar-ity. (d), Small; (h), medium; (m), large.
1999) largely solved these issues, but it has many rather complicated steps and involves the use of acorrection constant to distances. Although thiscorrection does not adversely affect the test (generallymaking it more conservative, if anything), accurateP-values are not given by this method in the case ofanything other than a one-factor design (McArdle &Anderson, in press).
The method presented here has, in some sense,combined the best of both worlds. Like the traditionaltest-statistics, it can partition variation according to any ANOVA design. Like the most flexible non-parametric methods, it can be based on any sym-metric dissimilarity or distance measure (or theirranks) and provides a P-value using appropriate per-mutation methods. That is, one can still choose a rel-evant transformation and an appropriate distancemeasure (or use ranks of distances), consistent with themethod of ordination used to visualize patterns. Byusing permutations, the test requires no specificassumption concerning the number of variables or thenature of their individual distributions or correlations.The statistic used is analogous to Fisher’s F-ratio andis constructed from sums of squared distances (or dissimilarities) within and between groups. Anotherfeature of this statistic is that it is equal to to Fisher’soriginal F-ratio in the case of one variable and whenEuclidean distances are used.
It is perhaps important to point out that theBray–Curtis measure of dissimilarity may or may notbe the most appropriate measure to use in any givensituation. A point still commonly ignored is thatBray–Curtis and related measures, such as Kulczynski’scoefficient, will tend to under-estimate true ecologicaldistances when distances become large (i.e. whenobservations have very few species in common), as determined by simulations (Faith et al. 1987; Belbin 1991). The Bray–Curtis measure may thereforeonly be useful insofar as it will produce reasonableecological ordinations, through the ranks used forMDS. In light of this issue, Faith (1990) proposeddoing MANOVA on ordination scores obtained fromMDS.
An analysis based only on ordination scores will omitsome portion of the ecological information containedin the original distance matrix and will depend on thenumber of dimensions chosen for the MDS (Clarke1993). The severity of this potential problem willobviously increase with increases in the stress valueassociated with an MDS plot. The actual amount and the kind of information lost in reducing dimensionsusing MDS are generally unknown and will depend on the particular data set. Also, any subsequentstatistical inferences on ordination scores (usingtraditional MANOVA, as described in Faith 1990; orbased on permutation tests) would be limited to points in the ordination plots, rather than being applic-able to the original observations.
It is not possible to identify a single ‘best’ distancemeasure for ecological data. The method describedhere may be used with any distance measure chosen(or on ranks of distances). It is useful to have the flex-ibility to choose a distance measure appropriate for thedata and hypothesis being tested. Although theBray–Curtis measure has now become commonplacein ecological studies (perhaps due to its availability inthe PRIMER computer program, or due to its intuitiveinterpretation as ‘percentage difference’, or due to theresults presented in Faith et al. 1987), there are stillmany rivals. Over 60 measures of similarity or dissim-ilarity have been described, with very few actual com-parisons of their performance with different kinds of ecological data (see Lamont & Grant 1979;Legendre & Legendre 1998). This is undoubtedly anarea needing further research.
The approach advocated here is that multifactorialanalysis of variance, as successfully applied to univariatedata in ecology (e.g. Underwood 1981, 1997), can andshould also be applied to multivariate data for testinghypotheses in a logical and rigorous way. It stands toreason that the developments in experimental designfor ecology that require multifactorial ANOVA, in orderto, for example, avoid pseudo-replication (Hurlbert1984), test for generality (Beck 1997) or test for envir-onmental impact (e.g. Green 1979, 1993; Underwood1993; Glasby 1997), should be incorporated into multivariate analysis. The method described hereallows that to happen, but within a framework that isgeneral enough to suit our need for few assumptionsand flexibility in the multivariate analysis of ecologicaldata.
ACKNOWLEDGEMENTS
I am indebted to those who have worked on and devel-oped multivariate methods and permutation tests thathave led to the ideas in this manuscript, including K. R. Clarke, E. S. Edgington, R. A. Fisher, P. Legendre, B. F. J. Manly, N. Mantel, B. H. McArdle,L. Orlóci, V. D. P. Pillar, E. P. Smith, and C. J. F. terBraak. I also owe a great deal to A. J. Underwood forhis work in the statistical analysis of ecological experi-ments using ANOVA, which inspired my pursuit of thistopic for multivariate analysis. T. Glasby kindlyprovided data for the two-way factorial example. ThePRIMER computer program was provided courtesy of M. R. Carr and K. R. Clarke, Plymouth MarineLaboratories, UK. My colleagues at the SpecialResearch Centre for Ecological Impacts of CoastalCities provided logistic support, tested out the com-puter program and commented on earlier versions ofthe manuscript. The computer program NPMANOVA isavailable from the author. This research was supportedby a U2000 Post-doctoral Fellowship at the Universityof Sydney.
44 M. J. ANDERSON
REFERENCES
Anderson M. J. (1998) Effects of patch size on colonisation inestuaries: revisiting the species-area relationship. Oecologia118, 87–98.
Anderson M. J. & Clements A. (in press) Resolving environmentaldisputes: a statistical method for choosing among competingcluster models. Ecol. Applic.
Anderson M. J. & Legendre P. (1999) An empirical comparisonof permutation methods for tests of partial regressioncoefficients in a linear model. J. Stat. Comput. Simul. 62,271–303.
Anderson M. J. & Underwood A. J. (1994) Effects of substratumon the recruitment and development of an intertidal estuar-ine fouling assemblage. J. Exp. Mar. Biol. Ecol. 184, 217–36.
Anderson M. J. & Underwood A. J. (1997) Effects of gastropodgrazers on recruitment and succession of an estuarine assem-blage: a multivariate and univariate approach. Oecologia 109,442–53.
Bartlett M. S. (1939) A note on tests of significance in multi-variate analysis. Proc. Camb. Philos. Soc. 35, 180–5.
Beck M. W. (1997) Inference and generality in ecology: currentproblems and an experimental solution. Oikos 78, 265–73.
Belbin L. (1991) Semi-strong hybrid scaling, a new ordinationalgorithm. J. Veg. Sci. 2, 491–6.
Biondini M. E., Mielke P. W. & Redente E. F. (1991) Permutationtechniques based on Euclidean analysis spaces: a new andpowerful statistical method for ecological research. In:Computer Assisted Vegetation Analysis (eds E. Feoli & L.Orlóci) pp. 221–40. Kluwer Academic Publishers,Dordrecht.
Boik R. J. (1987) The Fisher–Pitman permutation test: a non-robust alternative to the normal theory F test when variancesare heterogeneous. Br. J. Math. Stat. Psychol. 40, 26–42.
Bray J. R. & Curtis J. T. (1957) An ordination of the upland forestcommunities of southern Wisconsin. Ecol. Monogr. 27,325–49.
Caliñski T. & Harabasz J. (1974) A dendrite method for clusteranalysis. Commun. Stat. 3, 1–27.
Chapman M. G., Underwood A. J. & Skilleter G. A. (1995)Variability at different spatial scales between a subtidal assem-blage exposed to discharge of sewage and two control sites.J. Exp. Mar. Biol. Ecol. 189, 103–22.
Clarke K. R. (1988) Detecting change in benthic communitystructure. In: Proceedings XIVth International BiometricConference, Namur: Invited Papers, pp. 131–42. SociétéAdolphe Quetelet, Gembloux.
Clarke K. R. (1993) Non-parametric multivariate analyses ofchanges in community structure. Aust. J. Ecol. 18, 117–43.
Clarke K. R. & Green R. H. (1988) Statistical design and analysisfor a ‘biological effects’ study. Mar. Ecol. Prog. Ser. 46,213–26.
Crowley P. H. (1992) Resampling methods for computation-intensive data analysis in ecology and evolution. Ann. Rev.Ecol. Syst. 23, 405–47.
Day R. W. & Quinn G. P. (1989) Comparison of treatments afteran analysis of variance. Ecol. Monogr. 59, 433–63.
Edgington E. S. (1995) Randomization Tests, 3rd edn. MarcelDekker, New York.
Excoffier L., Smouse P. E. & Quattro J. M. (1992) Analysis ofmolecular variance inferred from metric distances amongDNA haplotypes: application to human mitochondrial DNArestriction data. Genetics 131, 479–91.
Faith D. P. (1990) Multivariate methods for biological monitoringbased on community structure. In: The Australian Society of
Limnology 29th Congress, p. 17 (Abstract). Alligator RiversRegion Research Institute.
Faith D. P., Dostine P. L. & Humphrey C. L. (1995) Detectionof mining impacts on aquatic macroinvertebrate communi-ties: results of a disturbance experiment and the design of amultivariate BACIP monitoring program at Coronation Hill,N. T. Aust. J. Ecol. 20, 167–80.
Faith D. P., Minchin P. R. & Belbin L. (1987) Compositionaldissimilarity as a robust measure of ecological distance.Vegetatio 69, 57–68.
Fisher R. A. (1935) Design of Experiments. Oliver & Boyd,Edinburgh.
Fisher R. A. (1936) The use of multiple measurements in taxo-nomic problems. Ann. Eugen. 7, 179–88.
Fisher R. A. (1955) Statistical methods and scientific induction.J. Roy. Stat. Soc. 17, 69–78.
Freedman D. & Lane D. (1983) A nonstochastic interpretationof reported significance levels. J. Bus. Econ. Stat. 1, 292–8.
Gaston K. J. & McArdle B. H. (1994) The temporal variabilityof animal abundances: measures, methods and patterns. Phil.Trans. Roy. Soc. Lond. 345, 335–58.
Glasby T. M. (1997) Analysing data from post-impact studiesusing asymmetrical analyses of variance: a case study ofepibiota on marinas. Aust. J. Ecol. 22, 448–59.
Glasby T. M. (1999) Interactive effects of shading and proximityto the seafloor on the development of subtidal epibioticassemblages. Mar. Ecol. Prog. Ser. 190, 113–24.
Gonzalez L. & Manly B. F. J. (1998) Analysis of variance by randomization with small data sets. Environmetrics 9,53–65.
Good I. J. (1982) An index of separateness of clusters and apermutation test for its significance. J. Stat. Comput. Simul.15, 81–4.
Gordon A. D. (1994) Identifying genuine clusters in a classifi-cation. Comput. Stat. Data Anal. 18, 561–81.
Gower J. C. (1966) Some distance properties of latent root andvector methods used in multivariate analysis. Biometrika 53,325–38.
Gray J. S., Clarke K. R., Warwick R. M. & Hobbs G. (1990)Detection of initial effects of pollution on marine benthos:an example from the Ekofisk and Eldfisk oilfields, North Sea.Mar. Ecol. Prog. Ser. 66, 285–99.
Green R. H. (1979) Sampling Design and Statistical Methods forEnvironmental Biologists. Wiley, New York.
Green R. H. (1993) Application of repeated measures designs inenvironmental impact and monitoring studies. Aust. J. Ecol.18, 81–98.
Hajdu L. J. (1981) Graphical comparison of resemblance meas-ures in phytosociology. Vegetatio 48, 47–59.
Hayes A. F. (1996) Permutation test is not distribution free.Psychol. Methods 1, 184–98.
Hope A. C. A. (1968) A simplified Monte Carlo significance testprocedure. J. Roy. Stat. Soc. 30, 582–98.
Hotelling H. (1931) The generalization of Student’s ratio. Ann.Math. Stat. 2, 360–78.
Hubert L. & Schultz J. (1976) Quadratic assignment as a gen-eral data analysis strategy. Br. J. Math. Stat. Psychol. 29,190–241.
Hurlbert S. H. (1984) Pseudoreplication and the design of eco-logical field experiments. Ecol. Monogr. 54, 187–211.
Johnson C. R. & Field C. A. (1993) Using fixed-effects modelmultivariate analysis of variance in marine biology andecology. Oceanogr. Mar. Biol. Ann. Rev. 31, 177–221.
Kelaher B. P., Chapman M. G. & Underwood A. J. (1998)Changes in benthic assemblages near boardwalks in
NON-PARAMETRIC MANOVA FOR ECOLOGY 45
temperate urban mangrove forests. J. Exp. Mar. Biol. Ecol.228, 291–307.
Kendall M. G. & Stuart A. (1963) The Advanced Theory ofStatistics, Vol. 1, 2nd edn. Charles Griffith, London.
Kruskal J. B. & Wish M. (1978) Multidimensional Scaling. SagePublications, Beverly Hills.
Krzanowski W. J. (1993) Permutational tests for correlationmatrices. Statistics and Computing 3, 37–44.
Kulczynski S. (1928) Die Pflanzenassoziationen der Pieninen.Bull. Int. Acad. Pol. Sci. Lett. Cl. Sci. Math. Nat. Ser. B,(Suppl. II) 1927, 57–203.
Lamont B. B. & Grant K. J. (1979) A comparison of twenty-onemeasures of site dissimilarity. In: Multivariate Methods inEcological Work (eds L. Orloci, C. R. Rao & W. M. Stiteler)pp. 101–26. International Co-operative Publishing House,Fairland.
Lawley D. N. (1939) A generalization of Fisher’s IX test.Biometrika 30, 180–7 (Corrections in Biometrika 30, 467–9).
Legendre P. & Anderson M. J. (1999) Distance-based redundancyanalysis: testing multispecies responses in multifactorial eco-logical experiments. Ecol. Monogr. 69, 1–24.
Legendre P. & Legendre L. (1998) Numerical Ecology, 2nd Englishedn. Elsevier Science, Amsterdam.
McArdle B. H. & Anderson M. J. (in press) Fitting multivariatemodels to community data: a comment on distance-basedredundancy analysis. Ecology.
Manly B. F. J. (1997) Randomization, Bootstrap and Monte CarloMethods in Biology, 2nd edn. Chapman & Hall, London.
Mantel N. (1967) The detection of disease clustering and ageneralized regression approach. Cancer Res. 27, 209–20.
Mantel N. & Valand R. S. (1970) A technique of nonparametricmultivariate analysis. Biometrics 26, 547–58.
Mardia K. V. (1971) The effect of non-normality on some multi-variate tests and robustness to nonnormality in the linearmodel. Biometrika 58, 105–21.
Mardia K. V., Kent J. T. & Bibby J. M. (1979) MultivariateAnalysis. Academic Press, London.
Mielke P. W., Berry K. J. & Johnson E. S. (1976) Multi-responsepermutation procedures for a priori classifications. Commun.Stat. Theory Methods 5 (14), 1409–24.
Odum E. P. (1950) Bird populations of the Highlands (NorthCarolina) Plateau in relation to plant succession and avianinvasion. Ecology 31, 587–605.
Oliver I. & Beattie A. J. (1996) Designing a cost-effective inver-tebrate survey: a test of methods for rapid assessment of bio-diversity. Ecol. App. 6, 594–607.
Olson C. L. (1974) Comparative robustness of six tests in multi-variate analysis of variance. J. Am. Stat. Assoc. 69, 894–908.
Pillai K. C. S. (1955) Some new test criteria in multivariateanalysis. Ann. Math. Stat. 26, 117–21.
Pillar V. D. P. & Orlóci L. (1996) On randomization testing invegetation science: multifactor comparisons of relevé groups.J. Veg. Sci. 7, 585–92.
Quinn G. P., Lake P. S. & Schreiber S. G. (1996) Littoral benthosof a Victorian lake and its outlet stream: spatial and temp-oral variation. Aust. J. Ecol. 21, 292–301.
Seber G. A. F. (1984) Multivariate Observations. John Wiley andSons, New York.
Skilleter G. A. (1996) Validation of rapid assessment of damagein urban mangrove forests and relationships with Molluscanassemblages. J. Mar. Biol. Ass. UK 76, 701–16.
Smith E. P., Pontasch K. W. & Cairns J. (1990) Communitysimilarity and the analysis of multispecies environmentaldata: a unified statistical approach. Water Res. 24, 507–14.
Student. (1908) The probable error of a mean. Biometrika 6,1–25.
ter Braak C. J. F. (1992) Permutation versus bootstrap signifi-cance tests in multiple regression and ANOVA. In:Bootstrapping and Related Techniques (eds K. H. Jöckel, G. Rothe & W. Sendler) pp. 79–86. Springer-Verlag, Berlin.
Underwood A. J. (1981) Techniques of analysis of variance inexperimental marine biology and ecology. Oceanogr. Mar.Biol. Ann. Rev. 19, 513–605.
Underwood A. J. (1993) The mechanics of spatially replicatedsampling programmes to detect environmental impacts in avariable world. Aust. J. Ecol. 18, 99–116.
Underwood A. J. (1997) Experiments in Ecology: Their LogicalDesign and Interpretation Using Analysis of Variance.Cambridge University Press, Cambridge.
Underwood A. J. & Chapman M. G. (1998) A method foranalysing spatial scales of variation in composition of assem-blages. Oecologia 107, 570–8.
Warwick R. M., Carr M. R., Clarke K. R., Gee J. M. & GreenR. H. (1988) A mesocosm experiment on the effects ofhydrocarbon and copper pollution on a sublittoral soft-sediment meiobenthic community. Mar. Ecol. Prog. Ser. 46,181–91.
Warwick R. M. & Clarke K. R. (1993) Increased variability as asymptom of stress in marine communities. J. Exp. Mar. Biol.Ecol. 172, 215–26.
Wilks S. S. (1932) Certain generalizations in the analysis ofvariance. Biometrika 24, 471–94.
Winer B. J., Broan D. R. & Michels K. M. (1991) StatisticalPrinciples in Experimental Design, 3rd edn. McGraw-Hill,Sydney.
46 M. J. ANDERSON