a new cooperative anomaly detection method for stacker
TRANSCRIPT

Research ArticleA New Cooperative Anomaly DetectionMethod for Stacker Running Track of AutomatedStorage and Retrieval System in Industrial Environment
Darong Huang Mengting Lin Lanyan Ke and Zhenping Deng
College of Information Science and Engineering Chongqing Jiaotong University Chongqing 400074 China
Correspondence should be addressed to Mengting Lin 622170070012mailscqjtueducn
Received 29 March 2018 Revised 28 September 2018 Accepted 25 October 2018 Published 11 November 2018
Academic Editor Daniel Morinigo-Sotelo
Copyright copy 2018 Darong Huang et al This is an open access article distributed under the Creative Commons Attribution Licensewhich permits unrestricted use distribution and reproduction in any medium provided the original work is properly cited
Considering the complexity and the criticality of the stacker equipment in order to solve the problem that the stop accuracy ofthe stacker reduces or even fails to work due to abrasion of the running rail this paper proposes a cooperative detection methodbased on Pulse Coupling Neural Network (PCNN) and wavelet transform theory to detect the abnormal points of the stackerrunning rail in industrial environment by analyzing the variation signals First of all considering the fact that the data is mixedup with noises because of the environment at the site and the possibility of the data acquisition equipment breaking down a noisereductionmethod for the vibration signal data of stacker is constructed based onPCNNThen the basic theory ofwavelet transformis introduced and then the rules of judging anomaly points on stackersrsquo running tracks are discussed based on wavelet transformIn addition a cooperative detection method based on PCNN and wavelet transform theory is carried out based on the space-time distribution feature of the vibration of the stacker orbits in the industrial environment Then the rationality of the proposedalgorithm is verified by simulation through data provided by State Grid Measuring Center of ChinaThis paper constructs a modelof the abnormal point detection of the stackers in an industrial environmentThe experimental simulation and example simulationshow that the cooperative detection method based on PCNN and wavelet transform theory can effectively detect and locate theanomaly points of the stacker running tracks The expansibility in engineering applications is promising Lastly some conclusionsare discussed
1 Introduction
As is known to all the stacker is a key equipment ofautomated storage and retrieval system (ASRS) in industrialenvironment In practice scene of ASRS the main functionof the stacker is to grab move and stack goods from oneshelf to another Thus the stability of stacker running trackwill influence the accuracy of grabbing and moving goods inpractical engineering As one of the key components of thestacker equipment the track of the stacker is divided intoupper and lower track In fact the stacking machine wouldwear crack sag and bulge by long time running And thesedefects will reduce the accuracy of the stacking machine Ifthe field engineer cannot detect and repair the defect as soonas possible they may even cause the whole equipment to be
worn and shut down So how to detect the anomaly point ofstacker running rail is very important for safety performanceof the whole system
In anomaly detection domestic and foreign researchershave made a lot of progress in all aspects Since the 1980sthe anomaly detection problemhas beenwidely researched inthe field of statistics For examples [1] presented an anomalydetection algorithm based on statistical theory Unfortu-nately practice has proved that the computing results of thestatisticalmethod are not ideal because the distribution char-acteristics of the data must be known in advance Obviouslythe shortage limits the application scope of the method Tosolve the defect some improved detection algorithms wereput forward combining with distance in [2 3] The obviouscharacteristic of the improved algorithm is required to have
HindawiJournal of Control Science and EngineeringVolume 2018 Article ID 1938490 12 pageshttpsdoiorg10115520181938490
2 Journal of Control Science and Engineering
a lot of domain knowledge of real systems or equipmentHowever it is known to us all that the running performanceof real systems or equipment is affected by various factorsTherefore it is difficult to determine the input parametersof the algorithm In other words it has some disadvantagessuch as instability and high algorithm complexity Thus oncethe testing data is incomplete it is difficult to determinethe degree of abnormal [4] In particular when the datahas features such as high-dimensional and sparseness theperformance of the algorithm is very poor In order to solvethe problem caused by sparse data Rastogi and Ramaswamyproposed an improved algorithm based on density in [5]The method can avoid the limitation of the dependence ofdistance to a certain context To better handle testing datato find the abnormal data point some detecting ideas basedon depth continue to appear For instance some researcherspresented the anomaly detection algorithm based on depthto mark each record as a point in the 119896 dimension space Infact the typical DEEPLOC algorithm was proposed by Struyfand Rousseeuw in [6] One big advantage of the algorithmis that the depth value of each point may be given accordingto the definition of depth The detection rule is that a recordwith a smaller depth is more likely to be an anomaly pointthan a larger one Thus once the data set is organized by thedepth value the algorithm only needs to carry out the outlierdetection on the lower layer of the depth value Meanwhilethe outlier detection is not required in the record on a layerwith a large depth value
Furthermore Zhou S and Xu W have constructed thelocal anomaly detection algorithm based on the deviation in[7] The algorithm and rule may solve the problem that theexisting local anomaly detection algorithms do not performdata object partition But in real running process of the sys-tems the high dimensional test data would lead to increasedcomputational complexity [8] So the trick to find out theabnormal point from high-dimension data set is to reduceits dimensionality Aiming at the high dimensionality of thedata set some researchers introduced the concept of localprojection scoring (LPS) and proposed an efficient abnormalpoint detection method of high-dimensional data in [9] Ofcourse some new algorithms (for instance neural network[10] and clustering algorithm [11]) continue to be introducedand presented to detect and monitor the abnormal points oftest data The simulation results show that these models andmethods are effective in real engineering and application
In addition some scholars had discussed the anomalydetection in the frequency domain For instance to overcomethe disadvantages that the window size does not change withfrequency the wavelet transform theory is usually introducedto compensate for the localization defects of the short-timeFourier transform [12]The characteristics of multiresolution(also called multiscale) can be used to observe signal grad-ually from coarse to fine The detection and observationalmodes are favorable for detecting singularities of the signalstep by step So the wavelet theorem is also an ideal signaltime-frequency analysis and processing tools Among themthe most representative algorithm is the time series anomalydetection method based on wavelet transform proposed in[12]
Although the engineers and scholars have made a lot ofachievements in the field of the detection of anomaly spotthe identifying and detection of abnormal data is still in itsinfancy of research for the stacker of ASRS The practiceapplication results show that there are still some problems inthemethods of safety supervisory of the stacker of ASRSAs isknown to all the running performance of stacker is affectedby various factors such as running environment structuralcharacteristics and the optimal goal of the whole systemHence how to implement the detection of the abnormalpoints is the kernel problem of safety maintenance of stackerin ASRS At present there are some research achievementsabout the detection of a stackerrsquos running performance Butthe research is mainly focused on the structure analysis orthe design of the system and few people have done theirresearches from the perspective of abnormal pointrsquos detection[13] In recent years many new algorithms are presented andproposed based on Internet OPC and the fault tree to analyzethe data set acquired and measured from the running state ofthe stacker in [14] In engineering application the detectingability of the remote fault of stacker may meet the desiredpurpose using the proposed algorithm presented in [15 16]Meanwhile Kai Zhang and his coauthors have discussed andanalyzed the monitoring method based on the multimodeand multivariate statistics to monitor the running state ofstacker crane in [17 18] Experimental results show that theanomaly detection method is effective
However because the running state of stacker is influ-enced by the state of the stackerrsquos component the sceneenvironment the data acquisition equipment and so onthe data set acquired from the system will contain a lot ofnoise Obviously the noise of data will reduce the accuracy ofabnormal pointrsquos judgment Therefore deleting and cleaningthe noise from testing data is necessary to implement andaccomplish the monitoring of running state of whole stackersystem To restrain the interferences of strong backgroundnoise Huang DR and his coauthors have constructed acooperated denoising algorithm for rolling bearing of stackerin [19] The simulation results have verified the effectivenessof health monitoring of ASRS Notice that in the previousscenario the actual monitoring data obtained from the realstacker is the aliasing vibration signal So how to accomplishthe separation of multivibration signal is a difficult problemin vibration process If themethod is reasonable the detectingaccuracy of stackerrsquos running abnormal points will be greatlyimproved
Based on the analysis and the thesis above to ensure theeffectiveness of the incomplete data processing of real systemit is necessary to construct and design a cooperative anomalydetection algorithm so that the abnormal spot can be detectedand located as quickly as possible in on-site industrial envi-ronment Notice that the timing of the real time data processis vital in the industrial environment and then the data signalneeds to be treated from coarse to fine as soon as possibleOn the basis the Pulse Coupling Neural Network (PCNN)presented in [20 21] is introduced to denoise because ithas the advantage that the industrial data process does notdepend onprecisemathematicsmodelMeanwhile due to thefact that the wavelet transform may complete the itemization
Journal of Control Science and Engineering 3
of the data collection it is introduced to construct andestablish the abnormal point detecting algorithm to locate thestackerrsquos defect through the pure data processed by PCNN
Hence the rest of this paper will discuss the details ofthe algorithm and thesis The layout of the rest of the paperis organized as follows Section 2 will introduce the basicconcepts of PCNN and the modified PCNN is introducedto construct the data denoising model In Section 3 inorder to locate the anomaly points the wavelet transform isintroduced as the anomaly detection and location algorithmAlso the cooperative anomaly judgment algorithm and rulefor anomaly detection will be discussed in detail combinedwith modified PCNN and wavelet transform In additionthe algorithm flow chart is also drawn Later the contrastexperiments and numerical simulation to detect the abnor-mal point of stacker running track are carried out to verify theeffect of the algorithm and rule using data provided by StateGrid Measuring Center of China Finally some conclusionsand the directions for future engineering application arediscussed according to the real stacker running track of ASRSin industrial environment
2 Improved PCNN Denoising Modeland Algorithm for Vibration Signalsof Stacker Running Track
In a real working condition the actual vibration signalsmeasured from this system will be unavoidably affected bymany complicated environmental factors Obviously the datapackage usually includes strong noises So to guarantee theeffectiveness of anomaly detection for stacker running tracka reasonable data preprocessing procedure is very crucialto eliminate the noises that are contained in the dataset Inthis context constructing an effective denoising model andalgorithm to process the original signal is of great theoreticaland practical significance for the condition monitoring of thestacker running track
However most industrial monitoring and control appli-cations require high performance timeliness and reliabilityThen most administrators and engineers hope to effectivelyoperate the system without knowing the accurate modelBased on this thesis the PCNN will be introduced laterOn this basis an improved PCNN denoising model andalgorithm are analyzed and designed according to the actualsituation to ensure the timeliness and stability of the perfor-mance of the stacker running track
21 Basic eory of PCNN As we all know PCNN is pre-sented by Eckhorn based on the observed synchronous pulsetransmission after the experiments of the cerebral cortex ofthe animals [22] In fact due to its scale invariance rotationinvariance intensity invariance distortion invariant andother characteristics PCNN is widely used in image smooth-ing image segmentation image edge detection image fusionoptimal solution and so on Moreover in theory the PCNNmodel has similar group neurons synchronization releasepulse characteristic and the accurate model is not needed toparse the structure of dataset Thus the engineers not only
reveal the inherent ability of PCNN but also explore theapplication of PCNN in the signal denoising So the basicconcept of PCNN will be introduced in the next context
According to [22] the PCNNmodel can be expressed bythe following equation
119865119894119895 [119899] = 119890minus120591119865119894119895119865119894119895 [119899 minus 1] + 119881119865sum119896119897
119872119894119895119896119897119884119896119897 [119899 minus 1] + 119878119894119895 (1)
119871 119894119895 [119899] = 119890minus120591119871119894119895119871 119894119895 [119899 minus 1] + 119881119871sum119896119897
119882119894119895119896119897119884119896119897 [119899 minus 1] (2)
119880119894119895 [119899] = 119865119894119895 [119899] (1 + 120573119871 119894119895 [119899]) (3)
120579119894119895 [119899] = 119890minus120591120579119894119895120579119894119895 [119899 minus 1] + 119881120579119884119894119895 [119899 minus 1] (4)
119884119894119895 [119899] = 1 119880119894119895 [119899] gt 120579119894119895 [119899]0 119880119894119895 [119899] le 120579119894119895 [119899] (5)
where 119865119894119895[119899] denotes the 119899th feedback input for the (119894 119895)neuron 119878119894119895 119880119894119895 and 119884119894119895 represent the external stimulationinternal behavior and output of neuron 119873119894119895 respectively119871 119894119895 119865119894119895 are the two input channels for the link domain andthe feedback domain of the neuron 119873119894119895 119872 and 119882 are theconnection weight coefficient matrix of feedback domainand link domain 120579119894119895 and 119881120579 are the output and thresholdamplification factor and the variable threshold function 120573denotes synaptic link coefficient 120591119871 120591119865 120591120579 are the timeattenuation constants of link domain feedback domain andvariable threshold function respectively
From the perspective of simulation the PCNN neu-ron consists of three parts receiving domain modulationdomain and pulse generation domain In real applicationPCNN has the advantage that the data processing does notdepend on precise mathematics model That is to say inthe pretreatment of denoising once the network interface ofPCNN receives the input signal the receiving field transmitsit through two channels 119865 and 119871 The impulse responsefunction of 119865 channel changes slowly with time compared to119871 channelThemodulation part combines the signal 119871 119894119895 fromchannel 119871 with an offset and multiplies the signal 119865119894119895 fromchannel 119865 to generate the internal signal 119880119894119895 Then 120579119894119895 and119880119894119895 will be compared to control the firing of signal neuronsIf 120579119894119895 gt 119880119894119895 the neurons will be activated Otherwise theneurons may be deleted from the structure of PCNN
According to the link coefficient of 119871 channel and 119865channel PCNN can be divided into two cases coupledand uncoupled When 120573 = 0 each neuron was separatelyoperated and unaffected by the pulse output of other neuronsaround it In addition considering the friendly interface forend users the basic structure of PCNN is shown as Figure 1
Obviously the original dataset may be used to identify thecharacter of noises by training the PCNNnetwork Of coursethe noise-polluted data may be cleaned through analyzing thePCNN firing matrix and then the noises may also be filteredfrom the original dataset In general the engineers may testthe abnormal point in a long data sequence to better locatethe defect of stacker running track
4 Journal of Control Science and Engineering
1
ReceivingDomain
Modulation Domain
Pulse Generation
Domain
Adjust the Threshold
Yi
ijL
Wij
Yk Wkl
Mij
Mkl
j
j
Fj Uj
Lj
Jj
Yj
ƩƩ
Ʃ
Figure 1 Basic structure of PCNNmodel diagram
Unfortunately although the basic structure of PCNNcan clean the real dataset mixed with noise the complexityof this topological structure can cause various issues thatnegatively impacts the engineerrsquos operation play experienceIn real scenario of ASRS the difficulty in condition moni-toring is to ensure the timeliness of locating the abnormalposition of stacker running track In particular because therunning process of stacker is complex and changeable theoriginal dataset signified the running state of the stackerincluding lots of noise From an operational perspectivethe traditional denoising method based on nominal modelmay hardly achieve the expected denoising performance Soit is necessary to simplify network structure to meet theactual demand and it is a nontrivial problem to construct animproved denoising algorithm based on the existing PCNNmodel to meet the actual needs
22 Modified PCNN Denoising Model for Vibration Signalsof Stacker Running Track In the industrial scenario dueto very poor measurement environment the quality of themeasurement signals may be affected by all kinds of factorsMeanwhile the influential factors are connected with eachother in vibration signals of stacker running track and theyalso have indirect effects How to solve the coupling relationswithin the limits of real time control is very important todenoise the original dataset In fact considering that the basictopological structure of PCNN has the excessive parametersand the implementation is more complicated it is not widelyused in practice compared to the modified PCNN modelFor a handy operation or statistics the modified uncoupledmodel proposed in [21] is adopted to simplify the denoisingprocess
According to [21] the simplified PCNN model can beexpressed by the following equation
119865119894119895 [119899] = 119878119894119895 [119899] (6)
119884119894119895 [119899] = 1 119865119894119895 [119899] gt 120579119894119895 [119899]0 119865119894119895 [119899] le 120579119894119895 [119899] (7)
120579119894119895 [119899] = 119881120579 119884119894119895 [119899] = 1119890minus120591120579120579119894119895 [119899 minus 1] 119884119894119895 [119899] = 0 (8)
119861119894119895 [119899] = 1 119884119894119895 [119899] = 10 119884119894119895 [119899] = 0 (9)
119879119894119895 [119899] = 119899 119884119894119895 [119899] = 1119879119894119895 [119899 minus 1] 119884119894119895 [119899] = 0 (10)
where 119865119894119895[119899] denotes the nth feedback input for the (119894 119895)neuron 119878119894119895 denotes the external stimulation of neurons 119873119894119895120591120579 denotes time attenuation constants of variable thresholdfunction
In this model the signal from the channel 119871 is notaccepted by 119865119894119895 As a result 119865119894119895 is only affected by externalinput The 119861 matrix records whether the neuron fires at thenth input And when the neuron fires it will be assigned alarger threshold so that it will not be fired again in a shorttime Conversely the threshold of the neuron that is not firedwill decay over timeTherefore the 119879matrix is used to recordthe time when each neuron is firstly fired The noise point inthe data can be filtered out by the value of 119879matrix
Journal of Control Science and Engineering 5
Adjust the Threshold
Yi
Yk
Fj
Yj
Mij
j
Mkl Uj
Lj
Ʃ
Figure 2 Modified PCNNmodel diagram
Themodified topological structure of simplified PCNN isshown as Figure 2
Obviously the modified model has advantages of lessparameters and simple implementation In other wordsthe simplified denoising system has operational simplicityand high efficiency for the denoising processing of the rawincoming data For the sake of applying in industry thesimplified denoising process is more applicable Thus we canmake use of the modified denoising model to denoise thevibration signals of stacker running track and finally realizethe recognition of anomaly points
3 Design and Analysis of CooperativeAnomaly Detection Method and Algorithmfor Stacker Running Track of ASRS
In the above section one valid dimensional data cleaningmodel and framework was discussed and analyzed Once theoriginal dataset measured from the track running systemwas processed by the modified PCNN the errors noisesor missing data that are contained in the dataset should beeliminated and removed That is to say the output datasetmay be used to accurately locate the anomalous point forthe stacker running track of ASRS Obviously the key stageof locating the abnormal defect of stacker running track isto find a reasonable model The engineering practice showsthat the energy of induction signal induced by the abnormalpoint of the stacker running track concentrates on the highfrequency band Of course the fact has also provided a basisfor determining anomaly point of stacker running stackerBased on this it is imperative to find a reasonable way todecompose the output dataset of modified PCNN into twoparts low frequency part and high frequency part
Simultaneously because the wavelet transform devel-oping since 80rsquos of last century has specific property oftime-frequency localization the method is especially fit foranalyzing and detecting local signal mutation for the stackerrunning track of ASRS Next step the cooperative anomalydetection model of stacker running track will be constructedand analyzed based on wavelet transform
31 Cooperative Anomaly Detection Method Based WaveletTransform In our experiments the main feature of signalmutation is that the signal has local changes in time andspace To guarantee the accuracy of locating and identifyingthe defects of stacker running track we have tried to designand construct a cooperative detectionmethod combinedwithwavelet theory The principle of using wavelet transform todetect the anomalous points is to decompose the signals
in different resolutions When the signal is abrupt thecoefficient gotten by the wavelet transform has a modulusmaximum valueTherefore the location of the outliers can befiltered out through the detection of the maximum moduluspoint
Without loss of generality the basic principle of wavelettransform is clearly defined Suppose 120601(119905) isin 1198712(119877) is asquare integral function if its Fourier transform satisfies thefollowing condition
intR|Ψ (120596)|2 |120596|minus1 119889120596 lt +infin (11)
where 120595(120596) is wavelet transform of 120601(119905) and 120601(119905) is awavelet function or base wavelet
In fact when the output dataset of modified PCNN wasdecomposed into high frequency and low frequency thekey factor is to carry the expansion or contraction and thetranslation based on the base wavelet If the expansion orcontraction factor is supposed as 119886 and the translation factoris supposed as b then the wavelet function can be rewrittenas follows
120601119886119887 (119905) = 119886minus12120601(119905 minus 119887119886 ) 119886 gt 0 119887 isin 119877 (12)
where 119886 denotes the scaling factor (or scale factor) and 119887 istranslation factor And 120601119886119887(119905) is wavelet base function whichis concerned with 119886 and 119887 It can be obtained by scaling ormoving the parent function 120601(119905)
So for an arbitrary signal 119909(119905) isin 1198712(119877) the wavelettransform can be expressed by the inner product of the signaland wavelet base function119882119909 (119886 119887) = ⟨119909 120601119886119887 (119905)⟩
= 119886minus12 int119877119909 (119905) 120601119886119887 (119905 minus 119887119886 ) 119889119905 (13)
Notice that the actual measured signals indicating thechanges of the running state of the stacker running track arediscrete in the stacker running track in ASRS and the wavelettransform should be rewritten in a discrete form to treat theoutput dataset provided by modified PCNN In general thescaling factor 119886 and the translation factor 119887 are put as follows
119886 = 2minus119895119887 = 2minus119895119896 (14)
Thus119882119909(119886 119887) became a discrete binary wavelet function asfollows 120601119895119896 = 21198952120601119895119896 (2119895119905 minus 119896) (15)
119882119909 (119895 119896) = 21198952 int119877119909 (119905) 120601 (2minus119895119905 minus 119896) 119889119905 (16)
where 119895 119896 isin 119885Then the output dataset denoising by modified PCNN
may be decomposed into high frequency and low frequencyby the following formula
119882119909 (119895 119896) = infinsum119895119896=minusinfin
119909 (119905) 120601119895119896 (119905) (17)
6 Journal of Control Science and Engineering
C0 C1 C2
D1 D2
Cnminus2 Cnminus1 Cn
Dnminus2 Dnminus1 Dn
Figure 3 The wavelet decomposing process of output dataset
Obviously the wavelet series information may be used toshow the changes of the running state of the stacker trackMoreover to ensure that the energy of induction signalinduced by the abnormal point of the stacker running trackconcentrates on the high frequency band we have selectedthe orthogonal wavelet transform to decompose the outputdataset into high frequency and low frequency The basicdecomposing mode is defined as follows
119862119895+1 = 119867 lowast 119862119895119863119895+1 = 119863 lowast 119862119895 (18)
whereC is the high frequency part and119863 is the low frequencypart
In our experiments if the raw output signal 119909(119905) isdescribed as 1198620 the wavelet decomposing process may beshown as Figure 3
Obviously according to the decomposing process inFigure 3 the high frequency band of the dataset whichindicates the energy of induction signal induced by theabnormal point of the stacker running track can be gottenTo add extra flexibility the high frequency band is describedas 119862119895 (119895 = 0 1 sdot sdot sdot )
In practical project the low-frequency coefficients reflectthe contour of the original signal and the high-frequencycoefficients describe the details of the signal In particular thesingularity in the signals is often caused by a sudden changein frequency domain For the engineers in health monitoringof stacker running state it means that the high-frequencycoefficients of wavelet transform canhighlight singularity andcan be used for detection and localization of the defect ofthe stacker running track From the angle of engineeringapplication the damage of stacker running track will causeperturbations of measured signal at damage sites Moreoverthe measurement dataset is an aggregate of the runninginformation and the singularity of high frequencymay depictthe character of damage position on stacker running trackIn other words the damage concussion will cause the signalsaltation So in practical engineering applications it is veryimportant to design a reasonable judgment rule of anomalypoints
To better locate the defects of stacker running track theLipschitz index is used to describe and design the judgmentrule of singularity of the dataset For the simplicity of analysisthe corresponding concept of Lipschitz index was defined asfollows
Definition 1 If there exists a constant 119888 gt 0 and h such that119891(119905) satisfies the following condition1003816100381610038161003816119891 (1199050 + ℎ) minus 119891 (1199050)1003816100381610038161003816 le 119888 |ℎ|120572 (19)
thus 120572 is the Lipschitz index of 119891(119905) at 119905 = 1199050 And then if120572 lt 1 119891(119905) is singular at 119905 = 1199050In general the size of Lipschitz index is related to the
value of the singularity in actual project ie the moresevere the degree of mutation the steeper the peak of thecatastrophic point and the smaller the singularity indexand vice versa Based on this thesis we can define the localsingularity of high frequency signals decomposed by wavelettransform as follows
Definition 2 forall119909 isin 1205751199090 if there exists a constant 119870 gt 0 ands the wavelet function 120601(119909) is continuous and differentiableand the wavelet transform has 119873 vanishing moment (119873 is apositive integer) ie 1003816100381610038161003816119882119891 (119904 119909)1003816100381610038161003816 le 119870119904120572 (20)
Thus 120572 is the local singularity at 1199090Notice that wavelet transform is applied to vibration
signal analysis of stacker running track to detect the meshingabnormality of track with local defects and the amplitudes ofthe vibration single will decrease or increase to some extentSo by Definition 1 once there exists 120572 lt 1 at one point theengineers may judge that the position of the stacker runningtrack may be damaged Thus the judgment rule of anomalypoint is designed as follows
Rule 1 forall119909 isin 1205751199090 if the wavelet transform coefficient satisfies1003816100381610038161003816119882119891 (119904 119909)1003816100381610038161003816 le 1003816100381610038161003816119882119891 (119909 1199090)1003816100381610038161003816 (21)
thus 1199090 may be judged as the abnormal point of the stackerrunning stack
Notice that the mutation information of flaws may beaccumulated in running process of stackerrsquos track and theability of a single high-frequency detail signal to reflect anabnormal point has limitations to locate the defect to stackerrunning track To solve and overcome the problem theproduct of the high-frequency coefficient which can amplifythe detail signal is selected as the basis for the final judgmentof the abnormal point in our experiments To satisfy the needof engineering design the accumulated information of trackrsquosflaws can be described by using the following formula119862 = 119862119895 times 119862119895119899minus1 times 119862119895119899minus2 (22)
where 119862 is the product of high-frequency signal 119862119895 119862119895119899minus1 119862119895119899minus2 are the 119899-order 119899 minus 1-order and 119899 minus 2-order high-frequency detail signals at the decomposition scale n respec-tively
Then the basic rule is shown as follows
Rule 2 If a mutation appears in the product of the high-frequency coefficient it is an abnormal point
Through the analysis and rules above once the outputdataset processed by modified PCNN has been decomposedinto the low frequency and high frequency components of thesignals the high frequency components can be used to detectand locate the anomaly points of stacker running track
Journal of Control Science and Engineering 7
32 Design and Analysis of Cooperative Anomaly DetectionAlgorithm Based on Modified PCNN and Wavelet TransformBased on the above analysis and discussion combining withthe modified PCNN and wavelet transform the cooperativeanomaly detection algorithm of the stacker running trackmay be designed in detail as below
Step 1 Normalize the data Calculate the initial mean squareerror and initialize the network parameters by (1)-(9)
Step 2 Use the normalized data as input data End the loopif matrix 119861 = 0 Get matrix T when the loop ends
Step 3 The noise points are determined according to theelements in the matrix and then filter each data point
Step 4 Calculate mean square error (MSE) and compareit with the mean square error before if the mean squareerror is smaller than the mean square error before back toStep 2 Input data into that model to continue to reduce noiseOtherwise output the signal last time as the result
Step 5 Select wavelet base function and determine thenumber of layers of wavelet decomposition
Step 6 The wavelet transform coefficients of each layer areobtained by wavelet decomposition
Step 7 Multiply the detail signal to amplify the mutationsignal
Step 8 Obtain the location of the outliers according to thelocation of the signal mutation
The algorithm flow chart is shown as Figure 4
4 Examples and Analysis
41 Simulation Examples
411 Simulation Results of Noise Reduction Effect of PCNNTo verify the noise reduction effect of modified PCNN thesimulation examples were first used to test the denoising abil-ity of PCNN In our simulation experiments the sinusoidalsignal was selected and adopted as the input data to train andtest PCNN rule and the Gaussian white noise with a mean ofzero and a variance of 1 is added to the sinusoidal signal as theexperimental signal The testing signal 119909(119905) was described asfollows
119909 (119905) = sin (119905) + V (23)
where V is the Gaussian white noise and V sim 119873(0 1)In actual imitative preparation V n and 119905 were set up as
below respectively
V (119905) = 119899119900119903119898119903119899119889 (0 01 119899)119905 = 0 01 100119899 = 119897119890119899119892119905ℎ (sin (119905))
(24)
Input data
Normalize noise signal data calculate
initialize network parameters
Filter the data and calculate
Output i -1th signal value
Y
N
Signal after denoise
Wavelet transform
Product of high frequency coefficients
Anomaly analysis
Output
Calculate T B setinitial value B=0
initial mean square error M0 and
mean square error Mi
MiltMi-1
Figure 4 Flow chart of the algorithm
By training the neural network of PCNN the denoisingresults are shown as Figure 5
Simultaneously to explain the validity of PCNN denois-ing algorithm the wavelet threshold denoising algorithm wasused to compare with the presented algorithm in our sim-ulation examples The effect of wavelet threshold denoisingalgorithm is shown as Figure 6
Obviously although the comparison results between Fig-ures 5 and 6 indicate the differences of the different denoisingalgorithm the details of the differences are not obviousand significant So we must have a valid index selectedto show the differences To go through this process thesignal-to-noise ratio (SNR) andminimummean square error(MSE) were used to compare the advantages of proposeddenoising algorithm The basic formulas were shown asfollows
(1) Signal-to-Noise Ratio
119878119873119877 = 119878119905V
(25)
8 Journal of Control Science and Engineering
0 100 200 300 400 500 600 700 800 900 1000minus1
0
1Original Signal
0 100 200 300 400 500 600 700 800 900 1000minus2
0
2Noise Signal
0 100 200 300 400 500 600 700 800 900 1000minus2
0
2Denoising Signal
Figure 5 PCNN noise reduction results
0 100 200 300 400 500 600 700 800 900 1000t (s)
minus101
(V)
Am
plitu
de(V
)A
mpl
itude
(V)
Am
plitu
de
Original Signal
0 100 200 300 400 500 600 700 800 900 1000t (s)
minus202
Noise Signal
0 100 200 300 400 500 600 700 800 900 1000t (s)
minus202
Denoising Signal
Figure 6 Wavelet threshold denoising results
Table 1 Comparison of wavelet threshold denoising and PCNNnoise reduction
Wavelet denoising PCNN denoisingSNR 1515 1647MSE 037 036
(2) Mean Square Error
119872119878119864 = 1119899radic119899sum119905=1
(119878119905 minus 119878119905)2 (26)
where 119878119905 is denosing signal 119878119905 is the original signal and Vis the noise signal
By (25) and (26) the corresponding comparison resultsare shown in Table 1
It can be seen in Table 1 that PCNN can retain thecharacteristics of the original signal while getting good noise
reduction with higher SNR and lower MSE So it means thatthe denoising effect of modified PCNN is better than waveletthreshold denoising method
412 Simulation Results of Anomaly Detection In order tofurther verify the validity of cooperative anomaly detectionmethod for singular point in signal dataset a set of vibrationsignal with abnormal points is selected to test the effect ofpresented cooperative anomaly detection algorithm ie
119909 (119905) = sin (002120587119905) 0 le 119905 le 400sin (02120587119905) 401 le 119905 le 600 (27)
In our simulation experiments the simulation results areshown as Figure 7
In fact it can be seen from the simulation results thatthe sudden change of the signal appears at t=400 which canbe observed from detail coefficients clearly That indicatesthat the anomalies appear at t=400 It can be concluded thatthe presented cooperative anomaly detection can mark thelocation of the abnormal point of the vibration signal clearlyOn the other hand after testing the function the presentedcooperative algorithm may be applied to actual project
42 Real Experiment Examples Moreover to further verifythe validity of the proposed algorithm the actual stackingmachine vibration signal of ASRS which has been developedand applied in State Grid Measuring Center of Chinawas selected to simulate the performance of the anomalydetection algorithm The prototype systems of the stackers ofState Grid Measuring Center of China is shown in Figure 8
As can be seen in Figure 8 the main function is to grabmove and stack goods from one goods shift to another Inactual project the degree of unevenness of flaws (such asrusts crack the concavo-convex fluctuation or any weldingdefects) will directly influence the safety and effectivenessof whole ASRS In real engineering the test rig of stackerrunning track is shown as Figure 9
Figures 8 and 9 demonstrate that the crucial equipmentof ASRS is the stacker running track And then the operationtrack systems of the stacker contain the suspension trans-porting system (ie upper track) and road tracks (ie lowertracks) Thus if outliers are presented and detected withinthe dataset the defects of the stacker running track maybe located and identified according to the precise geospatialdata
In real application the sampling time is from March toApril of 2018 The size of the sampling data source measuredfrom stacker running track is 7370 The data may containnoise because of the interference of the site environmentand collecting data equipment and other reasons To theManagement Department of State Grid Measuring Centerof China the engineers especially want to find the anomalypoints and locate the defects of stacker running track fromthe experimental data If the engineers can do this the wholesecurity of ASRS may be better ensured So the simulationresults between the original signal and compounded signalwith noise caused by the defects of stackerrsquos running track
Journal of Control Science and Engineering 9
0 100 200 300 400 500 600t (s)
minus1
minus08
minus06
minus04
minus02
0
02
04
06
08
1A
mpl
itude
(V)
(a) The original signal containing the exception point
0 100 200 300 400 500 600t (s)
minus202
Am
plitu
de(V
)A
mpl
itude
(V)
Am
plitu
de(V
)
Am
plitu
de(V
)
0 100 200 300 400 500 600t (s)
minus202
0 100 200 300 400 500 600t (s)
minus101
0 100 200 300 400 500 600t (s)
minus020
02
(b) Wavelet decomposition result
0 100 200 300 400 500 600t (s)
minus002
minus0015
minus001
minus0005
0
0005
001
0015
002
0025
Am
plitu
de (V
)
(c) Abnormal point detection results
Figure 7 Simulation result of cooperative anomaly extraction
Figure 8 Stackers in State Grid Measuring Center of China
were simulated in ASRS In order to verify the effectivenessof the proposed model wavelet transform and box-plot arechosen to compare with the result of PCNN-wavelet modelThe results were shown as Figure 10
Figure 9 Basic structure of stacker running track
As seen from Figure 10(a) due to the interferenceof noise points it is impossible to accurately judge theabnormal points of the stacker by using only the wavelettransform As can be seen from Figure 10(b) the abnormal
10 Journal of Control Science and Engineering
0 05 1 15 2 25Location (mm)
minus5
0
5
10
Am
plitu
de (V
)times109
times104
(a) Data anomaly detection results based on wavelet
0 50 100 150 200 250 300Location (mm)
0
1000
2000
3000
4000
5000
6000
7000
8000
Am
plitu
de (V
)
X 1Y 6714
X 36Y 2898
X 54Y 3483
X 64Y 2599
X 118Y 2778
X 132Y 2847
X 148Y 2813
X 161Y 2658
X 223Y 2496
X 232Y 8545
(b) Data anomaly detection results based on box-plot
0 05 1 15 2 25Location (mm)
minus2
minus15
minus1
minus05
0
05
1
15
2
Am
plitu
de (V
)
X 1536Y 8141e-07
X 2030Y -1045e-06
X 7620Y -2317e-06
X 1784e+04Y -2336e-06
X 2245e+04Y -3795e-07
X 6752Y 1047e-06
X 1001e+04Y 9711e-07
X 2012e+04Y 112e-06
times104
times10minus5
(c) Results of data anomaly detection based on PCNN-wavelet
Figure 10 Comparison of abnormal point detection of three methods
point determination interval is 1m-36m 54m-64m 118m-132m 148m-161m and 223m-232m Correspondingly theanomaly extensions may be at 15m-20m 67m-76m 10m178m 20m and 224mby the judgement rules in Figure 10(c)The results can be shown as Table 2
Obviously after the noise reduction of the input signalthe location of the abrupt change in the vibration signalmay be depicted and described accurately by PCNN-waveletTo ensure the operability in real engineering practice someactual damage scenes of stacker running track were used toverify the effect of the presented algorithm For instance theactual testing and detecting sample photos at 15m 72m and18m are shown in Figure 11 respectively
In addition there are rail welds at 10m 20m and 22mrespectively
From the experimental simulation results and the actualsituation verification although the box diagram can roughlylocate the abnormal point interval the PCNN-wavelet ismore accurate and closer to the actual situation In Fig-ure 10(c) the simulative curve appears to be changedsuddenly in these places In other words the cooperative
Table 2 Comparison of abnormal point detection results
Wavelet Box-plot PCNN-wavelet 1m-36m 15m-20m 54m-64m 67m-76m 118m-132m 10m 148m-161m 178m 20m 223m-232m 224m
anomaly detection method presented in this paper is effec-tive
In fact the emergence of data mutation points may becaused by the depressions cracks and deformation at theinterface in the tracks On the other hand the response infor-mation of the damage position may be developed to makedifferent damage positions in different information rangeAnd the administrators of the industrial system may locatedamage positions according to numerical characteristics inthe damage unit Furtherly the relevant departments may
Journal of Control Science and Engineering 11
(a) Depression of lower track at 15m (b) Cracks appearing on upper track at 72m
(c) Interface deformation on upper track at 18m
Figure 11 Testing and detecting sample photos from scene
design the good maintenance strategies according to themonitoring curvesThat means our algorithm may be appliedto the real project
5 Conclusion
In this paper a cooperative anomaly detection method forthe stacker running track in the industrial environment ispresented which is based on PCNN and wavelet transformFirstly the data denoising model is built based on PCNNThen the data is detected by wavelet transform Finally therationality and validity of the proposedmethod are verified byexample analysis and simulation Themain conclusions are asfollows(1) In ASRS under the influence of complex industrialenvironment the data collected by the sensors will inevitablybe interfered by noise which will bring difficulties in dataanalysis Simulation and real experiment examples prove thatPCNN performs well in noise reduction Moreover it caneliminate noise interference as well as retain the originalsignal characteristics(2) After getting clean data the wavelet transform caneffectively locate the location of the abnormal point and hasgood applicability
(3)After using PCNN to eliminate noise the interferenceof noise-to-signal data is reduced which is more conduciveto the detection of signal data anomaly spot by wavelet trans-form Through the comparison of the field and experimentaldata it is shown that using PCNN and wavelet transform canrealize the detection of the orbital anomaly spot of stackingmachine
Data Availability
The data used to support the findings of this study areavailable from the corresponding author upon request
Conflicts of Interest
The authors declare that they have no conflicts of interest
Acknowledgments
This work was supported by the National Natural ScienceFoundation of China under Grants 61703063 6166300861573076 and 61004118 the Scientific Research Foundationfor the Returned Overseas Chinese Scholars under Grant2015-49 the Program for Excellent Talents of Chongqing
12 Journal of Control Science and Engineering
Higher School of China under Grant 2014-18 the petro-chemical equipment fault diagnosis Key Laboratory inGuangdong Province Foundation of China under GrantGDUPKLAB201501 the Chongqing Natural Science Foun-dation of China under Grant CSTC2017jcyjA1665 Scienceand Technology Research Project of Chongqing MunicipalEducation Commission of China under Grants KJ1605002KJ1705121 KJ1705139 and KJZD-K201800701 the Program ofChongqing Innovation and Entrepreneurship for ReturnedOverseas Scholars of China under Grant cx2018110
References
[1] V Barnett and T Lewis Outliers in Statistical Data John Wileyamp Sons New York NY USA 1978
[2] M E Knorr and R T Ng ldquoFinding Intensional Knowledge ofDistance-Based Outliersrdquoe VLDB Journal pp 211ndash221 1999
[3] M Kontaki A Gounaris A N Papadopoulos K Tsichlas andY Manolopoulos ldquoEfficient and flexible algorithms for moni-toring distance-based outliers over data streamsrdquo InformationSystems vol 55 pp 37ndash53 2016
[4] L Sheng W Zhang and M Gao ldquoRelationship between Nashequilibrium strategies andH2119867infin control of stochasticMarkovjump systems with multiplicative noiserdquo IEEE Transactions onAutomatic Control 2014
[5] S Ramaswamy R Rastogi and K Shim ldquoEfficient algorithmsfor mining outliers from large data setsrdquo SIGMOD Record vol29 no 2 pp 427ndash438 2000
[6] A Struyf and P J Rousseeuw ldquoHigh-dimensional computationof the deepest locationrdquo Computational Statistics amp Data Anal-ysis vol 34 no 4 pp 415ndash426 2000
[7] S Zhou and W Xu ldquoDeviation-based local outlier detectionalgorithmrdquo Yi Qi Yi Biao Xue BaoChinese Journal of ScientificInstrument vol 35 no 10 pp 2293ndash2298 2014
[8] Z Ge Z Song S X Ding and B Huang ldquoData Miningand Analytics in the Process Industry The Role of MachineLearningrdquo IEEE Access vol 5 pp 20590ndash20616 2017
[9] H Liu X Li and J Li ldquoEfficient Outlier Detection for High-Dimensional Datardquo IEEE Transactions on Systems Man ampCybernetics Systems no 99 pp 1ndash11 2017
[10] M Markou and S Singh ldquoNovelty detection a reviewmdashpart 2neural network based approachesrdquo Signal Processing vol 83 no12 pp 2499ndash2521 2003
[11] J-S Wang and J-C Chiang ldquoA cluster validity measure withoutlier detection for support vector clusteringrdquo IEEE Transac-tions on Systems Man and Cybernetics Part B Cybernetics vol38 no 1 pp 78ndash89 2008
[12] S Mallat and W L Hwang ldquoSingularity detection and process-ing with waveletsrdquo IEEE Transactions on Information eoryvol 38 no 2 pp 617ndash643 1992
[13] W P Stuart-Bruges and V Srinivasan ldquoSelf-diagnostic controlof a stacker cranerdquo Electronics and Power vol 21 no 2 pp 108ndash111 1975
[14] Z Ge ldquoReview on data-driven modeling and monitoring forplant-wide industrial processesrdquo Chemometrics and IntelligentLaboratory Systems vol 171 pp 16ndash25 2017
[15] LI Xiaoping and YU KangKang ldquoResearch on Key Technologyin Remote Fault Diagnosis of the Stackerrdquo Journal of LanzhouJiaotong University vol 30 no 4 pp 15ndash20 2011
[16] H Darong T Jianping and Z Ling ldquoA fault diagnosis methodof power systems based on gray system theoryrdquo MathematicalProblems in Engineering vol 2015 Article ID 971257 2015
[17] K Zhang K Peng and J Dong ldquoA Common and Individ-ual Feature Extraction-Based Multimode Process MonitoringMethod With Application to the Finishing Mill Processrdquo IEEETransactions on Industrial Informatics vol 14 no 11 pp 4841ndash4850 2018
[18] K Zhang H Hao Z Chen S X Ding and K X Peng ldquoAcomparison and evaluation of key performance indicator-basedmultivariate statistics process monitoring approachesrdquo Journalof Process Control vol 33 pp 112ndash126 2015
[19] H Darong K Lanyan M Bo Z Ling and S Guoxi ldquoANew Incipient Fault Diagnosis Method Combining ImprovedRLS and LMD Algorithm for Rolling Bearings With StrongBackground Noiserdquo IEEE Access vol 6 pp 26001ndash26010 2018
[20] W Jianguo Y Haipeng and ZWenxing ldquoData noise reductionmethod based onmodified PCNNrdquo inChinaMeasurement Testvol 42 pp 92ndash95 2016
[21] Z Wenxing Y Haipeng and W Jianguo ldquoResearch on DataNoise Reduction Method Based on Modified PCNNrdquoMachin-ery Design Manufacture vol 2 pp 25ndash28 2015
[22] R Eckhorn H J Reitboeck M Arndt and P Dicke ldquoFeatureLinking via Synchronization among Distributed AssembliesSimulations of Results from Cat Visual Cortexrdquo Neural Com-putation vol 2 no 3 pp 293ndash307 1990
International Journal of
AerospaceEngineeringHindawiwwwhindawicom Volume 2018
RoboticsJournal of
Hindawiwwwhindawicom Volume 2018
Hindawiwwwhindawicom Volume 2018
Active and Passive Electronic Components
VLSI Design
Hindawiwwwhindawicom Volume 2018
Hindawiwwwhindawicom Volume 2018
Shock and Vibration
Hindawiwwwhindawicom Volume 2018
Civil EngineeringAdvances in
Acoustics and VibrationAdvances in
Hindawiwwwhindawicom Volume 2018
Hindawiwwwhindawicom Volume 2018
Electrical and Computer Engineering
Journal of
Advances inOptoElectronics
Hindawiwwwhindawicom
Volume 2018
Hindawi Publishing Corporation httpwwwhindawicom Volume 2013Hindawiwwwhindawicom
The Scientific World Journal
Volume 2018
Control Scienceand Engineering
Journal of
Hindawiwwwhindawicom Volume 2018
Hindawiwwwhindawicom
Journal ofEngineeringVolume 2018
SensorsJournal of
Hindawiwwwhindawicom Volume 2018
International Journal of
RotatingMachinery
Hindawiwwwhindawicom Volume 2018
Modelling ampSimulationin EngineeringHindawiwwwhindawicom Volume 2018
Hindawiwwwhindawicom Volume 2018
Chemical EngineeringInternational Journal of Antennas and
Propagation
International Journal of
Hindawiwwwhindawicom Volume 2018
Hindawiwwwhindawicom Volume 2018
Navigation and Observation
International Journal of
Hindawi
wwwhindawicom Volume 2018
Advances in
Multimedia
Submit your manuscripts atwwwhindawicom
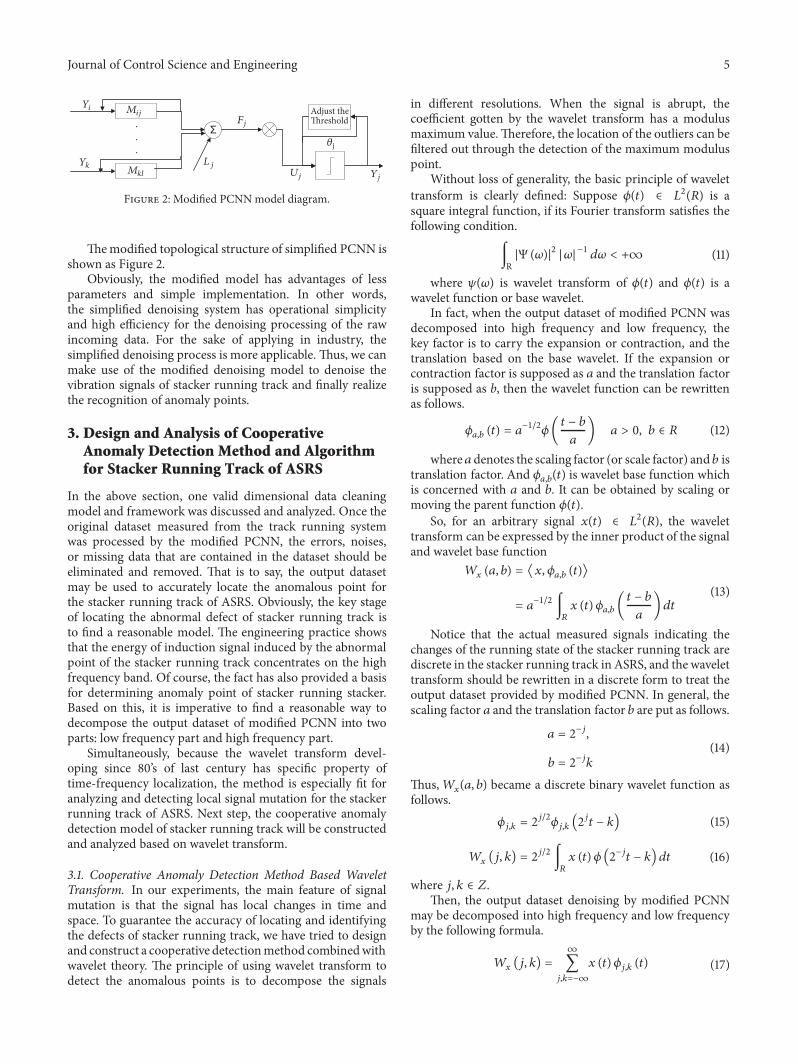

International Journal of
AerospaceEngineeringHindawiwwwhindawicom Volume 2018
RoboticsJournal of
Hindawiwwwhindawicom Volume 2018
Hindawiwwwhindawicom Volume 2018
Active and Passive Electronic Components
VLSI Design
Hindawiwwwhindawicom Volume 2018
Hindawiwwwhindawicom Volume 2018
Shock and Vibration
Hindawiwwwhindawicom Volume 2018
Civil EngineeringAdvances in
Acoustics and VibrationAdvances in
Hindawiwwwhindawicom Volume 2018
Hindawiwwwhindawicom Volume 2018
Electrical and Computer Engineering
Journal of
Advances inOptoElectronics
Hindawiwwwhindawicom
Volume 2018
Hindawi Publishing Corporation httpwwwhindawicom Volume 2013Hindawiwwwhindawicom
The Scientific World Journal
Volume 2018
Control Scienceand Engineering
Journal of
Hindawiwwwhindawicom Volume 2018
Hindawiwwwhindawicom
Journal ofEngineeringVolume 2018
SensorsJournal of
Hindawiwwwhindawicom Volume 2018
International Journal of
RotatingMachinery
Hindawiwwwhindawicom Volume 2018
Modelling ampSimulationin EngineeringHindawiwwwhindawicom Volume 2018
Hindawiwwwhindawicom Volume 2018
Chemical EngineeringInternational Journal of Antennas and
Propagation
International Journal of
Hindawiwwwhindawicom Volume 2018
Hindawiwwwhindawicom Volume 2018
Navigation and Observation
International Journal of
Hindawi
wwwhindawicom Volume 2018
Advances in
Multimedia
Submit your manuscripts atwwwhindawicom