a new cold war in international gas markets new cold war.pdf · accounting for 35%, netherlands/...
TRANSCRIPT
Rising tensions in Eastern Europe emanating from Russian geopolitical ambitions in Ukraine have shaken NATO
strategists into an urgent review of security on its eastern frontier but an equally significant competitive issue between
the two sides is developing in the international gas market. While Western Europe must address its undue dependence
on a potentially hostile Russia, massive increases in LNG exports from North America, Australia and the Gulf States over the next ten years will double supply capacity and, with echoes of earlier Cold War rivalry, create serious
competition for Russia and its Caspian region neighbours in international gas markets.
Amid these rising tensions, it may seem odd to suggest that the Eurasian/ Caspian region will become the focus of an
infrastructural development boom in the coming decades but the massive growth in gas demand, led by China and its
East Asian neighbours, provides Eurasian exporters with the opportunity to aggressively exploit their huge reserves and diversify their undue dependence on European gas consumers. Whereas the western perspective of illegal Russian
action in Crimea necessitates trade-impeding sanctions, the East Asian perspective is dominated by an economic
imperative of securing energy security for their high-growth economies and access to Eurasia’s huge gas reserves may
well mean that, for them, the “Ukraine issue” is a “non-issue”.
The dynamics of the global gas industry are undergoing fundamental change and as new reserves and demand sources multiply, more fluid and competitive international pricing for gas will emerge. The advent of major new frontier
discoveries and rapid growth in shale gas and other unconventional sources promises to transform the global energy
market with the IEA1 estimating that global gas reserves may now exceed 250 years of current global demand. Thus, even allowing for sharply rising Asian demand, the scale of supply capacity presages growing competition among gas
exporters that may serve to narrow the international price differentials around, say a $10-12/ MMcf range, potentially
exposing LNG contracts to material downward pricing pressure. Central to the longer term outlook for gas markets will
be China’s ability to tap into this incremental production capacity at prices which permit the substitution of gas for coal in
power generation and, in this respect, the potential for Russia and the Caspian states to carve a strategic advantage as lower cost suppliers will lead to a Eurasian “gas super-highway”.
1 International Energy Agency
A New Cold War in International Gas Markets
SUMMARY
www.gaffney-cline.com
www.gaffney-cline.com
Page 2
APRIL 2014
Principal Cross-border Gas Trade 2012
0 - 10 10 - 25 25 - 50 50 - 75 75 - 100 100+ Pipeline
LNGSIZEBcm p.a.
TYPE
Principal Cross-border Gas Trade 2025
0 - 10 10 - 25 25 - 50 50 - 75 75 - 100 100+ Pipeline
LNGSIZEBcm p.a.
TYPE
Global gas production of 3.36 trillion cubic metres (tcm) in 20122 equated to only 60% of the equivalent oil output and as little as 30% when expressed in value terms. Similarly, international trade in gas, amounting to 18.7 mln b/d oil equivalent, represented only one-third of oil trade volumes, conferring little more than a secondary role for gas in the global energy scene. Yet this picture is about to change fundamentally with important geopolitical and economic repercussions and it is the coincidence of key factors that will transform gas markets over the next 15 years:
EIA3 estimates US proved gas reserves at end-2011 of 9.9 tcm, with additional undeveloped shale-sourced reserves of 21 tcm.
US LNG export approvals to date, totalling 116 bcm p.a.4, will propel the US to global leadership in LNG exports by 2020. Additional export applications are in process which ultimately could treble this figure.
Non-US LNG capacity additions to 2020 will add 300 bcm5 with Australia, Canada and Russia accounting for c80% of the increase.
Current US gas prices of $4.50/MMBtu are around half the level of UK wholesale prices and less than one-third the Japanese equivalent.
Russian and Turkmen proven reserves of c65 tcm (BP/ EIA) are sufficient to double existing production and meet demand growth from both eastern and western markets, potentially equalising gas prices between Asia and Europe.
Iran accounts for nearly 20% of global gas reserves yet only 5% of production with negligible exports. Post-sanctions rehabilitation of the Iranian economy will include expansion of the planned Southern Gas Corridor to Turkey and southern Europe as well as India.
Major new discoveries in Mozambique, eastern Mediterranean, Azerbaijan, Papua New Guinea and Venezuela will serve to intensify supply competition.
The historical relegation of gas to little more than a by-product in many petroleum producing countries owed much to the absence of adjacent large urban populations and the resulting high costs of transportation to developed markets but as industrialisation and urbanisation take root across the developing world and unconventional technologies open new reserves to exploitation, the true potential for gas is beginning to emerge. BP’s 1981 annual review estimated global reserves at only 82 tcm but by 2012 this figure had more than doubled to 187 tcm, while the EIA6 estimates that global recoverable reserves from shale gas alone could add a further 220 tcm. Unexplored frontier reserves from regions such as the Arctic and deep offshore are thought to take potential reserves towards 1000 tcm. Thus, even allowing for rapid demand growth in global gas consumption from the present level of 3.3 tcm, existing gas reserves can probably meet global demand for up to 250 years. The key constraint to growth in gas production is transportation given the long lead times and capital costs of both intercontinental pipelines and export-scale liquefaction plants but current plans in train are already scheduled to add significant capacity.
www.gaffney-cline.com
Page 3
APRIL 2014
KEY METRICS
SUPPLY SCENARIOS
2 BP Statistical review of world energy, June 2013 3 EIA-Intek Inc., US Energy Information Agency 4 US Dept. of Energy 5 Evaluate Energy 6 EIA/ARI World shale gas and oil resource assessment, June 2013
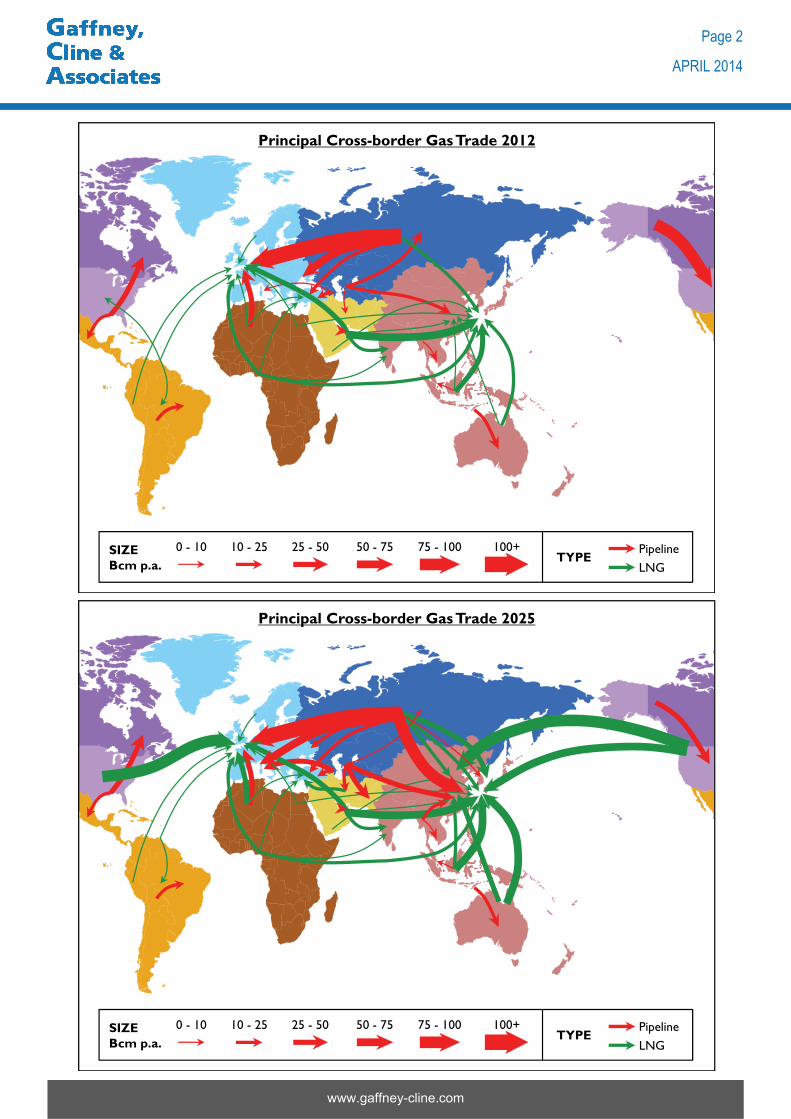
International deliveries of gas by pipeline totalled 706 bcm in 2012 with exports from the Russian/ Caspian region accounting for 35%, Netherlands/ Norway 23% and North America 18%. Near-term export capacity additions in Europe are limited to expensive offshore frontier reserves in Norway pending wider exploitation of shale gas in countries such as Poland and deep-water discoveries in the Eastern Mediterranean, while saturated demand in the USA and Canada will limit further growth in cross-border North American pipeline trade. In contrast, the IEA projects new pipeline capacity from Russia and the Caspian region of c240 bcm, heading both eastward and westward and due for completion by 2020, which will double Eurasian gas exports to at least 500bcm and give the region’s producers a commanding 50% share of the 1000 bcm market projected for pipeline gas in 2020. With Eurasian proven reserves of c70 tcm and potential reserves as much again, however, ample scope exists for further significant increases in deliveries, possible to as much as 1000 bcm. Thus even without the addition of Iranian and Azerbaijani exports to Turkey, southern Europe and India, the potential exists for international trade in pipeline-delivered gas to more than double to 1500 bcm by 2030, with Eurasian shipments taking a 65% share.
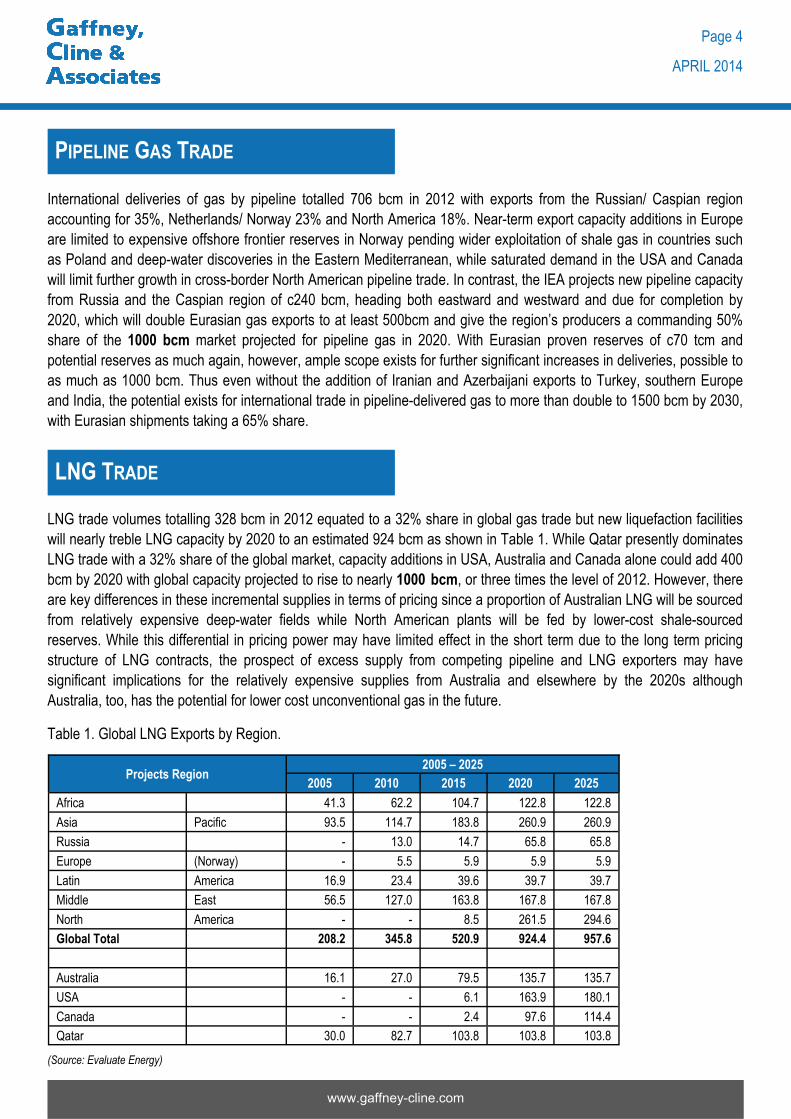
LNG trade volumes totalling 328 bcm in 2012 equated to a 32% share in global gas trade but new liquefaction facilities will nearly treble LNG capacity by 2020 to an estimated 924 bcm as shown in Table 1. While Qatar presently dominates LNG trade with a 32% share of the global market, capacity additions in USA, Australia and Canada alone could add 400 bcm by 2020 with global capacity projected to rise to nearly 1000 bcm, or three times the level of 2012. However, there are key differences in these incremental supplies in terms of pricing since a proportion of Australian LNG will be sourced from relatively expensive deep-water fields while North American plants will be fed by lower-cost shale-sourced reserves. While this differential in pricing power may have limited effect in the short term due to the long term pricing structure of LNG contracts, the prospect of excess supply from competing pipeline and LNG exporters may have significant implications for the relatively expensive supplies from Australia and elsewhere by the 2020s although Australia, too, has the potential for lower cost unconventional gas in the future.
Table 1. Global LNG Exports by Region.
(Source: Evaluate Energy)
www.gaffney-cline.com
Page 4
APRIL 2014
PIPELINE GAS TRADE
LNG TRADE
2005 – 2025 2005 2010 2015 2020 2025
Africa 41.3 62.2 104.7 122.8 122.8
Asia Pacific 93.5 114.7 183.8 260.9 260.9
Russia - 13.0 14.7 65.8 65.8
Europe (Norway) - 5.5 5.9 5.9 5.9
Latin America 16.9 23.4 39.6 39.7 39.7
Middle East 56.5 127.0 163.8 167.8 167.8
North America - - 8.5 261.5 294.6
Global Total 208.2 345.8 520.9 924.4 957.6
Australia 16.1 27.0 79.5 135.7 135.7
USA - - 6.1 163.9 180.1
Canada - - 2.4 97.6 114.4
Qatar 30.0 82.7 103.8 103.8 103.8
Projects Region

The prospect of a doubling in combined pipeline and LNG export capacity to 2000 bcm by 2020 will raise the share of traded gas to approximately 50% of global production, based on the IEA forecast of c4000bcm of marketed gas production by that date. Incremental supply on this scale in just six years raises obvious questions concerning future gas prices within the global demand profile and with Russia, USA, Australia and Canada accounting for nearly 60% of incremental supply, the scope for gas to become the competitive geopolitical resource is very high.
It is widely accepted in the energy industry that natural gas will become an increasingly important fuel source in the coming decades as its traditional use in the domestic sector broadens to include new applications in power generation and transport. The abundance of relatively cheap and strategically diverse global gas reserves and its suitability as a relatively clean fuel combines to make gas a vital energy source as the world gradually transitions from dependence on coal and oil to cleaner fossil fuels and, ultimately, a sustainable energy model. However, the speed with which this transition is implemented will hinge on three key factors:
The rate at which coal-fired power generation is superseded by natural gas, particularly in key industrialising economies such as China and India.
Access to long-term contracted supplies of gas at prices that are competitive with alternate fuels.
The rate at which natural gas can displace oil-based transport fuel, particularly diesel, either directly or through natural gas-based substitutes.
While the use of coal as the dominant fuel source for power generation in the OECD economies has waned in recent years due to mandated targets for lower greenhouse gas emissions (GHGs), a reverse trend in key developing economies, including China and India, means coal continues to supply more than 40% of global electricity demand. Figure 1 shows the extent to which the growth in Chinese generating capacity has been coal-dependent:
Figure 1. “China’s Electricity Sector at a Glance – 2013”, Davidson, A (3.2.14)
www.gaffney-cline.com
Page 5
APRIL 2014
DEMAND SCENARIO
2000 2002 2004 2006 2008 2010 20120
200
400
600
800
1200
1400
1000
2001 2003 2005 2007 2009 2011 2013
Gigawatts (GW)
SolarWindNuclearHydroThermal
Source: CEC, NEA* Thermal includes ~7% non-coal-fired power (e.g. natural gas, biomass, etc.)
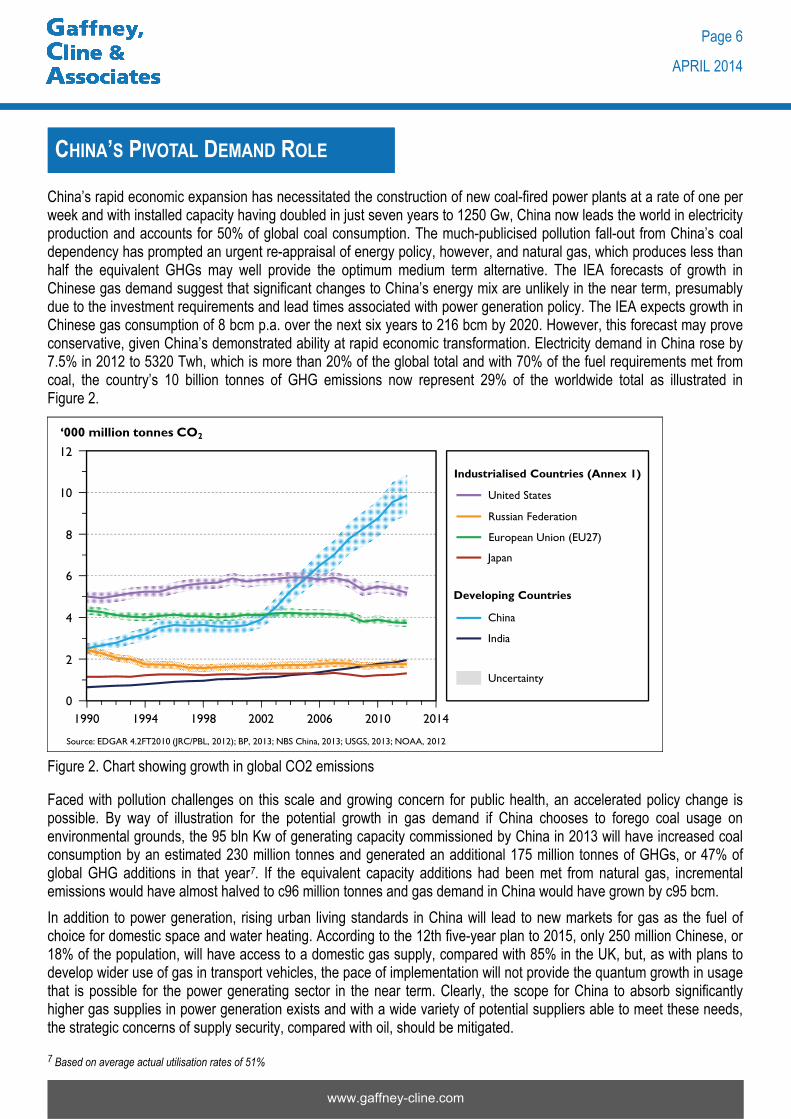
China’s rapid economic expansion has necessitated the construction of new coal-fired power plants at a rate of one per week and with installed capacity having doubled in just seven years to 1250 Gw, China now leads the world in electricity production and accounts for 50% of global coal consumption. The much-publicised pollution fall-out from China’s coal dependency has prompted an urgent re-appraisal of energy policy, however, and natural gas, which produces less than half the equivalent GHGs may well provide the optimum medium term alternative. The IEA forecasts of growth in Chinese gas demand suggest that significant changes to China’s energy mix are unlikely in the near term, presumably due to the investment requirements and lead times associated with power generation policy. The IEA expects growth in Chinese gas consumption of 8 bcm p.a. over the next six years to 216 bcm by 2020. However, this forecast may prove conservative, given China’s demonstrated ability at rapid economic transformation. Electricity demand in China rose by 7.5% in 2012 to 5320 Twh, which is more than 20% of the global total and with 70% of the fuel requirements met from coal, the country’s 10 billion tonnes of GHG emissions now represent 29% of the worldwide total as illustrated in Figure 2.
Figure 2. Chart showing growth in global CO2 emissions
www.gaffney-cline.com
Page 6
APRIL 2014
CHINA’S PIVOTAL DEMAND ROLE
1990 1994 1998 2002 2006 2010 20140
2
4
6
8
10
12
‘000 million tonnes CO2
Industrialised Countries (Annex 1)
United States
Russian Federation
European Union (EU27)
Japan
Developing Countries
China
India
Uncertainty
Source: EDGAR 4.2FT2010 (JRC/PBL, 2012); BP, 2013; NBS China, 2013; USGS, 2013; NOAA, 2012
Faced with pollution challenges on this scale and growing concern for public health, an accelerated policy change is possible. By way of illustration for the potential growth in gas demand if China chooses to forego coal usage on environmental grounds, the 95 bln Kw of generating capacity commissioned by China in 2013 will have increased coal consumption by an estimated 230 million tonnes and generated an additional 175 million tonnes of GHGs, or 47% of global GHG additions in that year7. If the equivalent capacity additions had been met from natural gas, incremental emissions would have almost halved to c96 million tonnes and gas demand in China would have grown by c95 bcm.
In addition to power generation, rising urban living standards in China will lead to new markets for gas as the fuel of choice for domestic space and water heating. According to the 12th five-year plan to 2015, only 250 million Chinese, or 18% of the population, will have access to a domestic gas supply, compared with 85% in the UK, but, as with plans to develop wider use of gas in transport vehicles, the pace of implementation will not provide the quantum growth in usage that is possible for the power generating sector in the near term. Clearly, the scope for China to absorb significantly higher gas supplies in power generation exists and with a wide variety of potential suppliers able to meet these needs, the strategic concerns of supply security, compared with oil, should be mitigated.
7 Based on average actual utilisation rates of 51%

Although there may be some debate as to whether export supply capacity of natural gas will double in as short a time frame as six years, there seems little doubt that growth in supplies on this scale will arise in the early 2020’s based on projects already in the pipeline in the USA, Australia and the Caspian region. Conversely, while the longer term demand picture in Asia suggests that a market for this gas will develop over time, the data for key consuming countries such as China and India suggests that their infrastructural capacity to absorb these volumes will not materialise until the latter half of the 2020s, potentially leaving a supply overhang in the 2017-2025 period. The IEA forecasts non-OECD gas demand to account for 80% of global gas demand growth between 2015-2025 but this will add only 497 bcm to global consumption in the 10-year period.
Looming supply competition in the low-growth European market, which presently accounts for around 45% of global gas trade, will steer supply growth towards Asia. China is expected to overtake Japan and Germany to become the largest net importer of gas by 2020 and, together with neighbouring Asian countries, become the focal point for trade in both piped gas and LNG in the 21st century. But while LNG will feature prominently in this shift, more profound changes to the large-volume export trade could emerge if Russia and the Caspian area states embark on an eastward pipeline network that corresponds to their reserve capacity.
Perversely, the Crimean crisis may intensify the potential for a supply overhang in gas markets as Russia moves more aggressively to diversify its markets in a double-edged geopolitical game-plan. Russia recognises that Asian demand offers a major growth opportunity in comparison with a low-growth European market in which US LNG imports will be competitive. Russia, Turkmenistan and Iran, with combined proved reserves equal to more than 25 years of total global demand, have the resources and geographical position to carve out dominant positions in the East Asian market via overland delivery at prices that could prove compelling for China and India. Secondly, East Asian consuming nations are more likely to adopt a neutral stance in any disputes between Russia and the West as China’s abstention in the UN Security Council Crimean vote demonstrated. Similarly, the Crimean dispute may hasten European efforts to regularise relations with Iran in order to promote more diversified gas supply sources in the longer term with Italy and Germany particularly vulnerable in the short term to any disruption in Russian supplies.
Thus the multiplicity of factors potentially bearing upon the international market for gas over the next 15-20 years are of meteorological proportions but, on balance, the probability of oversupply would appear to outweigh the prospect of shortages and in such a scenario, a narrowing of the existing wide price differentials is inevitable. Presently, prices for landed LNG at Asian terminals averages in the $14-16/ MMcf range with most contracts benchmarked to thermally-adjusted oil-equivalent prices. With North American gas prices ranging between $3.50 – 4.50 and even allowing $4-6 of liquefaction and transport costs, the scope for North American LNG to displace existing LNG supplies is material and may well serve to drag LNG prices towards, say, $10-12 over time as old contracts are replaced. Early-stage LNG suppliers to the East Asian market, such as Malaysia and Indonesia, may be able to retain their market positions based on existing long-term contracts but newer projects in Australia, Papua New Guinea, the Gulf states and Mozambique inter alia may suffer a significant commercial disadvantage if the Eurasian infrastructure requirements proceed and this could have fundamental consequences for the oil industry’s plans for hydrocarbon exploration in deep-water and other frontier areas for decades to come.
www.gaffney-cline.com
Page 7
APRIL 2014
THE SUPPLY/DEMAND BALANCE

Americas Houston 5555 San Felipe Street, Suite 550 Houston, TX 77056 USA T: +1 713 850 9955 [email protected]
Canada Gulf Canada Square, 1000-401 9 Ave SW Calgary, Alberta T2P 3C5 T: +1 403 537 3400 [email protected]
Argentina Avenida Pte. Roque Saenz Pena-917 2° Piso, Of. 1 C1035AAE-Capital Federal Buenos Aires, Argentina T: +549 11 4394 1007 [email protected]
Brazil Rua Dezenove de Fevereiro, 30 – 5° Andar Botafogo 22.280-030 Rio de Janeiro Brazil T: +5521 3907 4950 [email protected]
Colombia Calle 67 No 7-35, Piso 5, Edificio Plaza 67, Bogotá - Distrito Capital Colombia T: +571 746 1981 [email protected]
Disclaimer of Liability: This information is provided for general information purposes only and is believed to be accurate as of the date hereof, however, Gaffney Cline & Associates does not make any warranties of representations of any kind regarding the information and disclaim all express and implied warranties or representations to the fullest extent permissible by law, including those of merchantability, fitness for a particular purpose or use, title, non infringement, accuracy, correctness or completeness of the information provided herein. All information is furnished “as is” and without any license to distribute. The user agrees to assume all liabilities related to the use of or reliance on such information. GAFFNEY, CLINE & ASSOCIATES SHALL NOT BE LIABLE FOR ANY DIRECT, INDIRECT, SPECIAL, PUNITIVE, EXEMPLARY OR CONSEQUENTIAL DAMAGES FROM ANY CAUSE WHATSOEVER INCLUDING BUT NOT LIMITED TO ITS NEGLIGENCE.
© 2014 Gaffney, Cline & Associates. All rights reserved.
Barry Aling is a director of City of London Investment Group plc. During his 40-year career he has worked extensively in international capital markets, including Phillips & Drew, W.I. Carr and Swiss Bank Corporation and is a former director of Gaffney Cline & Associates and Asset Management Investment Company plc. The views expressed here are entirely his own.
www.gaffney-cline.com
Page 8
APRIL 2014
THE AUTHOR: BARRY ALING
GCA Offices
Europe, Africa & Middle East United Kingdom Bentley Hall, Blacknest Alton, Hampshire GU34 4PU, United Kingdom T: +44 1420 525366 T: +44 1420 526700 [email protected]
Russia Monarch Business Center Floor 27, 31A, bld 1 Leningradsky Prospect 125284 Moscow Russia T: +7 495 937 6151 [email protected]
Kazakhstan 20-A Kazibek bi str. Arai/Renco BC, 3rd floor Almaty Republic of Kazakhstan 050010 T: +7 727 344 10 73 [email protected] Asia Pacific Singapore 80 Anson Road, #31-01C Fuji Xerox Towers Singapore 079907 T: +65 6225 6951 [email protected]
Australia - Sydney Level 16, 275 Alfred Street North Sydney, NSW 2060 Australia T: +61 2 9955 6157 [email protected]