a new analytical method for characterization of...
TRANSCRIPT

A NEW ANALYTICAL METHOD FOR CHARACTERIZATION OF
FRACTURED RESERVOIRS
ZOHREH MOVAHED
A thesis submitted in fulfilment of the
requirements for the award of the degree of
Doctor of Philosophy (Petroleum Engineering)
Faculty of Petroleum and Renewable Energy Engineering
Universiti Teknologi Malaysia
SEPTEMBER 2015

iii
Specially dedicated to my mother
I really miss you
Al-Fatihah

iv
ACKNOWLEDGEMENT
I owe the accomplishment of the whole work to all precious figures who
grant me their kindest inspirations and contributions, to begin with Universiti
Teknologi Malaysia (UTM) for great services and kindest support of academic and
non-academic staff, my dear supervisor, Professor Dr. Radzuan Junin, the scholarly
mentor who had a fundamental role to lead me on all paths to reach success point,
put his all attempts in guiding the team to achieve our scientific goals and prominent
research publications, to allow me to grow as a research scientist and the approval of
the thesis for defense. I would like to express the deepest appreciation to my
industrial supervisor Dr. Hassan Amiri Bakhtiary, who has the attitude as a genius in
the field of this study. He granted me the permission to have access and use all
required data and the necessary materials to accomplish the work. I pay my heartiest
tribute to the committee members to contribute us on all processes and steps to early
submit and defense of the work along with amity and goodwill of the Faculty of
Petroleum and Renewable Energy Engineering during all these precious years.
I highly appreciate the guidance given by other supervisors as well as the
panels, especially in our project that has improved our work skills; thanks to their
comment and advices. I would like to thank Mostafa Alizadeh, who have assisted me
in inserting format revisions and I required to be carried out into the researches. I
would also like to thank all of my friends in NIOC south specially Mrs. Ruhangiz
Mohamadian who supported me in getting the data, and incited me to strive towards
my goal. A special thanks to my family. Words cannot express how grateful I am
with my lovely mother, father, sisters and brothers for all of the sacrifices that
you’ve made on my behalf. Your prayer for me was what sustained me thus far.
Although, my lovely mother passed away without having any disease during my
study here in Malaysia, and it was bad shocked for me, but her advises and prays
have been great sources of motivation and I recovered from this loss and strived to
finish this study to make her soul happy. At the end, I would like to express
appreciation to my beloved husband Ahmad, who spent sleepless nights with and he
was always my support in difficulties and the moments when there was no one to
answer my queries and my respect to the beautiful Malaysia to provide any needs
and excellent unique pubic facilities and its kindest people in the world.

v
ABSTRACT
Structural delineation is the main issue in the evaluation of carbonate
reservoirs in structurally complex areas. Permeability is a critical reservoir parameter
that influences well and/or reservoir performance and it is even more challenging
when the reservoir is fractured. Oil Based Mud Micro Imager - resistivity of
invading zone (OBMI-Rxo) is a high resolution curve that is sensitive to fluid
mobility near the borehole wall and indicates invasion. However most operators are
not using an accurate Rxo curve of OBMI for reservoir and petrophysical
applications. After drilling it is important that the borehole stays in good shape,
morevere, borehole instability will reduce the working life of the well. The main aim
of this study is to design a workflow in order to establish an advanced formation
evaluation in a carbonate fractured and clastic reservoirs. The entire workflow
involved incorporating borehole images, petrophysical logs, Modular Formation
Dynamics Tester tool (MDT), Xpress Pressure Tool (XPT) and cores in
characterizing fractured and non-fractured reservoirs. Image log data are processed
and interpreted in the computer using a Geoframe software. The bedding, deviation
survey and image logs are imported into the Bortex software and the heterogeneity
analysis of reservoirs from borehole images is computed based on the same
resistivity contrast principle than the layer delineation. Respectively, the Formation
Micro Imager (FMI) and OBMI images are used to examine permeability and index
mobility in conjunction with open hole logs. As a result, the answers provided by the
FMI tool helped in understanding the reservoir structure, identify and evaluate
fractures, visualize the rock texture, and complement coring programs. Single-well
permeability distribution was demonstrated by the use of advanced image analysis.
OBMI-Rxo helped to identify zones of higher permeability when combined with
conventional induction logs and porosity logs. In addition, working on advanced
borehole shape analysis improved information about the well condition.

vi
ABSTRAK
Struktur delineasi menjadi isu yang utama untuk penilaian reservoir karbonat
di kawasan berstruktur rencam. Ketertelapan merupakan parameter reservoir kritikal
yang dapat mempengaruhi pelakuan telaga dan/atau reservoir dan ianya didapati
lebih mencabar apabila reservoir mempunyai rekahan. Pengimbas Mikro Lumpur
Dasar Minyak – kerintangan zon serbuan (OBMI-Rxo) adalah lengkuk beresolusi
tinggi yang sensitif kepada pergerakan bendalir berhampiran dinding lubang telaga
dan yang menunjukkan penyerbuan, kebanyakan operator didapati tidak
menggunakan lengkuk OBMI-Rxo dengan betul pada reservoir dan bagi aplikasi
petrofizik. Selepas penggerudian dijalankan, adalah penting untuk memastikan
lubang telaga dalam bentuk yang baik. Tambahan pula, ketidakstabilan lubang telaga
akan mengurangkan jangka hayat telaga tersebut. Tujuan utama kajian ini adalah
untuk merekabentuk carta alir kerja tetap bagi penilaian formasi lanjutan untuk
reservoir karbonat rekah dan juga klastik. Secara keseluruhannya, carta alir kerja ini
untuk tujuan pencirian reservoir rekah dan bukan rekah adalah merangkupi imej
lubang telaga, log petrofizik, ‘modular formation dynamics tester tool’, ‘Xpress
pressure tool’ dan teras. Data log imej diproses dan diterjemah dengan menggunakan
komputer dengan perisian ‘Geoframe’. Data dari lapisan, survei deviasi dan imej log
diimport ke dalam perisian ‘Bortex’ dan kemudiannya pengiraan analisis
keheterogenan reservoir daripada imej lubang telaga dilakukan berdasar kepada
prinsip perbezaan kesamaan resistiviti berbanding deliniasi lapisan. Berkaitan log
lubang telaga terbuka, pengimbas mikro formasi (FMI) diguna untuk menilai
ketertelapan, manakala imej OBMI diguna untuk menilai indeks mobiliti. Sebagai
kesimpulan, hasil yang diberi oleh alatan FMI didapati dapat membantu dalam
penelitian struktur reservoir, mengecam dan menilai rekahan, memapar tekstur
batuan, dan pelengkapan program penerasan. Taburan ketertelapan telaga tunggal
telah dipapar dengan menggunakan analisis imej lanjutan. OBMI-Rxo membantu
untuk mengenal zon ketertelapan tinggi apabila ianya digabungkan dengan log
induksi konvensional dan log keliangan. Berkaitan kestabilan lubang telaga, kajian
ini juga didapati dapat menambah baik maklumat tentang keadaan telaga apabila
dijalankan analisis lanjutan bentuk lubang telaga.

vii
TABLE OF CONTENTS
CHAPTER TITLE PAGE
DECLARATION ii
DEDICATION iii
ACKNOWLEDGEMENT iv
ABSTRACT v
ABSTRAK vi
TABLE OF CONTENTS vii
LIST OF TABLES xii
LIST OF FIGURES xiii
LIST OF ABBREVIATIONS xxii
LIST OF SYMBOLS xxiv
1 INTRODUCTION 1
1.1 Introduction 1
1.2 Problem Statement 4
1.3 Objectives of the Research 5
1.4 Scopes of the Research 5
2 LITERATURE REVIEW 7
2.1 Introduction 7
2.2 Asmari Reservoir 8
2.3 Sarvak Reservoir 8
2.4 Structural Complexity in the Zagros and
Studied Oil Fields 10
2.4.1 Fault Types in Complex Reservoir 13
2.5 Fractures in Complex Structures 14

viii
2.6 Permeability in Fractured Carbonate Reservoir 16
2.7 Oil Based Mud System in Iran 18
2.8 Borehole Imaging Development and
Application 19
2.9 Borehole Imaging Tools 23
2.9.1 Water Based Mud Imaging 23
2.9.2 Oil Based Mud Imaging 23
2.10 Summary 32
3 RESEARCH METHODOLOGY 36
3.1 Introduction 36
3.2 Data Collection 37
3.2.1 Geological data – FMI, OBMI-UBI
and Cores 38
3.2.2 Petrophysical data – PEX, HRLA 40
3.2.3 Formation testing data – MDT and
XPT 40
3.3 Data Quality 41
3.4 FMI Log Processing 43
3.4.1 Sticking Detection and Speed
Correction 45
3.4.2 FMI Scaling 46
3.4.3 Static and Dynamic Normalization
of FMI Image in BorNor 49
3.5 OBMI Log Processing 51
3.5.1 Sticking Detection and Speed
Correction in BorEid 51
3.5.2 Static and Dynamic Normalization
in BorNor 51
3.6 UBI Log Processing 52
3.7 FMI Log Interpretation 55
3.7.1 Dip Interpretation on Image Log in
BorView as input to BorTex
Module 59
3.7.2 BorTex 64
3.8 OBMI-UBI Log Interpretation 71
3.8.1 Bedding 71
3.8.2 Fractures 72

ix
3.9 BorTex Processing for deriving SRES 75
3.10 Summary 77
4 RESERVOIR CHARACTERIZATION BY USING
FMI, MDT AND CORES 79
4.1 Introduction 79
4.2 An Accurate Structural Model by Introducing
a Structural System in the Complex Fractured
Reservoirs (LL-26) 81
4.2.1 Structural and Fracture
Interpretation 81
4.2.2 Complex Fault System 84
4.3 Permeability Analysis in Asmari Reservoir
(PZ-126) 90
4.3.1 Structural Dip as Input Data for
Permeability Analysis in PZ-126 90
4.3.2 Natural Fracture Characterization
(Verification Data) 96
4.4 Permeability Result 102
4.5 Porosity Result and Integration of Porosity
and Permeability Result from FMI 104
4.6 Verification of FMI Permeability with MDT
Permeability 106
4.7 Verification of FMI Permeability with Core
Permeability in PZ-126 109
4.8 Verification of FMI Permeability with Core
Permeability in Non-Highly Fractured
Reservoir 110
4.9 The Effect of Tar on the Permeability
Analysis from FMI in Asmari Fractured
Reservoir (RS-55) 115
4.10 Summary 117
5 RESERVOIR CHARACTERIZATION BY USING
OBMI, XPT AND CORES 119
5.1 Introduction 119
5.2 Structural Dip as Input Data for Mobility
Analysis 121
5.2.1 Zone 1 124
5.2.2 Zone 11 126

x
5.2.3 Zone 20 127
5.2.4 Sub Zone 28 128
5.2.5 Zone 30 129
5.2.6 Sub Zone 36-30 129
5.2.7 Zone 40 131
5.2.8 Zone 40-80 132
5.2.9 Zone 50 134
5.3 Natural Fracture Characterization
(Verification Data) 136
5.4 Quantitative Rxo in OBM in Marun Field 141
5.5 RFT/MDT Survey Planning 144
5.6 Reservoir Fluid Mobility 148
5.7 Index Permeability from OBMI in MN-322 149
5.7.1 Separations between HDRS, HMRS
and OBMI-Rxo Curves 149
5.7.2 Index Mobility in Marun-322 156
5.8 Verification of OBMI Index Permeability with
XPT Permeability 158
5.9 The Evaluation of OBMI-UBI Result
Comparing with Cores in Sarvak Fractured
Reservoir (GS-016) 161
5.9.1 OBMI-UBI Analysis 161
5.10 Comparison between OBMI-UBI and Core
Image 168
5.10.1 Comparison of Results 169
5.11 Summary 173
6 BOREHOLE CONDITION EVALUATION BY
USING FMI AND UBI 175
6.1 Introduction 175
6.2 Detailed Borehole Shape Analysis 175
6.2.1 Borehole Restrictions 184
6.2.2 Optimization of Mud Weight 184
6.2.3 Efficient Use of Lost Circulation
Material 186
6.2.4 Alteration to Well Trajectory 186
6.3 Time Lapse Imaging 187

xi
6.3.1 Borehole Stability 187
6.3.2 Fracture Characterization 188
6.3.3 Pressure and Fluid Sampling Points 189
6.3.4 Fluid Movement 189
6.4 Summary 191
7 CONCLUSIONS 192
7.1 Development of an Accurate Structural Model 192
7.2 Characterization of Fractured Reservoirs 193
7.3 Computation of Reliable Mobility Index 194
7.4 Evaluation of the Borehole Condition 195
REFERENCES 198
xii
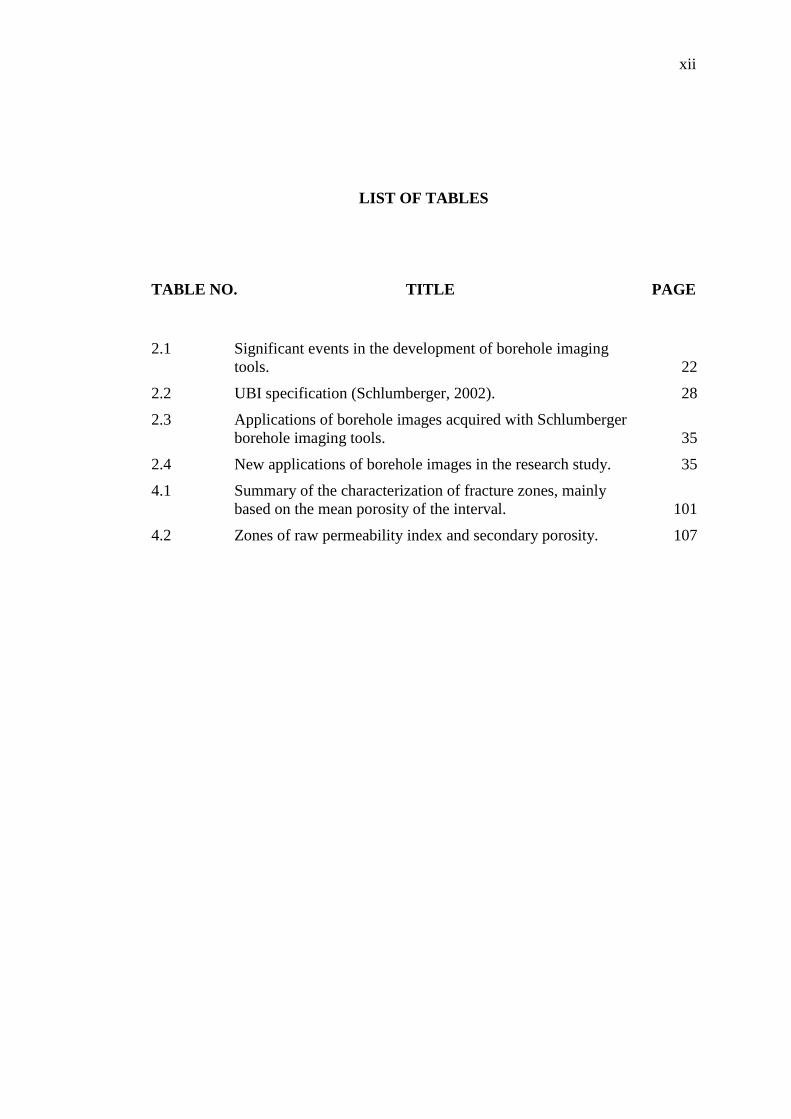
LIST OF TABLES
TABLE NO. TITLE PAGE
2.1 Significant events in the development of borehole imaging
tools. 22
2.2 UBI specification (Schlumberger, 2002). 28
2.3 Applications of borehole images acquired with Schlumberger
borehole imaging tools. 35
2.4 New applications of borehole images in the research study. 35
4.1 Summary of the characterization of fracture zones, mainly
based on the mean porosity of the interval. 101
4.2 Zones of raw permeability index and secondary porosity. 107
xiii
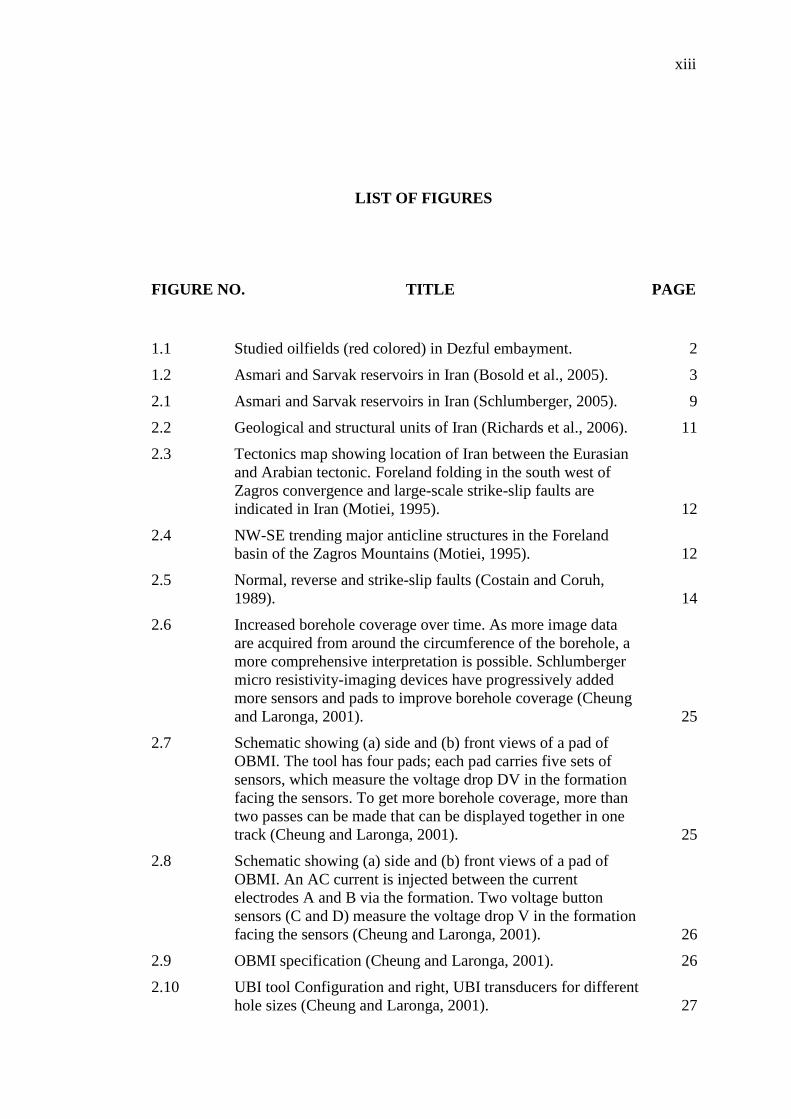
LIST OF FIGURES
FIGURE NO. TITLE PAGE
1.1 Studied oilfields (red colored) in Dezful embayment. 2
1.2 Asmari and Sarvak reservoirs in Iran (Bosold et al., 2005). 3
2.1 Asmari and Sarvak reservoirs in Iran (Schlumberger, 2005). 9
2.2 Geological and structural units of Iran (Richards et al., 2006). 11
2.3 Tectonics map showing location of Iran between the Eurasian
and Arabian tectonic. Foreland folding in the south west of
Zagros convergence and large-scale strike-slip faults are
indicated in Iran (Motiei, 1995). 12
2.4 NW-SE trending major anticline structures in the Foreland
basin of the Zagros Mountains (Motiei, 1995). 12
2.5 Normal, reverse and strike-slip faults (Costain and Coruh,
1989). 14
2.6 Increased borehole coverage over time. As more image data
are acquired from around the circumference of the borehole, a
more comprehensive interpretation is possible. Schlumberger
micro resistivity-imaging devices have progressively added
more sensors and pads to improve borehole coverage (Cheung
and Laronga, 2001). 25
2.7 Schematic showing (a) side and (b) front views of a pad of
OBMI. The tool has four pads; each pad carries five sets of
sensors, which measure the voltage drop DV in the formation
facing the sensors. To get more borehole coverage, more than
two passes can be made that can be displayed together in one
track (Cheung and Laronga, 2001). 25
2.8 Schematic showing (a) side and (b) front views of a pad of
OBMI. An AC current is injected between the current
electrodes A and B via the formation. Two voltage button
sensors (C and D) measure the voltage drop V in the formation
facing the sensors (Cheung and Laronga, 2001). 26
2.9 OBMI specification (Cheung and Laronga, 2001). 26
2.10 UBI tool Configuration and right, UBI transducers for different
hole sizes (Cheung and Laronga, 2001). 27

xiv
2.11 Optimization of mud weight (Jeffreys, 2005). 30
2.12 Example of breakouts and drilling-induced fractures (DIFs)
observed on acoustic image logs. 32
3.1 Specific research activity workflow. 37
3.2 Logging tools used to gather geological data. 39
3.3 Cross-plot between Ax & Ay, axes of accelerometers and FX
& FY of magnetometers indicate that the directional
information from GPIT is correct. 44
3.4 Flow chart of FMI and OBMI-UBI image processing chain. 45
3.5 Oriented enhanced image (right: before speed correction and
left: after speed correction) (Schlumberger, 1999). 47
3.6 Static versus resistivity matched (Schlumberger, 1999). 48
3.7 Left: static image (Equalized) computed over the entire file,
and right: Dynamic image (Enhanced) computed over 20 cm
sliding window. 50
3.8 OBMI Static and Dynamic image in Marun-297. 52
3.9 Geoframe snapshot showing ultra-sonic image attributes editor
panel. 54
3.10 Geoframe snapshot showing cross section plot (left) and spiral
plot (right). 54
3.11 UBI Static and Dynamic image in Marun-297. 55
3.12 Basic of dip computation (Schlumberger, 1999). 57
3.13 Left, manual picking of points for dip computation, and right,
calculated dip plane. 58
3.14 Different dips planes (Schlumberger, 1999). 58
3.15 FMI image showing layering within the Asmari formation. The
dips corresponding to layer / bed boundaries are shown as high
and low confidence based on their sharpness and planarity for
computation of structural dip. Dips of high confidence bedding
(circle green tadpoles) and low confidence bedding (triangular
green tadpole) are presented in Asmari formation. 61
3.16 Example of open fractures and open vuggy fracture in Asmari
formation seen by the FMI. The most of the open fractures are
not continuous. 62
3.17 Example of closed fractures (resistive fractures). 63
3.18 Background conductivity and layer computation. 65
3.19 A snapshot from BorTex (software used to extract
heterogeneities and layer details from images) highlighting the
type of information output by itself. Displayed in the is a
formation average background and layer conductivities in
Track-3 and True-Stratigraphic-Thickness in Track-4. 66
xv
3.20 A principle used in BorTex to identify spots and patches. 68
3.21 BorTex heterogeneity analysis of a FMI image. Note the fit
between the vuggy zones in the carbonate of the core and the
conductive anomalies (red spots) in the BorTex display. 69
3.22 FMI calibrated images highlighting resistive features
comprising a section of Asmari Formation. Contoured /
outlined in blue are resistive / dense features (patches in cyan
and spots in blue (the spots are those dense / resistive features /
areas whose dimensions are less than 0.003 m2)). 70
3.23 FMI calibrated images highlighting conductive features
comprising a section of Asmari formation. Contoured/outlined
in red are conductive-connected spots (i.e., the features smaller
than 0.0003 m2), in dark brown are isolated conductive spots,
and in dark magenta are conductive patches (i.e. conductive
features, larger than 0.003 m2). 70
3.24 Formula for normalization of FMI permeability. 71
3.25 OBMI-UBI image showing layering within Asmari formation.
The dips corresponding to layer/bed boundaries are shown as
high and low confidence based on their sharpness and planarity
for computation of structural dip. 72
3.26 Continuous (blue circular dips) and discontinuous (blue
triangular dips), possible (blue minus dips) open fractures by
OBMI-UBI image in Asmari formation. 73
3.27 Closed (cyan circular dips) fractures shown by OBMI images
in Asmari formation. 74
3.28 Lamination density in Asmari reservoir in Marun-322. 76
4.1 The location map of the well#LL-26 in the Lali Field. 80
4.2 The location map of the well#PZ-126 in the Pazanan field. 80
4.3 Layering in Asmari formation and statistical plots of bedding
dips indicating an average dip of 24 degrees S38W and strike
N52W-S52E. Average dip inclination of 24 degrees is the most
representative of the whole interval of Asmari formation. 82
4.4 Open fractures (blue circle) in Asmari are striking as oblique to
the bedding strike. 83
4.5 Open fractures in Asmari striking as oblique to the bedding
strike, Schmidt projection plot (upper hemisphere) of fracture
dip poles. The dip inclination histogram shows large spread for
a dip while dip azimuth rosette shows that the most of the
fracture dips to the southwest with a large scatter. 84
4.6 Composite plot of orthogonal calipers (C1 and C2), GR, FMI
static normalized images, dips, well deviation, FMI fractures,
RHOZ, NPHI, PEFZ and resistivity curves in Asmari
formation. Major fault is in zone 5 with dipping to the NNW at
59 degrees. 87

xvi
4.7 Composite plot of orthogonal calipers (C1 and C2), GR, FMI
static normalized images, dips, well deviation, FMI fractures,
RHOZ, NPHI, PEFZ and resistivity curves in Asmari
formation. The combination of FMI and open hole logs
(resistivity) shows major fault 1819m in zone 5 of Kalhur
member. 88
4.8 Schematic computer generated model using the reverse-fault
model (major fault in zone 5). 89
4.9 Composite plot of orthogonal calipers (C1 and C2), GR, FMI
static normalized images, dips, well deviation in Asmari
formation. Schematic computer generated model using the
reverse-fault model. Drag zone and disturbed zone associated
with the fault are shown. See over-turning of beds in the fault
influenced zone. Structural dips of the sections above and
below the faulted region are also marked. 89
4.10 The new sidetrack (red) is drilled based on the studied
structural model in the sidetrack 1 (blue). 90
4.11 High confidence (circle green tadpoles) is presented in
Gachsaran formation. 91
4.12 Statistical plots of bedding dips indicating an average dip of 26
degrees S36W and strike N54W-S54E. An average dip
inclination of 26 degrees is the the most representative of the
whole interval of Asmari formation. 92
4.13 Computer based structural cross-section using bedding dip data
projected along SSW-NNE plane. A structural dip of 26
degrees S36W the most representative of the whole interval of
Asmari formation. 93
4.14 Composite plot of orthogonal calipers (C1 and C2), HCGR,
FMI static normalized images, dips, well deviation, open
fracture density, aperture, porosity, resistivity curves, RHOZ, 95
4.15 Minor open fractures (blue triangle dips), Medium open
fractures (blue circular dips) and Major open fractures (blue
square dips) shown by FMI image in Zone 6.1 of Asmari
formation. 98
4.16 Statistical plots for dips of all open fractures in the Asmari
formation. 99
4.17 Statistical attribute dips of all fractures and bedding dip
attribute showing commonly oblique fractures in the Asmari
interval. 100
4.18 FMI calibrated images showing yellow lines (forming cluster
of yellow lines) connecting the conductive spots (red
contoured features) in a section of Asmari Formation. 103
4.19 Porosity histogram display over a section of Asmari (Sub
Zone 2-1). In this zone, FMI has detected a higher porosity

xvii
streak and porous patches, which Log porosity is not
responding and remains constant. 105
4.20 Composite plot of orthogonal calipers (C1 and C2), HCGR,
FMI static normalized images, open fracture density, aperture,
porosity, resistivity curves, PHIT, NPHI curves, MDT
pressure, MDT mobility points, lithology, FMI image, porosity
and FMI raw permeability indicator across the Asmari
formation. 108
4.21 Good match between FMI and core permeability. 109
4.22 Porosity waveform histogram/secondary and total porosity
from FMS, 3680-3682m. This interval is near the boundary of
the layers 5 & 6. The rock texture is changed and
porous/permeable sections are indicated by the image and
Prospect*. The core sample photo is clearly showing a big
vugs, which is also seen on the image. 111
4.23 Porosity waveform histogram/secondary and total porosity
from FMS, 3682-3684m. This interval is one of the most
productive intervals in the borehole. The slabbed core photo is
clearly indicated vuggy section, which is distinctive on the
image and from the results. 112
4.24 Permeability analysis results, Layer-6. 114
4.25 Composite plot of orthogonal calipers (C1 and C2), GR, FMI
static normalized images, open fracture density , aperture,
porosity, resistivity curves, PHI, TNPH curves, lithology, FMI
image, FMI porosity and FMI raw permeability indicator
across Asmari formation. 116
5.1 Location map of the well#MN-322 in the Marun field. 120
5.2 A section of Gachsaran contour map showing location of well
GS-16. 120
5.3 Header details for 5.4. 122
5.4 High and low confidence OBMI and UBI bedding in Asmari
formation. 123
5.5 Marun reservoir zonations (N.I.S.O.C et al., 2003) 124
5.6 Lithology and statistical plots for dips of Zone 1 bed
boundaries. 125
5.7 Lithology and statistical plots for dips of zone 11. 126
5.8 Lithology and statistical plots for dips of Zone 20 bed
boundaries. 127
5.9 Lithology and statistical plots for dips of sub Zone 28 bed
boundaries. 128
5.10 Lithology and statistical plots for dips of Zone 30 bed
boundaries. 130
xviii
5.11 Lithology and statistical plots for dips of Zone 36-30 bed
boundaries. 131
5.12 Lithology and statistical plots for dips of Zone 40 bed
boundaries. 132
5.13 Lithology and statistical plots for dips of Zone 40-80 bed
boundaries. 133
5.14 Lithology and statistical plots for dips of Zone 50 bed
boundaries. 134
5.15 Statistical plots of bedding dips indicating an average dip of 35
degrees N32E and strike N58W-S58E. Average dip inclination
of 35 degrees is the most representative of the whole interval
of Asmari formation. 135
5.16 Computer based structural cross-section using bedding dip data
projected along SSW-NNE plane. A structural dip of 37
degrees S45W is the most representative of the whole interval
of Asmari formation. 136
5.17 Continuous (blue circular dips), discontinuous (blue triangular
dips) open fractures shown by UBI and OBMI images in
Asmari formation. 138
5.18 Statistical plots of dips of all open fractures in the Asmari
interval. 139
5.19 Statistical plots of dip attributes of all closed fractures in the
zones of Asmari formation. 139
5.20 Composite plot of GR, orthogonal calipers (C1 and C2),
RHOB, NPHI and PE curves, resistivity curves, XPT pressure
data on the OBMI image, OBMI static normalized images,
dips, OBMI-UBI open and closed fracture, well deviation, UBI
static normalized images and lithology. 140
5.21 A section of the Marun contour map showing location of well
MN-292. 141
5.22 OBMI Rxo showing large separation from induction resistivity
logs in a section of Asmari sandstone sections of the MN-292
of Marun field. 142
5.23 OBMI Rxo display separation from induction resistivity logs in
carbonate. 143
5.24 Large separation between OBMI Rxo and induction resistivity logs in
a section of Asmari sandstone sections of the MN-292 of
Marun field. 143
5.25 OBMI Rxo showing large separation from induction resistivity
logs in a section of Asmari sandstone sections of the well MN-
292 in Marun field indicating large invasion due to
permeability. RFT mobility (blue circles) also computes higher
mobility in the same sections. 145
xix
5.26 The location of dry test points (yellow circles) of RFT in a
section of Asmari of well MN-292of Marun field, correspond
to shale streaks or very low permeability streaks indicated by
OBMI images. No invasion in such streaks is observed on Rxo
and induction curves indicating their very low permeability.
RFT formation mobility is indicated by blue circles. 145
5.27 A section of Marun contour map showing location of well
MN-297 146
5.28 The locations of dry test points (yellow circles) of RFT in a
section of Asmari, correspond to shale streaks or very low
permeability streaks indicated by OBMI images. No invasion
in such streaks is observed on Rxo and induction curves
indicating their very low permeability. RFT formation mobility
is indicated by blue circles. 147
5.29 Locations of dry test points (yellow circles) of RFT in a
section of Asmari of well MN-297. RFT formation mobility is
shown by blue circles. 149
5.30 The separation between OBMI Rxo and HDRS, HMRS (deep
and shallow resistivity) shows high mobility zones comparing
with XPT mobility (yellow circle) in the water zone. 150
5.31 The separation between OBMI Rxo and HDRS, HMRS (deep
and shallow resistivity) shows high mobility zones comparing
with XPT mobility (yellow circle) in the oil zone. 151
5.32 The separation between OBMI Rxo and HDRS, HMRS (deep
and shallow resistivity) show oil based mud fluid invasion
because of borehole damage 152
5.33 The separation between OBMI Rxo and HDRS, HMRS (deep and
shallow resistivity) is an indication of no invasion comparing
with XPT mobility (yellow circle). 153
5.34 OBMI Rxo shows borehole damage in zones of high formation
resistivity. 154
5.35 Match between OBMI Rxo and HDRS, HMRS (deep and
shallow resistivity) shows no invasion and impermeable
formation oil saturated rock with very irreducible water. 155
5.36 Composite plot of GR, orthogonal calipers (C1 and C2),
RHOB and NPHI curves, OBMI static normalized images,
XPT pressure data, dips, well deviation, UBI static normalized
images, lithology, and Index mobility from OBMI in the
Asmari reservoir. 157
5.37 XPT mobility in different depth interval in Asmari reservoir. 158
5.38 Composite plot of GR, orthogonal calipers (C1 and C2),
RHOB and NPHI curves, OBMI static normalized images,
XPT pressure data, dips, well deviation, UBI static normalized
images, lithology, index mobility from OBMI, index
xx
permeability from OBMI and XPT (red circle) in the Asmari
reservoir. 160
5.39 OBMI and UBI images showing layering due to argillaceous
intercalations within upper Sarvak. The dips corresponding to
layer/bed boundaries are shown as low and high confidence
based on their sharpness and planarity for computation of
structural dip. 163
5.40 Statistical plots of all bedding dips indicating a dominant
structural dip of 71 degrees S38W and strike N52W-S52E. 164
5.41 Computer based structural cross-section using bedding dip data
projected along a NNE-SSW plane. 165
5.42 A highly fractured section in the middle part of the reservoir,
showing continuous and discontinuous open fractures. 167
5.43 The summary of fracture analysis results in GS-16. Apart from
some short sections open fractures are present in its most
intervals. 170
5.44 Clear bedding planes dipping 50-60 degree SW along with
minor open fractures (partially cemented). 171
5.45 Interval where UBI images affected by borehole breakout
whereas OBMI images clearly indicate the bedding planes and
minor fractures (probably cemented). 171
5.46 Major open fracture cross- cutting bedding plane possible
slickenside on core along the fracture plane. 172
5.47 The clear example of both major and minor fracture types on
OBM log images coinciding with broken core. 172
5.48 Image log shows intensive fracturing hence the core rubble. 173
6.1 Fracture patterns examples of UBI cross-section plots in Iran. 177
6.2 Borehole breakouts and hydraulic fractures indicate that
orientation of the maximum horizontal stress is changing
across the studied field. 179
6.3 In-Situ stress analysis provided in different wells in the Marun
field (Movahed et al., 2014). 180
6.4 In-Situ stress analysis provided in different wells in Gachsaran
field (Movahed et al., 2014). 180
6.5 Image logs quality control flag color. 182
6.6 UBI image of the borehole radius showing borehole
enlargements (breakouts – black vertical stripes) around NW
and SE sides of the borehole. 185
6.7 Asymmetrical borehole wall damage resulting from
mechanical wearing related to reaming and pipe rotation. 187

xxi
6.8 FMI Images acquired over a period of 7 days, the increase in
aperture of drilling fractures and the development and/or
enlargement of borehole breakouts (left to right). 190

xxii
LIST OF ABBREVIATION
BS - Bit Size
C1 - Caliper Pair 1-3
C2 - Caliper Pair 2-4
CGR - Gamma Ray (Corrected)
CKH - Core Horizontal Permeability
COND.CONNECTED.SP - Conductive Connected Spots
COND.PATCHES - Conductive Patches
COND.ISOLATED.SPOT - Conductive Isolated Spots
CPOR - Core Porosity
CS - Cable Speed
DEVI - Borehole Deviation Angle (deg)
DYNAMIC - Sliding Window Normalization
EMEX - Measurement Control Voltage
FMI - Full bore Formation Micro Imager Tool
FRACTURE APERTURE - Aperture of Fractures
FARCTURE DENSITY - Number of Fractures Per Meter
FRACTURE POROSITY - Porosity of Fractures
GEOLOG - Geological Lithozones
GPIT - General Purpose Inclinometry Tool
HAZI - Borehole Deviation Azimuth (deg)
HC BEDDING - High Confidence Bedding
HDRS - Deep Resistivity
HGR - Gamma Ray
HMRS - Shallow Resistivity
ILD - Deep Resistivity (Deep Induction)
ILM - Shallow Resistivity (Shallow Induction)
LQC - Log Quality Control

xxiii
LC BEDDING - Low Confidence Bedding
MDT - Modular Formation Dynamics Tester Tool
NPHI - Neutron Porosity
OBMI - Oil Base Mud Imager
P1AZI - Pad 1 Azimuth (deg)
PE - Photoelectric Factor
PEFZ - Photoelectric Factor
PERM - Permeability from FMS
PERM.INDEX - Raw FMI Permeability Indicator (Mobility)
PEX - Platform Express
PHIS - Secondary Porosity
PHIT_FMI - Average High-resolution Porosity from FMI
PIGE - Shale Corrected Log Porosity
POR_HIST - Porosity Histogram
PP - Pad Pressure
RES.SOPTS - Resistive Spots
PES.PATCHES - Resistive Patches
RHOZ - Formation Density
RLA3 - Shallow Resistivity
RLA5 - Deep Resistivity
SPOR - Secondary Porosity from FMI
STATIC - Fixed Window Normalization
TENS - Tension
TNPH - Porosity from Neutron Log
UBI - Ultrasonic Borehole Imager tool
WALL - Borehole Wall
XPT - Xpress Pressure Tool
xxiv
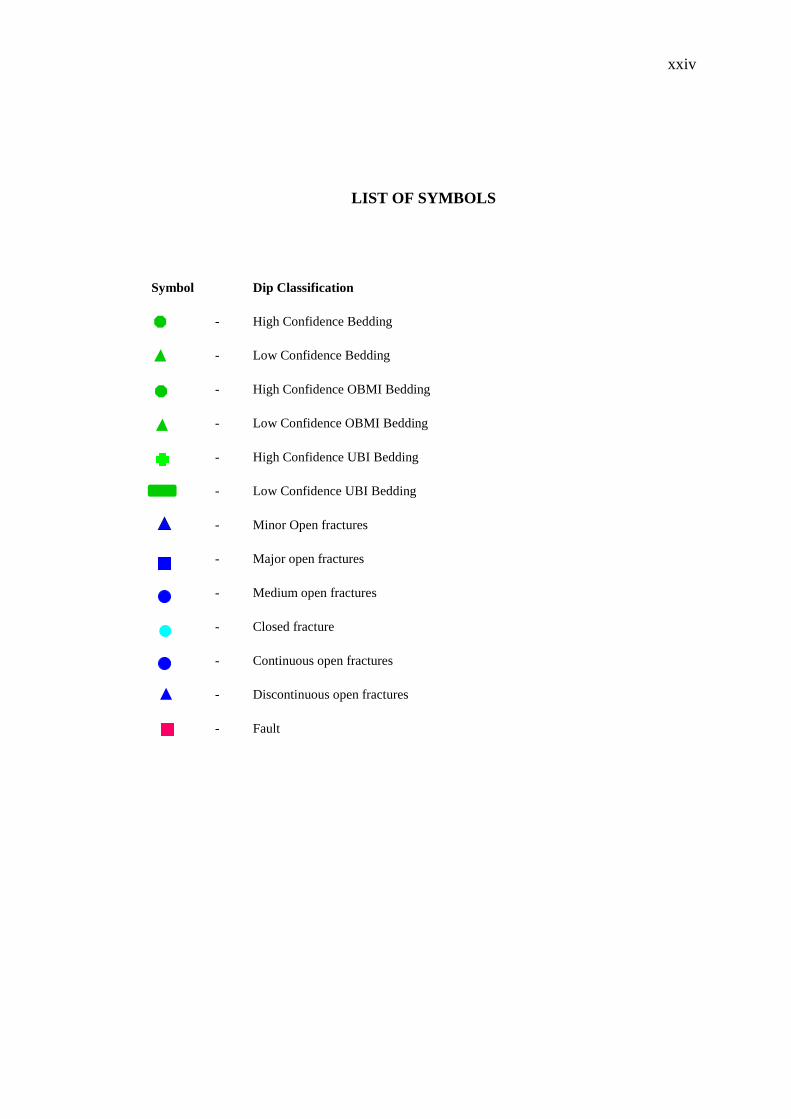
LIST OF SYMBOLS
Symbol
Dip Classification
- High Confidence Bedding
- Low Confidence Bedding
- High Confidence OBMI Bedding
- Low Confidence OBMI Bedding
- High Confidence UBI Bedding
- Low Confidence UBI Bedding
- Minor Open fractures
- Major open fractures
- Medium open fractures
- Closed fracture
- Continuous open fractures
- Discontinuous open fractures
- Fault

CHAPTER 1
1 INTRODUCTION
1.1 Introduction
Outcrop study of the target formations/ reservoirs have a great importance to
understand the possible geological (structural and sedimentological) and reservoir
characteristics of the reservoir. These features are studied at different scales to
determine their lateral and vertical extent and distribution. This is mainly achieved
by various technologies, such as, Brunton compasses/Inclinometers, topographic
maps, aerial photographs, and satellite images. A similar approach is needed for
delineating and characterizing the reservoirs in the subsurface. The large scale
subsurface features are delineated with the surface seismic (2D and 3D) techniques.
However, the coarse resolution (generally greater than 10 m) of these techniques
does not allow for feature identification of smaller scales (for instance, cross
bedding, bedding, fractures, and vugs/moulds) that are very useful for detailed
characterization of reservoir rocks.
Borehole images are very useful in cases where information on geological
(structural and sedimentological) and reservoir features are required. Structural dip
by definition is the present day formation dip used to build the structural cross
section. It is also a record of the post-depositional structural alteration and may
indicate the tectonic history of the sequence. It is not an average dip for all the
bedding planes. Apart from structural analysis, the investigation of fractures is the
main application for image logs in Dezful Embayment, Iran. Information on
fractures is important to know because of their higher permeability, hence their

2
biggest influence on reservoir producibility. Schlumberger provides high quality
borehole images in wells drilled with all types of mud; water based mud and oil
based mud. These images can be acquired in wells of all geometries ranging in
deviation from 0.0 degrees to more than 90 degrees. It is now possible to get
resistivity of the invaded zone (Rxo) in the wells drilled with oil-base mud using the
state-of-the-art imaging tool called the Oil Base Mud Imager (OBMI)
(Schlumberger, 2005). By using advanced interpretation, it can compute
permeability from the borehole images in carbonates.
This study highlights the importance of data integration and borehole images
in the domains of geology, petrophysics, geomechanics/drilling, reservoir and
production engineering in different oil fields of National Iranian South Oil Company
(NISOC). Borehole images logged in Asmari and Sarvak reservoirs from the NISOC
fields like Lali, Gachsaran, Marun, Mansuri and Pazanan are discussed (Figure 1.1).
Figure 1.1 Studied oilfields (red colored) in Dezful embayment.

3
The Asmari formation consists of limestones, dolomitic limestone,
argillaceous limestone, and anhydrite and the lithology of Sarvak formation is
limestone and it lies below Ilam reservoir (Motiei, 1993) (Figure 1.2). Our research
establishes a technique to increase the reservoir explanation of the Asmari and
Sarvak reservoir by using a new application of image logs.
Figure 1.2 Asmari and Sarvak reservoirs in Iran (Bosold et al., 2005).

4
1.2 Problem Statement
The crossing Asmari reservoir is not so easy in some cases due to structural
complexities, where there is a thick pile of evaporates of Gachsaran formation over
the reservoir. In some wells, higher than the expected thickness of formations is
found. Dip classification based on a geological log has the advantage of providing a
direct representation of structural origin and identify Asmari fault and fracture
systems and its influence on production and resolve structural complexity.
Fracture intensity and deep rooted fractures extensively increase risk of
unexpected water production. So, it is vital to know, whether reservoir is fractured or
not. If it is fractured then what is the kind of fractures (open or closed) and what is
their intensity? Do they occur as a single set or multiple sets and what orientation is
their dominant strike? Solutions to questions like these support geologists and
reservoir engineers increase oil production (Movahed et al., 2014) and in this study
the borehole imaging tools, like the Formation Micro Imager (FMI), Oil Base Mud
Imager - Ultrasonic Borehole Imager (OBMI-UBI) are interpreted to find solutions
for fracture systems and fracture attributes.
Permeability analysis of dual porosity systems with heterogeneous
distribution of dissolution fabrics can evaluate by using the FMI, but NISOC is not
using permeability from FMI in a case when there are no any formation testing data
in the well for fracture and reservoir modeling. In this study, image logs provided the
most representative measurements in geological and petrophysical heterogeneous
formations and present a method to measure permeability from FMI in Asmari and
Sarvak reservoirs.
OBMI-Rxo is a high resolution curve that is sensitive to fluid mobility near
to the borehole wall and which indicates invasion and indirectly lithology, but
NISOC is not using an accurate Rxo curve of OBMI for reservoir and petrophysical
application. This method using resistivity classes is used to show how the high
resolution OBMI curves can be used. The result of this research demonstrates the

5
new analytical method to evaluate a fractured carbonate and clastic reservoirs from
Iran.
The most wells drilled in Iran suffer from geomechanical hazards owing to
the high in–situ stress related to the proximity of the Zagros Mountain and it is not
always possible to acquire wireline log data because of the borehole condition
(Movahed et al., 2014). In this study, advanced borehole shape analysis by using
FMI and UBI helped regarding borehole instability and improved information about
the well condition.
1.3 Objectives of the Research
The objectives of the research are given below:
1. To develop an accurate structural model for Asmari reservoir.
2. To characterize fractures in the borehole.
3. To compute reliable index mobility from OBMI and index
permeability from FMI.
4. To evaluate the borehole condition in order to reduce drilling risk and
avoid potential well bore damages.
1.4 Scopes of the Research
Borehole images were integrated with other data (petrophysical, reservoir,
and geophysical) to understand the various characteristics of the Asmari both in oil
based mud and water based mud systems. In this study, borehole images are used to
solve different issues in geology, petrophysics, reservoir engineering, production
engineering, sedimentology, geomechanic and drilling in NISOC oil fields that is
explained in the following:

6
1. Image log data are processed for a number of factors that may affect
the quality of the images in Geoframe. Such factors include: variation
in speed of the tool relative to the drill-pipes, or cable speed; sticking
of the tool. Additionally, image logs are equalized and normalized to
improve the information of features in it. Interpretation typically
started with hand picking dips using sinusoid techniques on image log
presented at 1:20 or 1:10 scale so that the geological features are
easily visualized. Once dips have been picked they have to be
classified into bed boundaries and fractures.
2. Interpreting structural dip resolved structural complexity, thus
provided the exact location of the well in the Asmari reservoir, which
could not reach the lower contact of Asmari by interpreting FMI
images and petrophysical logs in wells LL-26.
3. The structural dip from PZ-126 was used as input for permeability
analysis and it was imported into the Bortex module and computed
reservoir heterogeneity from FMI used to extract heterogeneities and
layer details from images. In addition to formation heterogeneities,
the software also calculated index permeability of the reservoir.
Fracture properties (open or closed), occurrence, orientation, spacing,
and porosity were interpreted by using Image log and imported as
indirect input for permeability analysis.
4. The OBMI structural dip data is imported into the Bortex software in
the MN-322.OBMI tool was used to identify zones of higher
permeability when combined with conventional induction logs and
porosity logs. Separation between Rxo curves (one from each of four
OBMI pads) and induction logs, due to invasion of oil in the mud,
indicated higher permeability.
5. The borehole cross sections are interpreted to give a very detailed
account of the in-situ stress conditions by using UBI.

REFERENCES
Aadnoy, B. and Bell, S. (1998). Classification of Drilling-Induced Fractures and
Their Relationship to In-Situ Stress Directions. The Log Analyst, v. 39, no. 6,
November-December, pp. 27-42.
Akbar, M. (1993). Finding Fractures in Tight Reservoirs. Schlumberger.
Akbar, M., Petricola, M., and Watfa, M. (1994). Classic Interpretation Problems:
Evaluating Carbonates. Oilfield Review, Vol. 7, no. 1, pp. 38-57.
Akbar, M. and Sapru, A. (1994). In-Situ Stresses in the Subsurface of Arabian
Peninsula and their Effect on Fracture Morphology and Permeability.6th
ADIPEC, ADSPE 99, Abu Dhabi, U.A.E.
Akbar, M. , Petricola, M.,Watfa, M., Badri, M., Charara, M., Boyd, A.,Cassell, B.
(2001). Porosity Analysis from FMI, Schlumberger.
Alavi, M. (2004). Regional Stratigraphy of the Zagros Fold-thrust belt of Iran.
American Journal of Science, Vol.304, pp. 1-20.
Bell J.S. (1990). Investigating Stress Regimes in Sedimentary Basins Using
Information from Oil Industry Wireline Logs and Drilling Records.
Geological Applications of Wireline Logs, Geological Society Special
Publication No. 48, London, pp. 305-325.
Borbas, T., Wendt, B., Jacques, R., Tabanou, J.R., Cheung, P., Liu, C. B., Hansen,
S., Lavigne, J., Omeragic, D. and Pickens, T. (2002). Thinly Laminated
Reservoir Evaluation in Oil-Base Mud: High Resolution Versus Bulk
Anisotropy Measurement, a Comprehensive Evaluation. SPWLA 43rd
Annual Logging Symposium. 2-5June. Paris, France.
Bosold, A., Schwarzhans, W., Julapour, A., Ashrafzadeh, A.R.and Ehsani ,S.M.
(2005). The structural geology of the High Central Zagros revisited (Iran),
RWE Dea AG, Ueberseering 40, D-22297 Hamburg.
Bram, K., Harjes, H. P., Dürbaum, H. J., Gebrande, H., Gebrande, H., Hirschmann,
G. , Janik, M., Klöckner, M., Lüschen, E., Rabbel, W., Simon, M., Thomas,

199
R., Tormann, J., and Wenzel, F. (1995). Origin and Nature of Crystal
Reflections. Results from Integrated Seismic Measurements at the KTB
Superdeep Drilling Site.
Bratton, T.,Canh, DV.,Van Que, N., Duc, NV., and Gillespie, P. (2006). Naturally
Fractured Reservoirs, Oilfield, Schlumberger.
Cheung, P., and Laronga, R. (2001). Field Test Results of a New Oil-Based Mud
Formation Imager Tool. Transaction of the SPWLA 42nd annual logging
symposium, Houston, Texas.
Cheung, P. , and Laronga, R. (2002). Oilfield Review. Schlumberger.
Costain, J. K., and Çoruh, C. (1989). Tectonic Setting of Triassic half-grabens in the
Appalachians. Seismic data acquisition, processing, and results: American
Association of Petroleum Geologists Memoir 46, p. 155-174.
Cox, J. W. (1983). Long-Axis Orientation in Elongated Boreholes and its Correlation
with Rock Stress data. Transactions of the SPWLA 24th Annual Logging
Symposium, Calgary, Canada.
Dauod, M. (2010). Advanced Field Scale Modeling. Schlumberger.
Daungkaew S., Fujisawa, G.,Chokthanyawat, S.,Comrie-Smith, N.,and Thaitong, T.
(2012). Is there a better way to determine the viscosity in waxy crudes? SPE
Asia Pacific Oil and Gas Conference and Exhibition, APOGCE.
Haller, D., and Porturas, F. (1998). How to Characterize Fractures in Reservoirs
Using Borehole and Core Images. Case Studies. Geological society, vol. 136.
Special Publications, London, pp. 249 259.
Jacques, W. (2010). The Handbook of Groundwater Engineering, Second Edition.
Taylor & Francis. p. 7 in chapter 2. ISBN 978-0-8493-4316-2.
Jeffreys, P. (2005). Hole shape and In-situ stress from Geological Images from Iran.
Schlumberger
Khoshbakht. F., Memarian, H., and Mohammadnia, M. (2009). Comparison of
Asmari, Pabdeh and Gurpi formation's fractures derived from image log.
Journal of Petroleum Science and Engineering 65 -74.
Lehne, K.A. and Aadnoy, B. (1992). Quantitative Analysis of Stress Regimes and
Fractures of Logs and Drilling Records of a North Sea Chalk Field. The Log
Analyst, pp. 351-361.
Ma, T. A. (1993). Natural and Induced fracture, classification using image analysis.
Viewed 8 of February 2012 <www.onepetro.org>

200
Mitra, S. (2002). Fold Accommodation Faults. AAPG Bulletin, v. 86, no. 4, pp. 671-
693.
Motiei, H. (1993). Stratigraphy of Zagros in Hushmandzadeh. Treatise on the
Geology of Iran: Tehran, Geological Survey of Iran, 536 p.
Motiei, H. (1995). Petroleum Geology of Zagros. Geological Survey of Iran with
cooperation of Deputy Ministry of project and planning, no. 25.
Movahed, Z., Junin, R., Safarkhanlou, Z., and Akbar, M. (2014). Formation
Evaluation in Dezful Embayment of Iran using oil-based-mud Imaging
Techniques, Journal of Petroleum Science and Engineering121 (2014)23–37
37.
Movahed, Z., Junin, R., and Jeffreys, P. (2014). Evaluate the Borehole Condition to
Reduce Drilling Risk and Avoid Potential Well bore Damages by using
Image Logs, Journal of Petroleum Science and Engineering122 (2014)318-
330.
Mount, V.S. and Suppe, J. (1987). State of Stress near the San Andreas Fault:
Implications for Wrench Tectonics. Geology, 15, pp. 1143-1146.
Nimmagadda, Shastri, Dreher and Heinz (2010). Ontology based Warehouse
Modeling of Fractured Reservoir Ecosystems For an Effective Borehole and
Petroleum Production Management. P 490 - 496
N.I.S.O.C, Statoil and RIPI (2003). Sedimentology and Stratigraphy and Reservoir
Quality of the Asmari formation in the Marun field.
Nelson, R. A. (2001). Geologic Analysis of Naturally Fractured Reservoirs.
Houston, Texas: Gulf publishing company. Pp. 322.
Newberry, B. M., Grace, L. M. and Stief, D. (1996). Analysis of Carbonate Dual
Porosity Systems from Borehole Electrical Images.
Park, R. G. (2005). Foundation of Structural Geology (reprint of the 1997 Chapman
and Hall edition) Routledge, Abingdon, England, page 9, ISBN 978-0-7487-
5802-9.
Prensky. S. E. (1999). Advanced in Borehole Imaging technology application.
Rezaeei, M.R. (2006). The book of petroleum Geology, alavi propagation; 472p.
Richards, J., Wilkinson, D. and Ullrich,T. (2006). Geology of the Sari Gunay
Epithermal Gold,Department of Earth and Atmospheric Sciences, doi:
10.2113/gsecongeo. 101.8.1455 Economic Geology December 2006 vol. 101
no. 8 1455-1496
201
Russell, S. D., Akbar, M., Vissapragada, B. and Walkden, G. (2002). Rock types
and permeability prediction from dip meter and image logs. AAPG Bulletin,
86 (10), 1709-1732.
Sadler, R (2002). Integrated characterization of fractures and faults of the Shu'aiba
reservoir, Shaybah field, AJGS, v. 7, no. 2, p. 291-292.
Sahin, A. and Ali, A. Z. (2011). Comparison of patterns of permeability anisotropy
distributions in Jurassic and Cretaceous carbonate reservoirs, AJGS, v. 16,
no. 2, p. 209-210.
Schlumberger (1999). Borehole Image Measurements. Schlumberger documents.
Schlumberger (2002). UBI- Advanced borehole imaging independent of mud type,
SMP-5871.
Schlumberger (2005). Stratigraphy and Geology of Iran, Reservoir Symposium.
Sembiring, P., Bashir, N., and Danardatu, H. (2005). Oil Based Mud Micro Imager
(OBMI) Application in Sangatta Field. SPE-92779-MS, SPE Asia Pacific Oil
and Gas Conference and Exhibition, 5-7 April.
Sepehr, M. (2004). The Structural Framework of the Zagros Fold–Thrust Belt, Iran,
DOI: 10.1016/ j. marpetgeo.
Shang, R. , Tang, D. (2005). Fracture Pattern and Associated Aperture Distribution:
Example from The Foothills, SPWLA, Paper AA.
Shariatinia, Z., Haghighi, M. ,Feiznia, S., Hall, D., Levresse, G.,Dehghani, A. , and
Rashidi, M. (2013). Paleofluid analysis from fracture-fill cements in the
Asmari limestones of the Kuh-I-Mond field, SW Zagros, Iran, Arabian
Journal of Geosciences, 2013: 6 (7):2539-2556, Springer, ISSN: 1866-7511.
Shawky, I. (2006). Application of Most Recent Borehole Geophysical Logging for
Aquifer Characterization, Proceedings of the 5th International Symposium on
Management of Aquifer Recharge, Berlin, Germany, 11-16 June 2005,
UNESCO, Paris, p. 467-473.
Soliman, Osama M., Saad Aba, A.,and Bader, A. (2010). Tectonic and Climatic
Controls of Post Glacial Terminal Fluvial Systems, Permian Unayzah
Reservoir.
Sorkhabi, R. (2014). How Much Oil in the Middle East? Vol. 11, No. 1 – 2014.
Stocklin, J. (1968). Structural History and Tectonics of Iran. AAPG, Bull.52, pp.
509-526.
202
Stroble, R. (2009). The Value of Dipmeter and Borehole Images in oil sands
Deposit. A Canadian Study.
Szabo, F. and Kheradpir, A. (1978). Permian and Triassic stratigraphy, Zagros
Basin, South West Iran. Journal of Petroleum Geology, 1,2, pp. 57-82.
Tatar, M., Hatzfeld, D., and Ghafory-Ashtiany, M. (2004). Tectonics of the Central
Zagros (Iran) deduced from micro-earthquake seismicity, Geophysical
Journal International, v. 156, pp. 255-266.
Tingay, M., Reinecker, J., and Müller, B. (2008). Borehole Breakout and Drilling-
Induced Fracture Analysis of Image Logs, World Stress Map Project.
Watts, N.L. (1983). Microfractures in Chalks of Albuskell Field, Norweigan sector,
North Sea, possible origin and distribution, AAPG bulletin, v. 67, No. 2, p
201-234.
Wazeer, F., Ismail, F., and Standen, E. (1990). Fracture Geometry and Hydrocarbon
Productivity in the Basement Rocks of the Zeit Bay Field - Gulf of Suez,
Egypt, EGPC exploration and Production Confertingayence.
Yang, J., Gou, X., Hilmi, N., and Xia, R. (2012). Identify Fracture Features and to
Classify Fracture Types. Fractured carbonate reservoirs.
Zhang, J. (2013). Borehole Stability Analysis, Accounting for Anisotropies in
Drilling to Weak Bedding Planes. Int. J. Rock Mech. Min. SCI. 60,160-170.