a nanospring named erythrocyte. the biomembrane force probe
TRANSCRIPT
Molecular Interactions
A Nanospring Named Erythrocyte. The Biomembrane Force Probe
CHRISTINE GOURIER, ANTOINE JEGOU, JULIEN HUSSON, and FREDERIC PINCET
Laboratoire de Physique Statistique de l’Ecole Normale Superieure, associe aux Universites Paris 6 et Paris 7, UMR CNRS 8550,24, rue Lhomond, 75231 Paris Cedex 05, France
(Received 29 July 2008; accepted 20 October 2008; published online 11 November 2008)
Abstract—The Biomembrane Force Probe, BFP, is a sensi-tive technique that allows the quantification of singlemolecular bonds. It is a versatile tool that can be used in awide range of forces (0.1 pN to 1 nN) and loading rates(1–106 pN/s). This article describes the principle of the BFPtechnique, how to set it up and its various advantages. Inorder to show that this technique is a powerful tool that canbe used on a wide range of systems, two different types ofapplications are presented. The first example shows how theenergy landscape of a single bond can be deduced from themeasurements on a well defined pair: the streptavidin–biotincouple. The second example presents a case where cell–cellinteractions can be probed at the molecular level: mamma-lian gametes interactions.
Keywords—Biomembrane Force Probe, Micromanipulation,
Single molecular bond, Rupture force, Streptavidin biotin
bond, Gamete interactions.
INTRODUCTION
Weak-non covalent interactions govern structuralcohesion and mediate most of life’s functions. Theseinteractions result from molecular bonds that connectligands to their receptors. Such ligand receptor com-plexes can be characterized by the quantification of itsstrength. The usual way is to exert traction on thecomplex and measure the pulling force that has to beapplied to dissociate it. However, this approachrequires in-depth analysis of the measurements. Indeed,ligand-receptors bonds are not covalent, thus weak.Their life spans are short (from microsecond to severaldays) since they are permanently under thermal fluc-tuations that will eventually cause their breaking. Let’simagine that a pulling force is applied very slowly to thebond. After a period equal typically to the bond life
span, it will break and the measured force will be closeto zero because thermal excitation will have providedthe necessary work. Suppose now that the traction isapplied very quickly to the same bond. In the shortperiod that precedes its rupture, the probability that athermal fluctuation high enough to dissociate thecomplex occurs is weak. A higher force will therefore bemeasured. This shows that speaking of the strength of abond has no sense if considered independently of theloading rate. Moreover, if an experiment is made twiceon a given molecular complex, even if traction condi-tions are identical, the measured rupture forces will stillbe different. This is due to the random nature of ther-mal fluctuations. Thus, a molecular bond cannot becharacterized by a single rupture force. Only a distri-bution of rupture forces at a given traction conditioncan be obtained. The theoretical description of a bondunder an external pulling force is due to Bell in 1978.3
In 2001, Evans8 related it to the theory of transientstates based on Arrhenius work at the end of the 19thcentury and derived by Kramer in 1940.26
Only a few techniques capable of measuring ruptureforces of single molecular bonds are currently avail-able. The small forces (from a few pN to tens of pN)and distances (nm) involved at a molecular level are areal challenge for the experimentalist. A classicaltechnique with such a precision is the Atomic ForceMicroscope (AFM). An alternative experimentaltechnique is the Biomembrane Force Probe (BFP), aforce transducer designed during the nineties by EvanEvans with the aim to probe molecular adhesion andstructure at living cell interfaces.14
The present article focuses on this BFP technique.The first section will give a detailed description of theset-up and the progression of a typical experiment. Inthe second section, the BFP technique will be apply totwo very different problems. The first one concerns thekinetics of transition of a single non covalent bondfrom one metastable state to another. The second oneis a more biological question, the interactions ofmammalian gametes.
Address correspondence to Frederic Pincet, Laboratoire de
Physique Statistique de l’Ecole Normale Superieure, associe aux
Universites Paris 6 et Paris 7, UMR CNRS 8550, 24, rue Lhomond,
75231 Paris Cedex 05, France. Electronic mail: [email protected]
Cellular and Molecular Bioengineering, Vol. 1, No. 4, December 2008 (� 2008) pp. 263–275
DOI: 10.1007/s12195-008-0030-x
1865-5025/08/1200-0263/0 � 2008 Biomedical Engineering Society
263

THE BFP TECHNIQUE
General description
The BFP14 (Fig. 1) uses a force transducer made ofa biotinylated erythrocyte (biotinylated Red BloodCell, bRBC) maintained by a glass micropipette. Astreptavidin-coated glass microbead is attached to thebRBC. The erythrocyte is used as a spring of knownstiffness k, which is tuned by the controlled aspirationpressure applied by the holding micropipette: thestronger the aspiration, the higher k. The assemblyformed by the bRBC and the microbead constitutes apowerful nanodynamometer and is the force trans-ducer used in the BFP. The streptavidin-coated glassbead can be decorated with ligands of interest whichwill be displayed on the tip of the force transducer.When the decorated glass bead is brought into contactwith a target (another bead, a vesicle, a living cell, etc)bearing complementary receptors, one or more bondsmay form. When this situation occurs, an adhesionevent is observed. For simplicity, we will simply call it‘‘an event’’. The density of ligands and/or receptors onthe surfaces is generally adjusted to observe an event inless than 10% of contacts. As we will later see, suchcontrol is not always possible. In the case of a homo-geneous distribution of ligand and/or receptors at thesurfaces, such a rate of events ensures a probabilityhigher than 95% that any given event corresponds to asingle molecular bond.29 It is worth noting that thefinding that bond formation is a rare event proves thatmost detected events represent single molecular bondsonly if it is assumed that single molecular bonds canactually be detected.
When the two surfaces are separated, the bond issubmitted to a traction force that induces the defor-mation of the red blood cell. In practice, this defor-mation is measured through a precise video tracking ofthe microbead attached to the bRBC. The ruptureforce of the bond is deduced from the maximumelongation of the red blood cell. As explained above,because of thermal fluctuations, the rupture forcedepends on the traction conditions and only a distri-bution of rupture forces can be obtained for any giventraction conditions.
Micropipette Fabrication
The BFP technique requires glass micropipetteswith inner diameter adapted to the size of the beads,vesicles or cells used (typically from 2 to 10 lm). Thedifferent steps of pipette preparation are detailed inFig. 2. Micropipettes are first obtained by elongating
FIGURE 1. Right: probe of the BFP composed by a biotin-ylated erythrocyte and a streptavidinated glass bead. The redblood cell is used as a spring. Its stiffness is controlled by theaspiration pressure in the holding pipette. The glass bead isalso functionalysed with ligands. Left: the target (here anotherbead) decorated with receptors is maintained at the extremityof a second pipette. From Merkel et al.29
FIGURE 2. Micropipette fabrication. Step 1: elongation of aborosilicate glass capillary with a micropipette puller. Step 2:(a–c) aperture of the micropipette to a suitable diameter with amicroforge. Step 3: (d) Tilt of the pipette extremity (necessaryfor some applications).
GOURIER et al.264
borosilicate glass capillaries (1 mm outer diameter,0.58 mm inner diameter, Harvard Apparatus, USA)with a micropipette puller (P-2000, Sutter InstrumentsCo., USA). This apparatus is made of a laser used asheating source, and of two pulling springs. The centralpart of the capillary is heated while the springs apply atraction force to the capillary extremities. The centralpart of the capillary gets thinner and thinner until itbreaks. After breaking, the capillary is split into twoclosed micropipettes. Next a custom-made microforgeallows the opening of the micropipette extremity at thedesired diameter. The microforge is made of a plati-num wire connected to a power supply. A solid drop ofglass fixed on the wire melts when the power is on. Theclosed tip of the pipette is introduced over a fewmicrometers into the melted glass before power isswitched off. The solidification of the glass drop gen-erates a stress at the extremity of the pipette inducingits rupture. The resulting pipette is open but its aper-ture is not regular. To circumvent this problem, poweris switched on again and the pipette is brought intocontact with the melted glass drop a second time.Through capillarity forces, a tongue of melted glassenters the pipette. When power is finally switched off,the pipette breaks in a neat fracture at the end of thetongue.
For some applications, tilted pipettes must be used(see Fig. 2d). In these cases, the extremity of the pipetteis brought close to the wire. When power is on, theheat produced by the hot wire force the pipette tobend. Heating is stopped when the tilt angle is satis-factory (typically 30�).
Micromanipulation and Aspiration
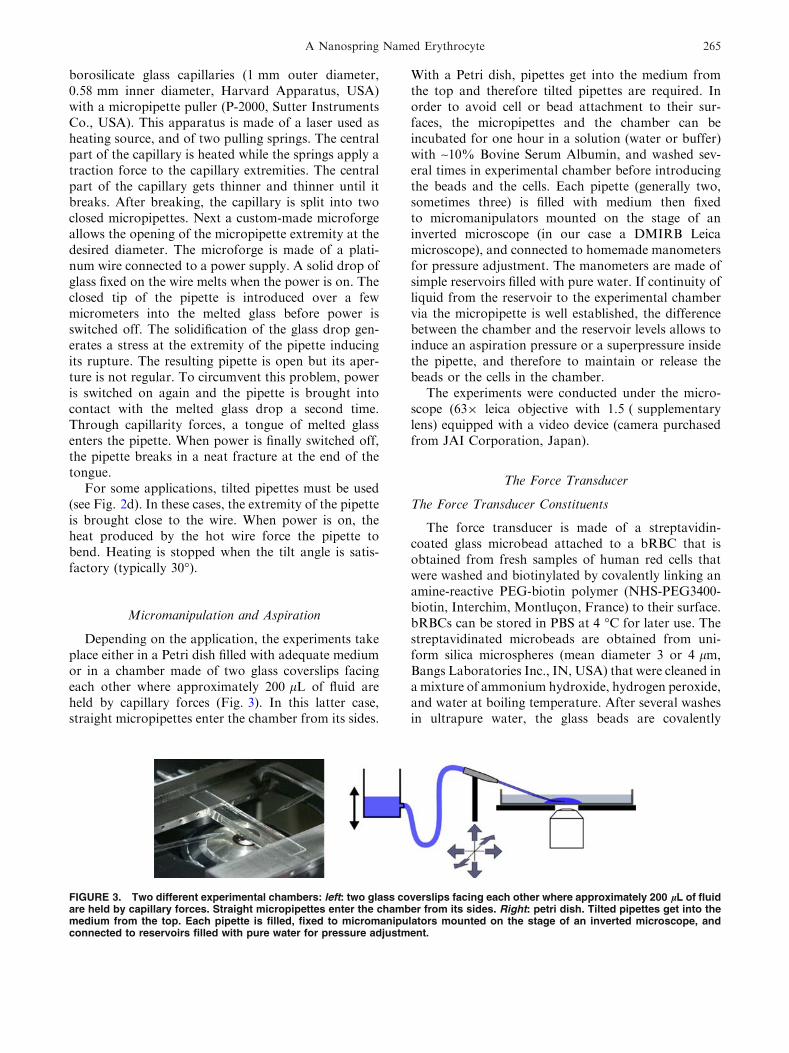
Depending on the application, the experiments takeplace either in a Petri dish filled with adequate mediumor in a chamber made of two glass coverslips facingeach other where approximately 200 lL of fluid areheld by capillary forces (Fig. 3). In this latter case,straight micropipettes enter the chamber from its sides.
With a Petri dish, pipettes get into the medium fromthe top and therefore tilted pipettes are required. Inorder to avoid cell or bead attachment to their sur-faces, the micropipettes and the chamber can beincubated for one hour in a solution (water or buffer)with ~10% Bovine Serum Albumin, and washed sev-eral times in experimental chamber before introducingthe beads and the cells. Each pipette (generally two,sometimes three) is filled with medium then fixedto micromanipulators mounted on the stage of aninverted microscope (in our case a DMIRB Leicamicroscope), and connected to homemade manometersfor pressure adjustment. The manometers are made ofsimple reservoirs filled with pure water. If continuity ofliquid from the reservoir to the experimental chambervia the micropipette is well established, the differencebetween the chamber and the reservoir levels allows toinduce an aspiration pressure or a superpressure insidethe pipette, and therefore to maintain or release thebeads or the cells in the chamber.
The experiments were conducted under the micro-scope (639 leica objective with 1.5 ( supplementarylens) equipped with a video device (camera purchasedfrom JAI Corporation, Japan).
The Force Transducer
The Force Transducer Constituents
The force transducer is made of a streptavidin-coated glass microbead attached to a bRBC that isobtained from fresh samples of human red cells thatwere washed and biotinylated by covalently linking anamine-reactive PEG-biotin polymer (NHS-PEG3400-biotin, Interchim, Montlucon, France) to their surface.bRBCs can be stored in PBS at 4 �C for later use. Thestreptavidinated microbeads are obtained from uni-form silica microspheres (mean diameter 3 or 4 lm,Bangs Laboratories Inc., IN, USA) that were cleaned ina mixture of ammonium hydroxide, hydrogen peroxide,and water at boiling temperature. After several washesin ultrapure water, the glass beads are covalently
FIGURE 3. Two different experimental chambers: left: two glass coverslips facing each other where approximately 200 lL of fluidare held by capillary forces. Straight micropipettes enter the chamber from its sides. Right: petri dish. Tilted pipettes get into themedium from the top. Each pipette is filled, fixed to micromanipulators mounted on the stage of an inverted microscope, andconnected to reservoirs filled with pure water for pressure adjustment.
A Nanospring Named Erythrocyte 265

bound with amino silane groups (N-(2-Aminoethyl)-3-aminopropylmethydimethoxysilane, ABCR GmbH,Germany). The silanized glass beads are then reactedwith a mixture of Amine-reactive polyethylene oxidepolyethylene glycol with biotin (NHS-NHS-LC-LC-biotin, Interchim, Montlucon, France) and Sulfo-MBS(Pierce, c/o Touzard et Matignon, France). The laststep consists in saturating biotinylated microbeads withstreptavidin by incubated the beads in a 2 mg/mLstreptavidin solution (Jackson Immunoresearch Labo-ratories, Inc., USA). Beads are finally washed severaltimes in PBS at 4 �C for later use.
Force Transducer Assembling
A crucial step in the preparation of a BFP experi-ments is the assembling of the force transducer. It isillustrated in Fig. 4. Biotinylated erythrocytes andstreptavidinated beads are first introduced in theexperimental chamber. With the micromanipulators,the extremities of the two opposite pipettes are broughtclose to a red blood cell and a bead respectively. Ifaspiration pressures are imposed to the micropipettes,they grab a bead and an erythrocyte. The red blood celland the bead are then micromanipulated in contact ina way that both are aligned with the pipette axis. Thiscontact allows the formation of many streptavidin/biotin bonds. When releasing the aspiration pressure inthe bead holding pipette, the bead remains firmlyattached to the erythrocyte. The high affinity of biotinfor streptavidin ensures a long time adhesion com-pared to a BFP experiment duration (from a fewminutes to tens of minutes) and an adhesion strongerthan the interactions that are studied.
The Force Transducer Spring Constant
Evans10 has studied the deformation of a red bloodcell submitted to a force. For small deformation (i.e. itwill be the case in both applications described later),the erythrocyte behaves like a spring with a springconstant given by Eq. (1):
k ¼ pRpDP
ln2Rg
Rp
� �þ ln
2Rg
rb
� �� �1� Rp
Rg
� � ð1Þ
where DP is the aspiration pressure applied to redblood cell holding pipette, Rp the pipette radius, Rg thered blood cell radius outside the pipette and rb theradius of the contact area between the red blood celland the glass bead. The force transducer spring con-stant k can be easily tuned, even during the course ofan experiment, from 10 pN/lm to 10,000 pN/lm by asimple adjustment of the aspiration pressure DP. Ifwater continuity between the reservoir and the pipetteis ensured in the hydraulic system that controls thepressure, k remains stable with 5% accuracy even atlow values. However, the presence of air bubbles willmake the aspiration and consequently the spring con-stant unstable. When the erythrocyte is submitted toan interaction, it is compressed or stretched dependingon whether the interaction is repulsive or attractive.This deformation is obtained by tracking the positionof the glass bead fixed to the red blood cell. Indeed,when observed with a slightly unfocused opticalmicroscope, the bead displays a light spot with agaussian intensity profile on its center. This spot istracked by video processing with the camera connectedto the microscope. The tracking procedure developedin the laboratory gives the real time position of thebead at 360 Hz. The difference of the bead positionwhen the red blood cell is at rest and under interactiongives the deformation of the erythrocyte with anaccuracy of a few nanometers.
Measurable physical deformation of red blood cellsranges typically from 10 nm to 1 lm. When multiply-ing it by the spring constant k of the red blood cell, theforce exerted on the force transducer is obtained. Theforces accessible with the BFP technique are thereforetheoretically ranged between 0.1 pN and 10 nN. Inpractice, the high sensitivity in forces obtained usingweak spring constants is limited by the fluctuation ofthe red blood cell position due to thermal excitation(Dx2 ~ kbT/k). The advantage of a high spring con-stant is the weak amplitude of position fluctuations,
FIGURE 4. Sequences fort the assembling of force transducer. (a) The left pipette grabs a biotinylated red blood cell. (b) the rightpipette grabs a streptavidinated glass bead. (c) The bead is brought into contact with the erythrocyte in the alignment of the redblood cell holding pipette. (d) When the aspiration pressure of the bead holding pipette is released, the bead remains firmlyattached to the erythrocyte thanks to multiple strepatvidin/biotin bonds.
GOURIER et al.266

however the accuracy on the force evaluation becomespoor (Df2 ~ kbTk).
The Sequences of a BFP Experiment
The force measurements consist in approach-con-tact-retraction automatized cycles between the probefunctionalized with ligands and the target bearing thereceptors.
These cycles are obtained by moving one of thepipettes along its axis towards the other one thatremains still. The moving pipette is coupled to a linearpiezoelectric translator (Physik Instrumente, Germany)allowing a very fine translation of the pipette at acontrolled speed. This piezoelectric translator is con-nected to a digital-analog converter and a personalcomputer from which the program controlling theapproach-contact-retraction cycles is started.
To detail the sequences of a BFP experiment, let’stake for example the case where the pipette holding the
target is moving (Fig. 5a) while the force transducerholding pipette remains still. During the approachphase, the target is translated with constant speed intocontact with the force transducer. The contact producesa compression of the bRBC detected by tracking theattached bead. When the measured force reaches achosen compression value (Fmax, typically a few tens ofpN), pipette translation is stopped, and the contactposition is maintained during a time lapse imposed bythe experimenter (typically hundreds of milliseconds)before the retraction phase begins. During this latterphase, the target is separated from the probe at con-stant speed v0. If a bond has been formed, the bead,attached to the target, has to follow its movement whenretracted. The red blood cell is elongated in the tractiondirection until the bond breaks. When the ruptureoccurs, the probe rapidly comes back to its equilibriumposition. This process can also be described in term offorces: until it breaks, the bond is submitted to a trac-tion force which increases as the target is moved back.
FIGURE 5. (a) The target is brought in contact with the probe. (b) Force distance curve observed when a bond has been formed.Like in an AFM only a relative value of the distance can be obtained. Another technique, the Surface Forces Apparatus (SFA),27,30
can provide the absolute distance between substrates. In the BFP, after contact is achieved (non zero positive force), the com-pressibility of the target can be probed. The rupture force of the bond corresponds to the force measured when the ligand/receptorcomplex dissociates upon a given loading rate. (c) Rupture force distributions of a bond obtained for several loading rates. (d)Dynamic force spectrum of the bond. Each linear regime in the dynamic force spectra corresponds to a given barrier (here 2barriers) in the energy landscape of the interaction.
A Nanospring Named Erythrocyte 267

The evolution in time of this force is given byF = (kv0)t - Fmax where t is the time, starting from thebeginning of the retraction phase. Thus, the tractionforce is a ramp. The slope, r = kv0, is called the loadingrate. The rupture force of the bond corresponds to theforce measured when the ligand/receptor complex dis-sociates upon a given loading rate (Fig. 5b). As men-tioned above, the strength of the bond is notcharacterized by a given force but by a force distribu-tion that depends on the loading rate. In the BFPexperiments, rupture force distributions of a bond canbe obtained for several loading rates (Fig. 5c). For agiven loading rate, a high number of approach-retrac-tion-separation cycles must be performed with manyprobe and target couples in order to obtain statisticallysignificant rupture force histograms. A convenient wayof visualizing the robustness of the bond is to plot themost likely rupture force f* deduced from each forcedistribution as a function of the logarithm of theloading rate (Fig. 5d). Such a representation is oftencalled a dynamic force spectrum. Dynamic force spec-troscopy provides a bridge between rupture forcesmeasurements and the energy landscape of the inter-action between two biomolecular objects. Indeed, theenergy landscape of a bond displays main energybarriers that the system has to overcome to reach theunbound state (Fig. 5d). Standard dynamic forcespectroscopy theory states that each linear regime in thedynamic force semi-log spectra corresponds to a givenbarrier in the energy landscape of the interac-tion.4,12,15,20,28 Even though this assumption has beensomewhat shaken recently,1,22 it can be considered as afirst approximation that n different regimes corre-sponded at most to n different barriers.7
For each of them, the relation between f* and theloading rate is expressed as:
f� ¼ kBT
DxLn
rkBTDx m0
!ð2Þ
Dx corresponds to the distance over which the ligandmust be pulled from the receptor in order dissociate thecomplex. It is therefore the distance between theenergetic well in which the system is trapped and themain energy barrier. m0 is the rate of escape from thiswell to the unbound state under zero force.
Energies can be deduced from frequencies m0 byusing:
m0 ¼1
tDexp � DE
kBT
� �ð3Þ
where DE is the height of the corresponding barrier ofthe energy landscape and tD a microscopic time scaleof the order of 10–10 to 10-9 s. Dx and m0 are obtainedby a linear fit of the f* vs. Log(r).
APPLICATIONS
The Streptavidin Biotin Paradox: A Story of Time33
Because of its high affinity as a non-covalentbond, the streptavidin–biotin complex is often used inbiology or chemistry to couple molecules. It is alsowell-known6,17 and widely studied (see forinstance16,18,23,29,32). With the BFP technique previ-ously described (the target was a biotinylated glassbead), Evans’s group has established rupture forcedistributions of the streptavidin–biotin complex forseveral loading rates (Fig. 6),29 from which for apulling force of 75 pN, an upper bound for the lifespan of the bond equal to 75 ms was deduced. Thisstrongly contradicts another work done by Busta-mante’s group where the life span of the same complexwas obtained by a different technique.2 For theirexperiment, they use DNA strands whose extremitiesare functionalized with a biotin on which a streptavi-dinated latex bead is attached. A controlled tractionforce is applied to one of the beads through a hydro-dynamic flow. The time over which the bead detachesfrom the DNA provides the life span of the bond. Theyshowed that up to 80 pN, the bonds are stable over oneminute which is at least two orders of magnitudehigher than the one obtained with the BFP experiment.Hence, one has to reach the senseless conclusion thatfor a given constant pulling force, the life span of thebond will depend on the technique used to apply theforce. This is the streptavidin–biotin paradox. Ourstudy was devoted to understanding its origin.
Let’s first focus on another fundamental resultrelated to the streptavidin–biotin complex. Moleculardynamics simulations provide relevant informationabout the energy landscape of the bond. By simulatingthe extraction of a biotin out of an avidin bindingpocket in half a nanosecond, Schulten’s group has beenable to completely follow the trajectory of the biotinleading to the bond rupture.23 From this trajectory,they approximated the neighborhood of the minima inthe energy landscape (Fig. 7). This study indicates thatthere are three minima and therefore also three barriersin the energy landscape. The presence of three barriersis corroborated by an independent experiment in whichstreptavidin-coated beads rolled on a biotinylatedsurface in a flow chamber.32
With the BFP technique, Evans’s group obtainedfrom rupture force distributions of the streptavidin–biotin complex at several loading rates a dynamic forcespectrum showing two linear regimes (Fig. 6). We haveseen in the previous section that each linear regimecorresponds to a given barrier in the energylandscape.4,12,15,20,28 Thus, in the BFP experiments,only two barriers are observed in the energy landscape
GOURIER et al.268

of the streptavidin–biotin bond. As moleculardynamics simulations and flow chamber data showedthat three barriers are present, one of these barriers ismissing in the BFP measurements. In order to deter-mine which one, we have reanalyzed in details thedistributions of rupture forces for all the loading rates.These distributions can be theoretically predicted byapplying reaction-rate theory, also known as Kramers’theory,13,19,26 to the energy landscape of the bond. In
order to proceed with the analysis, it is necessary todescribe this theory in the case where there are twobarriers in a one-dimensional energy landscape. Theprobabilities of being in each of the two energy minimaare given by:
dP1 tð Þdt
¼ �m12 fð ÞP1 tð Þ þ m21 fð ÞP2 tð Þ
dP2 tð Þdt
¼ þm12 fð ÞP1 tð Þ � m21 fð ÞP2 tð Þ � m23 fð ÞP2 tð Þ
ð4Þ
where P1(t) and P2(t) are the probability to berespectively in the first, and second minimum, f is thepulling force which is related to the time t through theloading rate r by f = r.t, and mij( f ) are the transitionrates from a minimum i to a neighbor minimum j, 3referring to the unbound state. We have tried to applyKramers’ theory to each possible pair of barriers of theenergy landscape. The only way by which the experi-mental rupture force distributions obtained by Evans’sgroup could be fitted was by keeping the two outerbarriers from the molecular dynamics and assumingthat the bond is in the second deepest minimum at thestart of the separation process. The predicted ruptureforce distributions are given in Fig. 6. The agreementwith the experimental histograms is almost perfect forall the loading rates. The conclusion is therefore that inthe BFP experiment the streptavidin–biotin bond didnot reach its deepest minimum. This may be the dif-ference between these measurements and the DNAstretching technique. Intuitively, it can be understoodsince in the BFP the bond was given a fraction ofsecond to form while for the study with DNA, the
FIGURE 6. Left: Probability density of the rupture force at different loading rates ranged between 1 and 60,000 pN/s obtained fromMerkel et al.29 The associated fits correspond to the distributions expected by applying the Kramers’ model (Eq. 4) to the two outerbarriers of the energy landscape given Fig. 7. Right: Experimental curve obtained by Evans’ group of the most likely rupture forceof a single streptavidin–biotin bond as a function of the loading rate. Two regimes can be observed as indicated by the two linearslopes.
FIGURE 7. Energy landscape of the streptavidin–biotinbond. The landscape used to obtain the probabilities in Fig. 6(shaded line) is superimposed to the one predicted bymolecular dynamic simulations (solid lines, given in Merkelet al.29 and deduced from original data of Shulten’s group23).The shaded dashed line represents the inmost barrier that isseen in the DNA experiments but not with the BFP measure-ments. The values xm1(0), xm2(0), xm3(0), xb1(0), xb2(0), andxb3(0), are, respectively, the positions of the first, second, andthird minimums and of the first, second, and third barriersunder zero force.
A Nanospring Named Erythrocyte 269

DNA strand had been attached to the streptavidin-coated beads for several minutes before any pullingforce was applied. Hence, we can assume that thehistory of the bond is at the origin of the streptavidin–biotin paradox.
In order to test this assumption we have conductedexperiments in which both experimental approacheswere combined: we have used the BFP technique withstreptavidin-coated beads that had previously beenincubated with DNA strands biotinylated on one end(Fig. 8). As the streptavidin–biotin bonds have beenformed a long time before the pulling process starts,the rupture forces should be larger than the onesobtained by Evans’s group with the BFP also. How-ever, as it is important to make a large number ofmeasurements (a least one hundred per loading rate) toobtain good statistics and smooth distributions, it isnecessary to keep the same bead over several
approaching-separation cycles. Thus, it may happenthat a DNA strand that had previously been detachedfrom the bead reattaches through a newly formedstreptavidin–biotin bond. Consequently, the expecteddistribution should present two peaks: one corre-sponding to the ‘‘old’’ bonds, like in the DNAstretching studies, and one corresponding to the ‘‘new’’bonds, like in the previous BFP measurements. This isexactly what we have observed (Fig. 9a). By addingbiocytin (0.1 mg/mL) in the solution in order to blockall the available streptavidin sites, the first peak dis-appears confirming that it was due to the formation ofnew streptavidin/biotin bonds during the measure-ments (Fig. 9b). The experimental distributions ofFig. 6 can be predicted by Kramer’s theory using thecomplete energy landscape of Fig. 7 with initial con-ditions in which the probability to be in the deepestminimum is approximately 0.5. Thus, we have beenable to probe experimentally unambiguously thepresence of the three barriers with our system andcompletely find the energy landscape of the streptavi-din–biotin bond.
This study using the BFP technique demonstratesthat the history of the bond is at the origin of thestreptavidin–biotin paradox: in the two contradictoryexperiments the bond did not reach the same statebefore a pulling force was applied on it. Our resultsindicate that the time a system takes to reach equilib-rium can be relevant to experimental time scales andmay be too often neglected in many fields such aschemistry or biology where association constants arecommonly used. There should therefore not only beone association constant per molecular complex butone per metastable state that is relevant in the timescales of the considered process. Of course, the higherthe barriers, the longer it takes to fill up the minima.
Mapping Mouse Gamete Interaction Forces RevealDomains at the Oocyte Membrane with Different
Adhesive Properties24
Membrane fusion occurs in various biological pro-cesses as crucial as transmission of nerve pulse acrossthe synapses, intra-cellular traffic, endo- and exocyto-sis, fertilization, etc. It is a two-step process which in-cludes adhesion of two membranes followed by theirphysical merging. Mammalian fertilization offers anexample of membrane fusion process that presentsseveral peculiarities: it involves a single couple of het-erologous cells, an oocyte and a spermatozoon, iso-lated within the perivitelline space into which thespermatozoon is the only cell able to penetrate(Fig. 10).
During the last twenty years, investigations havebeen conducted on mammalian gametes with the aim of
FIGURE 8. Description of the BFP experiment with DNAstrands. The streptavidinated glass bead attached to thebiotinylated red cell. The DNA is bound to the bead by singlestreptavidin–biotin bonds. The target is an aggregate of latexparticles. When the glass bead and the latex particles arebrought in contact, the DNA strongly attaches to the latexparticles. Upon separation, the streptavidin–biotin bond is thefirst one to unbind. This protocol allows the measurements ofrupture forces of bonds that have been given several hours toform.
GOURIER et al.270

identifying the molecular membrane actors of gameteadhesion and fusion, but also the molecular mecha-nisms involved in these last and crucial stages of fer-tilization. The usual biological strategy of investigationof gamete interaction is in vitro insemination experi-ments performed with wild or genetically modifiedgametes, in presence or not of targeted antibodies orreagents (for review9,25,34). In this context, the BFPtechnique is an original and powerful tool to quanti-tatively investigate gamete interaction, very comple-mentary from biological strategies. The idea consists indirectly measuring the interaction forces experienced bytwo isolated gametes (i.e. like what occurs in nature).To adapt the BFP technique to the constraints imposedby the use of two cells as different as an oocyte and aspermatozoon adhering through weak biochemicallinks, some improvements had been made on the usualset-up described preciously. In mice, oocytes arearound 80 lm in diameter and exhibit a pear shape(Fig. 11). A mouse spermatozoon is composed of analmost flat head with dimensions of approximately5 9 3 9 1 lm3 and a 60 lm long flagellum.
The main adaptation of the traditional BFP set-upconsisted in the fixation of the spermatozoon head onthe bead of the BFP transducer. The BFP probe wastherefore made of the assembling of a biotinylatederythrocyte, a streptavidinated glass bead, and thespermatozoon, the three components being carefullyaligned in the axis of the holding pipette. In addition to
the two micropipettes holding respectively the probeand the target (i.e. an oocyte), a third pipette wasmaintaining the flagellum of the spermatozoon about20 lm away from its head in order to keep the probeproperly aligned. The functional integrity of the cellswas maintained by performing all the experiments at37 �C in a CO2 independent physiological medium.The approach-contact-retraction cycles of the twogametes were achieved by manoeuvring the oocyte intocontact with the spermatozoon head and then pullingon it for separation. The speed and position of theoocyte were controlled all over the approach andtraction courses. The contact time of the gametes andmaximum compression forces at contact were alsocontrolled. The interaction force felt by the gametesduring the whole cycle was continuously obtained. Bychoosing red blood cell stiffness of 125 pN/lm, a10 lm/s approach speed of the oocyte holding pipette,and a maximum compression force of 20 pN withoutpause before the beginning of the retraction phase at4 lm/s, the total time spent by the cells under com-pression was around 250 ms. Under these conditions,for 56% of touches no adhesion was detected(Fig. 12a), 18% of gamete contacts gave rise to well-defined single attachment (Fig. 12b, c) and the latest 26% of touches gave rise to different kinds of interaction,mainly very complex profiles for which multipleattachment points were clearly involved (Fig. 12d).Figure 12 illustrated the typical different shapes of theforce distance curves obtained during the separationphase.
Let’s focus on the 18% of touches giving singleattachment events (Fig. 12b, c). At the start of sepa-ration, the oocyte deformation always increases line-arly with the force indicating an elastic response to theoocyte’s stretching. Then two behaviors are observed:in 11% of the cases the membranes completely sepa-rate (Fig. 12c), and in the other 7% there is a transitionto a damped regime (Fig. 12b). This second regimecorresponds to a viscoelastic behavior of the oocyte
FIGURE 9. Experimental distributions of the rupture force obtained at r = 2400 pN/s, (a) with the DNA coated beads. (b) with theDNA coated beads after adding biocytin in the solution in order to block all the available streptavidin sites. The correspondingprobability density of the rupture forces predicted from the energy landscape given in Fig. 7 and Kramers’ equations is super-imposed.
FIGURE 10. sequences of events during gamete fertilization.Left: The spermatozoon cross the zona pellucida (ZP) andenters the perivitelline space. Middle: Adhesion step of gam-ete interaction. Right: Fusion step of fertilization.
A Nanospring Named Erythrocyte 271

FIGURE 11. Experimental setup. (a) The target is an oocyte held by the left micropipette. The scale bar is 10 lm. (b) Scheme of therelative position of the target and the probe during a BFP experiment. Three glass micropipettes are needed. (c) The probe is madeof a red blood cell, a glass bead and a spermatozoon (d) Schematic view of the whole experimental setup. The main drop of M2medium is under mineral oil to prevent both evaporation at 37 �C and bacterial contamination. Real-time images acquired at 360images/s by the CCD camera are used to compute the force of the interaction and control the piezo-electric device for precisepositioning of the oocyte through online feedback control while the probe is fixed.
FIGURE 12. Typical force-distance curves of the approach-retraction cycles of the oocyte on the spermatozoon. During theapproach phase, the force is zero until the cells are in contact, as revealed by a force increase of up to 20 pN. (a) No attachmentbetween the gamete membranes (b) Single attachment point with elastic behavior and a damped regime: elastic deformation of theoocyte up to a force of FLv, followed by a transition to a damped regime, with extrusion of a tether from the oocyte membrane. (c)Single attachment point with elastic behavior only. When the cells are separated, the force jumps from a maximum force of FLe tozero. (d) Multiple attachment points: a complex force-distance curve with a succession of force jumps.
GOURIER et al.272

plasma membrane associated to the extrusion of atether. By fluorescent microscopy we showed that thesefilaments are extruded from the oocyte membrane.Transition from elastic to viscoelastic regime hasrecently been reported by Evans and coworkers11,21 onhuman neutrophils (PMN). According to these authorsthis transition from the elastic to the viscoelasticregime would be the signature of membrane detach-ment from the inner cytostructures.
Figure 13 gives the histograms of FLe and FLv forcescorresponding to the end of the linear regime for bothtypes (B and C) of curves under the experimentalconditions described above with an effective loadingrate of about 100 pN/s. Figure 13a corresponds to theFLe forces obtained for curves without viscoelasticregime. Figure 13b gives the FLv forces resulting fromthe curves with two regimes. The shape of the histo-grams significantly depends on the type of experi-mental curves. Indeed, the FLe histograms show twodistinct force distributions with most probable forcescentered close to 8.5 pN and 19.5 pN. By contrast, theFLv histogram shows a single peak centered around11 pN. Since the second peak of the FLe histogramcorresponds to larger forces than the one involved inFLv histogram, one can wonder why the oocyte con-tinues to deform elastically even though the tractionstrength is higher than the threshold forces at which atether can be extruded. Apparently, exerting a highenough traction force on a strong enough attachmentpoint somewhere on the oocyte is not a sufficientcondition to create a tether. The location of theattachment point on the oocyte membrane appears tobe a key parameter regarding the capability of themembrane to create a tether. This suggests that the
oocyte membrane accessible to the spermatozoon iscomposed of different kinds of zones with differentmechanical characteristics, some of them suitable fortether formation, the others not. In the following theformer zones will be referred to v-domains and thelatter to e-domains (Fig. 14). When the attachmentpoint between the spermatozoon and the oocytemembrane takes place on a v-domain, the membrane iscapable of undergoing a transition from the elastic tothe viscoelastic regime. Because of the overlap of FLv
and FLe force distributions, the rupture of the mem-brane’s attachment can also occur in v-domains beforeany tether is formed, and therefore lead to a purelyelastic behavior of the force. In such a case, theexperimental force/distance curve is similar to thatobtained for membrane contacts occurring in ane-domain (Fig. 12c). Therefore forces, which shouldhave contributed to the FLv histogram if the attach-ment point between the gamete membranes had notbroken, end up in the lower peak of the FLe histogram(see Fig. 13a). In other words, among the forcesobtained at the end of the linear regime for a gameteattachment in a v-domain, a majority composes theFLv histogram and the rest composes the first peak ofthe FLe histogram. Only the second peak of the FLe
histogram comes from the spermatozoon/oocytecontacts situated in e-domains of the oocyte.
This study has therefore proved the capability of themodified BFP technique used here in quantitativelymeasuring local changes in gamete membrane adhe-sion and in probing the mechanical behavior of theoocyte membrane at a micrometer scale. The natureof the e- and v-domains and the molecular playersinvolved in the microvillar and amicrovillar areas of
FIGURE 13. Histograms of force distributions for (a) FLe (see Fig. 12c) and (b) FLv (see Fig. 12b). For FLe distribution, two peaksare shown. The lower peak results from bonds occurring in the v-domain that break before any tether can be formed, and thehigh-force peak results from bonds occurring in an e-domain of the membrane oocyte.
A Nanospring Named Erythrocyte 273

the oocyte and at the spermatozoon membrane remainto be further investigated. This can be achieved bycombining the approach presented here and strategicantibody molecules, knock-out gametes, or drugsmodifying the binding between the cell membraneand its cytoskeleton. This approach could thereforebecome an efficient way of studying the molecular basisof spermatozoon-oocyte plasma membranes interac-tion during mammalian fertilization, very comple-mentary to the usual biological strategies.9,25,34 Withthe latter, it is often impossible to discriminate whetherthe involved proteins play a role in adhesion, fusion orboth steps of fertilization. By contrast, here, gametesadhesion is probed independently from fusion. More-over, it allows the study of gamete adhesion underconditions close to physiological ones since two iso-lated gametes are involved the same way as in fertil-ization.
CONCLUSION
The BFP is a powerful technique that can be used toquantify the strength of a single molecular bond atvarious levels: from isolated molecules on a substrate
to proteins in their natural environment. It is relativelyeasy to setup. Hence, obtaining force measurement isnot the most difficult part. As we have shown on twoexamples, it takes in-depth and careful analysis todeduce relevant information about the studied system.Often, other approaches such as molecular dynamicssimulations or imaging (electron microscopy, confocalmicroscopy, fluorescence,...) are required to be able todraw conclusions. Even though the BFP is not acommercial technique such as the Atomic ForceMicroscope (AFM) or flow chamber,31 it has alreadybeen used and modified for various purposes.5,27Itsversatility should make the BFP a technique that willbe more developed in the near future.
REFERENCES
1Bartolo, D., I. Derenyi, and A. Ajdari. Dynamic responseof adhesion complexes: beyond the single-path picture.Physi. Rev. E (Stat. Nonlinear Soft Matter Phys.)65:051910, 2002.2Baumann, C. G., S. B. Smith, V. A. Bloomfield, andC. Bustamante. Ionic effects on the elasticity of singleDNA molecules. PNAS 94:6185–6190, 1997.
FIGURE 14. v And e domains on the oocyte membrane probed by the spermatozoon. On v-domains, tethers can be extruded afterthe initial elastic deformation of the oocyte membrane. Two types of curves are therefore obtained depending on whether the bondbreaks before or after the extrusion of a tether has occurred. On e-domains, the oocyte can deform only elastically. The curvesobtained from v-domains give rise to the FLv histogram and to the first peak of the FLe histogram. The curves obtained from-domains give rise to the second peak of the FLe histogram.
GOURIER et al.274

3Bell, G. I. Models for specific adhesion of cells to cells.Science 200:618–627, 1978.4Chen, S. Q., and T. A. Springer. Selectin receptor-ligandbonds: Formation limited by shear rate and dissociationgoverned by the Bell model. Proc. Natl. Acad. Sci. USA98:950–955, 2001.5Chen, W., V. I. Zarnitsyna, K. K. Sarangapani, J. Huang,and C. Zhu. Measuring receptor-ligand binding kinetics oncell surfaces: from adhesion frequency to thermal fluctua-tion methods. Cell. Mol. Bioeng. 2008. doi:10.1007/s12195-008-0024-8.6Chilkoti, A., T. Boland, B. D. Ratner, and P. S. Stayton.The relationship between ligand-binding thermodynam-ics and protein-ligand interaction forces measuredby atomic force microscopy. Biophys. J. 69:2125–2130,1995.7Derenyi, I., D. Bartolo, and A. Ajdari. Effects of inter-mediate bound states in dynamic force spectroscopy. Bio-phys. J. 86:1263–1269, 2004.8Evans, E. Probing the relation between force—Lifetime—and chemistry in single molecular bonds. Ann.Rev. Biophys. Biomol. Struct. 30:105–128, 2001.9Evans, J. P The molecular basis of sperm-oocyte mem-brane interactions during mammalian fertilization. HumanReprod. Update 8:297–311, 2002.
10Evans, E., D. Berk, and A. Leung. Detachment of agglu-tinin-bonded red blood cells. I. Forces to rupture molecu-lar-point attachments. Biophys. J. 59:838–848, 1991.
11Evans, E., V. Heinrich, A. Leung, and K. Kinoshita. Nano-to microscale dynamics of P-selectin detachment fromleukocyte interfaces. I. Membrane separation from thecytoskeleton. Biophys. J. 88:2288–2298, 2005.
12Evans, E., and F. Ludwig. Dynamic strengths of molecularanchoring and material cohesion in fluid biomembranes.J. Phys.-Condens. Matter 12:A315–A320, 2000.
13Evans, E., and K. Ritchie. Dynamic strength of molecularadhesion bonds. Biophys. J. 72:1541–1555, 1997.
14Evans, E., K. Ritchie, and R. Merkel. Sensitive forcetechnique to probe molecular adhesion and structurallinkages at biological interfaces. Biophys. J. 68:2580–2587,1995.
15Evans, E., and P. M. Williams. Dynamic force spectros-copy. In: Physics of Bio-Molecules, Cells, edited by F.Julicher, P. Ormos, F. David, and H. Flyvbjerg. Berlin,Germany: Springer Verlag, 2002, pp. 145–204.
16Florin, E. L., V. T. Moy, and H. E. Gaub. Adhesion forcesbetween individual ligand-receptor Pairs. Science 264:415–417, 1994.
17Green, N. M. Avidin. Adv. Protein Chem. 29:85–133,1975.
18Grubmuller, H., B. Heymann, and P. Tavan. Ligandbinding: molecular mechanics calculation of the streptavi-din–biotin rupture force. Science 271:997–999, 1996.
19Hanggi, P., P. Talkner, and M. Borkovec. Reaction-ratetheory—50 years after Kramers. Rev. Modern Phys. 62:251–341, 1990.
20Hanley, W., O. McCarty, S. Jadhav, Y. Tseng, D. Wirtz,and K. Konstantopoulos. Single molecule characterizationof P-selectin/ligand binding. J. Biol. Chem. 278:10556–10561, 2003.
21Heinrich, V., A. Leung, and E. Evans. Nano- to microscaledynamics of P-selectin detachment from leukocyte inter-faces. II. Tether flow terminated by P-selectin dissociationfrom PSGL-1. Biophys. J. 88:2299–2308, 2005.
22Hummer, G., and A. Szabo. Kinetics from nonequilibriumsingle-molecule pulling experiments. Biophys. J. 85:5–15,2003.
23Izrailev, S., S. Stepaniants, M. Balsera, Y. Oono, andK. Schulten. Molecular dynamics study of unbinding of theavidin–biotin complex. Biophys. J. 72:1568–1581, 1997.
24Jegou, A., F. Pincet, E. Perez, J. P. Wolf, A. Ziyyat, and C.Gourier. Mapping mouse gamete interaction forces revealseveral oocyte membrane regions with different mechanicaland adhesive properties. Langmuir 24:1451–1458, 2008.
25Kaji, K., and A. Kudo. The mechanism of sperm-oocytefusion in mammals. Reproduction 127:423–429, 2004.
26Kramers, H. A. Brownian motion in a field of force and thediffusion model of chemical reactions. Physica (Utrecht)7:284–304, 1940.
27Leckband, D. From single molecules to living cells: nano-mechanical measurements of cell adhesion. Cell. Mol.Bioeng. 2008. doi:10.1007/s12195-008-0029-3.
28Li, F. Y., S. D. Redick, H. P. Erickson, and V. T. Moy.Force measurements of the a5b1 integrin–fibronectininteraction. Biophys. J. 84:1252–1262, 2003.
29Merkel, R., P. Nassoy, A. Leung, K. Ritchie, and E. Evans.Energy landscapes of receptor-ligand bonds explored withdynamic force spectroscopy. Nature 397:50–53, 1999.
30Perez, E., F. Li, D. Tareste, and F. Pincet. The surface forceapparatus to reveal the energetics of biomolecules assembly.Application to DNA bases pairing and SNARE fusionproteins folding. Cell. Mol. Bioeng. 2008. doi:10.1007/s12195-008-0025-7.
31Pierres, A., A.-M. Benoliel, and P. Bongrand. Studyingmolecular interactions at the single bond level with a lam-inar flow chamber. Cell. Mol. Bioeng. 2008. doi:10.1007/s12195-008-0031-9.
32Pierres, A., D. Touchard, A.-M. Benoliel, and P. Bongrand.Dissecting streptavidin–biotin interaction with a laminarflow chamber. Biophys. J. 82:3214–3223, 2002.
33Pincet, F., and J. Husson. The solution to the streptavidin–biotin paradox: the influence of history on the strength ofsingle molecular bonds. Biophys. J. 89:4374–4381, 2005.
34Rubinstein, E., A. Ziyyat, J. P. Wolf, F. Le Naour, andC. Boucheix. The molecular players of sperm-egg fusion inmammals. Semin. Cell. Dev. Biol. 17:254–263, 2006.
A Nanospring Named Erythrocyte 275