a n n u a l r e p o r t nordstrom, inc. annual report 207
TRANSCRIPT

AN
NU
AL
RE
PO
RT
20
07
PLEASE RECYCLE
Nordstrom, Inc. Annual Report2 700


customers, employees and shareholders,
DeRAOn behalf of everyone at Nordstrom, I am pleased to share with you our company’s 2007 performance
and outlook for 2008 and beyond.
Overall, we realized a number of top performances in 2007, thanks to the hard work of more than
55,000 Nordstrom employees. Let’s review the highlights:
• Total sales increased 3.1% to a record high $8.8 billion and comparable sales
increased 3.9% — our sixth consecutive year of same-store sales gains.
• Improving store productivity resulted in a return on investment (ROIC) of 19.4%,
and sales of $402 per square foot on a 52-week basis, our best performance ever.
• Our SG&A rate (expenses as a percentage of net sales) improved for the
seventh year in a row at 26.7%, improving by 9 basis points over last year.
• Earnings Before Interest and Taxes (EBIT) were $1.247 billion this year,
an improvement of 8.5% over last year.
In total, 2007 was a year of good performance for our company. But 2007 was really a tale of two halves.
In the first half, the industry was robust, our team executed well, and we experienced comparable store growth
of 7.5%. Around mid-year, the market slowed dramatically and our comparable store sales growth was only 0.5%.
While we managed our operating expenses well throughout the year, inventories increased in the third and
fourth quarters, at about the same time the economy began to slow and sales softened. We addressed the
inventory issues quickly and corrected many of them by the beginning of 2008. Thus, we believe we are
positioned to perform well in what we expect to be a continued soft retail environment in 2008. Our focus
remains on growing market share with our core customers. When we challenge ourselves to offer the best
service and merchandise, we give the customer a reason to buy. We have one of the fastest inventory turns
among our direct competitors and when we continue to flow in new merchandise, our customers
respond best. By executing well, we increase comparable sales and improve profitability,
ultimately the best sign that we are taking care of our customers.
328526_02_06.qxp 3/28/08 12:21 PM Page 1

We’ve learned that we have tremendous opportunities to gain share of wallet from our core customers. We know these customers
as a group are growing at two times the rate of the overall U.S. market, which presents substantial opportunity to grow with these
customers as well as increase our share of their spend.
We continue to grow our presence in the top markets and best retail locations around the country. We are most interested in
pursuing the very best opportunities available rather than increasing square footage just for growth’s sake, and we are happy
with the commitments we have made. This spring we opened three new full-line stores and will open five more during the year.
We are particularly excited to share with you the opening of our first full-line store in Hawaii, which opened March 7 at Ala Moana
Center in Honolulu. This 210,000-square-foot store is the culmination of 12 years of trying to secure a space in one of the best
malls in the country. We also opened our eighth store in Florida at Aventura Mall and our second Boston-area store in Burlington,
Massachusetts. Additional full-line openings for 2008 include: Clinton Township, Michigan, April 18; Thousand Oaks, California,
September 5; Indianapolis, Indiana, September 19; Pittsburgh, Pennsylvania, October 24; and Naples, Florida, November 7.
Additionally, we are looking forward to relocating our Tacoma Mall store — which originally opened in 1966 — to a brand new
building in the mall on October 3. By the end of 2008, we will have 109 full-line stores. Our longer-term plan is to have 140 to 150
stores by 2015. We believe new stores are a good investment for our shareholders and are the most productive use of our capital.
Equally critical to our long-term growth is the continued strong performance of our existing stores. Therefore, a top priority for
our company remains devoting a significant portion of our capital to store remodels to keep the Nordstrom experience current
for all our customers. In 2007, we invested $106 million in remodels and expect to invest similar amounts going forward.
We also see tremendous opportunities for Nordstrom Direct, our online and catalog business, which has now grown to over
$600 million in volume. However, this number underrepresents the true value of this channel. We gain additional value from
the volume attributed to the full-line division from sales initiated online in our stores, as well as immense value from being
a multi-channel retailer — satisfying customers the way they want to be served today. In addition to our full-line and Nordstrom
Direct channels, we are also serving many customers in our Nordstrom Rack stores. The division had another successful year
with an 8.7% comparable sales increase in 2007, on top of a double-digit increase in the prior year.
Every decision made and dollar spent by our company revolves around the customer. One long-term initiative that began in
response to customer requests is creating technology that will enable our salespeople to have a single view of total company
inventory. To that end, we are excited to announce that we have taken a major step forward on this initiative and will have this
tool in place by late spring, making it easier for salespeople to find merchandise for customers. Another tool that has helped us
gain share of wallet is our enhanced Nordstrom Fashion Rewards™ program, designed to reward our best customers.
This program is generating many additional customers loyal to Nordstrom.
328526_02_06.qxp 3/28/08 12:51 PM Page 2

We also continued to invest time and resources in developing our leaders. While there is never a finish line, we worked
hard during 2007 to accelerate our salespeople’s selling skills to better serve customers and drive results. Last year,
our best sellers were 7% more productive. We believe that is significant, because our top sellers set the bar and in turn
raise the performance level of all our people.
Every day we are reminded of the entrepreneurial spirit of the people who run this business as if it is their own. We are
fortunate to have people like Chris Sharma, who works in Men’s Furnishings at our Tysons Corner Center store. Chris has been
our company’s top performing salesperson for a number of years now and he had another outstanding year, increasing his sales
5.9% and exceeding $2 million for the third consecutive year.
We are also making an effort to attract the best new talent. For example, we are currently in our third year of an internship
partnership with three prominent design schools — Parsons the New School for Design in New York, Otis College of Art and Design
in Los Angeles and the Academy of Art University in San Francisco — to create opportunities for promising young designers
in our product development area.
While there may be current economic issues faced by the industry and our customers, we feel we are well positioned now — and for
the future. We have plenty of room to improve market share and share of our customers’ wallet. We are also in a strong financial
position to respond to opportunities that may present themselves.
On behalf of all of us at Nordstrom, thank you for your continued support. We look forward to continuing to improve our business
and results to warrant your ongoing trust.
Sincerely,
Blake W. Nordstrom
President, Nordstrom, Inc.
328526_02_06.qxp 3/28/08 12:52 PM Page 3

Afrom our Chairman
No etOver the course of my 11 years on the Nordstrom board, I have seen the company nearly double in revenue,
dramatically improve Return On Invested Capital to 19.4%, expand its store presence into a number of
major metropolitan areas and advance to become a leader among our peer group in multi-channel retailing.
With growth have come changes in operations, technology and merchandise strategies. Yet, as processes
and tools evolve to become more sophisticated, the essence that makes Nordstrom unique — its focus on
serving the customer — remains constant.
As a long-time Nordstrom customer, I’ve seen up close the emotional bond between Nordstrom customers and
their salespeople. On business trips, I’ve encountered numerous travelers eager to share their “Nordstrom stories”
and profess their loyalty to Nordstrom and its people. This deep one-on-one connection creates an important,
tangible value for Nordstrom as is evidenced in the company’s record sales per square foot of $402.
This customer focus will remain the foundation for the success and growth of Nordstrom in the years ahead.
While there are challenges in the retail environment today, the future prospects for this company are incredibly
bright. The board of directors enthusiastically supports the leadership team and firmly believes in its continued
focus and key initiatives — growing the business through its merchandise strategies, striving to provide a superior
multi-channel shopping experience and growing the company’s presence in top markets around the nation.
This sound strategy, based on the company’s knowledge of its customers, will provide for long-term growth
and success, and is best for the company, its customers, employees and shareholders.
The hard work and efforts by the Nordstrom team have not gone unnoticed. Over the past year, the company
was named, for the eleventh time, by Fortune magazine as one of the “100 Best Companies to Work For,” and
is one of only 14 companies that have made the list each year since its inception. Additionally, Nordstrom was
honored in Fortune’s annual list of “America’s Most Admired Companies,” being named number one in our
industry category and ranked in the “Top 20” most admired companies overall.
Looking ahead, we believe that the company’s unique balance of great people, product leadership and financial
strength position Nordstrom as a company not only designed to last, but designed to lead. We profess our
commitment to taking care of our customers with the best possible service, value and merchandise. We believe this
dedication to serving customers, as well as our ability to take advantage of opportunities that may come our way,
will allow Nordstrom to continue to gain market share and be among the world’s best retailers for years to come.
On behalf of the entire board of directors, I thank you for your continued support of the company.
Enrique Hernandez, Jr.
Chairman
328526_02_06.qxp 3/28/08 12:52 PM Page 4


[This page intentionally left blank.]

Nordstrom, Inc. and subsidiaries 1
UNITED STATES SECURITIES AND EXCHANGE COMMISSION
Washington, D.C. 20549
FORM 10-K (Mark One)
ANNUAL REPORT PURSUANT TO SECTION 13 OR 15(d) OF THE SECURITIES EXCHANGE ACT OF 1934 For the fiscal year ended February 2, 2008
OR
TRANSITION REPORT PURSUANT TO SECTION 13 OR 15(d) OF THE SECURITIES EXCHANGE ACT OF 1934
For the transition period from____________ to ____________
Commission file number 001-15059
NORDSTROM, INC. (Exact name of Registrant as specified in its charter)
Washington 91-0515058 (State or other jurisdiction of incorporation or organization)
(IRS employer Identification No.)
1617 Sixth Avenue, Seattle, Washington 98101 (Address of principal executive offices) (Zip code)
Registrant’s telephone number, including area code: 206-628-2111
Securities registered pursuant to Section 12(b) of the Act: Title of each class Name of each exchange on which registered
Common stock, without par value New York Stock Exchange
Securities registered pursuant to Section 12(g) of the Act: None
Indicate by check mark if the registrant is a well-known seasoned issuer, as defined in Rule 405 of the Securities Act. YES NO
Indicate by check mark if the registrant is not required to file reports pursuant to Section 13 or Section 15(d) of the Act. YES NO
Indicate by check mark whether the registrant (1) has filed all reports required to be filed by Section 13 or 15(d) of the Securities Exchange Actof 1934 during the preceding 12 months (or for such shorter period that the Registrant was required to file such reports), and (2) has been subject to such filing requirements for the past 90 days. YES NO
Indicate by check mark if disclosure of delinquent filers pursuant to Item 405 of Regulation S-K is not contained herein, and will not be contained,to the best of registrant’s knowledge, in definitive proxy or information statements incorporated by reference in Part III of this Form 10-K or any amendment to this Form 10-K.
Indicate by check mark whether the registrant is a large accelerated filer, an accelerated filer, a non-accelerated filer, or a smaller reporting company. See the definition of “large accelerated filer,” “accelerated filer” and “smaller reporting company” in Rule 12b-2 of the Exchange Act (Check one): Large accelerated filer Accelerated filer Non-accelerated filer (Do not check if a smaller reporting company) Smaller reporting company
Indicate by check mark whether the registrant is a shell company (as defined in Rule 12b-2 of the Act). YES NO
As of August 3, 2007 the aggregate market value of the Registrant’s voting and non-voting stock held by non-affiliates of the Registrant was approximately $8.9 billion using the closing sales price on that day of $46.07. On March 14, 2008, 219 shares of common stock wereoutstanding (in millions).
DOCUMENTS INCORPORATED BY REFERENCE Portions of the Proxy Statement for the 2008 Annual Meeting of Shareholders scheduled to be held on May 20, 2008 are incorporated into Part III

2
[This page intentionally left blank.]
Nordstrom, Inc. and subsidiaries 3
TABLE OF CONTENTS
Page
PART I Item 1. Business. 4Item 1A. Risk Factors. 6 Item 1B. Unresolved Staff Comments. 8 Item 2. Properties. 8 Item 3. Legal Proceedings. 12 Item 4. Submission of Matters to a Vote of Security Holders. 12
PART II Item 5. Market for Registrant’s Common Equity, Related Shareholder Matters and Issuer Purchases of Equity Securities. 12 Item 6. Selected Financial Data. 14 Item 7. Management’s Discussion and Analysis of Financial Condition and Results of Operations. 15 Item 7A. Quantitative and Qualitative Disclosures About Market Risk. 32 Item 8. Financial Statements and Supplementary Data. 33 Item 9. Changes in and Disagreements With Accountants on Accounting and Financial Disclosure. 61 Item 9A. Controls and Procedures. 61 Item 9B. Other Information. 61
PART III Item 10. Directors, Executive Officers and Corporate Governance of the Registrant. 61 Item 11. Executive Compensation. 61 Item 12. Security Ownership of Certain Beneficial Owners and Management and Related Shareholder Matters. 62 Item 13. Certain Relationships and Related Transactions. 62 Item 14. Principal Accountant Fees and Services. 62
PART IV Item 15. Exhibits, Financial Statement Schedules. 62
Signatures 63 Consent of Independent Registered Public Accounting Firm 64 Schedule II – Valuation and Qualifying Accounts 65 Exhibit Index 66

4
PART I Item 1. Business.
DESCRIPTION OF BUSINESS Nordstrom incorporated in the state of Washington in 1946 as the successor to a retail shoe business that started in 1901. We are one of the nation’s leading fashion specialty retailers, with 157 U.S. stores located in 28 states. The west coast and east coast are the areas in which we have the largest presence. Nordstrom is comprised of four segments: Retail Stores, Direct, Credit, and Other.
Retail Stores derives its revenues from sales of designer, luxury and high-quality apparel, shoes, cosmetics and accessories. It includes our 103 ‘Nordstrom’ full-line stores, 50 discount ‘Nordstrom Rack’ stores, two ‘Jeffrey’ boutiques, and two clearance stores that operate under the name ‘Last Chance.’ The Nordstrom Rack stores purchase merchandise directly from manufacturers and also serve as outlets for clearance merchandise from our full-line stores.
In 2007, we opened three full-line stores (Natick, Massachusetts; Novi, Michigan; and Denver, Colorado), opened one Rack store (Tukwila, Washington), and increased our ownership in two Jeffrey boutiques (Atlanta, Georgia and New York, New York). We also sold our four U.S. Façonnable boutiques (Los Angeles, California; Costa Mesa, California; New York, New York; and Miami, Florida), and our 37 international Façonnable boutiques. To date in 2008, we have opened two full-line stores (Aventura, Florida and Honolulu, Hawaii) and closed one free-standing shoe store (Honolulu, Hawaii). We are scheduled to open six more full-line stores (Burlington, Massachusetts; Clinton Township, Michigan; Thousand Oaks, California; Indianapolis, Indiana; Pittsburgh, Pennsylvania; and Naples, Florida), relocate one full-line store (Tacoma, Washington) and open three Rack stores (Naperville, Illinois; Laguna Hills, California; and Danvers, Massachusetts). In 2009, we are scheduled to open five full-line stores, relocate one full-line store and open two Rack stores.
Direct generates revenues from sales of designer, luxury and high-quality apparel, shoes, cosmetics and accessories by serving our customers on the internet at www.nordstrom.com and through our catalogs. Direct segment’s sales are primarily shipped via third-party carriers from our fulfillment center in Cedar Rapids, Iowa.
Through our wholly owned federal savings bank, Nordstrom fsb, we offer a private label card, two co-branded Nordstrom VISA credit cards and a debit card for Nordstrom purchases. The credit and debit cards feature a shopping-based loyalty program designed to increase customer visits and spending in our Retail Stores and Direct segments. Our Credit segment generates income through finance charges and fees on these cards.
Our Other segment includes our product development team, called Nordstrom Product Group, which designs and coordinates the production of private label merchandise sold in our Retail Stores and Direct. In addition, this segment includes our corporate center operations. Until the sale of Façonnable in the third quarter of 2007, the Other segment also included our four U.S. Façonnable boutiques and the 37 Façonnable boutiques located in France, Portugal and Belgium. Façonnable is a wholesaler and retailer of high quality men’s, women’s and boys’ apparel and accessories with distribution to over 45 countries. Façonnable has licensee and franchisee agreements with others who operate wholesale distribution and/or boutique locations in Spain, Turkey, Greece, the Middle East, Taiwan, Canada and Latin America. We sold the Façonnable business in the third quarter of 2007. See Note 2 of the Notes to Consolidated Financial Statements in Item 8 for further discussion.
For more information about our business and our reportable segments, see Item 7, “Management’s Discussion and Analysis of Financial Conditionand Results of Operations” on page 15 and Note 16 of the Notes to Consolidated Financial Statements in Item 8.
FISCAL YEAR END Our fiscal year ends on the Saturday closest to January 31st. References to 2007 relate to the 52-week fiscal year ended February 2, 2008. References to 2006 and 2005 relate to the 53-week fiscal year ended February 3, 2007 and 52-week fiscal year ended January 28, 2006. References to 2008 relate to the 52 weeks ending January 31, 2009.
TRADEMARKS We have approximately 144 registered trademarks or trademark applications. Our most notable trademarks include Nordstrom, Nordstrom Rack, John W. Nordstrom, Caslon, and Classiques Entier. Each of our trademarks is renewable indefinitely provided that it is still used in commerceat the time of the renewal.
RETURN POLICY We offer our customers a fair and liberal return policy at our full-line stores and Nordstrom Direct (online and catalog). Our Nordstrom Rack stores accept returns up to 30 days from the date of purchase. In general, our return policy is somewhat more generous than industry standards. We utilize historical return patterns to estimate our expected returns.
SEASONALITY Due to our anniversary sale in July and the holidays in December, sales are higher for our Retail Stores and Direct in the second and fourth quarters of the fiscal year than in the first and third quarters.
INVENTORYWe plan our merchandise purchases and receipts to coincide with the selling patterns that we expect. For instance, we purchase and receive a larger amount of merchandise in the fall as we prepare for the holiday shopping season (from late November through early January). Also, our merchandise purchases and receipts increase prior to our Anniversary Sale, which extends over the last two weeks of July. We pay for our merchandise purchases under the terms established with our vendors, which is usually within 30 days of the date that the merchandise was shipped to us.

Nordstrom, Inc. and subsidiaries 5
In order to offer merchandise that our customers want, we purchase merchandise from a wide variety of high-quality suppliers. We also have arrangements with agents and contract manufacturers to produce our private label merchandise. Our suppliers include domestic and foreign businesses. We expect our suppliers to meet our “Nordstrom Partnership: Standards and Business Practice Guidelines,” which address ourstandards for matters such as law, labor, health and safety, and environment.
COMPETITIVE CONDITIONS Our business is highly competitive. Each of our stores competes with other national, regional and local retail establishments that may carry similar lines of merchandise, including department stores, specialty stores, boutiques, mail order and Internet businesses. Our specific competitors vary from market to market. We believe the principal methods of competing in our industry include customer service, fashion, quality of product, depth of selection, store environment and location.
EMPLOYEESDuring 2007, we regularly employed on a full or part-time basis approximately 55,000 employees. Due to the seasonal nature of our business, employment increased to approximately 58,500 employees in July 2007 and 56,500 in December 2007.
CAUTIONARY STATEMENT Certain statements in this Annual Report on Form 10-K contain “forward-looking” statements (as defined in the Private Securities Litigation Reform Act of 1995) that involve risks and uncertainties, including anticipated results, planned store openings, capital expenditures, and trends in our operations. Actual future results and trends may differ materially from historical results or current expectations depending upon various factors including those discussed below and elsewhere in this Annual Report on Form 10-K, particularly in Item 1A under the heading “Risk Factors.” These factors include our ability to respond to the business environment and fashion trends, effective inventory management, the impact of economic and competitive market forces, successful execution of our store growth strategy including the timely completion of construction associated with newly planned stores, relocations and remodels, our compliance with information security and privacy laws and regulations, employment laws and regulations and other laws and regulations applicable to the company, successful execution of our multi-channel strategy, our ability to safeguard our brand and reputation, efficient and proper allocation of our capital resources, successful execution of our technology strategy, the impact of terrorist activity or war onour customers and the retail industry, trends in personal bankruptcies and bad debt write-offs, changes in interest rates, our ability to maintain our relationships with our employees, our ability to control costs, weather conditions and hazards of nature that affect consumer traffic and consumers’ purchasing patterns, and the timing and amounts of share repurchases by the company.
These and other factors could affect our financial results and cause actual results to differ materially from those contained in any forward-looking statements we may make. As a result, while we believe there is a reasonable basis for the forward-looking statements, you should not place undue reliance on those statements. We undertake no obligation to update or revise any forward-looking statements to reflect subsequent events, new information or future circumstances.
SEC FILINGS We file annual, quarterly and current reports, proxy statements and other documents with the Securities and Exchange Commission (“SEC”). All material we file with the SEC is publicly available at the SEC’s Public Reference Room at 450 Fifth Street, NW, Washington, DC 20549. You may obtain information on the operation of the Public Reference Room by calling the SEC at 1-800-SEC-0330. In addition, the SEC maintains an Internet Web site at www.sec.gov that contains reports, proxy and information statements, and other information regarding issuers that file electronically with the SEC.
WEB SITE ACCESS Our Internet Web site address is www.nordstrom.com. We make available free of charge on or through our Internet Web site our annual reports on Form 10-K, quarterly reports on Form 10-Q, current reports on Form 8-K, statements of changes in beneficial ownership of securities on Form 4 and amendments to those reports filed or furnished pursuant to Section 13(a) or 15(d) of the Exchange Act as soon as reasonably practicable after we electronically file the report with or furnish it to the SEC. Interested parties may also access a webcast of quarterly earnings conference calls and other financial events over our Internet Web site.
CORPORATE GOVERNANCE We have a long-standing commitment to upholding a high level of ethical standards. In addition, as required by the listing standards of the New York Stock Exchange (“NYSE”) and the rules of the SEC, we have adopted Codes of Business Conduct and Ethics for our employees, officers and directors (“Codes of Ethics”) and Corporate Governance Guidelines. We have posted on our Web site our Codes of Ethics, our Corporate Governance Guidelines, and our Committee Charters for the Audit, Compensation, Corporate Governance and Nominating, Executive, and Finance committees. These items are also available in print to any person without charge upon request to:
Nordstrom, Inc. Investor Relations P.O. Box 2737 Seattle, Washington 98111 (206) 303-3200 [email protected]

6
Item 1A. Risk Factors.(Dollars in millions)
Our business faces many risks. We believe the risks described below outline the items of most concern to us. However, these risks are not the only ones we face. Additional risks and uncertainties, not presently known to us or that we currently deem immaterial, may also impair our business operations.
ABILITY TO RESPOND TO THE BUSINESS ENVIRONMENT AND FASHION TRENDS Our sales and operating results depend in part on our ability to predict or respond to changes in fashion trends and consumer preferences in a timely manner and to match our merchandise mix to prevailing consumer tastes. Any sustained failure to identify and respond to emerging trends in lifestyle and consumer preferences could force us to sell our merchandise at higher average markdown levels and lower average margins, which could have a material adverse affect on our business. In addition, consumer spending at our stores may be affected by many factors outside of our control, including consumer confidence, weather and other hazards of nature that affect consumer traffic, and general economic conditions.
INVENTORY MANAGEMENT We strive to ensure the merchandise we offer remains fresh and compelling to our customers. If we are not successful at predicting our sales trends and adjusting our purchases accordingly, we may have excess inventory, which would result in additional markdowns and reduce our operating performance. This could have an adverse effect on margins and operating income.
IMPACT OF COMPETITIVE MARKET FORCES The retail industry environment continues to change for many of our vendors and customers. In the future, our competition may partner more effectively with vendors to serve the market’s needs. If we do not effectively respond to changes in our environment, we may see a loss of market share to competitors, declining same-store sales, and declining profitability due to higher markdowns.
STORE GROWTH PLAN As of February 2008, our five-year strategic growth plan includes opening 31 new or relocated full-line stores and remodeling 29 existing full-line stores. We compete with other retailers and businesses for suitable locations for our stores. Local land use and other regulations may impact our ability to find suitable locations. New store openings also involve certain risks, including constructing, furnishing and supplying a store in a timely and cost effective manner and accurately assessing the demographic or retail environment for a particular location. Our future sales at new, relocated or remodeled stores may not meet our projections, which could adversely impact our return on investment. Performance in our new stores could also be negatively impacted by our inability to hire employees who are able to deliver the level of service our customers have come to expect when shopping at our stores. In the past, our expected operating dates have sometimes been delayed because of developer plan delays. Our inability to execute our store growth strategy in a manner that generates appropriate returns on investment could have an adverse impact on our future growth and profitability.
BANKING OPERATIONS Our credit card operations, conducted through our federal thrift subsidiary, facilitate sales in our stores, allow our stores to avoid third-party transaction fees and generate additional revenues by extending credit. Our finance charge revenue is subject to changes in interest rates which fluctuate based on market conditions. The market conditions influencing interest rates are based on economic factors that are beyond our control and include, but are not limited to, recession, inflation, deflation, consumer credit availability, consumer debt levels, tax rates and policy, unemployment trends and other matters that influence consumer confidence and spending. Our ability to extend credit to our customers and to collect payments from them depends on many factors including compliance with applicable laws and regulations, any of which may change from time to time. Changes in credit card use, payment patterns and default rates may result from a variety of economic, legal, social and other factors that we cannot control or predict with certainty. Changes that adversely impact our ability to extend credit and collect payments could negatively affect our results.
INFORMATION SECURITY AND PRIVACY The protection of our customer, employee, and company data is critical to us. The regulatory environment surrounding information security and privacy is increasingly demanding, with the frequent imposition of new and constantly changing requirements across our business units. In addition, our customers have a high expectation that we will adequately protect their personal information. A significant breach of customer, employee or company data could damage our reputation and result in lost sales, fines and lawsuits.
LEADERSHIP DEVELOPMENT AND SUCCESSION PLANNING The training and development of our future leaders is critical to our long-term growth. If we do not effectively implement our strategic and business planning processes to train and develop future leaders, our long-term growth may suffer. In addition, if unexpected leadership turnover occurs without established succession plans, our business may suffer.
MULTI-CHANNEL STRATEGY EXECUTION In 2005, we started to make changes in our Direct business that better align our online shopping environment and catalog with the customer experience in our full-line stores. These changes included: aligning our Direct merchandise offering with our full-line stores to create a seamless experience for our customers between our stores, catalogs and Web site, linking the full-line stores and Direct merchandise organizations; reducing the number and frequency of our Direct catalog mailings; and transitioning our Direct inventory system onto our full-line store platform. Our inability to successfully execute this strategy could impact our future operating performance.

Nordstrom, Inc. and subsidiaries 7
BRAND AND REPUTATION We have a well-recognized brand that is synonymous with the highest level of customer service and quality merchandise. Any significant damage to our brand or reputation may negatively impact same-store sales, lower employee morale and productivity, and diminish customer trust, resulting in a reduction in shareholder value.
CAPITAL EFFICIENCY AND PROPER ALLOCATIONOur goal is to invest capital to maximize our overall long-term returns. This includes spending on inventory, capital projects and expenses, managing debt levels, managing accounts receivable through our credit business, and returning value to our shareholders through dividends and share repurchases. To a large degree, capital efficiency reflects how well we manage the other key risks to our Company. The actions taken to address other specific risks may affect how well we manage the more general risk of capital efficiency. If we do not properly allocate our capital to maximize returns, we may fail to produce financial results that our shareholders have come to expect and we may experience a reduction in shareholder value.
HUMAN RESOURCE REGULATIONS Our policies and procedures are designed to comply with human resource laws such as wage and hour, meal and rest period, and commissions. Federal and state wage and hour laws are complex, and the related enforcement is increasingly aggressive, particularly in the state of California. Failure to comply with these laws could result in damage to our reputation, class action lawsuits and dissatisfied employees.
EMPLOYMENT AND DISCRIMINATION LAWS State and federal employment and discrimination laws and the related case law continue to evolve, making ongoing compliance in this area a challenge. Failure to comply with these laws may result in damage to our reputation, legal and settlement costs, disruption of our business, and loss of customers and employees, which would result in a loss of sales, increased employment costs, low employee morale and attendant harm to our business and results of operations.
TECHNOLOGY We make investments in information technology to sustain our competitive position. We expect our combined capitalized and expense spend to be approximately $180 each year on information technology operations and system development, which is key to our growth. We must monitor and choose the right investments and implement them at the right pace. Targeting the wrong opportunities, failing to make the best investment, or making an investment commitment significantly above or below the requirements of the business opportunity may result in the loss of our competitive position. In addition, an inadequate investment in maintaining our current systems may result in a loss of system functionality and increased future costs to bring our systems up to date.
We may implement too much technology, or change too fast, which could result in failure to adopt the new technology if the business is not ready or capable of accepting it. Excessive technological change affects the effectiveness of adoption, and could adversely affect the realization of benefits from the technology. However, not implementing enough technology could compromise our competitive position.
DISTRIBUTION AND FULFILLMENT CENTERS We depend on the orderly operation of the receiving and distribution process, which depends, in turn, on adherence to shipping schedules and effective management of our six distribution centers and our Direct fulfillment center. Although we believe that our receiving and distribution process is efficient, unforeseen disruptions in operations due to fires, hurricanes or other catastrophic events, labor disagreements or shipping problems, may result in delays in the delivery of merchandise to our stores and our customers. Although we maintain business interruption and property insurance, management cannot be assured that our insurance coverage will be sufficient, or that insurance proceeds will be timely paid to us, if any of the distribution centers are shut down for any reason.
FOREIGN CURRENCY We purchase a portion of our inventory from foreign suppliers whose cost to us is affected by the fluctuation of their local currency against the dollar or who price their merchandise in currencies other than the dollar. We source goods from numerous countries and thus are affected by changes in numerous currencies and generally, by fluctuations in the U.S. dollar relative to such currencies. Accordingly, changes in the value of the dollar relative to foreign currencies may increase our cost of goods sold and if we are unable to pass such cost increases on to our customers, our gross margins, and ultimately our earnings, would decrease. Foreign currency fluctuations could have a material adverse effect on our business, financial condition and results of operations in the future.
SEASONALITY Our business is seasonal in nature. Due to our anniversary sale in July and the holidays in December, sales are higher for our Retail Stores in the second and fourth quarters of the fiscal year than in the first and third quarters. Accordingly, our results may vary considerably from quarter to quarter. In addition, we have significant additional cash requirements in the period leading up to the months of November and December in anticipation of higher sales volume in those months, including expenses for additional inventory, advertising and employees.
REGULATORY COMPLIANCE Our policies and procedures are designed to comply with all applicable laws and regulations, including those imposed by the SEC, NYSE, the banking industry and foreign countries. Additional legal and regulatory requirements, such as those arising under the Sarbanes-Oxley Act and the fact that foreign laws occasionally conflict with domestic laws, have increased the complexity of the regulatory environment and the cost of compliance. Failure to comply with the various regulations may result in damage to our reputation, civil and criminal liability, fines and penalties, increased cost of regulatory compliance and restatements of our financial statements.

8
ANTI-TAKEOVER PROVISIONS We are incorporated in the state of Washington and subject to Washington state law. Some provisions of Washington state law could interfere withor restrict takeover bids or other change-in-control events affecting us. For example, one statutory provision prohibits us, except under specified circumstances, from engaging in any significant business transaction with any shareholder who owns 10% or more of our common stock (which shareholder, under the statute, would be considered an “acquiring person”) for a period of five years following the time that such shareholder became an acquiring person.
Item 1B. Unresolved Staff Comments.
None.
Item 2. Properties.
The following table summarizes the number of retail stores owned or leased by us, and the percentage of total store square footage representedby each listed category at February 2, 2008:
Number of Stores % of total store square footage
Owned stores 33 25.7% Owned on leased land 47 43.9% Leased stores 74 28.9% Partly owned and partly leased 2 1.5% Total 156 100.0%
We also own six merchandise distribution centers located in Portland, Oregon; Dubuque, Iowa; Ontario, California; Newark, California; Upper Marlboro, Maryland; and Gainesville, Florida, which are utilized by the Retail Stores segment. The Direct segment utilizes one fulfillment center in Cedar Rapids, Iowa, which is owned on leased land. Our administrative offices in Seattle, Washington are a combination of leased and owned space. We also lease an office building in the Denver, Colorado metropolitan area that serves as an office of Nordstrom fsb and Nordstrom Credit, Inc.

Nordstrom, Inc. and subsidiaries 9
[This page intentionally left blank.]

10
The following table lists our retail store facilities as of February 2, 2008: Location
Store Name
Square Footage
Year Store Opened
Location
Store Name
Square Footage
Year Store Opened
Full-Line Stores ALASKA ILLINOIS Anchorage Anchorage 5th Avenue Mall 97,000 1975 Chicago Michigan Avenue 274,000 2000 Oak Brook Oakbrook Center 249,000 1991 ARIZONA Schaumburg Woodfield Shopping Center 215,000 1995 Chandler Chandler Fashion Center 149,000 2001 Skokie Old Orchard Center 209,000 1994 Scottsdale Scottsdale Fashion Square 235,000 1998 INDIANA CALIFORNIA Indianapolis Circle Centre 216,000 1995 Arcadia Santa Anita 151,000 1994 Brea Brea Mall 195,000 19791 KANSAS Canoga Park Topanga 213,000 19841 Overland Park Oak Park Mall 219,000 1998 Cerritos Los Cerritos Center 122,000 1981 Corte Madera The Village at Corte Madera 116,000 1985 MARYLAND Costa Mesa South Coast Plaza 235,000 19781 Annapolis Annapolis Mall 162,000 1994 Escondido North County 156,000 1986 Bethesda Montgomery Mall 225,000 1991 Glendale Glendale Galleria 147,000 1983 Columbia The Mall in Columbia 173,000 1999 Irvine Irvine Spectrum Center 130,000 2005 Towson Towson Town Center 205,000 1992 Los Angeles The Grove 120,000 2002 Los Angeles Westside Pavilion 150,000 1985 MASSACHUSETTS Mission Viejo The Shops at Mission Viejo 172,000 1999 Natick Natick Collection 154,000 2007 Montclair Montclair Plaza 134,000 1986 Palo Alto Stanford Shopping Center 187,000 1984 MICHIGAN Pleasanton Stoneridge Mall 173,000 1990 Novi Twelve Oaks Mall 172,000 2007 Redondo Beach South Bay Galleria 161,000 1985 Troy Somerset Collection 258,000 1996 Riverside Galleria at Tyler 164,000 1991 Roseville Galleria at Roseville 149,000 2000 MINNESOTA Sacramento Arden Fair 190,000 1989 Bloomington Mall of America 240,000 1992 San Diego Fashion Valley 220,000 1981 San Diego Horton Plaza 151,000 1985 MISSOURI San Diego University Towne Center 130,000 1984 Des Peres West County 193,000 2002 San Francisco San Francisco Centre 350,000 1988 San Francisco Stonestown Galleria 174,000 1988 NEVADA San Jose Valley Fair 232,000 19871 Las Vegas Fashion Show 207,000 2002 San Mateo Hillsdale Shopping Center 149,000 1982 Santa Ana MainPlace 169,000 1987 NEW JERSEY Santa Barbara Paseo Nuevo 186,000 1990 Edison Menlo Park 204,000 1991 Walnut Creek Broadway Plaza 193,000 1984 Freehold Freehold Raceway Mall 174,000 1992 Paramus Garden State Plaza 282,000 1990 COLORADO Short Hills The Mall at Short Hills 188,000 1995 Broomfield FlatIron Crossing 172,000 2000 Denver Cherry Creek Shopping Center 142,000 2007 NEW YORK Littleton Park Meadows 245,000 1996 Garden City Roosevelt Field 241,000 1997 White Plains The Westchester 219,000 1995 CONNECTICUT Farmington Westfarms 189,000 1997 NORTH CAROLINA Charlotte SouthPark 151,000 2004 FLORIDA Durham The Streets at Southpoint 149,000 2002 Boca Raton Town Center at Boca Raton 193,000 2000 Coral Gables Village of Merrick Park 212,000 2002 OHIO Miami Dadeland Mall 150,000 2004 Beachwood Beachwood Place 231,000 1997 Orlando The Florida Mall 174,000 2002 Columbus Easton Town Center 174,000 2001 Palm Beach Gardens The Gardens Mall 150,000 2006 Tampa International Plaza 172,000 2001 Wellington The Mall at Wellington Green 127,000 2003 OREGON Portland Clackamas Town Center 121,000 1981 GEORGIA Portland Downtown Portland 174,000 19661 Atlanta Perimeter Mall 243,000 1998 Portland Lloyd Center 150,000 19631 Atlanta Phipps Plaza 140,000 2005 Salem Salem Center 71,000 1980 Buford Mall of Georgia 172,000 2000 Tigard Washington Square 189,000 19741 1 This store has been subsequently relocated.

Nordstrom, Inc. and subsidiaries 11
Location Store Name Square Footage
Year Store Opened
Location Store Name Square Footage
Year Store Opened
Full-Line Stores (continued) Nordstrom Rack Group
PENNSYLVANIA Chandler, AZ Chandler Festival Rack 37,000 2000 King of Prussia King of Prussia 238,000 1996 Phoenix, AZ Last Chance 48,000 19921
Scottsdale, AZ Scottsdale Promenade Rack 38,000 2000 RHODE ISLAND Brea, CA Brea Union Plaza Rack 45,000 1999 Providence Providence Place 206,000 1999 Chino, CA Chino Spectrum Towne Center Rack 38,000 19871
Colma, CA Colma Rack 31,000 1987 TEXAS Costa Mesa, CA Metro Pointe at South Coast Rack 50,000 19831
Austin Barton Creek Square 150,000 2003 Fresno, CA Villaggio Retail Center Rack 32,000 2002 Dallas Galleria Dallas 249,000 1996 Glendale, CA Glendale Fashion Center Rack 36,000 2000 Dallas NorthPark Center 212,000 2005 Long Beach, CA Long Beach CityPlace Rack 33,000 2002 Frisco Stonebriar Centre 149,000 2000 Los Angeles, CA The Promenade at Howard Hughes 41,000 2001 Houston Houston Galleria 226,000 2003 Center Rack Hurst North East Mall 149,000 2001 Ontario, CA Ontario Mills Mall Rack 40,000 2002 San Antonio The Shops at La Cantera 149,000 2005 Oxnard, CA Esplanade Shopping Center Rack 38,000 2001
Roseville, CA Creekside Town Center Rack 36,000 2001 UTAH Sacramento, CA Howe `Bout Arden Center Rack 54,000 1999 Murray Fashion Place 110,000 1981 San Diego, CA Mission Valley Rack 57,000 19851
Orem University Mall 122,000 2002 San Francisco, CA 555 Ninth Street Retail Center 43,000 2001 Rack
VIRGINIA San Jose, CA Westgate Mall Rack 48,000 1998 Arlington The Fashion Centre at 241,000 1989 San Leandro, CA San Leandro Rack 44,000 1990 Pentagon City San Marcos, CA Grand Plaza Rack 35,000 2006 Dulles Dulles Town Center 148,000 2002 Woodland Hills, CA Topanga Rack 64,000 1984 McLean Tysons Corner Center 211,000 1988 Broomfield, CO Flatiron Marketplace Rack 36,000 2001 Norfolk MacArthur Center 166,000 1999 Littleton, CO Meadows Marketplace Rack 34,000 1998 Richmond Short Pump Town Center 128,000 2003 Miami, FL Last Chance 26,000 2005
Sunrise, FL The Oasis at Sawgrass Mills Rack 27,000 2003 WASHINGTON Buford, GA Mall of Georgia Crossing Rack 44,000 2000 Bellevue Bellevue Square 285,000 19671 Honolulu, HI Ward Centers Rack 34,000 2000 Lynnwood Alderwood 151,000 19791 Chicago, IL The Shops at State and 41,000 2003 Seattle Downtown Seattle 383,000 19631 Washington Rack Seattle Northgate Mall 122,000 1965 Northbrook, IL Northbrook Rack 40,000 1996 Spokane River Park Square 137,000 19741 Oak Brook, IL The Shops at Oak Brook Place Rack 42,000 2000 Tacoma Tacoma Mall 134,000 1966 Schaumburg, IL Woodfield Rack 45,000 1994 Tukwila Southcenter 170,000 1968 Gaithersburg, MD Gaithersburg Rack 49,000 1999 Vancouver Vancouver 71,000 1977 Towson, MD Towson Rack 31,000 1992
Grand Rapids, MI Centerpointe Mall Rack 40,000 2001 Other Troy, MI Troy Marketplace Rack 40,000 2000
Bloomington, MN Mall of America Rack 41,000 1998 Atlanta, GA Jeffrey 7,000 2007 Las Vegas, NV Silverado Ranch Plaza Rack 33,000 2001 Honolulu, HI Ward Centers Shoes 16,000 1997 Westbury, NY The Mall at the Source Rack 48,000 1997 New York, NY Jeffrey 11,000 2007 Beaverton, OR Tanasbourne Town Center Rack 53,000 1998
Clackamas, OR Clackamas Promenade Rack 28,000 19831
Portland, OR Downtown Portland Rack 32,000 19861
King of Prussia, PA The Overlook at King of 45,000 2002 Prussia Rack Plano, TX Preston Shepard Place Rack 39,000 2000 Salt Lake City, UT Sugarhouse Rack 31,000 1991 Sterling, VA Dulles Town Crossing Rack 41,000 2001 Woodbridge, VA Potomac Mills Rack 46,000 1990 Auburn, WA SuperMall of the Great 48,000 1995 Northwest Rack Bellevue, WA Factoria Mall Rack 46,000 1997 Lynnwood, WA Golde Creek Plaza Rack 38,000 19851
Seattle, WA Downtown Seattle Rack 42,000 1987 Spokane, WA NorthTown Mall Rack 28,000 2000 Tukwila, WA Southcenter Square Rack 35,000 2007
1 This store has been subsequently relocated.
In 2008, we have opened two full-line stores and closed our free-standing shoe store. During the remainder of 2008 we are scheduled to open six more full-line stores and three Rack stores. In 2009, we are scheduled to open five full-line stores and two Rack stores.

12
Item 3. Legal Proceedings. (Dollars in millions)
COSMETICS We were originally named as a defendant along with other department store and specialty retailers in nine separate but virtually identical class action lawsuits filed in various Superior Courts of the State of California in May, June and July 1998 that were consolidated in Marin County Superior Court. In May 2000, plaintiffs filed an amended complaint naming a number of manufacturers of cosmetics and fragrances and two other retailers as additional defendants. Plaintiffs’ amended complaint alleged that the retail price of the “prestige” or “Department Store” cosmetics and fragrances sold in department and specialty stores was collusively controlled by the retailer and manufacturer defendants in violation of the Cartwright Act and the California Unfair Competition Act.
Plaintiffs sought treble damages and restitution in an unspecified amount, attorneys’ fees and prejudgment interest, on behalf of a class of all California residents who purchased cosmetics and fragrances for personal use from any of the defendants during the four years prior to the filing of the original complaints.
While we believe that the plaintiffs’ claims are without merit, we entered into a settlement agreement with the plaintiffs and the other defendants on July 13, 2003 in order to avoid the cost and distraction of protracted litigation. In furtherance of the settlement agreement, the case was re-filed in the United States District Court for the Northern District of California on behalf of a class of all persons who currently reside in the United States and who purchased “Department Store” cosmetics and fragrances from the defendants during the period May 29, 1994 through July 16, 2003. The Court gave preliminary approval to the settlement, and a summary notice of class certification and the terms of the settlement was disseminated to class members. On March 30, 2005, the Court entered a final judgment approving the settlement and dismissing the plaintiffs’ claims and the claims of all class members with prejudice, in their entirety. On April 29, 2005, two class members who had objected to the settlement filed notices of appeal from the Court’s final judgment to the United States Court of Appeals for the Ninth Circuit. The Ninth Circuit issued its decision on August 23, 2007, affirming the District Courts’ ruling and the settlement became final according to its terms on November 22, 2007. Pursuant to the settlement, the defendants will provide class members with certain free products with an estimated retail value of $175 and pay the plaintiffs’ attorneys’ fees, awarded by the Court, of $24. We have paid approximately $1 for our allocated portion of both the costs of the free products to class members and the attorneys’ fees.
OTHERWe are involved in routine claims, proceedings and litigation arising from the normal course of our business. We do not believe any such claim, proceeding or litigation, either alone or in aggregate, will have a material impact on our financial condition, results of operations or cash flows.
Item 4. Submission of Matters to a Vote of Security Holders.
None.
PART II
Item 5. Market for Registrant’s Common Equity, Related Shareholder Matters and Issuer Purchases of Equity Securities.
MARKET, SHAREHOLDER AND DIVIDEND INFORMATION Our common stock, without par value, is traded on the New York Stock Exchange under the symbol “JWN.” The approximate number of holdersof common stock as of March 12, 2008 was 166,390, based upon the number of registered and beneficial shareholders, as well as the number of employee shareholders in the Nordstrom 401(k) Plan and Profit Sharing Plan.
The high and low sales prices of our common stock and dividends declared for each quarter of 2007 and 2006 are presented in the table below:
Common Stock Price 2007 2006 Dividends per Share High Low High Low 2007 2006 1st Quarter $59.70 $49.35 $42.90 $37.51 $0.135 $0.105 2nd Quarter $56.00 $42.70 $39.50 $31.77 $0.135 $0.105 3rd Quarter $53.47 $36.12 $49.52 $32.97 $0.135 $0.105 4th Quarter $39.95 $28.00 $57.10 $45.37 $0.135 $0.105 Full Year $59.70 $28.00 $57.10 $31.77 $0.54 $0.42

Nordstrom, Inc. and subsidiaries 13
REPURCHASES(Dollars and share amounts in millions except per share amounts)
We believe that the cash flows generated from the business are best utilized when reinvested in our business or distributed to our shareholders. With the objective of minimizing cash held on the balance sheet, we balance our shareholder payout objectives with meeting our capital structure goals and funding our operating and capital plans. Our shareholder payout objective is to continue to pay a quarterly dividend and to execute the authorized share repurchase program. In the execution of our share repurchase programs we use either open market repurchase plans or accelerated repurchase plans and seek a rate of return that over the long term exceeds the after-tax yield on invested cash and exceeds our cost of capital.
A summary of share repurchases during the fourth quarter is as follows:
Period
Total Number of Shares (or Units) Purchased
Average Price Paid Per Share (or Unit)
Total Number of Shares (or Units) Purchased as Part of Publicly Announced Plans or Programs
Maximum Number (or Approximate Dollar Value) of Shares (or Units) that May Yet Be Purchased Under the Plans or Programs1
Nov. 2007 (11/4/07 to 12/1/07) - - - $1,751 Dec. 2007 (12/2/07 to 1/5/08) 5.4 $35.97 5.4 $1,556 Jan. 2008 (1/6/08 to 2/2/08) 5.9 $32.91 5.9 $1,364 Total 11.3 $34.38 11.3
1 During 2007, we repurchased 39 shares of our common stock for an aggregate purchase price of $1,728 (an average price per share of $44.17). In May 2006, the Board of Directors authorized $1,000 of share repurchases which was exhausted in August 2007. Additionally, in August 2007, our Board of Directors authorized a $1,500 share repurchase program and in November 2007 authorized an additional $1,000, bringing the total program to $2,500. The program authorization will expire after 24 months. The actual amount and timing of future share repurchases will be subject to market conditions and applicable Securities and Exchange Commission rules.
STOCK PRICE PERFORMANCE The following graph compares, for each of the last five fiscal years, ending February 2, 2008, the cumulative total return of Nordstrom, Inc. common stock, Standard & Poor’s 500 Index and Standard & Poor’s Retail Index. The Retail Index is comprised of 40 retail companies, including the Company, representing a sector of the Standard & Poor’s 500 Index. The cumulative total return of Nordstrom, Inc. common stock assumes $100 invested on January 31, 2003 in Nordstrom, Inc. common stock and assumes reinvestment of dividends.
End of fiscal year: 2002 2003 2004 2005 2006 2007 Standard & Poor’s 500 Index 100 132 137 150 169 163 Standard & Poor’s Retail Index 100 148 169 182 208 168 Nordstrom, Inc. common stock 100 222 272 488 660 469
14
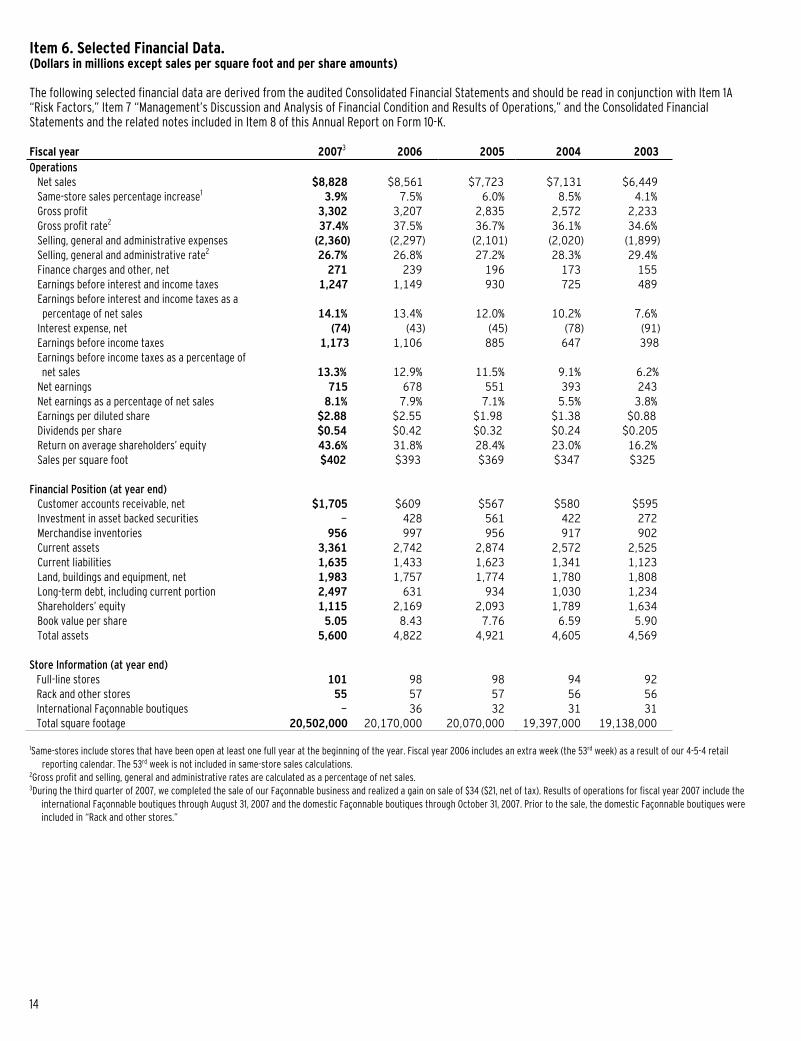
Item 6. Selected Financial Data. (Dollars in millions except sales per square foot and per share amounts)
The following selected financial data are derived from the audited Consolidated Financial Statements and should be read in conjunction with Item 1A “Risk Factors,” Item 7 “Management’s Discussion and Analysis of Financial Condition and Results of Operations,” and the Consolidated Financial Statements and the related notes included in Item 8 of this Annual Report on Form 10-K.
Fiscal year 20073 2006 2005 2004 2003 Operations
Net sales $8,828 $8,561 $7,723 $7,131 $6,449 Same-store sales percentage increase1 3.9% 7.5% 6.0% 8.5% 4.1% Gross profit 3,302 3,207 2,835 2,572 2,233 Gross profit rate2 37.4% 37.5% 36.7% 36.1% 34.6% Selling, general and administrative expenses (2,360) (2,297) (2,101) (2,020) (1,899) Selling, general and administrative rate2 26.7% 26.8% 27.2% 28.3% 29.4% Finance charges and other, net 271 239 196 173 155 Earnings before interest and income taxes 1,247 1,149 930 725 489 Earnings before interest and income taxes as a percentage of net sales 14.1% 13.4% 12.0% 10.2% 7.6%
Interest expense, net (74) (43) (45) (78) (91) Earnings before income taxes 1,173 1,106 885 647 398 Earnings before income taxes as a percentage of net sales 13.3% 12.9% 11.5% 9.1% 6.2%
Net earnings 715 678 551 393 243 Net earnings as a percentage of net sales 8.1% 7.9% 7.1% 5.5% 3.8% Earnings per diluted share $2.88 $2.55 $1.98 $1.38 $0.88 Dividends per share $0.54 $0.42 $0.32 $0.24 $0.205 Return on average shareholders’ equity 43.6% 31.8% 28.4% 23.0% 16.2% Sales per square foot $402 $393 $369 $347 $325
Financial Position (at year end)
Customer accounts receivable, net $1,705 $609 $567 $580 $595 Investment in asset backed securities - 428 561 422 272 Merchandise inventories 956 997 956 917 902 Current assets 3,361 2,742 2,874 2,572 2,525 Current liabilities 1,635 1,433 1,623 1,341 1,123 Land, buildings and equipment, net 1,983 1,757 1,774 1,780 1,808 Long-term debt, including current portion 2,497 631 934 1,030 1,234 Shareholders’ equity 1,115 2,169 2,093 1,789 1,634 Book value per share 5.05 8.43 7.76 6.59 5.90 Total assets 5,600 4,822 4,921 4,605 4,569
Store Information (at year end)
Full-line stores 101 98 98 94 92 Rack and other stores 55 57 57 56 56 International Façonnable boutiques - 36 32 31 31 Total square footage 20,502,000 20,170,000 20,070,000 19,397,000 19,138,000
1Same-stores include stores that have been open at least one full year at the beginning of the year. Fiscal year 2006 includes an extra week (the 53rd week) as a result of our 4-5-4 retail reporting calendar. The 53rd week is not included in same-store sales calculations. 2Gross profit and selling, general and administrative rates are calculated as a percentage of net sales. 3During the third quarter of 2007, we completed the sale of our Façonnable business and realized a gain on sale of $34 ($21, net of tax). Results of operations for fiscal year 2007 include the
international Façonnable boutiques through August 31, 2007 and the domestic Façonnable boutiques through October 31, 2007. Prior to the sale, the domestic Façonnable boutiques were included in “Rack and other stores.”

Nordstrom, Inc. and subsidiaries 15
Item 7. Management’s Discussion and Analysis of Financial Condition and Results of Operations. (Dollar, share and square footage amounts in millions except percentages, per share and per square foot amounts)
Nordstrom is a fashion specialty retailer offering designer, luxury and high-quality apparel, shoes, cosmetics and accessories for women, men and children. We offer a wide selection of brand name and private label merchandise. We offer our products through multiple channels including full-line ‘Nordstrom’ stores, discount ‘Nordstrom Rack’ stores, ‘Jeffrey’ boutiques, catalogs and on the Internet at www.nordstrom.com. Our stores are located throughout the United States. In addition, we offer our customers a variety of payment products and services including our loyalty program.
STRATEGIC INITIATIVES We believe we are well positioned to grow the value of our business by executing the following key initiatives: tailoring our merchandise offering within existing product categories to better meet the needs of our core customers, improving the consistency and shopping experience for our customers across all channels, and continuing to increase our presence where our customers shop. We focus on customers who love fashion, value quality — both in merchandise and design — and appreciate great service.
Merchandise Strategies We’ve found that there’s a great deal of opportunity to grow our sales in existing stores simply by earning a greater share of our customers’ business across multiple product categories. We use customer insight to better serve our customers’ needs and wants. Our goal is to provide customers with a best-in-market selection of designer, luxury and quality fashion brands. Our top performing merchandise division was our designer category, including apparel, shoes and accessories merchandise. We continue to enhance our designer offering across categories and improve our distribution from the world’s best luxury brands. Our breadth of merchandise will allow us to serve both the growing core customer segment as well as those who aspire to luxury and quality.
Multi-Channel Shopping Experience As a multi-channel retailer, we are positioned to respond to evolving customer needs and expectations. We continue to strive to offer knowledgeable, friendly and welcoming service, both in our stores and online with an integrated offering and experience. We have committed the necessary resources and critical projects are close to completion in this effort.
Our online store is essential to creating and maintaining relationships with many of our most active and loyal customers. Many customers begin shopping with us online and migrate to our stores. By giving customers a consistent shopping experience in-store and online, we’re making progress to become more relevant to today’s shoppers. We continue to use technology to find new ways to serve our customers better, such as one view of inventory and point of sale upgrades. We also continue to make improvements to our Web site to make shopping easier.
Increase Our Presence We continue to grow our presence in the top markets and best retail locations around the country. We see potential to gain market share and grow our business by increasing our presence where our customers live. Fortunately, we are in an advantageous position to reach new customers through building stores and remodeling our current ones. We’ve recently launched a $3,000 five-year capital plan, with 82% of the dollars allocated to new stores, remodels and relocations.
We will continue to have a disciplined approach to real estate acquisitions, adding new stores when and where they pass our criteria. Our current plan is to have 140 to 150 full-line stores by 2015.
OVERVIEW In 2007, we continued to grow our business despite operating in a more challenging consumer and retail environment compared to past years. A slower economic environment weighed on the overall market, resulting in softer trends throughout the retail industry in the second half of the year. Our ability to provide a focused and edited merchandise offering, incorporating the best of what the marketplace has to offer in terms of fashion, quality and brands, has contributed to our results in this and past years. Our customers want the best merchandise available. Key highlights for 2007 include:
We achieved positive same-store sales growth for the sixth year in a row. Same-store sales increased 3.9% on top of our 7.5% increase in 2006 and our 6.0% increase in 2005.
Increased markdowns at our full-line stores led to a 6 basis point decline in our gross profit rate.
Our selling, general and administrative rate improved 9 basis points primarily from lower incentives tied to company performance, partially offset by higher bad debt expense.
Full year net earnings increased 5.5% as a result of same-store sales increases, the openings of three full-line stores during 2007, and lower incentive costs tied to company performance.
Earnings per diluted share increased 12.9% over last year to $2.88. We repurchased 39 shares totaling $1,728 during the year, which had a $0.07 positive impact on earnings per diluted share.
Like many other retailers, Nordstrom follows the retail 4-5-4 reporting calendar, which included an extra week in fiscal 2006 (the 53rd week).The 53rd week is not included in same-store sales calculations.
16
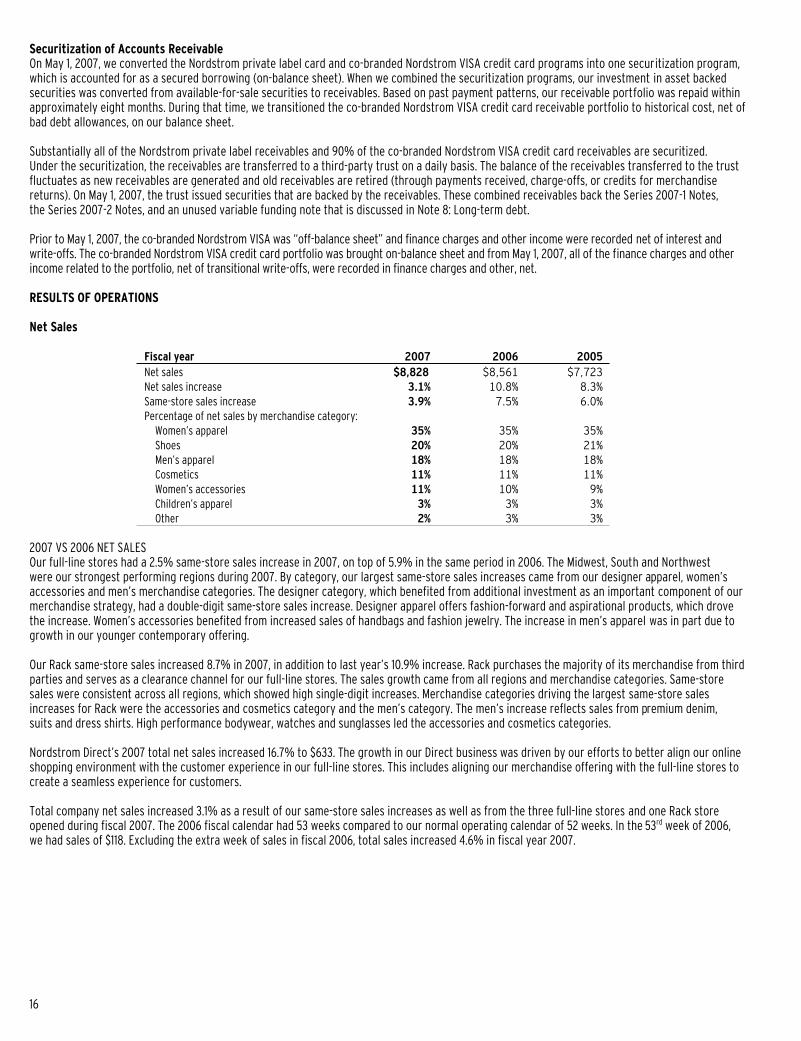
Securitization of Accounts Receivable On May 1, 2007, we converted the Nordstrom private label card and co-branded Nordstrom VISA credit card programs into one securitization program, which is accounted for as a secured borrowing (on-balance sheet). When we combined the securitization programs, our investment in asset backed securities was converted from available-for-sale securities to receivables. Based on past payment patterns, our receivable portfolio was repaid within approximately eight months. During that time, we transitioned the co-branded Nordstrom VISA credit card receivable portfolio to historical cost, net of bad debt allowances, on our balance sheet.
Substantially all of the Nordstrom private label receivables and 90% of the co-branded Nordstrom VISA credit card receivables are securitized. Under the securitization, the receivables are transferred to a third-party trust on a daily basis. The balance of the receivables transferred to the trust fluctuates as new receivables are generated and old receivables are retired (through payments received, charge-offs, or credits for merchandise returns). On May 1, 2007, the trust issued securities that are backed by the receivables. These combined receivables back the Series 2007-1 Notes, the Series 2007-2 Notes, and an unused variable funding note that is discussed in Note 8: Long-term debt.
Prior to May 1, 2007, the co-branded Nordstrom VISA was “off-balance sheet” and finance charges and other income were recorded net of interest and write-offs. The co-branded Nordstrom VISA credit card portfolio was brought on-balance sheet and from May 1, 2007, all of the finance charges and other income related to the portfolio, net of transitional write-offs, were recorded in finance charges and other, net.
RESULTS OF OPERATIONS
Net Sales
Fiscal year 2007 2006 2005 Net sales $8,828 $8,561 $7,723 Net sales increase 3.1% 10.8% 8.3% Same-store sales increase 3.9% 7.5% 6.0% Percentage of net sales by merchandise category: Women’s apparel 35% 35% 35% Shoes 20% 20% 21% Men’s apparel 18% 18% 18% Cosmetics 11% 11% 11% Women’s accessories 11% 10% 9% Children’s apparel 3% 3% 3% Other 2% 3% 3%
2007 VS 2006 NET SALES Our full-line stores had a 2.5% same-store sales increase in 2007, on top of 5.9% in the same period in 2006. The Midwest, South and Northwest were our strongest performing regions during 2007. By category, our largest same-store sales increases came from our designer apparel, women’s accessories and men’s merchandise categories. The designer category, which benefited from additional investment as an important component of our merchandise strategy, had a double-digit same-store sales increase. Designer apparel offers fashion-forward and aspirational products, which drove the increase. Women’s accessories benefited from increased sales of handbags and fashion jewelry. The increase in men’s apparel was in part due to growth in our younger contemporary offering.
Our Rack same-store sales increased 8.7% in 2007, in addition to last year’s 10.9% increase. Rack purchases the majority of its merchandise from third parties and serves as a clearance channel for our full-line stores. The sales growth came from all regions and merchandise categories. Same-store sales were consistent across all regions, which showed high single-digit increases. Merchandise categories driving the largest same-store sales increases for Rack were the accessories and cosmetics category and the men’s category. The men’s increase reflects sales from premium denim, suits and dress shirts. High performance bodywear, watches and sunglasses led the accessories and cosmetics categories.
Nordstrom Direct’s 2007 total net sales increased 16.7% to $633. The growth in our Direct business was driven by our efforts to better align our online shopping environment with the customer experience in our full-line stores. This includes aligning our merchandise offering with the full-line stores to create a seamless experience for customers.
Total company net sales increased 3.1% as a result of our same-store sales increases as well as from the three full-line stores and one Rack store opened during fiscal 2007. The 2006 fiscal calendar had 53 weeks compared to our normal operating calendar of 52 weeks. In the 53rd week of 2006, we had sales of $118. Excluding the extra week of sales in fiscal 2006, total sales increased 4.6% in fiscal year 2007.

Nordstrom, Inc. and subsidiaries 17
2006 VS 2005 NET SALES All of our full-line store regions and most of our full-line store merchandise categories had same-store sales increases. Our full-line stores had a 5.9% same-store sales increase, ahead of 5.4% in 2005. Our compelling merchandise offering, combined with customer service, drove sales increases throughout our business, particularly in accessories, cosmetics and men’s apparel. The largest increase was in our accessories category, driven by handbags and sunglasses. Cosmetics benefited from increases in the artistry and prestigious branded lines. Additionally, the men’s increase came from men’s contemporary, including fashion denim and t-shirts.
Our Rack same-store sales increased 10.9% in 2006, on top of an increase of 14.8% in 2005. The sales growth came from all regions and merchandise categories.
Our online store sales drove Nordstrom Direct’s 2006 total net sales increase of 23.5%. Our online sales benefited from the overall Internet marketplace expansion, driven by the continued adoption of higher-speed Internet connections which allow for convenient and efficient shopping,as well as utilization of the Internet as a tool for research and information before making a purchase decision. Catalog sales experienced an overall decline because we reduced our catalog mailings beginning in the middle of 2005.
Total net sales increased 10.8% as a result of our same-store sales increases as well as from the five full-line stores and one Rack store opened since February 2006. We also relocated one full-line store and expanded one Rack store, which contributed to our increase in total net sales.In the 53rd week, we had sales of $118. Sales for the 53rd week represented 1.5% of the total percentage increase versus 2005.
2008 FORECAST OF SAME-STORE SALES In 2008, we have opened two full-line stores and plan to open six more full-line stores and three Rack stores. This will increase retail square footage by approximately 6%. We expect 2008 same-store sales to be approximately flat to a 2% decrease, with the first half of the year lower than the annual rate and the second half of the year higher than the annual rate.
Gross Profit
Fiscal year 2007 2006 2005 Gross profit $3,302 $3,207 $2,835 Gross profit rate 37.4% 37.5% 36.7% Average inventory per square foot $52.70 $52.37 $51.25 Inventory turnover rate* 5.16 5.06 4.84
* Inventory turnover rate calculated as annual cost of sales divided by 5-quarter average inventory.
2007 VS 2006 GROSS PROFIT Our gross profit rate is made up of both merchandise margin rate and buying and occupancy cost rate. Compared to last year, our gross profit rate declined 6 basis points, driven primarily by markdowns at our full-line stores. During the year we experienced increasing inventory levels coupled with slower sales trends. To realign our inventory levels, we took higher markdowns during the last half of the year. The increase in markdowns was offset by a decrease in our buying and occupancy costs. The decrease in these expenses related to performance-based incentives and lower expense resulting from the sale of our Façonnable business.
The increase in our average inventory per square foot supports the growth of our designer business in apparel, accessories and shoes. Although we encountered softer sales trends during the latter half of 2007, inventory discipline and growth in sales throughout the year resulted in improvement in our inventory turnover rate, which increased 1.9%.
2006 VS 2005 GROSS PROFIT Our gross profit rate improved 75 basis points, driven primarily by expansion of our merchandise margin rate. All major merchandise categories contributed to this rate expansion. Our women’s apparel category experienced significant rate expansion in the second half of the year due to strategy changes that brought a sharper focus to our merchandise offering, resulting in more regular price selling and fewer markdowns.
For the first time, in 2006 our buying and occupancy costs included expenses related to stock options awarded primarily to our merchant and product development groups. These costs were $12 and impacted our gross profit rate by 14 basis points. Despite this additional expense, our buying and occupancy cost rate also improved, driven by sales growth relative to our mostly fixed buying and occupancy costs.
Sales growth and continued inventory discipline resulted in improvement in our inventory turnover rate, which increased 4.5%.
2008 FORECAST OF GROSS PROFIT In 2008, we expect a net 30 to 60 basis point decrease in our gross profit rate as we will have additional occupancy costs from the eight full-line stores and three Rack stores we will open in 2008.
18
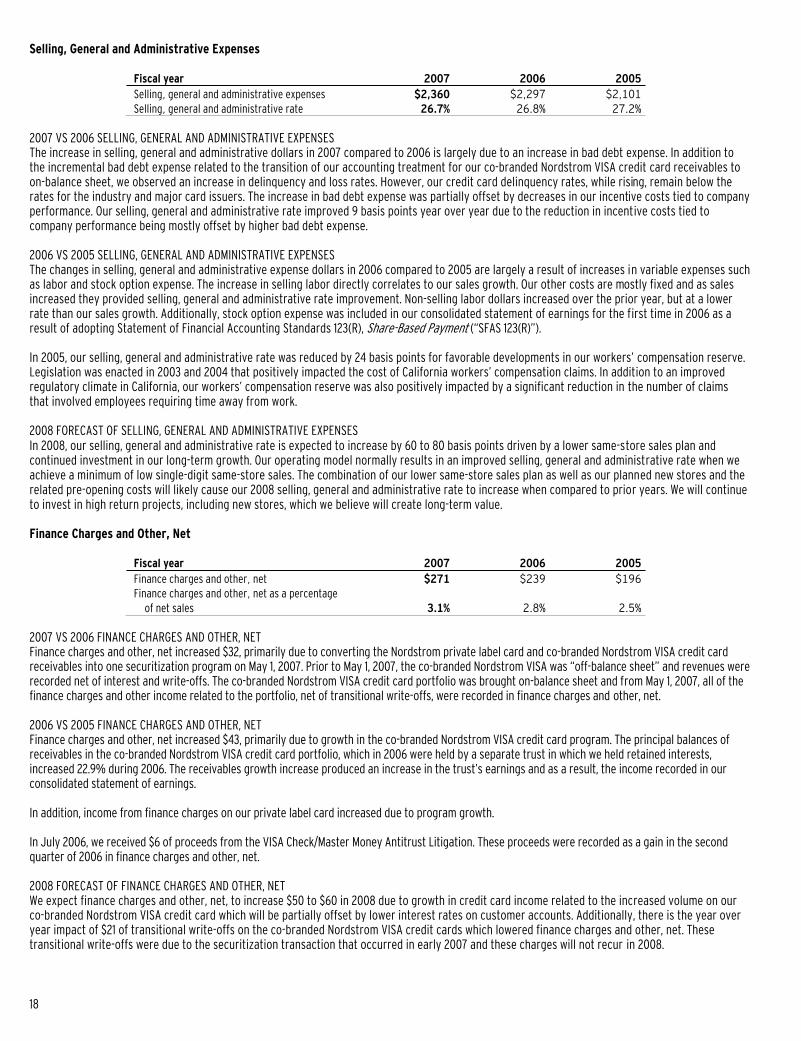
Selling, General and Administrative Expenses
Fiscal year 2007 2006 2005 Selling, general and administrative expenses $2,360 $2,297 $2,101 Selling, general and administrative rate 26.7% 26.8% 27.2%
2007 VS 2006 SELLING, GENERAL AND ADMINISTRATIVE EXPENSES The increase in selling, general and administrative dollars in 2007 compared to 2006 is largely due to an increase in bad debt expense. In addition to the incremental bad debt expense related to the transition of our accounting treatment for our co-branded Nordstrom VISA credit card receivables to on-balance sheet, we observed an increase in delinquency and loss rates. However, our credit card delinquency rates, while rising, remain below the rates for the industry and major card issuers. The increase in bad debt expense was partially offset by decreases in our incentive costs tied to company performance. Our selling, general and administrative rate improved 9 basis points year over year due to the reduction in incentive costs tied to company performance being mostly offset by higher bad debt expense.
2006 VS 2005 SELLING, GENERAL AND ADMINISTRATIVE EXPENSES The changes in selling, general and administrative expense dollars in 2006 compared to 2005 are largely a result of increases in variable expenses such as labor and stock option expense. The increase in selling labor directly correlates to our sales growth. Our other costs are mostly fixed and as sales increased they provided selling, general and administrative rate improvement. Non-selling labor dollars increased over the prior year, but at a lower rate than our sales growth. Additionally, stock option expense was included in our consolidated statement of earnings for the first time in 2006 as a result of adopting Statement of Financial Accounting Standards 123(R), Share-Based Payment (“SFAS 123(R)”).
In 2005, our selling, general and administrative rate was reduced by 24 basis points for favorable developments in our workers’ compensation reserve. Legislation was enacted in 2003 and 2004 that positively impacted the cost of California workers’ compensation claims. In addition to an improved regulatory climate in California, our workers’ compensation reserve was also positively impacted by a significant reduction in the number of claims that involved employees requiring time away from work.
2008 FORECAST OF SELLING, GENERAL AND ADMINISTRATIVE EXPENSES In 2008, our selling, general and administrative rate is expected to increase by 60 to 80 basis points driven by a lower same-store sales plan and continued investment in our long-term growth. Our operating model normally results in an improved selling, general and administrative rate when we achieve a minimum of low single-digit same-store sales. The combination of our lower same-store sales plan as well as our planned new stores and the related pre-opening costs will likely cause our 2008 selling, general and administrative rate to increase when compared to prior years. We will continue to invest in high return projects, including new stores, which we believe will create long-term value.
Finance Charges and Other, Net
Fiscal year 2007 2006 2005 Finance charges and other, net $271 $239 $196 Finance charges and other, net as a percentage
of net sales 3.1% 2.8% 2.5%
2007 VS 2006 FINANCE CHARGES AND OTHER, NET Finance charges and other, net increased $32, primarily due to converting the Nordstrom private label card and co-branded Nordstrom VISA credit card receivables into one securitization program on May 1, 2007. Prior to May 1, 2007, the co-branded Nordstrom VISA was “off-balance sheet” and revenues were recorded net of interest and write-offs. The co-branded Nordstrom VISA credit card portfolio was brought on-balance sheet and from May 1, 2007, all of the finance charges and other income related to the portfolio, net of transitional write-offs, were recorded in finance charges and other, net.
2006 VS 2005 FINANCE CHARGES AND OTHER, NET Finance charges and other, net increased $43, primarily due to growth in the co-branded Nordstrom VISA credit card program. The principal balances of receivables in the co-branded Nordstrom VISA credit card portfolio, which in 2006 were held by a separate trust in which we held retained interests, increased 22.9% during 2006. The receivables growth increase produced an increase in the trust’s earnings and as a result, the income recorded in our consolidated statement of earnings.
In addition, income from finance charges on our private label card increased due to program growth.
In July 2006, we received $6 of proceeds from the VISA Check/Master Money Antitrust Litigation. These proceeds were recorded as a gain in the second quarter of 2006 in finance charges and other, net.
2008 FORECAST OF FINANCE CHARGES AND OTHER, NET We expect finance charges and other, net, to increase $50 to $60 in 2008 due to growth in credit card income related to the increased volume on our co-branded Nordstrom VISA credit card which will be partially offset by lower interest rates on customer accounts. Additionally, there is the year over year impact of $21 of transitional write-offs on the co-branded Nordstrom VISA credit cards which lowered finance charges and other, net. These transitional write-offs were due to the securitization transaction that occurred in early 2007 and these charges will not recur in 2008.

Nordstrom, Inc. and subsidiaries 19
Gain on Sale of Façonnable During the third quarter of 2007, we completed the sale of the Façonnable business in exchange for cash of $216, net of transaction costs, and realized a gain on sale of $34. The impact to reported earnings per diluted share for the year was $0.09, net of tax of $13.
Interest Expense, Net
Fiscal year 2007 2006 2005 Interest expense, net $74 $43 $45
2007 VS 2006 INTEREST EXPENSE, NET We experienced higher interest expense, net, of $74 due to higher average debt levels resulting from the issuance of $850 in secured notes during the first quarter and our $1,000 debt offering during the fourth quarter.
2006 VS 2005 INTEREST EXPENSE, NET Interest expense, net decreased $2 in 2006 compared to 2005. The decrease was primarily due to increased interest income from higher average cash investment balances.
2008 FORECAST OF INTEREST EXPENSE, NET Our 2008 net interest expense will be impacted by several factors. Because of the additional debt incurred in 2007, we expect interest expense to increase due to volume. Interest rates are currently lower than 2007 levels and we expect to benefit from these lower rates with respect to the portion of our debt that is variable and our interest rate swap. Additionally, interest income is expected to be negatively impacted by market rate declines as well as lower levels of invested funds. We currently expect interest expense, net, to be approximately $55 to $60 higher due to these factors. For further information, we refer you to our Quantitative and Qualitative Disclosures About Market Risk included as Item 7A of this Form 10-K.
Income Tax Expense
Fiscal year 2007 2006 2005 Income tax expense $458 $428 $334 Effective tax rate 39.0% 38.7% 37.7%
2007 VS 2006 INCOME TAX EXPENSE Our effective tax rate in 2007 increased from the 2006 rate because of the current year impact of Financial Accounting Standards Board (FASB) Interpretation No. 48, Accounting for Uncertainty in Income Taxes (“FIN 48”) and changes in our estimates of the carrying value of our deferredtax assets.
2006 VS 2005 INCOME TAX EXPENSE Our effective tax rate in 2006 increased from the 2005 rate because current year changes in our estimates of the taxes due or recoverable for prior year activities and because the 2005 expense was lower due to a higher than expected utilization of a loss carryforward.
2008 FORECAST OF INCOME TAX EXPENSE In 2008, considering the federal tax rate of 35.0%, the net effect of state income taxes, the net effect of permanently nondeductible items and the additional current year expense due to Financial Accounting Standards Board (FASB) Interpretation No. 48, Accounting for Uncertainty in Income Taxes(“FIN 48”), we expect our effective tax rate to be approximately 38.7%.
Net Earnings and Earnings per Diluted Share
Fiscal year 2007 2006 2005 Net earnings $715 $678 $551 Net earnings as a percentage of net sales 8.1% 7.9% 7.1% Earnings per diluted share $2.88 $2.55 $1.98
2007 VS 2006 NET EARNINGS AND EARNINGS PER DILUTED SHARE In 2007, net earnings increased 5.5% and earnings per diluted share increased 12.9% as a result of same-store sales increases, the three full-linestores opened since February 2007 and lower incentive costs tied to company performance. These increases were offset by increased markdowns at our full-line stores and higher bad debt expense. Additionally, earnings per diluted share for 2007 were impacted by the following transactions:
$0.09 positive impact from the gain on the sale of the Façonnable business,
$0.07 positive impact from repurchases of common stock, and
$0.06 negative impact from the securitization transaction.
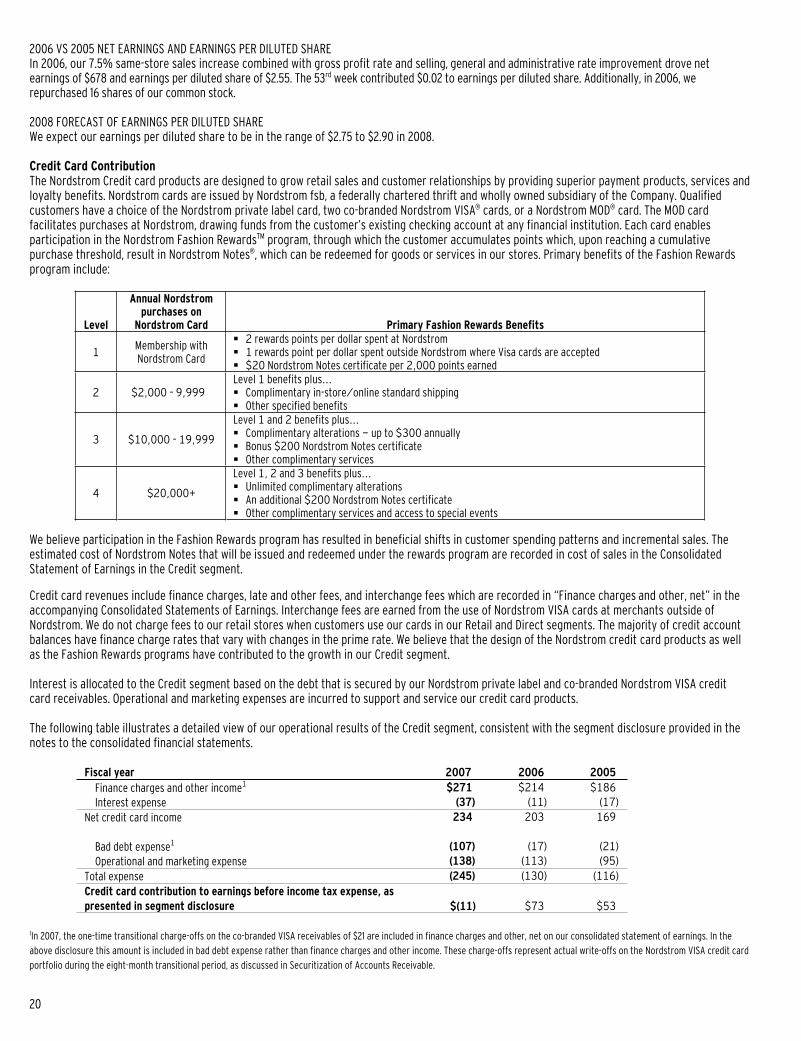
20
2006 VS 2005 NET EARNINGS AND EARNINGS PER DILUTED SHARE In 2006, our 7.5% same-store sales increase combined with gross profit rate and selling, general and administrative rate improvement drove net earnings of $678 and earnings per diluted share of $2.55. The 53rd week contributed $0.02 to earnings per diluted share. Additionally, in 2006, we repurchased 16 shares of our common stock.
2008 FORECAST OF EARNINGS PER DILUTED SHARE We expect our earnings per diluted share to be in the range of $2.75 to $2.90 in 2008.
Credit Card Contribution The Nordstrom Credit card products are designed to grow retail sales and customer relationships by providing superior payment products, services and loyalty benefits. Nordstrom cards are issued by Nordstrom fsb, a federally chartered thrift and wholly owned subsidiary of the Company. Qualified customers have a choice of the Nordstrom private label card, two co-branded Nordstrom VISA® cards, or a Nordstrom MOD® card. The MOD card facilitates purchases at Nordstrom, drawing funds from the customer’s existing checking account at any financial institution. Each card enables participation in the Nordstrom Fashion RewardsTM program, through which the customer accumulates points which, upon reaching a cumulative purchase threshold, result in Nordstrom Notes®, which can be redeemed for goods or services in our stores. Primary benefits of the Fashion Rewards program include:
Level
Annual Nordstrom purchases on
Nordstrom Card Primary Fashion Rewards Benefits
1 Membership with Nordstrom Card
2 rewards points per dollar spent at Nordstrom 1 rewards point per dollar spent outside Nordstrom where Visa cards are accepted $20 Nordstrom Notes certificate per 2,000 points earned
2 $2,000 – 9,999 Level 1 benefits plus...
Complimentary in-store/online standard shipping Other specified benefits
3 $10,000 – 19,999
Level 1 and 2 benefits plus... Complimentary alterations - up to $300 annually Bonus $200 Nordstrom Notes certificate Other complimentary services
4 $20,000+
Level 1, 2 and 3 benefits plus... Unlimited complimentary alterations An additional $200 Nordstrom Notes certificate Other complimentary services and access to special events
We believe participation in the Fashion Rewards program has resulted in beneficial shifts in customer spending patterns and incremental sales. The estimated cost of Nordstrom Notes that will be issued and redeemed under the rewards program are recorded in cost of sales in the Consolidated Statement of Earnings in the Credit segment.
Credit card revenues include finance charges, late and other fees, and interchange fees which are recorded in “Finance charges and other, net” in the accompanying Consolidated Statements of Earnings. Interchange fees are earned from the use of Nordstrom VISA cards at merchants outside of Nordstrom. We do not charge fees to our retail stores when customers use our cards in our Retail and Direct segments. The majority of credit account balances have finance charge rates that vary with changes in the prime rate. We believe that the design of the Nordstrom credit card products as well as the Fashion Rewards programs have contributed to the growth in our Credit segment.
Interest is allocated to the Credit segment based on the debt that is secured by our Nordstrom private label and co-branded Nordstrom VISA credit card receivables. Operational and marketing expenses are incurred to support and service our credit card products.
The following table illustrates a detailed view of our operational results of the Credit segment, consistent with the segment disclosure provided in the notes to the consolidated financial statements.
Fiscal year 2007 2006 2005 Finance charges and other income1 $271 $214 $186 Interest expense (37) (11) (17)
Net credit card income 234 203 169
Bad debt expense1 (107) (17) (21) Operational and marketing expense (138) (113) (95)
Total expense (245) (130) (116) Credit card contribution to earnings before income tax expense, as presented in segment disclosure $(11) $73 $53
1In 2007, the one-time transitional charge-offs on the co-branded VISA receivables of $21 are included in finance charges and other, net on our consolidated statement of earnings. In the above disclosure this amount is included in bad debt expense rather than finance charges and other income. These charge-offs represent actual write-offs on the Nordstrom VISA credit card portfolio during the eight-month transitional period, as discussed in Securitization of Accounts Receivable.

Nordstrom, Inc. and subsidiaries 21
In order to view the total economic contribution of our credit card program, the following additional items need to be considered:
During 2007, we combined our Nordstrom private label credit card and co-branded Nordstrom VISA credit card programs into one securitization program. At this time the Nordstrom co-branded VISA credit card receivables were brought on-balance sheet. For comparability between years, off-balance sheet amounts are shown for additional finance charge and other income, interest expense, and bad debt expense. This combined presentation mitigates the impact of the change in accounting.
Intercompany merchant fees and other represents the additional intercompany income of our credit business from the usage of our cards
in the Retail and Direct segments. On a consolidated basis, we avoid these costs which would be incurred if our customers used third-party cards.
Additional intercompany interest expense represents a portion of consolidated interest expense based on estimated funding costs for
average accounts receivable which would be needed if our Credit segment was a stand-alone organization. This allocation method assumes that 80 percent of average accounts receivable are debt-financed with an appropriate mix of fixed and variable rate debt.
The following table illustrates total credit card contribution, including the items discussed above: Fiscal year 2007 2006 2005 Finance charges and other income (from above) $271 $214 $186 Off-balance sheet finance charges and other income 22 37 26 Intercompany merchant fees and other 48 43 38 Total finance charges and other income 341 294 250 Interest expense (from above) (37) (11) (17) Off-balance sheet interest expense (6) (21) (8) Intercompany interest expense (27) (26) (18) Total interest expense (70) (58) (43) Total net credit card income 271 236 207 Bad debt expense (from above) (107) (17) (21) Off-balance sheet bad debt expense (7) (22) (25) Total bad debt expense (114) (39) (46) Operational and marketing expense (138) (113) (95) Total expense (252) (152) (141) Total credit card contribution $19 $84 $66
Interest expense increased in 2007 due to higher borrowings from portfolio growth. 2006 interest expense reflects higher interest rate trends and higher borrowings due to portfolio growth. Credit division expenses include a bad debt provision. Delinquency and write-offs increased in 2007, reflecting credit industry trends. The allowance as a percent of on-balance sheet accounts receivable increased in 2007, reflecting higher estimated losses inherent in the current receivable portfolio. In 2007, we also incurred one-time transitional charge-offs associated with bringing the co-branded VISA receivables on-balance sheet. Write-offs declined in 2006 following an increase in bankruptcy filings in the fourth quarter of 2005 which was the result of a change in federal bankruptcy laws. The allowance as a percent of on-balance sheet accounts receivable decreased in 2006, reflecting lower current and expected write-offs. Bad debt expense can be summarized as follows:
Fiscal year 2007 2006 2005 Private label bad debt expense $40 $17 $21 Visa on-balance sheet bad debt expense 46 — — Visa off-balance sheet bad debt expense 7 22 25 Total bad debt in selling, general and administrative expense $93 $39 $46 Transitional charge-offs1 21 — — Total bad debt expense $114 $39 $46
1In 2007, the one-time transitional charge-offs on the co-branded VISA receivables of $21 are included in finance charges and other, net on our consolidated statement of earnings. In the above disclosure this amount is included in bad debt expense rather than finance charges and other income. These charge-offs represent actual write-offs on the Nordstrom VISA credit card portfolio during the eight-month transitional period, as discussed in Securitization of Accounts Receivable.

22
Operational and marketing expense as a percent of credit volume increased from 2.3% in 2006 and 2005 to 2.4% in 2007 due to additional expense of $13 associated with the introduction of Fashion Rewards in 2007. Without these expenses, operational and marketing expenses as a percent of Credit volume would have decreased. The following table summarizes our accounts receivable and related metrics for the last three fiscal years: February 2, 2008 February 3, 2007 January 28, 2006 Accounts receivable on-balance sheet $1,778 $626 $585 Accounts receivable off-balance sheet - 908 739 Total accounts receivable $1,778 $1,534 $1,324 Assumed ratio of debt financed 80% 80% 80% Estimated funding level $1,422 $1,227 $1,059 Net accounts receivable investment $356 $307 $265 Credit card contribution, net of tax, as a percentage of net
accounts receivable investment 3.2% 16.8% 15.6% Average accounts receivable $1,660 $1,416 $1,264 Net write-offs as a percentage of average receivables 3.5% 2.5% 3.5% Allowance as a percentage of on-balance sheet
accounts receivable 4.1% 2.7% 2.9% Balances over 30 days as a percentage of accounts receivable 2.5% 2.1% 1.7%
The decline in credit card contribution, net of tax, as a percentage of net accounts receivable investment in 2007 was driven by increased bad debt expense, as discussed above. Additionally, as discussed above, in 2007 we had additional expense associated with the introduction of Fashion Rewards. Key growth metrics for the Credit division include:
Growth Rates Fiscal year 2007 2006 Credit volume 14.6% 18.0% Accounts receivable (combined portfolios) 15.9% 15.9% Finance charges and other income 16.0% 17.6%
Growth in the volume and amount of credit transactions typically results in related growth in credit card receivables and, in turn, growth in finance charges and other income. Credit volume and finance charges and other income growth were favorably affected by the 53rd week in 2006. Fourth Quarter Results Net earnings for the fourth quarter of 2007 were $212 compared with $232 in 2006. Total sales for the quarter decreased 4.4% to $2,514 and same-store sales were approximately flat. The 2006 fiscal calendar had 53 weeks compared to our normal operating calendar of 52 weeks; therefore, the fourth quarter of 2006 included an extra week (“the 53rd week”). Excluding the extra week of sales in the fourth quarter of fiscal 2006, total sales were flat in the fourth quarter of fiscal 2007. Our designer apparel, accessories, and women’s shoe merchandise categories experienced the largest same-store sales increases. Designer apparel features luxury and high-fashion products. Handbags led the accessories category while women’s shoes benefited from the sale of comfort boots. Our gross profit rate declined to 37.6% from 38.3% last year. Merchandise margin decreased versus the prior year, driven mainly by higher markdowns. Our selling, general and administrative rate improved 68 basis points from 26.0% to 25.4%. The primary driver was lower incentives tied to company performance, partially offset by higher bad debt expense. Although our overall credit card quality is above average, we experienced higher delinquency and loss rates in the fourth quarter of 2007. However, these were in line with our expectations and, the overall quality of our credit portfolio remains high.

Nordstrom, Inc. and subsidiaries 23
Return on Invested Capital (ROIC) (Non-GAAP financial measure)
We define Return on Invested Capital (ROIC) as follows:
We believe that ROIC is a useful financial measure for investors in evaluating our operating performance for the periods presented. When read in conjunction with our net earnings and total assets and compared to return on assets, it provides investors with a useful tool to evaluate our ongoing operations and our management of assets from period to period. In the past three years, we have incorporated ROIC into our key financial metrics, and since 2005 have used it as an executive incentive measure. Overall performance as measured by ROIC correlates directly to shareholders’ return over the long term. For the 12 fiscal months ended February 2, 2008, our ROIC decreased to 19.4% compared to 20.9% for the 12 months ended February 3, 2007. Our ROIC decreased primarily due to a lower percentage increase in earnings before interest and income taxes compared to the percentage increase in average invested capital. The increase in average invested capital in 2007 compared to 2006 is primarily due to the securitization transaction on May 1, 2007, which brought the entire portfolio of co-branded Nordstrom VISA credit card receivables on-balance sheet as of that date. ROIC, however, is not a measure of financial performance under accounting principles generally accepted in the United States (“GAAP”) and should not be considered a substitute for return on assets, net earnings or total assets as determined in accordance with GAAP and may not be comparable to similarly titled measures reported by other companies. See our ROIC reconciliation to GAAP below. The closest GAAP measure is return on assets, which decreased to 13.1% from 14.0% for the last 12 months ended February 2, 2008 compared to the 12 months ended February 3, 2007.
1Depreciation based upon estimated asset base of capitalized operating leases as described in Note 4 below. 2Based upon the trailing 12-month average. 3Based upon the trailing 12-month average for accounts payable, accrued salaries, wages and related benefits, other current liabilities and income taxes payable. 4Based upon the trailing 12-month average of the monthly asset base which is calculated as the trailing 12 months rent expense multiplied by 8.
Net Operating Profit After Taxes (NOPAT) ROIC =
Average Invested Capital
Numerator = NOPAT Denominator = Average Invested Capital Net earnings Average total assets + Income tax expense - Average non-interest-bearing current liabilities + Interest expense, net - Average deferred property incentives = EBIT + Average estimated asset base of capitalized operating leases + Rent expense = Average invested capital - Estimated depreciation on capitalized operating leases = Net operating profit - Estimated income tax expense
= NOPAT
12 fiscal months ended February 2, 2008 February 3, 2007
Net earnings $715 $678 Add: income tax expense 458 428 Add: interest expense, net 74 43 Earnings before interest and income taxes 1,247 1,149
Add: rent expense 48 48 Less: estimated depreciation on capitalized operating leases1 (26) (26) Net operating profit 1,269 1,171
Estimated income tax expense (497) (453) Net operating profit after taxes $772 $718
Average total assets2 $5,455 $4,854 Less: average non-interest-bearing current liabilities3 (1,506) (1,424) Less: average deferred property incentives2 (359) (358) Add: average estimated asset base of capitalized operating leases4 395 362
Average invested capital $3,985 $3,434
Return on assets 13.1% 14.0%ROIC 19.4% 20.9%

24
LIQUIDITY AND CAPITAL RESOURCES Overall, cash decreased by $45 to $358 as of February 2, 2008. The decrease was driven by returns to our shareholders through dividends and repurchases of our common stock, principal payments on long-term borrowings, and capital expenditures. These decreases were partially offset by proceeds from the issuance of debt, cash provided by operating activities, and proceeds received from the sale of Façonnable.
Operating Activities2007 VS 2006 OPERATING ACTIVITIES Net cash flow from operating activities decreased from $1,142 to $161, a decrease of $981 primarily driven by our conversion of our co-branded Nordstrom VISA credit card receivables into an on-balance sheet securitization program in the first quarter of 2007. As a result of the transaction, we recorded the co-branded Nordstrom VISA credit card receivables on our consolidated balance sheet and eliminated our investment in asset backed securities resulting in a decline of operating cash flow of $881.
2006 VS 2005 OPERATING ACTIVITIES Net cash flow from operating activities increased from $776 to $1,142, an increase of $366 primarily because we reduced our investment in asset backed securities by $350 to fund the repayment of $300 of private label securitization debt. Also, we were successful in expanding our private label card and co-branded Nordstrom VISA credit card programs, which increased our investment in these programs but provided increased earnings.
2008 FORECAST FOR OPERATING ACTIVITIES In 2008, we expect cash flow from operating activities to improve in part due to the non-reoccurrence of the 2007 securitization transaction. In 2007, we moved the co-branded Nordstrom VISA credit card receivables onto our balance sheet as part of the securitization transaction which reduced our 2007 cash flow from operating activities.
Investing Activities Net cash flow used in investing activities increased $52 from $218 in 2006 to $270 in 2007. In 2007, we sold our Façonnable business in exchange for cash of $216, net of transaction costs. These proceeds were offset by investing cash outflows for capital expenditures totaling $501.
In 2005 and 2006, we had two principal types of investing activities: capital expenditures and short-term investments. In 2006, we sold our short-term investments and primarily used the proceeds for common stock repurchases.
CAPITAL EXPENDITURES Our annual capital expenditures ranged from $264 to $501 between 2005 and 2007. The largest components of these expenditures were for new or relocated stores and store remodels.
In 2007 we opened three full-line stores at Natick Collection in Natick, Massachusetts; Twelve Oaks Mall in Novi, Michigan; and Cherry Creek Shopping Center in Denver, Colorado. We also opened one Rack store at Southcenter Square in Tukwila, Washington. Together these openings increased our gross square footage approximately 2.6%. Our total square footage as of February 2, 2008 was 21. In 2007, 51% of our capital expenditures were for new or relocated stores, 24% were for major remodels and 3% were for minor remodels. In addition, 8% of our capital expenditures were for information technology and 14% were for other projects.
Our capital expenditures over the last three years totaled $1,037. With these capital expenditures, we added stores, enhanced existing facilities and improved our information systems. More than 1.1 square feet of retail store space have been added during this period, representing an increase of 5.9% since January 29, 2005.
We expect that our capital expenditures will be approximately $3,000 over the next five years, with $536 planned for 2008. We plan to use 55% of this investment to build new and relocated stores, 27% on remodels, 8% on information technology and 10% for minor remodels and other projects.
Compared to the previous five years, capital expenditures will more than double, with increased spending allocated to new stores. Our current five-year plans outline a 29% increase in square footage, with 32 announced new stores announced through 2012; over half of these stores will be in our Northeast, South and Midwest regions. We believe we have the capacity to address additional capital investments should opportunities arise.
In the second half of 2008, we expect to open four new full-line stores and three Rack stores, and in the first half of 2009, we expect to open three new full-line stores and two Rack stores. We typically incur the majority of our pre-opening costs in the six months prior to opening. In 2008, incremental new store pre-opening costs, which will be recorded in selling, general and administrative expenses, are expected to impact our earnings per diluted share by $0.03.
As of February 2, 2008, we were contractually committed to spend $157 for constructing new stores, remodeling existing stores, and other capital projects.
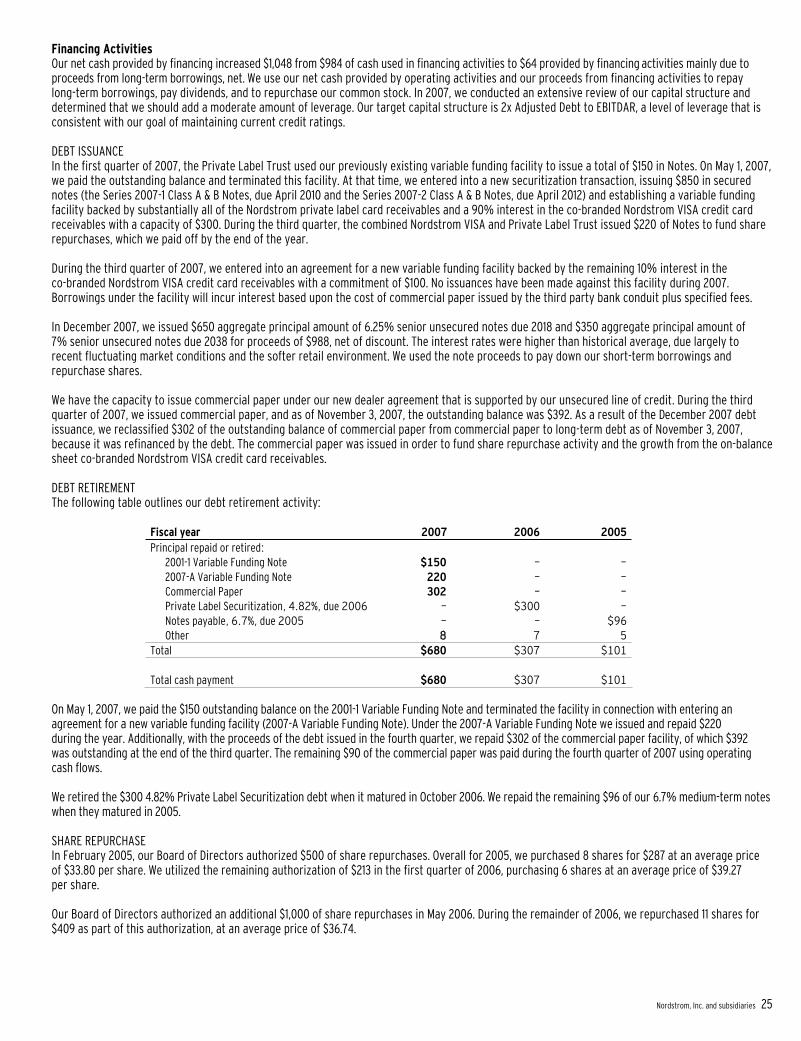
Nordstrom, Inc. and subsidiaries 25
Financing ActivitiesOur net cash provided by financing increased $1,048 from $984 of cash used in financing activities to $64 provided by financing activities mainly due to proceeds from long-term borrowings, net. We use our net cash provided by operating activities and our proceeds from financing activities to repaylong-term borrowings, pay dividends, and to repurchase our common stock. In 2007, we conducted an extensive review of our capital structure and determined that we should add a moderate amount of leverage. Our target capital structure is 2x Adjusted Debt to EBITDAR, a level of leverage that is consistent with our goal of maintaining current credit ratings.
DEBT ISSUANCE In the first quarter of 2007, the Private Label Trust used our previously existing variable funding facility to issue a total of $150 in Notes. On May 1, 2007, we paid the outstanding balance and terminated this facility. At that time, we entered into a new securitization transaction, issuing $850 in secured notes (the Series 2007-1 Class A & B Notes, due April 2010 and the Series 2007-2 Class A & B Notes, due April 2012) and establishing a variable funding facility backed by substantially all of the Nordstrom private label card receivables and a 90% interest in the co-branded Nordstrom VISA credit card receivables with a capacity of $300. During the third quarter, the combined Nordstrom VISA and Private Label Trust issued $220 of Notes to fund share repurchases, which we paid off by the end of the year.
During the third quarter of 2007, we entered into an agreement for a new variable funding facility backed by the remaining 10% interest in theco-branded Nordstrom VISA credit card receivables with a commitment of $100. No issuances have been made against this facility during 2007. Borrowings under the facility will incur interest based upon the cost of commercial paper issued by the third party bank conduit plus specified fees.
In December 2007, we issued $650 aggregate principal amount of 6.25% senior unsecured notes due 2018 and $350 aggregate principal amount of7% senior unsecured notes due 2038 for proceeds of $988, net of discount. The interest rates were higher than historical average, due largely to recent fluctuating market conditions and the softer retail environment. We used the note proceeds to pay down our short-term borrowings and repurchase shares.
We have the capacity to issue commercial paper under our new dealer agreement that is supported by our unsecured line of credit. During the third quarter of 2007, we issued commercial paper, and as of November 3, 2007, the outstanding balance was $392. As a result of the December 2007 debt issuance, we reclassified $302 of the outstanding balance of commercial paper from commercial paper to long-term debt as of November 3, 2007, because it was refinanced by the debt. The commercial paper was issued in order to fund share repurchase activity and the growth from the on-balance sheet co-branded Nordstrom VISA credit card receivables.
DEBT RETIREMENT The following table outlines our debt retirement activity:
Fiscal year 2007 2006 2005 Principal repaid or retired:
2001-1 Variable Funding Note $150 — — 2007-A Variable Funding Note 220 — —
Commercial Paper 302 — — Private Label Securitization, 4.82%, due 2006 — $300 — Notes payable, 6.7%, due 2005 — — $96 Other 8 7 5 Total $680 $307 $101
Total cash payment $680 $307 $101
On May 1, 2007, we paid the $150 outstanding balance on the 2001-1 Variable Funding Note and terminated the facility in connection with entering an agreement for a new variable funding facility (2007-A Variable Funding Note). Under the 2007-A Variable Funding Note we issued and repaid $220 during the year. Additionally, with the proceeds of the debt issued in the fourth quarter, we repaid $302 of the commercial paper facility, of which $392 was outstanding at the end of the third quarter. The remaining $90 of the commercial paper was paid during the fourth quarter of 2007 using operating cash flows.
We retired the $300 4.82% Private Label Securitization debt when it matured in October 2006. We repaid the remaining $96 of our 6.7% medium-term notes when they matured in 2005.
SHARE REPURCHASE In February 2005, our Board of Directors authorized $500 of share repurchases. Overall for 2005, we purchased 8 shares for $287 at an average price of $33.80 per share. We utilized the remaining authorization of $213 in the first quarter of 2006, purchasing 6 shares at an average price of $39.27 per share.
Our Board of Directors authorized an additional $1,000 of share repurchases in May 2006. During the remainder of 2006, we repurchased 11 shares for $409 as part of this authorization, at an average price of $36.74.

26
During the first half of 2007 we repurchased 11 shares for $590 as part of the existing authorization from May 2006, including $300 repurchased as part of an accelerated share repurchase program. In May 2007, we entered into an accelerated share repurchase agreement with Credit Suisse International to repurchase shares of our common stock for an aggregate purchase price of $300. We purchased approximately five million four hundred thousand shares of our common stock on May 23, 2007 at $55.17 per share. Under the terms of the agreement, we received approximately four hundred thousand shares in June 2007 at no additional cost, based on the volume weighted average price of our common stock from June 1, 2007 to June 26, 2007. This resulted in an average price per share of $51.69 for the accelerated share repurchase as a whole.
In August 2007, our Board of Directors authorized a $1,500 share repurchase program. In November 2007, our Board of Directors authorized an increase of $1,000 to the share repurchase program. During the second half of 2007, we purchased 28 shares for $1,137 at an average price of $41.05, using the remaining $1 on the May 2006 authorization and beginning to use the August and November 2007 authorizations. As of February 2, 2008 the unused authorization was $1,364. Repurchases under the program may be made through the end of 2009. The actual amount and timing of future share repurchases will be subject to market conditions and applicable SEC rules.
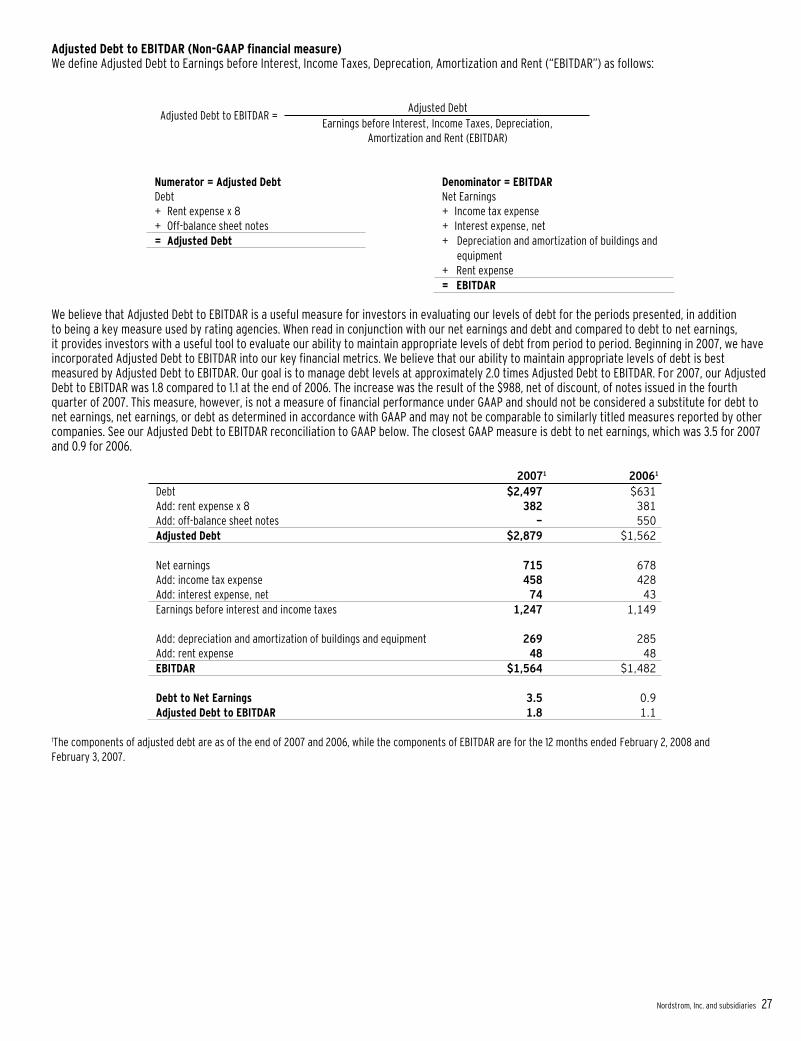
Nordstrom, Inc. and subsidiaries 27
Adjusted Debt to EBITDAR (Non-GAAP financial measure) We define Adjusted Debt to Earnings before Interest, Income Taxes, Deprecation, Amortization and Rent (“EBITDAR”) as follows:
Adjusted Debt Adjusted Debt to EBITDAR =
Earnings before Interest, Income Taxes, Depreciation, Amortization and Rent (EBITDAR)
Numerator = Adjusted Debt Denominator = EBITDAR Debt Net Earnings + Rent expense x 8 + Income tax expense + Off-balance sheet notes + Interest expense, net
= Adjusted Debt + Depreciation and amortization of buildings and equipment
+ Rent expense = EBITDAR
We believe that Adjusted Debt to EBITDAR is a useful measure for investors in evaluating our levels of debt for the periods presented, in addition to being a key measure used by rating agencies. When read in conjunction with our net earnings and debt and compared to debt to net earnings,it provides investors with a useful tool to evaluate our ability to maintain appropriate levels of debt from period to period. Beginning in 2007, we have incorporated Adjusted Debt to EBITDAR into our key financial metrics. We believe that our ability to maintain appropriate levels of debt is best measured by Adjusted Debt to EBITDAR. Our goal is to manage debt levels at approximately 2.0 times Adjusted Debt to EBITDAR. For 2007, our Adjusted Debt to EBITDAR was 1.8 compared to 1.1 at the end of 2006. The increase was the result of the $988, net of discount, of notes issued in the fourth quarter of 2007. This measure, however, is not a measure of financial performance under GAAP and should not be considered a substitute for debt to net earnings, net earnings, or debt as determined in accordance with GAAP and may not be comparable to similarly titled measures reported by other companies. See our Adjusted Debt to EBITDAR reconciliation to GAAP below. The closest GAAP measure is debt to net earnings, which was 3.5 for 2007 and 0.9 for 2006.
20071 20061
Debt $2,497 $631 Add: rent expense x 8 382 381 Add: off-balance sheet notes - 550
Adjusted Debt $2,879 $1,562
Net earnings 715 678 Add: income tax expense 458 428 Add: interest expense, net 74 43 Earnings before interest and income taxes 1,247 1,149
Add: depreciation and amortization of buildings and equipment 269 285 Add: rent expense 48 48
EBITDAR $1,564 $1,482
Debt to Net Earnings 3.5 0.9Adjusted Debt to EBITDAR 1.8 1.1
1The components of adjusted debt are as of the end of 2007 and 2006, while the components of EBITDAR are for the 12 months ended February 2, 2008 and February 3, 2007.

28
Off-Balance Sheet Financing and Securitization of Accounts ReceivablePrior to May 2007, through our wholly owned federal savings bank, Nordstrom fsb, we offered a private label card and two co-branded Nordstrom VISA credit cards. The private label card receivables were held in a trust, which could issue third-party debt that was secured by the private label receivables; the private label program was treated as ‘on-balance sheet.’ Both the receivables, net of bad debt allowance, and any debt were recorded on our consolidated balance sheet. The finance charge income was recorded in finance charges and other, net, and the bad debt expense was recorded in selling, general and administrative expenses.
The co-branded Nordstrom VISA credit card receivables were held in a separate trust (the VISA Trust), which could issue third-party debt that was secured by the co-branded Nordstrom VISA credit card receivables. The co-branded Nordstrom VISA credit card program was treated as ‘off-balance sheet.’ We recorded the fair value of our interest in the VISA Trust on our consolidated balance sheet, gains on the sale of receivables to the VISA Trust and our share of the VISA Trust’s finance income in finance charges and other, net. As of February 3, 2007, the VISA Trust had co-branded Nordstrom VISA credit card receivables with a total face amount of $908 and had outstanding two series of notes held by third parties: $200 of 2002 Class A&B notes that matured in April 2007, and $350 of 2004-2 variable funding notes that were paid in April 2007. In fiscal 2006, the co-branded Nordstrom VISA credit card receivables had an average gross yield of 16.8% and average annual credit losses of 2.8%. The weighted average interest rate on the third-party notes was 5.3%.
On May 1, 2007, we converted the Nordstrom private label cards and co-branded Nordstrom VISA credit card programs into one securitization program, which is accounted for as a secured borrowing (on-balance sheet). When we combined the securitization programs, our investment in asset backed securities, which was accounted for as available-for-sale securities, was eliminated and we reacquired all of the co-branded Nordstrom VISA credit card receivables previously sold to the VISA trust. These reacquired co-branded Nordstrom VISA credit card receivables were recorded at fair value at the date of acquisition. We have transitioned the co-branded Nordstrom VISA credit card receivable portfolio to historical cost, net of bad debt allowances, on our consolidated balance sheet as of February 2, 2008.
On May 1, 2007, the trust issued securities that are backed by substantially all of the Nordstrom private label card receivables and 90% of theco-branded Nordstrom VISA credit card receivables. Under the securitization, the receivables are transferred to a third-party trust on a daily basis. The balance of the receivables transferred to the trust fluctuates as new receivables are generated and old receivables are retired (through payments received, charge-offs or credits for merchandise returns). These combined receivables back the Series 2007-1 Notes, the Series 2007-2 Notes and an unused variable funding note.
Our earnings per diluted share were reduced by $0.06 for one-time transitional write-offs associated with bringing the co-branded VISA receivables on balance sheet.
Interest Rate SwapsTo manage our interest rate risk, we entered into an interest rate swap agreement in 2003, which had a $250 notional amount expiring in January 2009. Under the agreement, we receive a fixed rate of 5.63% and pay a variable rate based on LIBOR plus a margin of 2.3% set at six-month intervals (5.32% at February 2, 2008). The interest rate swap agreement had a fair value of $1 and $(9) at the end of 2007 and 2006.
Contractual Obligations The following table summarizes our contractual obligations and the expected effect on our liquidity and cash flows as of February 2, 2008. We expect to fund these commitments primarily with operating cash flows generated in the normal course of business and credit available to us under existing and potential future facilities.
Total Less than 1 year 1–3 years 3–5 years
More than 5 years
Long-term debt $4,260 $ 396 $612 $710 $2,542 Capital lease obligations 23 3 5 4 11 Other long-term liabilities 201 1 37 22 141 Operating leases 578 69 138 111 260 Purchase obligations 1,382 1,227 154 1 - Total $6,444 $1,696 $946 $848 $2,954
Included in the required debt repayments disclosed above are estimated total interest payments of approximately $1,779 as of February 2, 2008, payable over the remaining life of the debts.
Other long-term liabilities consist of workers’ compensation and general liability insurance reserves, postretirement benefits and Financial Accounting Standards Board (FASB) Interpretation No. 48, Accounting for Uncertainty in Income Taxes (“FIN 48”) reserves. The repayment amounts presented above were determined based on historical payment trends. We expect to pay $1 of uncertain tax positions under FIN 48 in the next 12 months and include this balance in other long-term liabilities as due in less than 1 year. We are unable to reasonably estimate the timing of future cash flows for the remaining balance and have excluded this in the table above. Other long-term liabilities not requiring cash payments, such as deferred property incentives and deferred revenue, were excluded from the table above.

Nordstrom, Inc. and subsidiaries 29
Purchase obligations primarily consist of purchase orders for unreceived goods or services, our Minimum Purchase Agreement with the Façonnable U.S. wholesale business, and capital expenditure commitments.
This table also excludes the short-term liabilities, other than the current portion of long-term debt, disclosed on our 2007 consolidated balance sheet, as the amounts recorded for these items will be paid in the next year.
Credit Capacity and Commitments The following table summarizes our amount of commitment expiration per period:
Total Amounts Committed
Less than 1 year 1–3 years 3–5 years
More than 5 years
Other commercial commitments $300 variable funding note - — — — — $100 variable funding note - - — — — $500 commercial paper - - — — — Standby letters of credit - - — — — Import letters of credit $8 $8 — — — Total $8 $8 — — —
During the first quarter of 2007, we entered into an agreement for a new variable funding facility (2007-A Variable Funding Note) backed by substantially all of the Nordstrom private label card receivables and 90% interest in the co-branded Nordstrom VISA credit card receivables with a commitment of $300. Borrowings under the facility incur interest based upon the cost of commercial paper issued by the third party bank conduit plus specified fees. During the third quarter of 2007, we used this facility to issue $220 in Notes and paid the outstanding balance during the third and fourth quarters of 2007. We pay a commitment fee for the note based on the size of the commitment and the amount of borrowings outstanding. Commitment fee rates decrease if more than $50 is outstanding on the facility. The facility can be cancelled or not renewed if our debt ratings fall below Standard and Poor’s BB+ rating or Moody’s Ba1 rating. Our current rating by Standard and Poor’s is A-, four grades above BB+, and by Moody’s is Baa1, three grades above Ba1. At year-end, we had no outstanding balance on this variable funding note.
During the third quarter of 2007, we entered into an agreement for an additional variable funding facility backed by the remaining 10% interest inthe co-branded Nordstrom VISA credit card receivables with a commitment of $100. As of February 2, 2008, no issuances have been made againstthis facility. Borrowings under the facility will incur interest based upon the cost of commercial paper issued by the third party bank conduit plus specified fees.
During the third quarter of 2007, we entered into a new commercial paper dealer agreement, supported by our unsecured line of credit. Under this commercial paper program, we may issue commercial paper in an aggregate amount outstanding at any particular time not to exceed $500. This agreement allows us to use the proceeds to fund share repurchases as well as operating cash requirements. Under the terms of the commercial paper agreement, we pay a rate of interest based on, among other factors, the maturity of the issuance and market conditions. The issuance of commercial paper has the effect, while it is outstanding, of reducing our borrowing capacity under the line of credit by an amount equal to the principal amount of the commercial paper. We had no commercial paper borrowings outstanding at February 2, 2008.
We have an automatic shelf registration statement on file with the Securities and Exchange Commission. Under the terms of the registration statement, and subject to the filing of certain post-effective amendments, we are authorized to issue an unlimited principal amount of debt securities.
Debt Ratings The following table shows our credit ratings at the date of this report:
Credit Ratings Moody’s Standard and Poor’s
Senior unsecured debt Baa1 A- Commercial paper P-2 A-2 Outlook Stable Stable
These ratings could change depending on our performance and other factors. Our outstanding debt is not subject to termination or interest rate adjustments based on changes in our credit ratings.

30
Dividends In 2007, we paid dividends of $0.54 per share, the eleventh consecutive year that our annual dividends increased. We paid dividends of $0.42 and $0.32 in 2006 and 2005. In determining the amount of dividends to pay, we analyze our dividend payout ratio and dividend yield, and balance the dividend payment with our operating performance and capital resources. We target a dividend payout ratio of approximately 20% to 25% of net income, an increase from our prior target of 18% to 20%. For the dividend yield, which is calculated as our dividends per share divided by our stock price, we target a 1.3% long-term yield. While we plan to increase dividends over time, we will balance future increases with our operating performance and available capital resources.
In February 2008, we declared a quarterly dividend of $0.16 per share, increased from $0.135 per share in the prior year.
LiquidityWe maintain a level of liquidity sufficient to allow us to cover our seasonal cash needs and to minimize our need for short-term borrowings. We believe that our operating cash flows, existing cash and available credit facilities are sufficient to finance our cash requirements for the next 12 months.
Over the long term, we manage our cash and capital structure to maximize shareholder return, strengthen our financial position and maintain flexibility for future strategic initiatives. We continuously assess our debt and leverage levels, capital expenditure requirements, principal debt payments, dividend payouts, potential share repurchases and future investments or acquisitions. We believe our operating cash flows, existingcash and available credit facilities, as well as any potential future borrowing facilities, will be sufficient to fund these scheduled future paymentsand potential long-term initiatives.
CRITICAL ACCOUNTING POLICIES The preparation of our financial statements requires that we make estimates and judgments that affect the reported amounts of assets, liabilities, revenues and expenses, and disclosure of contingent assets and liabilities. We base our estimates on historical experience and on other assumptions that we believe to be reasonable under the circumstances. Actual results may differ from these estimates. The following discussion highlights the policies we feel are critical and should be read in conjunction with the Notes to the Consolidated Financial Statements.
InventoryOur merchandise inventories are primarily stated at the lower of cost or market using the retail inventory method. Under the retail method, the valuation of inventories and the resulting gross margins are determined by applying a calculated cost-to-retail ratio to the retail value of ending inventory. To determine if the retail value of our inventory should be marked down, we consider current and anticipated demand, customer preferences, age of the merchandise and fashion trends. As our inventory retail value is adjusted regularly to reflect market conditions, our inventory is valued at the lower of cost or market. Inherent in the retail inventory method are certain significant management judgments that may significantly affect the ending inventory valuation as well as gross margin. Among others, the significant estimates used in inventory valuation are obsolescence and shrinkage.
We reserve for obsolescence based on historical trends and specific identification. Shrinkage is estimated as a percentage of net sales for theperiod from the most recent semi-annual inventory count based on historical shrinkage results. Therefore, our obsolescence reserve and shrinkage percentage contain uncertainties as the calculations require management to make assumptions and to apply judgment regarding a number of factors, including market conditions, the selling environment, historical results and current inventory trends.
Management does not believe that the assumptions used in these estimates will change significantly based on prior experience. In prior years, we have made no material changes to our estimates included in the calculations of the obsolescence and shrinkage reserves. A 10% change in the obsolescence reserve would have impacted net income by approximately $2 for the year ended February 2, 2008. We do not believe a 10% change in our shrink percentage would have a material effect on our net earnings.
Revenue RecognitionWe recognize revenues net of estimated returns and we exclude sales taxes. Our retail stores record revenue at the point of sale. Our catalog and online sales include shipping revenue and are recorded upon estimated delivery to the customer. As part of the normal sales cycle, we receive customer merchandise returns. To recognize the financial impact of sales returns, we estimate the amount of goods that will be returned and reduce sales and cost of sales accordingly. Inherent in establishing and maintaining a sales return reserve are management judgments around customer return patterns and return rates. We utilize historical return patterns to estimate our expected returns and, in prior years, we have made no material changes to our estimates included in the sales return reserve.
Although we believe we have sufficient current and historical knowledge to record reasonable estimates of sales returns, there is a possibility that actual returns could differ from recorded amounts. A 10% change in the sales return reserve would have had a $3 impact on our net earnings for the year ended February 2, 2008.

Nordstrom, Inc. and subsidiaries 31
Allowance for Doubtful Accounts Our allowance for doubtful accounts represents our best estimate of the losses inherent in our Nordstrom private label card and co-branded Nordstrom VISA credit card receivables as of the balance sheet date. We evaluate the collectibility of our accounts receivable based on several factors, including historical trends of aging of accounts, write-off experience and expectations of future performance. We recognize finance charges on delinquent accounts until the account is written off. Delinquent accounts are written off when they are determined to be uncollectible, usually after the passageof 151 days without receiving a full scheduled monthly payment. Accounts are written off sooner in the event of customer bankruptcy or other circumstances that make further collection unlikely. Management believes the allowance for doubtful accounts is adequate to cover anticipated losses in our credit card accounts receivable under current conditions; however, significant deterioration in any of the factors mentioned above or in general economic conditions could materially change these expectations. In prior years, we have not made material changes to our estimates involved in the allowance for doubtful accounts. A 10% change in our allowance for doubtful accounts would have affected net earnings by $4 for the fiscal year ended February 2, 2008.
Income Taxes In accordance with Statement of Financial Accounting Standards No. 109, “Accounting for Income Taxes,” we calculate income taxes using the assetand liability approach. We recognize deferred tax assets and liabilities based on the difference between the financial statement carrying amounts and respective tax bases of assets and liabilities. Deferred tax assets and liabilities are measured using enacted tax rates currently in effect for the years in which we expect those temporary differences to reverse.
Inherent in the measurement of deferred balances are certain judgments and interpretations of enacted tax law and published guidance. Our assumptions have been materially accurate in the past. We continuously monitor any changes in enacted tax rates in the jurisdictions in which we have a filing obligation and adjust our deferred tax balances accordingly. We regularly evaluate whether our deferred tax assets will more likely than not be realized in the foreseeable future and record a valuation allowance when appropriate.
In accordance with FASB Interpretation No. 48, “Accounting for Uncertainty in Income Taxes,” we regularly evaluate the likelihood of recognizing the benefit for income tax positions we have taken in various federal, state and foreign filings by considering all relevant facts, circumstances and information available. For those benefits we believe more likely than not will be sustained, we recognize the largest amount we believe is cumulatively greater than 50% likely to be realized. Our assumptions for these benefits have been materially accurate in the past. A liability for the unrecognized portion of the income tax benefit will carry forward until the effective settlement of the issue on audit, the lapse in the statute of limitations to consider the issue, or a favorable change in law.
RECENT ACCOUNTING PRONOUNCEMENTS In September 2006, the FASB issued Statement of Financial Accounting Standards No. 157, Fair Value Measurements (“SFAS 157”). SFAS 157 defines fair value, establishes a framework for measuring fair value, and expands disclosures about fair value measurements. In February 2008, the FASB issued FASB Staff Position No. FAS 157-1 (“FSP FAS 157-1”) and FASB Staff Position No. FAS 157-2, (“FSP FAS 157-2”), affecting implementation of SFAS 157. FSP FAS 157-1 excludes FASB Statement No. 13, Accounting for Leases (“SFAS 13”), and other accounting pronouncements that address fair value measurements under SFAS 13, from the scope of SFAS 157. FSP FAS 157-2 delays the effective date of SFAS 157 for nonfinancial assets and nonfinancial liabilities, except for items that are recognized or disclosed at fair value on a recurring basis, to fiscal years beginning after November 15, 2008. For all other items, SFAS 157 was effective for Nordstrom as of February 3, 2008. We have adopted SFAS 157 as amended by FSP FAS 157-1 and FSP FAS 157-2 as of February 3, 2008. This adoption will not have a material effect on our consolidated financial statements.
In February 2007, the FASB issued Statement of Financial Accounting Standards No. 159, The Fair Value Option for Financial Assets and Financial Liabilities(“SFAS 159”). SFAS 159 permits entities to choose to measure many financial instruments and certain other items at fair value. SFAS 159 was effective for Nordstrom as of February 3, 2008. We did not apply the fair value option to any of our outstanding instruments; therefore, SFAS 159 will have no effect on our consolidated financial statements.
In December 2007, the FASB issued Statement of Financial Accounting Standards No. 141 (Revised 2007), Business Combinations (“SFAS 141(R)”). SFAS 141(R) will significantly change the accounting for business combinations. Under SFAS 141(R), an acquiring entity will be required to recognize all the assets acquired and liabilities assumed in a transaction at the acquisition-date fair value with limited exceptions. SFAS 141(R) will change the accounting treatment for certain specific acquisition-related items, including expensing acquisition-related costs as incurred, valuing noncontrolling interests (minority interests) at fair value at the acquisition date, and expensing restructuring costs associated with an acquired business. SFAS 141(R) also includes a substantial number of new disclosure requirements. SFAS 141(R) is to be applied prospectively to business combinations for which the acquisition date is on or after January 1, 2009. Early adoption is not permitted. Generally, the effect of SFAS 141(R) will depend on future acquisitions.
Also in December 2007, the FASB issued Statement of Financial Accounting Standards No. 160, Noncontrolling Interests in Consolidated Financial Statements – an amendment of ARB No. 51 (“SFAS 160”). SFAS 160 establishes new accounting and reporting standards for noncontrolling interest (minority interest) in asubsidiary, provides guidance on the accounting for and reporting of the deconsolidation of a subsidiary, and increases transparency through expanded disclosures. Specifically, SFAS 160 requires the recognition of minority interest as equity in the consolidated financial statements and separate from the parent company’s equity. It also requires consolidated net earnings in the consolidated statement of earnings to include the amount of net earnings attributable to minority interest. This statement will be effective for Nordstrom as of the beginning of fiscal year 2009. Early adoption is not permitted. We are presently evaluating the impact of the adoption of SFAS 160 and believe there will be no material impact on our consolidated financial statements.

32
Item 7A. Quantitative and Qualitative Disclosures About Market Risk. (Dollars in millions)
INTEREST RATE RISK Our primary exposure to market risk is through changes in interest rates. In seeking to minimize risk, we manage exposure through our regular operating and financing activities. We do not use financial instruments for trading or other speculative purposes and are not party to any leveraged financial instruments.
We have both credit card receivables that generate interest income and debt obligations which we pay fixed and variable interest expense. We manage our net interest rate exposure through our mix of fixed and variable rate borrowings. A portion of our credit card receivables maintains a fixed interest rate. Additionally, a portion of this portfolio is used as convenience by our customers and revolves monthly. The annualized effect of a one-percentage-point change in interest rates would not materially affect net earnings.
Additionally, short-term borrowing and investing activities generally bear interest at variable rates, but because they have maturities of three months or less, we believe that the risk of material loss is low, and that the carrying amount approximates fair value.
The table below presents information about our debt obligations and interest rate swaps that are sensitive to changes in interest rates at February 2, 2008. For debt obligations, the table presents principal amounts, at book value, by maturity date, and related weighted average interest rates. For interest rate swaps, the table presents notional amounts and weighted average interest rates by expected (contractual) maturity dates. Notional amounts are the predetermined dollar principal on which the exchanged interest payments are based.
Dollars in millions 2008 2009 2010 2011 2012 Thereafter
Total at February 2, 2008
Fair value at February 2, 2008
Long-term debt Fixed $260 $23 $356 $6 $6 $1,345 $1,996 $2,038 Avg. int. rate 5.7% 6.5% 5.0% 8.8% 8.5% 6.7% 6.3% Variable — — — — $500 — $500 $475 Avg. int. rate — — — — 3.2% — 3.2% Interest rate swap Fixed to variable $250 — — — — — $250 $1 Avg. pay rate 5.32% — — — — — 5.32% Avg. receive rate 5.63% — — — — — 5.63%
FOREIGN CURRENCY EXCHANGE RISK The majority of our revenue, expense and capital expenditures are transacted in U.S. dollars. However, we periodically enter into foreign currency purchase orders denominated in Euros for apparel, accessories and shoes. We use forward contracts to hedge against fluctuations in foreign currency prices. We do not believe the fair value of our outstanding forward contracts at February 2, 2008 to be material.
Nordstrom, Inc. and subsidiaries 33
Item 8. Financial Statements and Supplementary Data.
MANAGEMENT RESPONSIBILITY FOR FINANCIAL INFORMATION We are responsible for the preparation, integrity and fair presentation of our financial statements and the other information that appears in this annual report on Form 10-K. The financial statements have been prepared in accordance with accounting principles generally accepted in the United States and include estimates based on our best judgment.
We maintain a comprehensive system of internal controls and procedures designed to provide reasonable assurance, at an appropriate cost-benefit relationship, that our financial information is accurate and reliable, our assets are safeguarded and our transactions are executed in accordance with established procedures.
Deloitte and Touche LLP, an independent registered public accounting firm, is retained to audit Nordstrom’s consolidated financial statements and management’s assessment of the effectiveness of the Company’s internal control over financial reporting. Its accompanying reports are based on audits conducted in accordance with the standards of the Public Company Accounting Oversight Board (United States).
The Audit Committee, which is comprised of five independent directors, meets regularly with our management, our internal auditors and the independent registered public accounting firm to ensure that each is properly fulfilling its responsibilities. The Committee oversees our systemsof internal control, accounting practices, financial reporting and audits to ensure their quality, integrity and objectivity are sufficient to protect shareholders’ investments.
MANAGEMENT’S REPORT ON INTERNAL CONTROL OVER FINANCIAL REPORTING Our management is responsible for establishing and maintaining adequate internal control over financial reporting, as is defined in the Securities Exchange Act of 1934. These internal controls are designed to provide reasonable assurance that the reported financial information is presented fairly, that disclosures are adequate and that the judgments inherent in the preparation of financial statements are reasonable. There are inherent limitations in the effectiveness of any system of internal control, including the possibility of human error and overriding of controls. Consequently, an effective internal control system can only provide reasonable, not absolute, assurance, with respect to reporting financial information.
Management conducted an evaluation of the effectiveness of our internal control over financial reporting based on the framework and criteria established in Internal Control — Integrated Framework, issued by the Committee of Sponsoring Organizations of the Treadway Commission. Based on this evaluation, management concluded that the Company’s internal control over financial reporting was effective as of February 2, 2008.
/s/ Michael G. Koppel Michael G. Koppel Executive Vice President and Chief Financial Officer
/s/ Blake W. Nordstrom Blake W. Nordstrom President
34
REPORT OF INDEPENDENT REGISTERED PUBLIC ACCOUNTING FIRM
To the Board of Directors and Shareholders of Nordstrom, Inc.:
We have audited the internal control over financial reporting of Nordstrom, Inc. and subsidiaries (the “Company”) as of February 2, 2008, based on criteria established in Internal Control — Integrated Framework, issued by the Committee of Sponsoring Organizations of the Treadway Commission. The Company’s management is responsible for maintaining effective internal control over financial reporting and for its assessment of the effectiveness of internal control over financial reporting included in the accompanying Management’s Report on Internal Control Over Financial Reporting. Our responsibility is to express an opinion on the Company’s internal control over financial reporting based on our audit.
We conducted our audit in accordance with the standards of the Public Company Accounting Oversight Board (United States). Those standards require that we plan and perform the audit to obtain reasonable assurance about whether effective internal control over financial reporting was maintained in all material respects. Our audit included obtaining an understanding of internal control over financial reporting, assessing the risk that a material weakness exists, testing and evaluating the design and operating effectiveness of internal control based on the assessed risk, and performing such other procedures as we considered necessary in the circumstances. We believe that our audit provides a reasonable basis forour opinion.
A company’s internal control over financial reporting is a process designed by, or under the supervision of, the company’s principal executive and principal financial officers, or persons performing similar functions, and effected by the company’s board of directors, management, and other personnel to provide reasonable assurance regarding the reliability of financial reporting and the preparation of financial statements for external purposes in accordance with accounting principles generally accepted in the United States of America. A company’s internal control over financial reporting includes those policies and procedures that (1) pertain to the maintenance of records that, in reasonable detail, accurately and fairly reflect the transactions and dispositions of the assets of the company; (2) provide reasonable assurance that transactions are recorded as necessary to permit preparation of financial statements in accordance with generally accepted accounting principles, and that receipts and expenditures of the company are being made only in accordance with authorizations of management and directors of the company; and (3) provide reasonable assurance regarding prevention or timely detection of unauthorized acquisition, use, or disposition of the company’s assets that could have a material effect on the financial statements.
Because of the inherent limitations of internal control over financial reporting, including the possibility of collusion or improper management override of controls, material misstatements due to error or fraud may not be prevented or detected on a timely basis. Also, projections of any evaluation of the effectiveness of the internal control over financial reporting to future periods are subject to the risk that the controls maybecome inadequate because of changes in conditions, or that the degree of compliance with the policies or procedures may deteriorate.
In our opinion, the Company maintained, in all material respects, effective internal control over financial reporting as of February 2, 2008, based on the criteria established in Internal Control — Integrated Framework issued by the Committee of Sponsoring Organizations of the Treadway Commission.
We have also audited, in accordance with the standards of the Public Company Accounting Oversight Board (United States), the consolidated financial statements and financial statement schedule as of and for the year ended February 2, 2008, of the Company, and our report dated March 20, 2008, expressed an unqualified opinion on those financial statements.
/s/ Deloitte & Touche LLP Seattle, Washington March 20, 2008

Nordstrom, Inc. and subsidiaries 35
REPORT OF INDEPENDENT REGISTERED PUBLIC ACCOUNTING FIRM
To the Board of Directors and Shareholders of Nordstrom, Inc.:
We have audited the accompanying consolidated balance sheets of Nordstrom, Inc. and subsidiaries (the “Company”) as of February 2, 2008 and February 3, 2007, and the related consolidated statements of earnings, shareholders’ equity, and cash flows for each of the three fiscal years in the period ended February 2, 2008. Our audits also included the financial statement schedule listed in the index at Item 15(a)2. These consolidated financial statements and financial statement schedule are the responsibility of the Company’s management. Our responsibility is to express an opinion on these consolidated financial statements and financial statement schedule based on our audits.
We conducted our audits in accordance with the standards of the Public Company Accounting Oversight Board (United States). Those standards require that we plan and perform the audit to obtain reasonable assurance about whether the financial statements are free of materialmisstatement. An audit includes examining, on a test basis, evidence supporting the amounts and disclosures in the financial statements. An audit also includes assessing the accounting principles used and significant estimates made by management, as well as evaluating the overall financial statement presentation. We believe that our audits provide a reasonable basis for our opinion.
In our opinion, such consolidated financial statements present fairly, in all material respects, the financial position of Nordstrom, Inc. and subsidiaries as of February 2, 2008 and February 3, 2007, and the results of their operations and cash flows for each of the three fiscal years in the period ended February 2, 2008, in conformity with accounting principles generally accepted in the United States of America. Also, in our opinion, such financial statement schedule, when considered in relation to the basic consolidated financial statements taken as a whole, presents fairly, in all material respects, the information set forth therein.
As discussed in Note 1 to the consolidated financial statements, on January 29, 2006, the Company changed its method of accounting for stock-based compensation upon adoption of Statement of Financial Accounting Standards No. 123(R), Share-Based Payment.
We have also audited, in accordance with the standards of the Public Company Accounting Oversight Board (United States), the Company’s internal control over financial reporting as of February 2, 2008, based on the criteria established in Internal Control – Integrated Framework issued by the Committee of Sponsoring Organizations of the Treadway Commission, and our report dated March 20, 2008, expressed an unqualified opinion on the Company’s internal control over financial reporting.
/s/ Deloitte & Touche LLP Seattle, Washington March 20, 2008
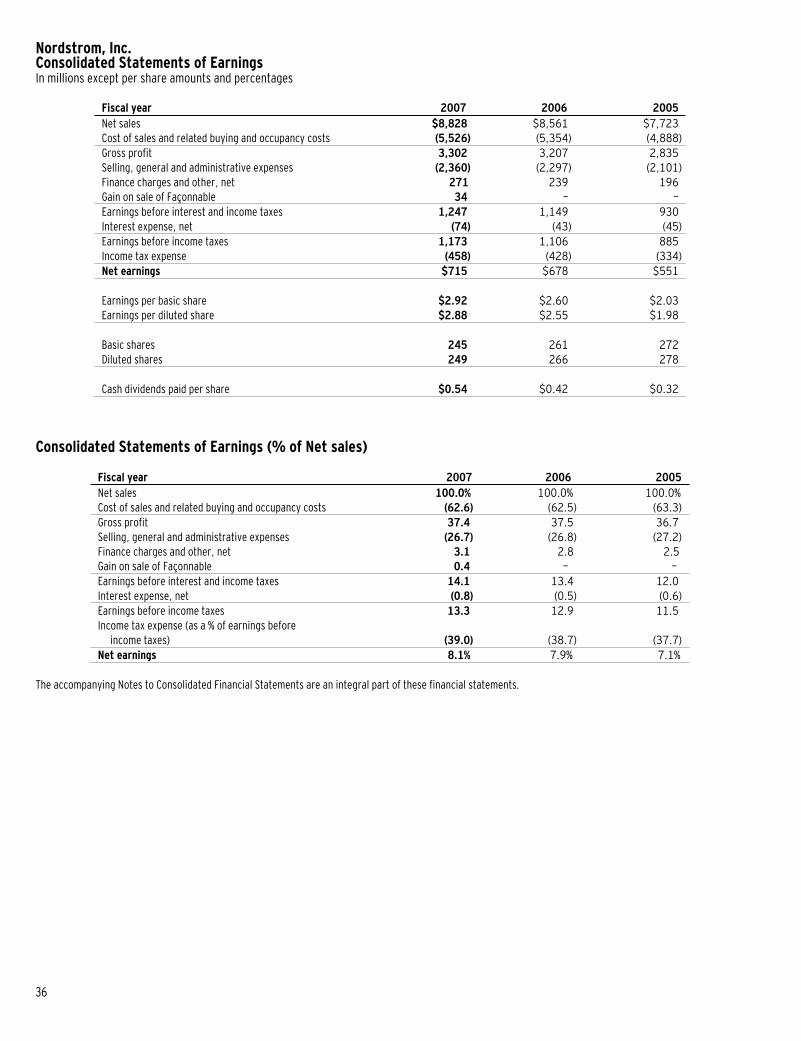
36
Nordstrom, Inc. Consolidated Statements of Earnings In millions except per share amounts and percentages
Fiscal year 2007 2006 2005 Net sales $8,828 $8,561 $7,723 Cost of sales and related buying and occupancy costs (5,526) (5,354) (4,888)Gross profit 3,302 3,207 2,835 Selling, general and administrative expenses (2,360) (2,297) (2,101)Finance charges and other, net 271 239 196 Gain on sale of Façonnable 34 — — Earnings before interest and income taxes 1,247 1,149 930 Interest expense, net (74) (43) (45)Earnings before income taxes 1,173 1,106 885 Income tax expense (458) (428) (334)Net earnings $715 $678 $551
Earnings per basic share $2.92 $2.60 $2.03 Earnings per diluted share $2.88 $2.55 $1.98
Basic shares 245 261 272 Diluted shares 249 266 278
Cash dividends paid per share $0.54 $0.42 $0.32
Consolidated Statements of Earnings (% of Net sales)
Fiscal year 2007 2006 2005 Net sales 100.0% 100.0% 100.0% Cost of sales and related buying and occupancy costs (62.6) (62.5) (63.3) Gross profit 37.4 37.5 36.7 Selling, general and administrative expenses (26.7) (26.8) (27.2) Finance charges and other, net 3.1 2.8 2.5 Gain on sale of Façonnable 0.4 — — Earnings before interest and income taxes 14.1 13.4 12.0 Interest expense, net (0.8) (0.5) (0.6) Earnings before income taxes 13.3 12.9 11.5 Income tax expense (as a % of earnings before
income taxes) (39.0) (38.7) (37.7)Net earnings 8.1% 7.9% 7.1%
The accompanying Notes to Consolidated Financial Statements are an integral part of these financial statements.

Nordstrom, Inc. and subsidiaries 37
Nordstrom, Inc. Consolidated Balance Sheets In millions
February 2, 2008 February 3, 2007 AssetsCurrent assets: Cash and cash equivalents $358 $403 Accounts receivable, net 1,788 684 Investment in asset backed securities — 428 Merchandise inventories 956 997 Current deferred tax assets, net 181 169 Prepaid expenses and other 78 61Total current assets 3,361 2,742Land, buildings and equipment, net 1,983 1,757Goodwill 53 52Acquired tradename — 84Other assets 203 187Total assets $5,600 $4,822
Liabilities and Shareholders’ Equity Current liabilities: Accounts payable $556 $577 Accrued salaries, wages and related benefits 268 340 Other current liabilities 492 433 Income taxes payable 58 76 Current portion of long-term debt 261 7Total current liabilities 1,635 1,433Long-term debt, net 2,236 624Deferred property incentives, net 369 356Other liabilities 245 240Commitments and contingent liabilities Shareholders’ equity: Common stock, no par value: 1,000 shares authorized; 221 and 257 shares issued and outstanding 936 827 Retained earnings 201 1,351 Accumulated other comprehensive loss (22) (9)Total shareholders’ equity 1,115 2,169Total liabilities and shareholders’ equity $5,600 $4,822
The accompanying Notes to Consolidated Financial Statements are an integral part of these financial statements.

38
Nordstrom, Inc. Consolidated Statements of Shareholders’ Equity In millions except per share amounts Accumulated Other Common Stock Retained Comprehensive Shares Amount Earnings Earnings (Loss) TotalBalance at January 29, 2005 271 $553 $1,227 $9 $1,789Net earnings — — 551 — 551Other comprehensive earnings (loss):
Foreign currency translation adjustment — — — (2) (2)Unrecognized loss on postretirement benefit
obligations, net of tax benefit of $5 — — — (7) (7) Fair value adjustment to investment in asset backed securities, net of tax of $(2) — — — 3 3Comprehensive net earnings — — — — 545Cash dividends paid ($0.32 per share) — — (87) — (87)Issuance of common stock for: Stock option plans 6 113 — — 113 Employee stock purchase plan 1 17 — — 17
Other — 3 — — 3Repurchase of common stock (8) — (287) — (287)Balance at January 28, 2006 270 686 1,404 3 2,093 Net earnings — — 678 — 678Other comprehensive earnings (loss): Foreign currency translation adjustment — — — 1 1 Unrecognized gain on postretirement benefit obligations net of tax of $(2), prior to adoption of SFAS 158 — — — 3 3 Fair value adjustment to investment in asset backed securities, net of tax of $2 — — — (3) (3)Comprehensive net earnings — — — — 679Adjustment to initially apply SFAS 158, net of tax of $8 — — — (13) (13)Cash dividends paid ($0.42 per share) — — (110) — (110)Issuance of common stock for: Stock option plans 4 94 — — 94 Employee stock purchase plan — 17 — — 17
Other — 1 — — 1Stock-based compensation — 29 — — 29Repurchase of common stock (17) — (621) — (621)Balance at February 3, 2007 257 827 1,351 (9) 2,169 Cumulative effect adjustment to adopt FIN 48 — — (3) — (3)Adjusted Beginning Balance at February 3, 2007 257 827 1,348 (9) 2,166Net earnings — — 715 — 715Other comprehensive earnings (loss): Foreign currency translation adjustment — — — (15) (15) Postretirement plan adjustments, net of tax of ($5) — — — 7 7 Fair value adjustment to investment in asset backed securities, net of tax of $3 — — — (5) (5)Comprehensive net earnings 702Cash dividends paid ($0.54 per share) — — (134) — (134)Issuance of common stock for: Stock option plans 2 61 — — 61 Employee stock purchase plan 1 17 — — 17
Other — 5 — — 5Stock-based compensation — 26 — — 26Repurchase of common stock (39) — (1,728) — (1,728)Balance at February 2, 2008 221 $936 $201 $(22) $1,115
The accompanying Notes to Consolidated Financial Statements are an integral part of these financial statements.
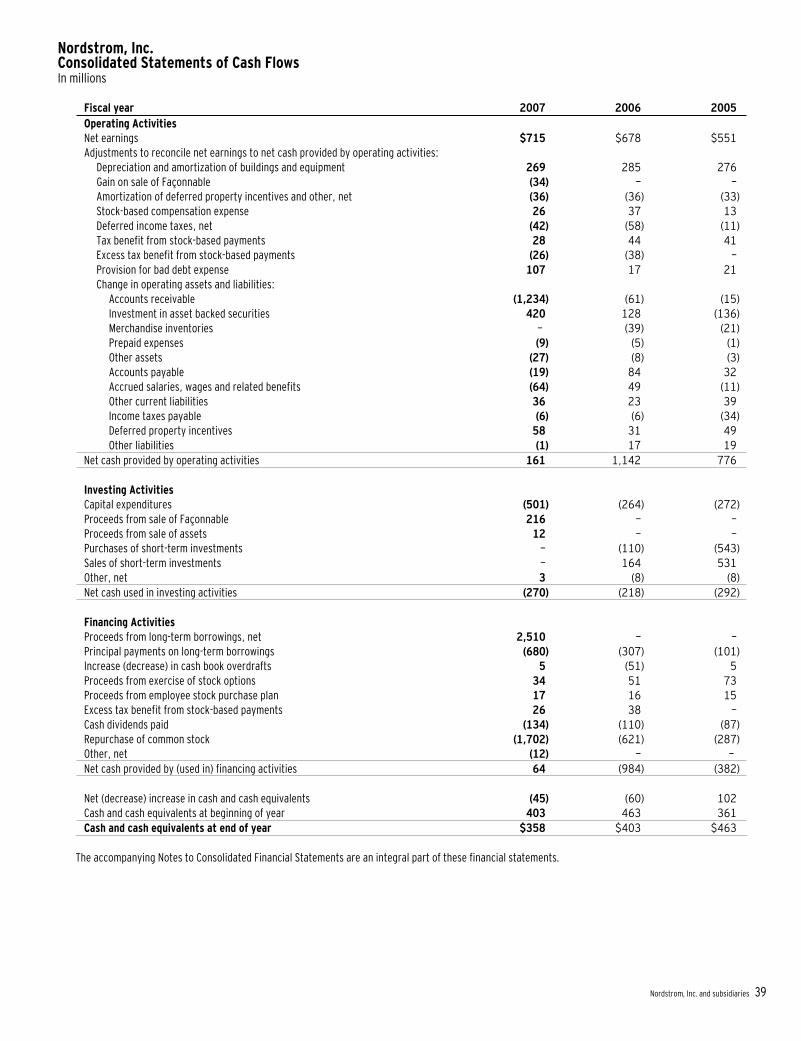
Nordstrom, Inc. and subsidiaries 39
Nordstrom, Inc. Consolidated Statements of Cash Flows In millions
Fiscal year 2007 2006 2005 Operating Activities Net earnings $715 $678 $551 Adjustments to reconcile net earnings to net cash provided by operating activities: Depreciation and amortization of buildings and equipment 269 285 276 Gain on sale of Façonnable (34) — — Amortization of deferred property incentives and other, net (36) (36) (33)
Stock-based compensation expense 26 37 13 Deferred income taxes, net (42) (58) (11) Tax benefit from stock-based payments 28 44 41 Excess tax benefit from stock-based payments (26) (38) — Provision for bad debt expense 107 17 21 Change in operating assets and liabilities: Accounts receivable (1,234) (61) (15) Investment in asset backed securities 420 128 (136) Merchandise inventories — (39) (21) Prepaid expenses (9) (5) (1) Other assets (27) (8) (3) Accounts payable (19) 84 32 Accrued salaries, wages and related benefits (64) 49 (11) Other current liabilities 36 23 39 Income taxes payable (6) (6) (34) Deferred property incentives 58 31 49 Other liabilities (1) 17 19 Net cash provided by operating activities 161 1,142 776
Investing Activities Capital expenditures (501) (264) (272) Proceeds from sale of Façonnable 216 — — Proceeds from sale of assets 12 — — Purchases of short-term investments — (110) (543) Sales of short-term investments — 164 531 Other, net 3 (8) (8) Net cash used in investing activities (270) (218) (292)
Financing Activities Proceeds from long-term borrowings, net 2,510 — — Principal payments on long-term borrowings (680) (307) (101) Increase (decrease) in cash book overdrafts 5 (51) 5 Proceeds from exercise of stock options 34 51 73 Proceeds from employee stock purchase plan 17 16 15 Excess tax benefit from stock-based payments 26 38 — Cash dividends paid (134) (110) (87) Repurchase of common stock (1,702) (621) (287) Other, net (12) — — Net cash provided by (used in) financing activities 64 (984) (382)
Net (decrease) increase in cash and cash equivalents (45) (60) 102 Cash and cash equivalents at beginning of year 403 463 361 Cash and cash equivalents at end of year $358 $403 $463
The accompanying Notes to Consolidated Financial Statements are an integral part of these financial statements.
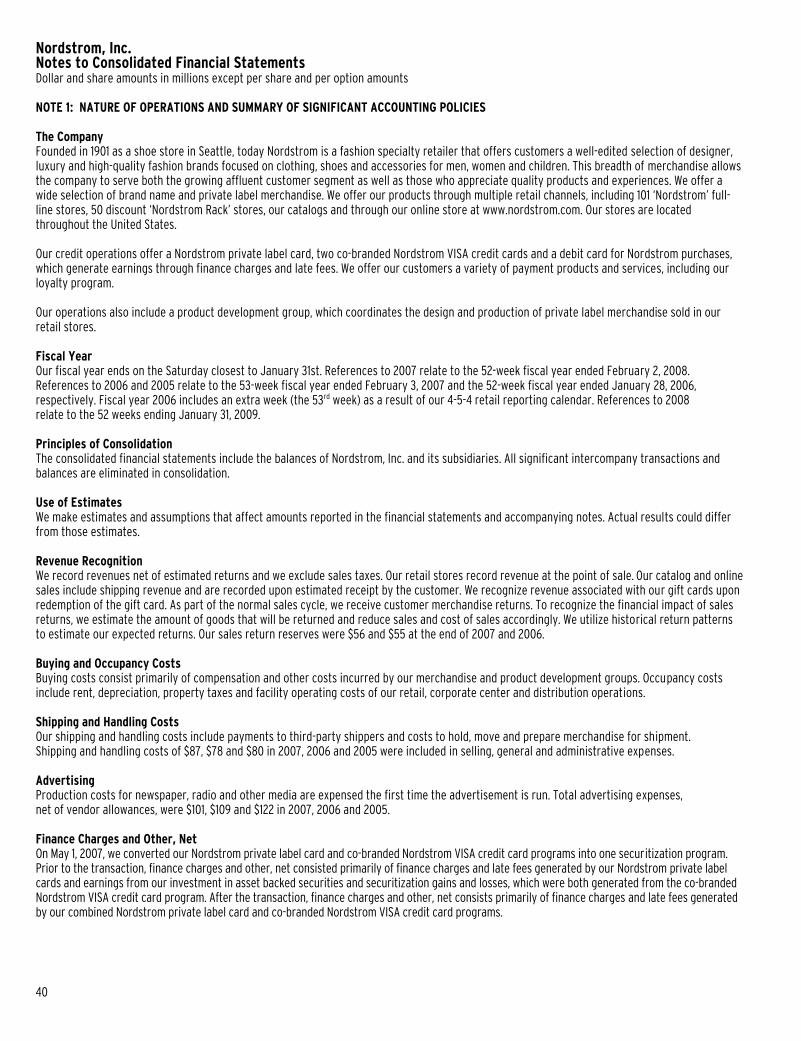
40
Nordstrom, Inc. Notes to Consolidated Financial Statements Dollar and share amounts in millions except per share and per option amounts
NOTE 1: NATURE OF OPERATIONS AND SUMMARY OF SIGNIFICANT ACCOUNTING POLICIES
The Company Founded in 1901 as a shoe store in Seattle, today Nordstrom is a fashion specialty retailer that offers customers a well-edited selection of designer, luxury and high-quality fashion brands focused on clothing, shoes and accessories for men, women and children. This breadth of merchandise allows the company to serve both the growing affluent customer segment as well as those who appreciate quality products and experiences. We offer a wide selection of brand name and private label merchandise. We offer our products through multiple retail channels, including 101 ‘Nordstrom’ full-line stores, 50 discount ‘Nordstrom Rack’ stores, our catalogs and through our online store at www.nordstrom.com. Our stores are located throughout the United States.
Our credit operations offer a Nordstrom private label card, two co-branded Nordstrom VISA credit cards and a debit card for Nordstrom purchases, which generate earnings through finance charges and late fees. We offer our customers a variety of payment products and services, including our loyalty program.
Our operations also include a product development group, which coordinates the design and production of private label merchandise sold in our retail stores.
Fiscal Year Our fiscal year ends on the Saturday closest to January 31st. References to 2007 relate to the 52-week fiscal year ended February 2, 2008. References to 2006 and 2005 relate to the 53-week fiscal year ended February 3, 2007 and the 52-week fiscal year ended January 28, 2006, respectively. Fiscal year 2006 includes an extra week (the 53rd week) as a result of our 4-5-4 retail reporting calendar. References to 2008 relate to the 52 weeks ending January 31, 2009.
Principles of Consolidation The consolidated financial statements include the balances of Nordstrom, Inc. and its subsidiaries. All significant intercompany transactions and balances are eliminated in consolidation.
Use of Estimates We make estimates and assumptions that affect amounts reported in the financial statements and accompanying notes. Actual results could differ from those estimates.
Revenue Recognition We record revenues net of estimated returns and we exclude sales taxes. Our retail stores record revenue at the point of sale. Our catalog and online sales include shipping revenue and are recorded upon estimated receipt by the customer. We recognize revenue associated with our gift cards upon redemption of the gift card. As part of the normal sales cycle, we receive customer merchandise returns. To recognize the financial impact of sales returns, we estimate the amount of goods that will be returned and reduce sales and cost of sales accordingly. We utilize historical return patterns to estimate our expected returns. Our sales return reserves were $56 and $55 at the end of 2007 and 2006.
Buying and Occupancy Costs Buying costs consist primarily of compensation and other costs incurred by our merchandise and product development groups. Occupancy costs include rent, depreciation, property taxes and facility operating costs of our retail, corporate center and distribution operations.
Shipping and Handling Costs Our shipping and handling costs include payments to third-party shippers and costs to hold, move and prepare merchandise for shipment.Shipping and handling costs of $87, $78 and $80 in 2007, 2006 and 2005 were included in selling, general and administrative expenses.
Advertising Production costs for newspaper, radio and other media are expensed the first time the advertisement is run. Total advertising expenses,net of vendor allowances, were $101, $109 and $122 in 2007, 2006 and 2005.
Finance Charges and Other, Net On May 1, 2007, we converted our Nordstrom private label card and co-branded Nordstrom VISA credit card programs into one securitization program. Prior to the transaction, finance charges and other, net consisted primarily of finance charges and late fees generated by our Nordstrom private label cards and earnings from our investment in asset backed securities and securitization gains and losses, which were both generated from the co-branded Nordstrom VISA credit card program. After the transaction, finance charges and other, net consists primarily of finance charges and late fees generated by our combined Nordstrom private label card and co-branded Nordstrom VISA credit card programs.
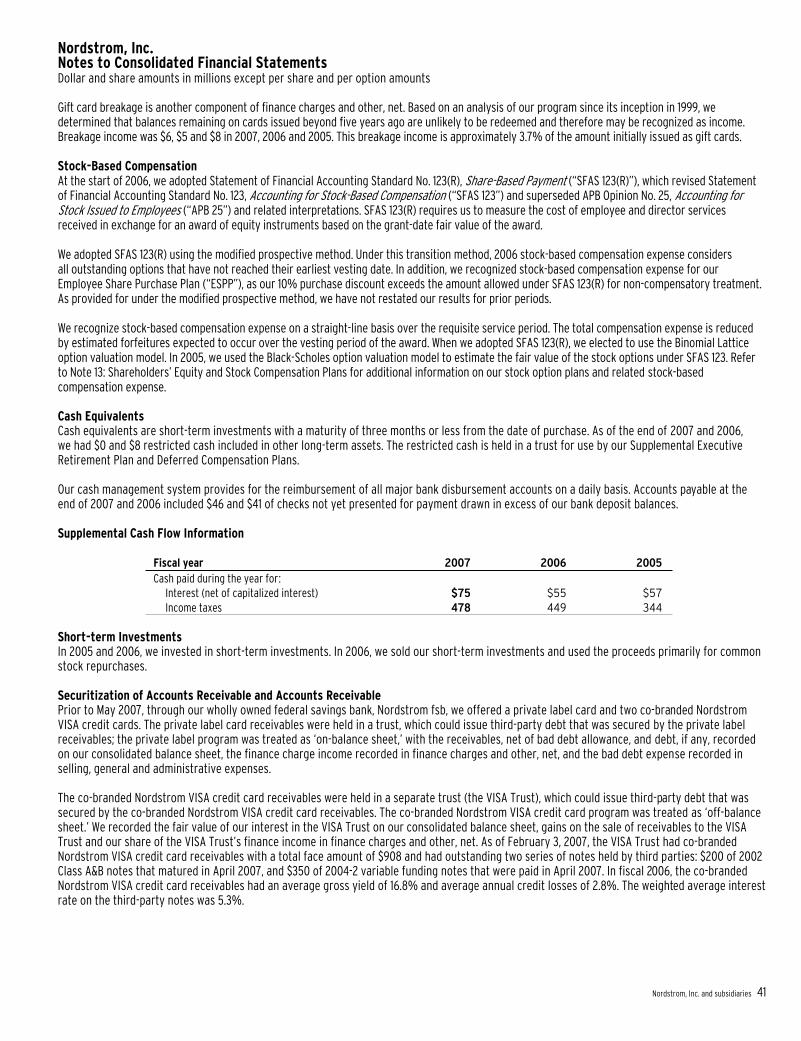
Nordstrom, Inc. and subsidiaries 41
Nordstrom, Inc. Notes to Consolidated Financial Statements Dollar and share amounts in millions except per share and per option amounts
Gift card breakage is another component of finance charges and other, net. Based on an analysis of our program since its inception in 1999, we determined that balances remaining on cards issued beyond five years ago are unlikely to be redeemed and therefore may be recognized as income. Breakage income was $6, $5 and $8 in 2007, 2006 and 2005. This breakage income is approximately 3.7% of the amount initially issued as gift cards.
Stock-Based Compensation At the start of 2006, we adopted Statement of Financial Accounting Standard No. 123(R), Share-Based Payment (“SFAS 123(R)”), which revised Statement of Financial Accounting Standard No. 123, Accounting for Stock-Based Compensation (“SFAS 123”) and superseded APB Opinion No. 25, Accounting for Stock Issued to Employees (“APB 25”) and related interpretations. SFAS 123(R) requires us to measure the cost of employee and director services received in exchange for an award of equity instruments based on the grant-date fair value of the award.
We adopted SFAS 123(R) using the modified prospective method. Under this transition method, 2006 stock-based compensation expense considers all outstanding options that have not reached their earliest vesting date. In addition, we recognized stock-based compensation expense for our Employee Share Purchase Plan (“ESPP”), as our 10% purchase discount exceeds the amount allowed under SFAS 123(R) for non-compensatory treatment. As provided for under the modified prospective method, we have not restated our results for prior periods.
We recognize stock-based compensation expense on a straight-line basis over the requisite service period. The total compensation expense is reduced by estimated forfeitures expected to occur over the vesting period of the award. When we adopted SFAS 123(R), we elected to use the Binomial Lattice option valuation model. In 2005, we used the Black-Scholes option valuation model to estimate the fair value of the stock options under SFAS 123. Refer to Note 13: Shareholders’ Equity and Stock Compensation Plans for additional information on our stock option plans and related stock-based compensation expense.
Cash Equivalents Cash equivalents are short-term investments with a maturity of three months or less from the date of purchase. As of the end of 2007 and 2006,we had $0 and $8 restricted cash included in other long-term assets. The restricted cash is held in a trust for use by our Supplemental Executive Retirement Plan and Deferred Compensation Plans.
Our cash management system provides for the reimbursement of all major bank disbursement accounts on a daily basis. Accounts payable at the end of 2007 and 2006 included $46 and $41 of checks not yet presented for payment drawn in excess of our bank deposit balances.
Supplemental Cash Flow Information
Fiscal year 2007 2006 2005 Cash paid during the year for: Interest (net of capitalized interest) $75 $55 $57 Income taxes 478 449 344
Short-term Investments In 2005 and 2006, we invested in short-term investments. In 2006, we sold our short-term investments and used the proceeds primarily for common stock repurchases.
Securitization of Accounts Receivable and Accounts Receivable Prior to May 2007, through our wholly owned federal savings bank, Nordstrom fsb, we offered a private label card and two co-branded Nordstrom VISA credit cards. The private label card receivables were held in a trust, which could issue third-party debt that was secured by the private label receivables; the private label program was treated as ‘on-balance sheet,’ with the receivables, net of bad debt allowance, and debt, if any, recorded on our consolidated balance sheet, the finance charge income recorded in finance charges and other, net, and the bad debt expense recorded in selling, general and administrative expenses.
The co-branded Nordstrom VISA credit card receivables were held in a separate trust (the VISA Trust), which could issue third-party debt that was secured by the co-branded Nordstrom VISA credit card receivables. The co-branded Nordstrom VISA credit card program was treated as ‘off-balance sheet.’ We recorded the fair value of our interest in the VISA Trust on our consolidated balance sheet, gains on the sale of receivables to the VISA Trust and our share of the VISA Trust’s finance income in finance charges and other, net. As of February 3, 2007, the VISA Trust had co-branded Nordstrom VISA credit card receivables with a total face amount of $908 and had outstanding two series of notes held by third parties: $200 of 2002 Class A&B notes that matured in April 2007, and $350 of 2004-2 variable funding notes that were paid in April 2007. In fiscal 2006, the co-branded Nordstrom VISA credit card receivables had an average gross yield of 16.8% and average annual credit losses of 2.8%. The weighted average interest rate on the third-party notes was 5.3%.
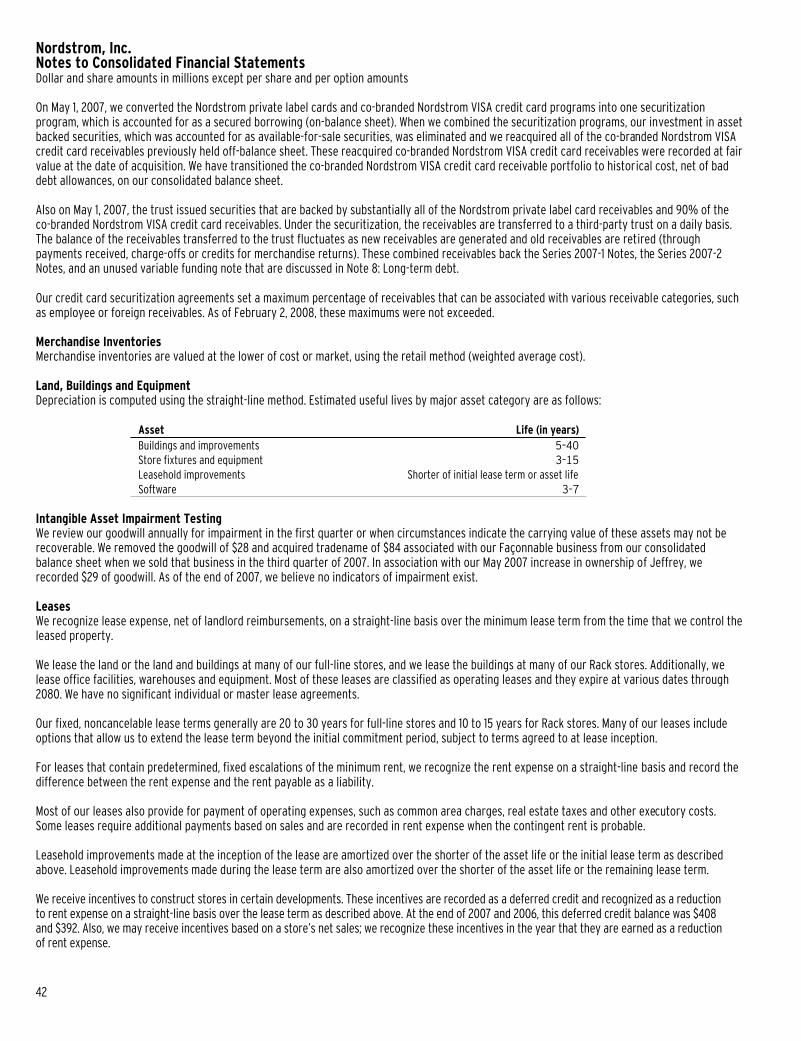
42
Nordstrom, Inc. Notes to Consolidated Financial Statements Dollar and share amounts in millions except per share and per option amounts
On May 1, 2007, we converted the Nordstrom private label cards and co-branded Nordstrom VISA credit card programs into one securitizationprogram, which is accounted for as a secured borrowing (on-balance sheet). When we combined the securitization programs, our investment in asset backed securities, which was accounted for as available-for-sale securities, was eliminated and we reacquired all of the co-branded Nordstrom VISA credit card receivables previously held off-balance sheet. These reacquired co-branded Nordstrom VISA credit card receivables were recorded at fair value at the date of acquisition. We have transitioned the co-branded Nordstrom VISA credit card receivable portfolio to historical cost, net of bad debt allowances, on our consolidated balance sheet.
Also on May 1, 2007, the trust issued securities that are backed by substantially all of the Nordstrom private label card receivables and 90% of the co-branded Nordstrom VISA credit card receivables. Under the securitization, the receivables are transferred to a third-party trust on a daily basis. The balance of the receivables transferred to the trust fluctuates as new receivables are generated and old receivables are retired (through payments received, charge-offs or credits for merchandise returns). These combined receivables back the Series 2007-1 Notes, the Series 2007-2 Notes, and an unused variable funding note that are discussed in Note 8: Long-term debt.
Our credit card securitization agreements set a maximum percentage of receivables that can be associated with various receivable categories, such as employee or foreign receivables. As of February 2, 2008, these maximums were not exceeded.
Merchandise Inventories Merchandise inventories are valued at the lower of cost or market, using the retail method (weighted average cost).
Land, Buildings and Equipment Depreciation is computed using the straight-line method. Estimated useful lives by major asset category are as follows:
Asset Life (in years) Buildings and improvements 5–40 Store fixtures and equipment 3–15 Leasehold improvements Shorter of initial lease term or asset life Software 3–7
Intangible Asset Impairment Testing We review our goodwill annually for impairment in the first quarter or when circumstances indicate the carrying value of these assets may not be recoverable. We removed the goodwill of $28 and acquired tradename of $84 associated with our Façonnable business from our consolidatedbalance sheet when we sold that business in the third quarter of 2007. In association with our May 2007 increase in ownership of Jeffrey, we recorded $29 of goodwill. As of the end of 2007, we believe no indicators of impairment exist.
LeasesWe recognize lease expense, net of landlord reimbursements, on a straight-line basis over the minimum lease term from the time that we control the leased property.
We lease the land or the land and buildings at many of our full-line stores, and we lease the buildings at many of our Rack stores. Additionally, we lease office facilities, warehouses and equipment. Most of these leases are classified as operating leases and they expire at various dates through 2080. We have no significant individual or master lease agreements.
Our fixed, noncancelable lease terms generally are 20 to 30 years for full-line stores and 10 to 15 years for Rack stores. Many of our leases include options that allow us to extend the lease term beyond the initial commitment period, subject to terms agreed to at lease inception.
For leases that contain predetermined, fixed escalations of the minimum rent, we recognize the rent expense on a straight-line basis and record the difference between the rent expense and the rent payable as a liability.
Most of our leases also provide for payment of operating expenses, such as common area charges, real estate taxes and other executory costs. Some leases require additional payments based on sales and are recorded in rent expense when the contingent rent is probable.
Leasehold improvements made at the inception of the lease are amortized over the shorter of the asset life or the initial lease term as described above. Leasehold improvements made during the lease term are also amortized over the shorter of the asset life or the remaining lease term.
We receive incentives to construct stores in certain developments. These incentives are recorded as a deferred credit and recognized as a reduction to rent expense on a straight-line basis over the lease term as described above. At the end of 2007 and 2006, this deferred credit balance was $408 and $392. Also, we may receive incentives based on a store’s net sales; we recognize these incentives in the year that they are earned as a reduction of rent expense.

Nordstrom, Inc. and subsidiaries 43
Nordstrom, Inc. Notes to Consolidated Financial Statements Dollar and share amounts in millions except per share and per option amounts
Foreign Currency Translation As of the end of 2007, we no longer own any material foreign subsidiaries, and so no longer recognize any foreign currency translation in accumulated other comprehensive earnings. Prior to the sale of the Façonnable business in the third quarter of 2007, the assets and liabilities of our foreign subsidiaries were translated to U.S. dollars using the exchange rates effective on the balance sheet date, while income and expense accounts were translated at the average rates in effect during the year. The resulting translation adjustments were recorded in accumulated other comprehensive earnings.
Income Taxes We use the asset and liability method of accounting for income taxes. Using this method, deferred tax assets and liabilities are recorded based on differences between financial reporting and tax basis of assets and liabilities. The deferred tax assets and liabilities are calculated using the enacted tax rates and laws that are expected to be in effect when the differences are expected to reverse. We establish valuation allowances for tax benefits when we believe it is not likely that the related expense will be deductible for tax purposes.
Effective February 4, 2007, we adopted Financial Accounting Standards Board (FASB) Interpretation No. 48, Accounting for Uncertainty in Income Taxes (“FIN 48”). FIN 48 clarifies the accounting for uncertainty in income taxes recognized in financial statements in accordance with Statement of Financial Accounting Standards No. 109, Accounting for Income Taxes. In accordance with FIN 48, we regularly evaluate the likelihood of recognizing the benefit for income tax positions we have taken in various federal, state, and foreign filings by considering all relevant facts, circumstances, and information available. For those benefits we believe more likely than not will be sustained, we recognize the largest amount we believe is cumulatively greater than 50% likely to be realized.
Other Current Liabilities Included in other current liabilities were gift card liabilities of $188 and $172 at the end of 2007 and 2006.
Loyalty Program Customers who reach a cumulative purchase threshold when using our Nordstrom private label cards or our co-branded Nordstrom VISA credit cards receive Nordstrom Notes®. These Nordstrom Notes can be redeemed for goods or services in our stores. We estimate the net cost of the Nordstrom Notes that will be issued and redeemed and record this cost as rewards points are accumulated. In addition to this long-standing benefit, in April 2007 we launched an enhanced loyalty program, Fashion RewardsTM. Under this program, Nordstrom customers receive higher levels of cumulative benefits based on their annual spend. We record the cost of the loyalty program benefits in cost of sales and selling, general and administrative expenses. These expenses are recorded based on estimates of benefits expected to be accumulated and redeemed in relation to sales.
Vendor Allowances We receive allowances from merchandise vendors for cosmetic selling expenses, purchase price adjustments, cooperative advertising programs, and vendor sponsored contests. Allowances for cosmetic selling expenses are recorded in selling, general and administrative expenses as a reduction to the related cost when incurred. Purchase price adjustments are recorded as a reduction of cost of sales at the point they have been earned and the related merchandise has been sold. Allowances for cooperative advertising and promotion programs and vendor sponsored contests are recorded in cost of sales and selling, general and administrative expenses as a reduction to the related cost when incurred. Any allowances in excess of actual costs incurred that are recorded in selling, general and administrative expenses are recorded as a reduction to cost of sales. The following table shows vendor allowances earned during the year:
Fiscal year 2007 2006 2005 Cosmetic selling expenses $120 $121 $107 Purchase price adjustments 86 70 58 Cooperative advertising and promotion 61 67 58 Vendor sponsored contests 2 3 4 Total vendor allowances $269 $261 $227
Allowances were recorded in our consolidated statements of earnings as follows:
Fiscal year 2007 2006 2005 Cost of sales $146 $138 $118 Selling, general and administrative expenses 123 123 109 Total vendor allowances $269 $261 $227
Fair Value of Financial Instruments The carrying amounts of cash equivalents approximate fair value. See Note 8: Long-term debt for the fair values of our long-term debt and interest rate swap agreement.
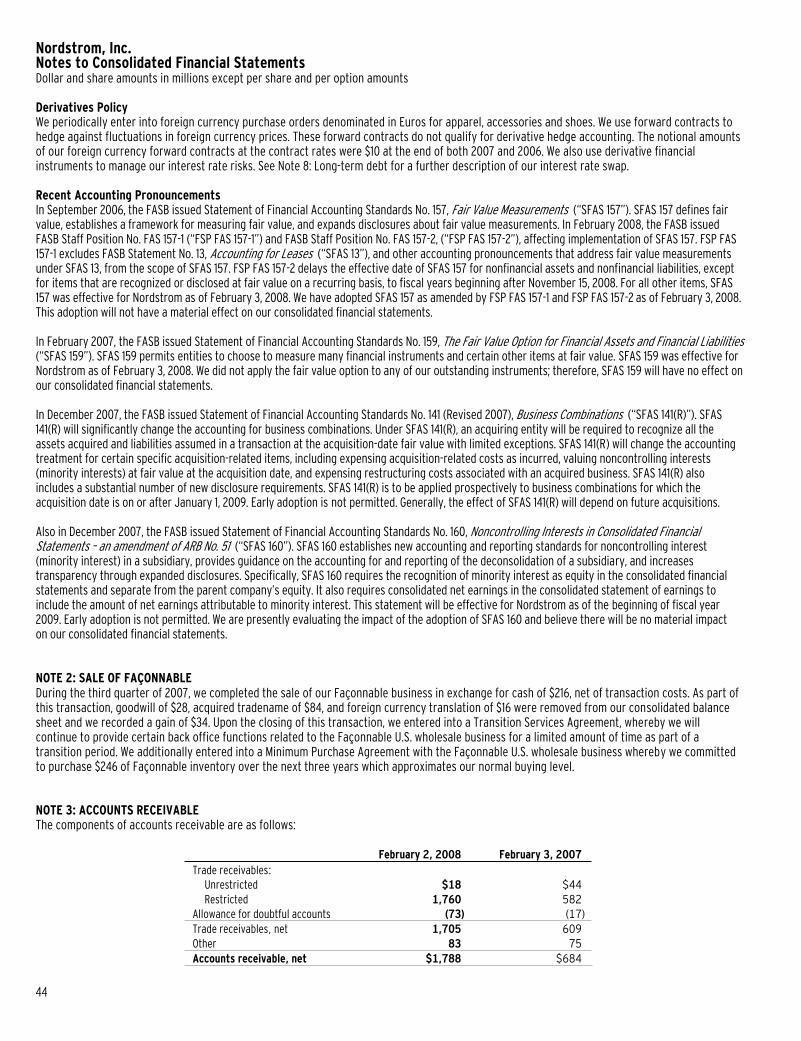
44
Nordstrom, Inc. Notes to Consolidated Financial Statements Dollar and share amounts in millions except per share and per option amounts
Derivatives Policy We periodically enter into foreign currency purchase orders denominated in Euros for apparel, accessories and shoes. We use forward contracts to hedge against fluctuations in foreign currency prices. These forward contracts do not qualify for derivative hedge accounting. The notional amounts of our foreign currency forward contracts at the contract rates were $10 at the end of both 2007 and 2006. We also use derivative financial instruments to manage our interest rate risks. See Note 8: Long-term debt for a further description of our interest rate swap.
Recent Accounting Pronouncements In September 2006, the FASB issued Statement of Financial Accounting Standards No. 157, Fair Value Measurements (“SFAS 157”). SFAS 157 defines fair value, establishes a framework for measuring fair value, and expands disclosures about fair value measurements. In February 2008, the FASB issued FASB Staff Position No. FAS 157-1 (“FSP FAS 157-1”) and FASB Staff Position No. FAS 157-2, (“FSP FAS 157-2”), affecting implementation of SFAS 157. FSP FAS 157-1 excludes FASB Statement No. 13, Accounting for Leases (“SFAS 13”), and other accounting pronouncements that address fair value measurements under SFAS 13, from the scope of SFAS 157. FSP FAS 157-2 delays the effective date of SFAS 157 for nonfinancial assets and nonfinancial liabilities, except for items that are recognized or disclosed at fair value on a recurring basis, to fiscal years beginning after November 15, 2008. For all other items, SFAS 157 was effective for Nordstrom as of February 3, 2008. We have adopted SFAS 157 as amended by FSP FAS 157-1 and FSP FAS 157-2 as of February 3, 2008. This adoption will not have a material effect on our consolidated financial statements.
In February 2007, the FASB issued Statement of Financial Accounting Standards No. 159, The Fair Value Option for Financial Assets and Financial Liabilities(“SFAS 159”). SFAS 159 permits entities to choose to measure many financial instruments and certain other items at fair value. SFAS 159 was effective for Nordstrom as of February 3, 2008. We did not apply the fair value option to any of our outstanding instruments; therefore, SFAS 159 will have no effect on our consolidated financial statements.
In December 2007, the FASB issued Statement of Financial Accounting Standards No. 141 (Revised 2007), Business Combinations (“SFAS 141(R)”). SFAS 141(R) will significantly change the accounting for business combinations. Under SFAS 141(R), an acquiring entity will be required to recognize all the assets acquired and liabilities assumed in a transaction at the acquisition-date fair value with limited exceptions. SFAS 141(R) will change the accounting treatment for certain specific acquisition-related items, including expensing acquisition-related costs as incurred, valuing noncontrolling interests (minority interests) at fair value at the acquisition date, and expensing restructuring costs associated with an acquired business. SFAS 141(R) also includes a substantial number of new disclosure requirements. SFAS 141(R) is to be applied prospectively to business combinations for which the acquisition date is on or after January 1, 2009. Early adoption is not permitted. Generally, the effect of SFAS 141(R) will depend on future acquisitions.
Also in December 2007, the FASB issued Statement of Financial Accounting Standards No. 160, Noncontrolling Interests in Consolidated Financial Statements – an amendment of ARB No. 51 (“SFAS 160”). SFAS 160 establishes new accounting and reporting standards for noncontrolling interest (minority interest) in a subsidiary, provides guidance on the accounting for and reporting of the deconsolidation of a subsidiary, and increases transparency through expanded disclosures. Specifically, SFAS 160 requires the recognition of minority interest as equity in the consolidated financial statements and separate from the parent company’s equity. It also requires consolidated net earnings in the consolidated statement of earnings to include the amount of net earnings attributable to minority interest. This statement will be effective for Nordstrom as of the beginning of fiscal year 2009. Early adoption is not permitted. We are presently evaluating the impact of the adoption of SFAS 160 and believe there will be no material impact on our consolidated financial statements.
NOTE 2: SALE OF FAÇONNABLE During the third quarter of 2007, we completed the sale of our Façonnable business in exchange for cash of $216, net of transaction costs. As part of this transaction, goodwill of $28, acquired tradename of $84, and foreign currency translation of $16 were removed from our consolidated balance sheet and we recorded a gain of $34. Upon the closing of this transaction, we entered into a Transition Services Agreement, whereby we will continue to provide certain back office functions related to the Façonnable U.S. wholesale business for a limited amount of time as part of a transition period. We additionally entered into a Minimum Purchase Agreement with the Façonnable U.S. wholesale business whereby we committed to purchase $246 of Façonnable inventory over the next three years which approximates our normal buying level.
NOTE 3: ACCOUNTS RECEIVABLE The components of accounts receivable are as follows:
February 2, 2008 February 3, 2007 Trade receivables: Unrestricted $18 $44 Restricted 1,760 582 Allowance for doubtful accounts (73) (17) Trade receivables, net 1,705 609 Other 83 75 Accounts receivable, net $1,788 $684

Nordstrom, Inc. and subsidiaries 45
Nordstrom, Inc. Notes to Consolidated Financial Statements Dollar and share amounts in millions except per share and per option amounts
The following table summarizes the restricted trade receivables:
February 2, 2008 February 3, 2007 Private label card receivables $630 $582 Co-branded Nordstrom VISA credit card receivables 1,130 — Restricted trade receivables $1,760 $582
As of February 2, 2008, the restricted trade receivables relate to substantially all of our Nordstrom private label and co-branded Nordstrom VISA credit card receivables. These restricted trade receivables back the Series 2007-1 Notes, the Series 2007-2 Notes, and the variable funding notes discussed in Note 8: Long-term debt. At February 3, 2007, the restricted trade receivables were our Nordstrom private label card receivables, which backed our previously existing variable funding note.
The unrestricted trade receivables consist primarily of the remaining portion of our Nordstrom private label and co-branded Nordstrom VISA credit card receivables and accrued finance charges not yet allocated to customer accounts. As of February 3, 2007, the unrestricted trade receivables also included receivables related to the Façonnable business.
Other accounts receivable consist primarily of credit card receivables due from third-party financial institutions and vendor rebates.
NOTE 4: INVESTMENT IN ASSET BACKED SECURITIES – CO-BRANDED NORDSTROM VISA CREDIT CARD RECEIVABLES Prior to the securitization transaction discussed in Note 1, our co-branded Nordstrom VISA credit card program was treated as an investment in asset backed securities. As previously discussed, as of February 2, 2008, our consolidated balance sheet does not include an investment in asset backed securities. The following table represents the co-branded Nordstrom VISA credit card receivable balances and the estimated fair value of our investment in asset backed securities prior to the transaction:
February 3, 2007 Total face value of co-branded Nordstrom VISA credit card principal receivables $908 Securities issued by the VISA Trust: Off-balance sheet (sold to third parties): 2002 Class A & B Notes $200 2004-2 Variable funding notes 350 $550 Amounts recorded on consolidated balance sheet: Investment in asset backed securities at fair value $428
The following table presents the key assumptions we used to value the investment in asset backed securities prior to the transaction:
February 3, 2007 Assumptions used to estimate the fair value of the investment in asset backed securities: Weighted average remaining life (in months) 7.5 Average annual credit losses 5.7% Average gross yield 16.8% Weighted average coupon on issued securities 5.3% Average monthly payment rates 8.0% Discount rate on investment in asset backed securities 7.3% to 11.5%
The discount rate on asset backed securities represented the volatility and risk of the asset. Our discount rates considered both the current interest rate environment and credit spreads.
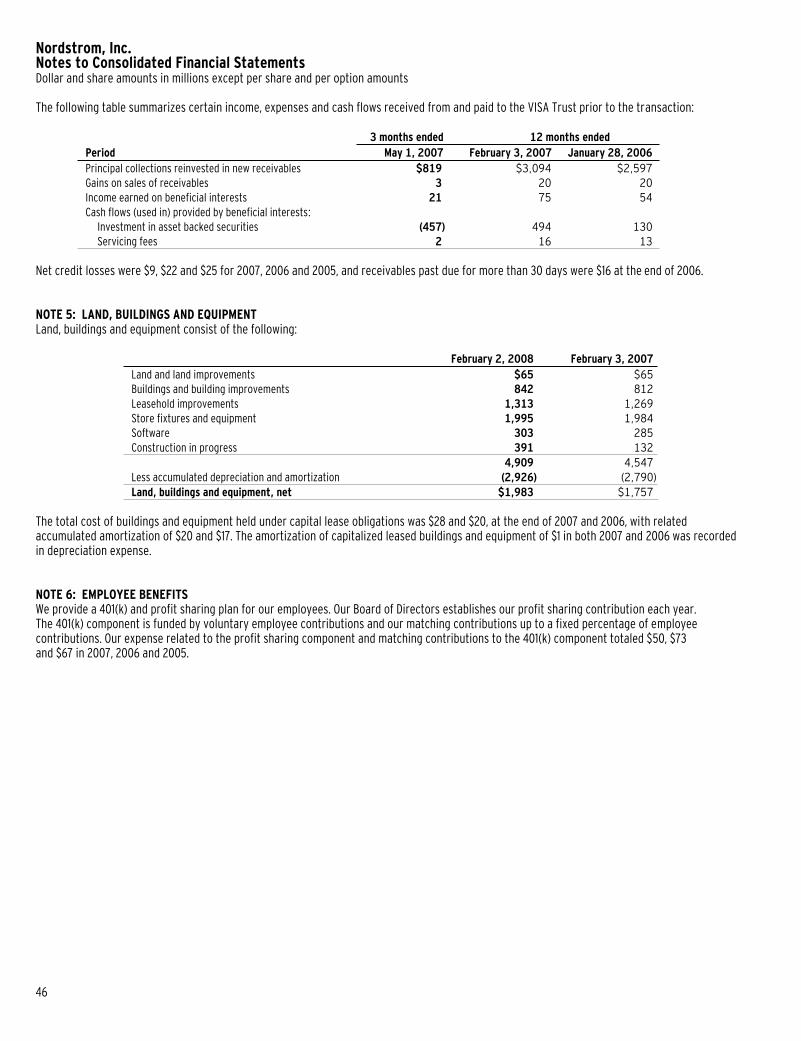
46
Nordstrom, Inc. Notes to Consolidated Financial Statements Dollar and share amounts in millions except per share and per option amounts
The following table summarizes certain income, expenses and cash flows received from and paid to the VISA Trust prior to the transaction:
3 months ended 12 months ended Period May 1, 2007 February 3, 2007 January 28, 2006 Principal collections reinvested in new receivables $819 $3,094 $2,597 Gains on sales of receivables 3 20 20 Income earned on beneficial interests 21 75 54 Cash flows (used in) provided by beneficial interests: Investment in asset backed securities (457) 494 130 Servicing fees 2 16 13
Net credit losses were $9, $22 and $25 for 2007, 2006 and 2005, and receivables past due for more than 30 days were $16 at the end of 2006.
NOTE 5: LAND, BUILDINGS AND EQUIPMENT Land, buildings and equipment consist of the following:
February 2, 2008 February 3, 2007 Land and land improvements $65 $65 Buildings and building improvements 842 812 Leasehold improvements 1,313 1,269 Store fixtures and equipment 1,995 1,984 Software 303 285 Construction in progress 391 132
4,909 4,547 Less accumulated depreciation and amortization (2,926) (2,790) Land, buildings and equipment, net $1,983 $1,757
The total cost of buildings and equipment held under capital lease obligations was $28 and $20, at the end of 2007 and 2006, with related accumulated amortization of $20 and $17. The amortization of capitalized leased buildings and equipment of $1 in both 2007 and 2006 was recorded in depreciation expense.
NOTE 6: EMPLOYEE BENEFITS We provide a 401(k) and profit sharing plan for our employees. Our Board of Directors establishes our profit sharing contribution each year. The 401(k) component is funded by voluntary employee contributions and our matching contributions up to a fixed percentage of employeecontributions. Our expense related to the profit sharing component and matching contributions to the 401(k) component totaled $50, $73and $67 in 2007, 2006 and 2005.

Nordstrom, Inc. and subsidiaries 47
Nordstrom, Inc. Notes to Consolidated Financial Statements Dollar and share amounts in millions except per share and per option amounts
NOTE 7: INCOME TAXES Effective February 4, 2007, we adopted Financial Accounting Standards Board (FASB) Interpretation No. 48, Accounting for Uncertainty in Income Taxes (“FIN 48”). FIN 48 clarifies the accounting for uncertainty in income taxes recognized in financial statements in accordance with Statement of Financial Accounting Standards No. 109, Accounting for Income Taxes. FIN 48 prescribes a recognition threshold and measurement attribute for the financial statement recognition and measurement of a tax position taken or expected to be taken in a tax return. FIN 48 also provides guidance on derecognition, classification, interest and penalties, accounting in interim periods, disclosure and transition.
The cumulative effect of adopting FIN 48 resulted in an increase to our liability for uncertain tax positions of $3, which reduced the beginning balance of retained earnings. Upon adoption we had approximately $21 of gross unrecognized tax benefits, of which $7 relates to deferred items which, if recognized, would not impact the effective tax rate.
A reconciliation of the beginning and ending amount of unrecognized tax benefits is as follows:
Balance at February 4, 2007 $21Gross increase to tax positions in prior periods 5Gross decrease to tax positions in prior periods (1)Gross increase to tax positions in current period 3Lapse of statute (1)Settlements -
Balance at February 2, 2008 $27
Unrecognized tax benefits related to federal, state and foreign tax positions may decrease by $1 by January 31, 2009, if years close and audits are completed during 2008.
Of the $27 ending gross unrecognized tax benefit balance, $9 relates to deferred items which, if recognized, would not impact the effective tax rate.
Interest and penalties related to income tax matters are classified as a component of income tax expense. The estimate for accrued interest and penalties upon adoption was $1. During 2007, our income tax expense included $3 of tax-related interest and penalties. At the end of 2007, our liability for interest and penalties was $4.
We file income tax returns in the U.S. federal and various state jurisdictions. We also file returns in France and several other foreign jurisdictions. With few exceptions, we are no longer subject to U.S. federal, state and local, or non-U.S. income tax examinations for years before 2002. Our U.S. federal filings for the years 2002 through 2006 are under routine examination and that process is anticipated to be completed before the end of 2008. The completion and ultimate settlement of these IRS audit years is expected to be a refund and will not have a material impact on our gross unrecognized tax benefits. Additionally, the U.S. federal tax return for 2007 is under concurrent year processing, which is expected to be completed in 2009. We also currently have an active examination in France for the years 2001 through 2004.
Income tax expense consists of the following:
Fiscal year 2007 2006 2005 Current income taxes: Federal $435 $423 $312 State and local 65 63 38 Total current income tax expense 500 486 350 Deferred income taxes: Current (24) (10) (7)
Non-current (18) (48) (9) Total deferred income tax benefit (42) (58) (16) Total income tax expense $458 $428 $334
A reconciliation of the statutory Federal income tax rate to the effective tax rate on earnings before income taxes is as follows:
Fiscal year 2007 2006 2005 Statutory rate 35.0% 35.0% 35.0% State and local income taxes, net of federal income taxes 3.4 3.2 3.2 Other, net 0.6 0.5 (0.5) Effective tax rate 39.0% 38.7% 37.7%

48
Nordstrom, Inc. Notes to Consolidated Financial Statements Dollar and share amounts in millions except per share and per option amounts
Deferred income taxes reflect the net tax effect of temporary differences between amounts recorded for financial reporting purposes and amounts used for tax purposes. The major components of deferred tax assets and liabilities are as follows:
February 2, 2008 February 3, 2007 Compensation and benefits accruals $105 $86 Accrued expenses 56 52 Merchandise inventories 28 25 Securitization — 24 Land, buildings and equipment basis and depreciation differences — 15 Gift cards and gift certificates 15 13 Loyalty reward certificates 10 9 Allowance on accounts receivables 28 6 Federal benefit of state taxes 9 — Other 13 — Total deferred tax assets 264 230 Land, buildings and equipment basis and depreciation differences (4) — Other — (8) Total deferred tax liabilities (4) (8) Net deferred tax assets $260 $222
NOTE 8: LONG-TERM DEBT We hold both secured and unsecured debt. The primary collateral for our secured debt is our Nordstrom private label card and co-branded Nordstrom VISA credit card receivables. A summary of long-term debt is as follows:
February 2, 2008 February 3, 2007 Secured
Series 2007-1 Class A Notes, 4.92%, due April 2010 $326 — Series 2007-1 Class B Notes, 5.02%, due April 2010 24 — Series 2007-2 Class A Notes, one-month LIBOR plus 0.06% per year, due April 2012 454 — Series 2007-2 Class B Notes, one-month LIBOR plus 0.18% per year, due April 2012 46 — Mortgage payable, 7.68%, due April 2020 67 $70 Other 19 14
936 84 Unsecured
Senior notes, 5.625%, due January 2009 250 250Senior notes, 6.25%, due January 2018, net of unamortized discount 646 —Senior debentures, 6.95%, due March 2028 300 300Senior notes, 7.00%, due January 2038, net of unamortized discount 342 —Other 22 6Fair market value of interest rate swap 1 (9)
1,561 547
Total long-term debt 2,497 631Less current portion (261) (7)
Total due beyond one year $2,236 $624
Both the Series 2007-1 Class A & B Notes and the Series 2007-2 Class A & B Notes are secured by substantially all of the Nordstrom private label card receivables and a 90% interest in the co-branded Nordstrom VISA credit card receivables.
Our mortgage payable is secured by an office building which had a net book value of $86 at the end of 2007.
Other secured and unsecured debt consists primarily of capital lease obligations and liabilities related to the acquisition of Jeffrey.

Nordstrom, Inc. and subsidiaries 49
Nordstrom, Inc. Notes to Consolidated Financial Statements Dollar and share amounts in millions except per share and per option amounts
During the fourth quarter of 2007, we issued $650 aggregate principal amount, net of discount of $4, of 6.25% senior unsecured notes due 2018 and $350 aggregate principal amount, net of discount of $8, of 7.00% senior unsecured notes due 2038 before expenses.
During the first quarter of 2007, we entered into an agreement for a new variable funding facility (2007-A Variable Funding Note) backed by substantially all of the Nordstrom private label card receivables and a 90% interest in the co-branded Nordstrom VISA credit card receivables witha commitment of $300. Borrowings under the facility incur interest based upon the cost of commercial paper issued by the third-party bank conduit plus specified fees. During the third quarter of 2007, we used this facility to issue $220 in Notes and paid the outstanding balance in the third and fourth quarters of 2007. We pay a commitment fee for the note based on the size of the commitment and the amount of borrowings outstanding. Commitment fee rates decrease if more than $50 is outstanding on the facility. The facility can be cancelled or not renewed if our debt ratings fall below Standard and Poor’s BB+ rating or Moody’s Ba1 rating. Our current rating by Standard and Poor’s is A-, four grades above BB+, and by Moody’s is Baa1, three grades above Ba1.
During the third quarter of 2007, we entered into an agreement for an additional new variable funding facility backed by the remaining 10% interest in the co-branded Nordstrom VISA credit card receivables with a commitment of $100. As of February 2, 2008, no issuances have been made against this facility. Borrowings under this facility incur interest based upon the cost of commercial paper issued by the third-party bank conduit plus specified fees.
To manage our interest rate risk, we have an interest rate swap outstanding recorded in prepaid expenses and other. Our swap has a $250 notional amount, expires in January 2009, and is designated as a fully effective fair value hedge. Under the agreement, we receive a fixed rate of 5.63% and pay a variable rate based on LIBOR plus a margin of 2.3% set at six-month intervals (5.32% at February 2, 2008).
We maintain a $500 unsecured line of credit, which is available as liquidity support for our commercial paper program described below. Under the terms of the agreement, we pay a variable rate of interest and a commitment fee based on our debt rating. Based upon our current debt rating, we pay a variable rate of interest of LIBOR plus a margin of 0.225% (3.24% at February 2, 2008) on the outstanding balance and an annual commitment fee of 0.075% on the total capacity. The variable rate of interest increases to LIBOR plus a margin of 0.325% if more than $250 is outstanding on the facility. The line of credit expires in November 2010, and contains restrictive covenants, which include maintaining a leverage ratio. We made no borrowings under this line of credit during 2007 or 2006.
During the third quarter of 2007, we entered into a new commercial paper dealer agreement, supported by our unsecured line of credit. Under this commercial paper program, we may issue commercial paper in an aggregate amount outstanding at any particular time not to exceed $500. This agreement allows us to use the proceeds to fund share repurchases as well as operating cash requirements. Under the terms of the commercial paper agreement, we pay a rate of interest based on, among other factors, the maturity of the issuance and market conditions. The issuance of commercial paper has the effect, while it is outstanding, of reducing our borrowing capacity under the line of credit by an amount equal to the principal amount of the commercial paper. As of February 2, 2008, we have no outstanding issuances of commercial paper.
The fair value of long-term debt, including current maturities, using quoted market prices of the same or similar issues, was $2,514 and $667 at the end of 2007 and 2006.
Required principal payments on long-term debt, excluding capital lease obligations and the fair market value of the interest rate swap, are as follows:
Fiscal year 2008 $258 2009 22 2010 355 2011 5 2012 505 Thereafter 1,336
The components of interest expense, net are as follows:
Fiscal year 2007 2006 2005 Interest expense on long-term debt $102 $63 $63
Less: Interest income (16) (15) (13) Capitalized interest (12) (5) (5) Interest expense, net $74 $43 $45

50
Nordstrom, Inc. Notes to Consolidated Financial Statements Dollar and share amounts in millions except per share and per option amounts
NOTE 9: LEASES Future minimum lease payments as of February 2, 2008 are as follows:
Fiscal year Capital Leases Operating Leases 2008 $3 $69 2009 3 71 2010 2 67 2011 2 62 2012 2 49 Thereafter 11 260 Total minimum lease payments 23 $578 Less amount representing interest (8) Present value of net minimum lease payments $15
Rent expense for 2007, 2006 and 2005 are as follows:
Fiscal year 2007 2006 2005 Minimum rent: Store locations $67 $67 $62 Offices, warehouses and equipment 14 15 15 Percentage rent - store locations 14 12 11 Property incentives - store locations (47) (46) (47) Total rent expense $48 $48 $41
The rent expense above does not include common area maintenance costs of $19 in 2007 and $16 in both 2006 and 2005.
NOTE 10: SELF INSURANCE We retain a portion of the risk for certain losses related to health and welfare, workers’ compensation and general liability claims. Liabilities associated with these losses include estimates of both losses reported and losses incurred but not yet reported. We estimate our ultimate cost based on analysis of historical data and independent actuarial estimates.
• Health and Welfare – We are self insured for our health and welfare coverage and we do not use stop-loss coverage. Participants contribute to the cost of their coverage and are subject to certain plan limits and deductibles. Our health and welfare reserve was $14 and $15 at the end of 2007 and 2006.
• Workers’ Compensation – We have a retention per claim of $1 or less and no policy limits. Our workers’ compensation reserve was $53 and $56 at the end of 2007 and 2006 and our expense was $15, $21 and $13 in 2007, 2006 and 2005.
• General Liability – Our General Liability encompasses two types of losses – Employment Practices Liability and Commercial General Liability. We have a retention per claim of $1 or less and a policy limit up to $25 and $150, respectively. Our general liability insurance reserve was $10 at the end of both 2007 and 2006.
NOTE 11: POST-RETIREMENT BENEFITS We have an unfunded Supplemental Executive Retirement Plan (“SERP”), which provides retirement benefits to certain officers and select employees. This plan is non-qualified and does not have a minimum funding requirement.
Effective February 3, 2007, we adopted Statement of Financial Accounting Standards No. 158, Employers’ Accounting for Defined Benefit Pension and Other Postretirement Plans (“SFAS 158”). The impact of the adoption of SFAS 158 is reflected within our consolidated financial statements as of February 3, 2007. SFAS 158 requires the recognition of a plan’s overfunded or underfunded status as an asset or liability in the consolidated balance sheet and the recognition of changes in that funded status in the year in which the changes occur through comprehensive income.

Nordstrom, Inc. and subsidiaries 51
Nordstrom, Inc. Notes to Consolidated Financial Statements Dollar and share amounts in millions except per share and per option amounts
The following table reflects the effects of the adoption of SFAS 158 on our consolidated balance sheet as of February 3, 2007.
Before Application After Application of Statement 158 Adjustments of Statement 158 Other assets $185 $2 $187 Total assets 4,820 2 4,822 Other liabilities 228 12 240 Accumulated other comprehensive earnings (loss), net 1 (10) (9) Total shareholders’ equity 2,179 (10) 2,169 Total liabilities and shareholders’ equity $4,820 $2 $4,822
Amounts not yet reflected in net periodic benefit cost and included in accumulated other comprehensive earnings (pre-tax) includedprior service cost of $(3) and $(4) and accumulated loss of $(28) and $(39) at the end of 2007 and 2006.
The change in benefit obligation and plan assets for 2007 and 2006 are as follows:
February 2, 2008 February 3, 2007 Change in benefit obligation: Benefit obligation at beginning of year $98 $91 Participant service cost 3 2 Interest cost 6 6 Benefits paid (4) (3) Actuarial (gain)/loss (8) 2 Benefit obligation at end of year $95 $98
Change in plan assets: Fair value of plan assets at beginning of year — — Employer contribution $4 $3 Distributions (4) (3)
Fair value of plan assets at end of year — — Underfunded status $(95) $(98)
The accumulated benefit obligation was $86 at February 2, 2008 and at February 3, 2007.
Amounts recognized as liabilities in the consolidated balance sheets consist of:
February 2, 2008 February 3, 2007 Current liabilities $5 $5 Noncurrent liabilities 90 93 Net amount recognized $95 $98
The components of SERP expense are as follows:
Fiscal year 2007 2006 2005 Participant service cost $2 $2 $2 Interest cost 6 6 5 Amortization of net loss 3 3 2 Amortization of prior service cost 1 1 1 Total expense $12 $12 $10
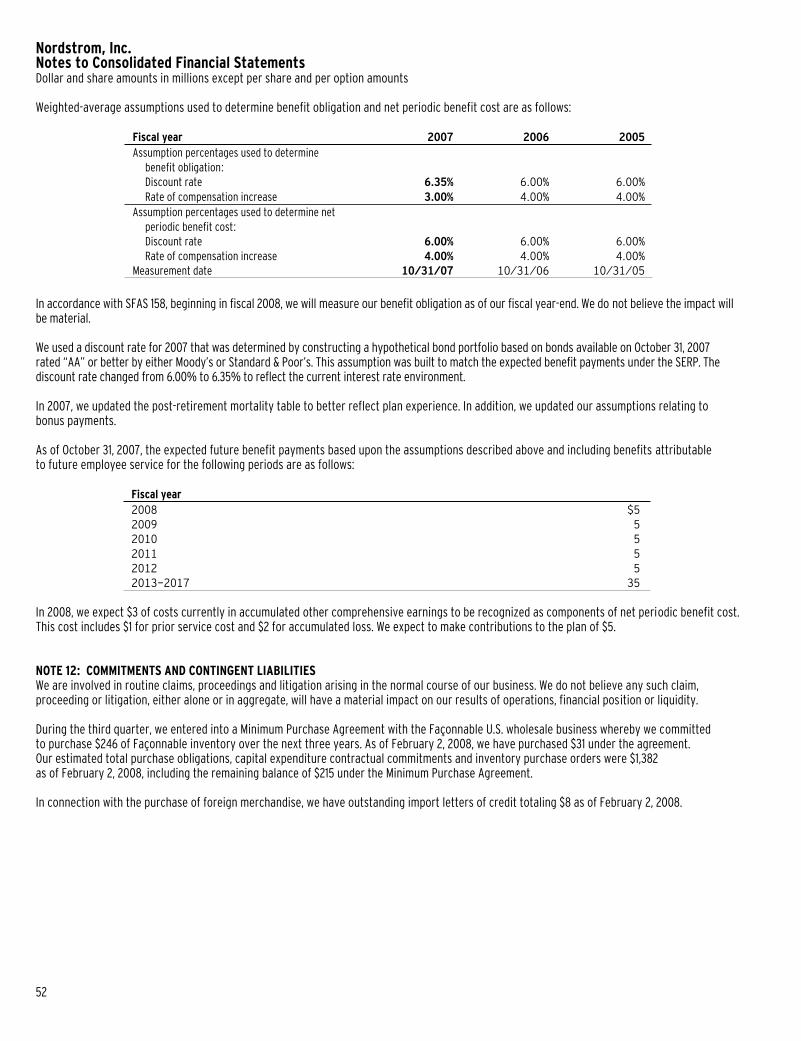
52
Nordstrom, Inc. Notes to Consolidated Financial Statements Dollar and share amounts in millions except per share and per option amounts
Weighted-average assumptions used to determine benefit obligation and net periodic benefit cost are as follows:
Fiscal year 2007 2006 2005 Assumption percentages used to determine
benefit obligation:
Discount rate 6.35% 6.00% 6.00% Rate of compensation increase 3.00% 4.00% 4.00% Assumption percentages used to determine net
periodic benefit cost:
Discount rate 6.00% 6.00% 6.00% Rate of compensation increase 4.00% 4.00% 4.00% Measurement date 10/31/07 10/31/06 10/31/05
In accordance with SFAS 158, beginning in fiscal 2008, we will measure our benefit obligation as of our fiscal year-end. We do not believe the impact will be material.
We used a discount rate for 2007 that was determined by constructing a hypothetical bond portfolio based on bonds available on October 31, 2007 rated “AA” or better by either Moody’s or Standard & Poor’s. This assumption was built to match the expected benefit payments under the SERP. The discount rate changed from 6.00% to 6.35% to reflect the current interest rate environment.
In 2007, we updated the post-retirement mortality table to better reflect plan experience. In addition, we updated our assumptions relating tobonus payments.
As of October 31, 2007, the expected future benefit payments based upon the assumptions described above and including benefits attributable to future employee service for the following periods are as follows:
Fiscal year 2008 $5 2009 5 2010 5 2011 5 2012 5 2013-2017 35
In 2008, we expect $3 of costs currently in accumulated other comprehensive earnings to be recognized as components of net periodic benefit cost. This cost includes $1 for prior service cost and $2 for accumulated loss. We expect to make contributions to the plan of $5.
NOTE 12: COMMITMENTS AND CONTINGENT LIABILITIES We are involved in routine claims, proceedings and litigation arising in the normal course of our business. We do not believe any such claim, proceeding or litigation, either alone or in aggregate, will have a material impact on our results of operations, financial position or liquidity.
During the third quarter, we entered into a Minimum Purchase Agreement with the Façonnable U.S. wholesale business whereby we committedto purchase $246 of Façonnable inventory over the next three years. As of February 2, 2008, we have purchased $31 under the agreement.Our estimated total purchase obligations, capital expenditure contractual commitments and inventory purchase orders were $1,382as of February 2, 2008, including the remaining balance of $215 under the Minimum Purchase Agreement.
In connection with the purchase of foreign merchandise, we have outstanding import letters of credit totaling $8 as of February 2, 2008.

Nordstrom, Inc. and subsidiaries 53
Nordstrom, Inc. Notes to Consolidated Financial Statements Dollar and share amounts in millions except per share and per option amounts
NOTE 13: SHAREHOLDERS’ EQUITY AND STOCK COMPENSATION PLANS
Share Repurchase Program In February 2005, our Board of Directors authorized $500 of share repurchases. Overall for 2005, we purchased 8 shares for $287 at an average price of $33.80 per share. We utilized the remaining authorization of $213 in the first quarter of 2006, purchasing 6 shares at an average price of $39.27 per share.
Our Board of Directors authorized an additional $1,000 of share repurchases in May 2006. During the remainder of 2006, we repurchased 11 shares for $409 as part of this authorization, at an average price of $36.74.
During the first half of 2007 we repurchased 11 shares for $590 as part of the existing authorization from May 2006, including $300 repurchased as part of an accelerated share repurchase program. In May 2007, we entered into an accelerated share repurchase agreement with Credit Suisse International to repurchase shares of our common stock for an aggregate purchase price of $300. We purchased 5 shares of our common stock on May 23, 2007 at $55.17 per share. Under the terms of the agreement, we received less than one share in June 2007 at no additional cost, based on the volume weighted average price of our common stock from June 1, 2007 to June 26, 2007. This resulted in an average price per share of $51.69 for the accelerated share repurchase as a whole.
In August 2007, our Board of Directors authorized a $1,500 share repurchase program. In November 2007, our Board of Directors authorized an increase of $1,000 to the share repurchase program. During the second half of 2007, we purchased 28 shares for $1,137 at an average price of $41.05, using the remaining $1 on the May 2006 authorization and beginning to use the August and November 2007 authorizations. As of February 2, 2008 the unused authorization was $1,364. Repurchases under the program may be made through the end of 2009. The actual amount and timing of future share repurchases will be subject to market conditions and applicable SEC rules.
Dividends In 2007, we paid dividends of $0.54 per share. We paid dividends of $0.42 and $0.32 in 2006 and 2005.
Stock Compensation Plans We currently grant stock options, performance share units and common shares under our 2004 Equity Incentive Plan.
The following table summarizes our stock-based compensation expense:
Fiscal year 2007 2006 2005 Stock options $23 $27 - Employee stock purchase plan 2 2 - Performance share units (1) 7 $12 Other 2 1 1 Total stock-based compensation expense before income tax benefit 26 37 13 Income tax benefit (9) (13) (5) Total stock-based compensation expense, net of income tax benefit $17 $24 $8
The stock-based compensation expense before income tax benefit was recorded in our consolidated statements of earnings as follows:
Fiscal year 2007 2006 2005 Cost of sales and related buying and occupancy costs $10 $12 - Selling, general and administrative expenses 16 25 $13 Total stock-based compensation expense before income tax benefit $26 $37 $13
Prior to the adoption of Financial Accounting Standard No. 123(R), Share-Based Payment (“SFAS 123(R)”), we applied APB Opinion No. 25, Accountingfor Stock Issued to Employees (“APB 25”) to measure compensation costs for our stock-based compensation programs. Under APB 25, we recorded no compensation expense for stock options granted to employees and directors because the options’ strike price was equal to the closing market price of our common stock on the grant date. Also, in 2005 we recorded no compensation expense in connection with our Employee Stock Purchase Plan (“ESPP”). In 2005, we presented the effect on net earnings and earnings per share of the fair value provisions of Statement of Financial Accounting Standard No. 123, Accounting for Stock-Based Compensation (“SFAS 123”) in the Notes to Consolidated Financial Statements.

54
Nordstrom, Inc. Notes to Consolidated Financial Statements Dollar and share amounts in millions except per share and per option amounts
The following table illustrates the effect on net earnings and earnings per share if we had applied the fair value recognition provisions of SFAS 123 in 2005:
Fiscal year 2005 Net earnings, as reported $551 Add: stock-based compensation expense included in reported net earnings, net of tax 8Deduct: stock-based compensation expense determined under fair value, net of tax (25)
Pro forma net earnings $534 Earnings per share: Basic-as reported $2.03 Diluted-as reported $1.98 Basic-pro forma $1.96 Diluted-pro forma $1.92
Prior to the adoption of SFAS 123(R), we classified all tax benefits resulting from the exercise of stock options and ESPP as operating cash inflows. SFAS 123(R) requires the benefits of tax deductions in excess of the compensation cost recognized for those awards to be classified as financing cash inflows rather than operating cash inflows, on a prospective basis. This amount is shown as “Excess tax benefit from stock-based payments” in the consolidated statement of cash flows and was $26 and $38 in 2007 and 2006.
STOCK OPTIONS In 2005, we used the Black-Scholes option valuation model to estimate the fair value of the stock options under SFAS 123. When we adopted SFAS 123(R), we elected to use the Binomial Lattice option valuation model. We believe that this model provides a better estimate of fair value than the Black-Scholes option valuation model, as it can accommodate variability in assumptions for expected volatility, dividends and risk-free interest rates.
We used the following assumptions to estimate the fair value for stock options at grant date:
Fiscal year 2007 2006 2005 Risk-free interest rate 4.6% - 4.7% 4.9% - 5.1% 3.9%
Volatility 35.0% 37.0% 44.3% Dividend yield 1.0% 1.0% 1.7% Expected life in years 5.7 5.4 5.0
The weighted average fair value per option at the grant date was $20, $16 and $10 in 2007, 2006 and 2005. The following describes the significant assumptions used to estimate the fair value of options granted:
Risk-free interest rate: For 2007 and 2006, the rate represents the yield on U.S. Treasury zero-coupon securities that mature over the 10-year life of the stock options. For 2005, the rate was the yield on the U.S. Treasury zero-coupon securities which matured near the end of the expected life of the stock options.
Expected volatility: For 2007 and 2006, the expected volatility is based on a combination of the historical volatility of our common stock and the implied volatility of exchange traded options for our common stock. For 2005, the expected volatility was estimated using the historical volatility of our common stock.
Expected dividend yield: For 2007 and 2006, the yield is our forecasted dividend yield for the next ten years. In 2005, the expected dividend yield was based on our historical dividend yield.
Expected life in years: The expected life represents the estimated period of time until option exercise. For 2007 and 2006, the expected term of options granted was derived from the output of the Binomial Lattice option valuation model and was based on our historical exercise behavior taking into consideration the contractual term of the option and our employees’ expected exercise and post-vesting employment termination behavior. For 2005, the expected life was determined based on our historical exercise behavior.

Nordstrom, Inc. and subsidiaries 55
Nordstrom, Inc. Notes to Consolidated Financial Statements Dollar and share amounts in millions except per share and per option amounts As of February 2, 2008, we have options outstanding under two stock option plans (collectively, the “Nordstrom, Inc. Plans”). Options vest over periods ranging from four to eight years, and expire ten years after the date of grant. A summary of stock option activity under the Nordstrom, Inc. Plans is presented below: Fiscal Year 2007 2006 2005
Shares
Weighted-Average
Exercise Price
Shares
Weighted-Average
Exercise Price
Shares
Weighted-Average
Exercise Price Outstanding, beginning of year 12 $19 14 $15 18 $13 Granted 2 54 2 40 3 26 Exercised (2) 15 (4) 13 (6) 13 Cancelled (1) 38 — 25 (1) 16 Outstanding, end of year 11 $25 12 $19 14 $15 Options exercisable at end of year 7 $16 6 $13 6 $12
In 2007, stock option awards to employees were approved by the Compensation Committee of our Board of Directors and their exercise price was set at the closing price of our common stock on March 1, 2007. In 2006 and 2005, stock option awards to employees were approved by the Compensation Committee of our Board of Directors and their exercise price was set at the closing price of our common stock on the Committee meeting date. The stock option awards provide recipients with the opportunity for financial rewards when our stock price increases. The awards are determined based upon a percentage of the recipients’ base salary and the fair value of the stock options, which was estimated using an option pricing model. The fair value per stock option was $20 and $16 in 2007 and 2006 (using a Binomial Lattice option valuation model), and $10 in 2005 (using the Black-Scholes option valuation model). In 2007, we awarded stock options to 1,195 employees compared to 1,236 and 1,207 employees in the same periods in 2006 and 2005. The total intrinsic value of options exercised during 2007, 2006 and 2005 was $79, $111 and $102. The total fair value of stock options vested during fiscal years 2007, 2006 and 2005 was $24, $30 and $27. As of February 2, 2008, the total unrecognized stock-based compensation expense related to nonvested stock options was $36, which is expected to be recognized over a weighted average period of 29 months. The aggregate intrinsic value of options outstanding as of February 2, 2008 was $185. The aggregate intrinsic value of options exercisable as of February 2, 2008, was $160. As of February 2, 2008, 10 options were vested or expected to vest with a total intrinsic value of $180. The weighted average exercise price of options vested or expected to vest was $24 as of February 2, 2008. The weighted average exercise life of options vested or expected to vest was six years. The following table summarizes information about stock options outstanding for the Nordstrom, Inc. Plans as of February 2, 2008: Options Outstanding Options Exercisable Range of Exercise Prices
Shares
Weighted-Average Remaining Contractual Life (Years)
Weighted-Average Exercise Price
Shares
Weighted-Average Remaining Contractual Life (Years)
Weighted-Average Exercise Price
$8.03 - $11.00 3 4 $9 3 4 $9 $11.01 - $19.60 3 5 17 2 5 16 $19.61 - $40.00 2 6 25 1 5 24 $40.01 - $53.63 3 9 47 1 8 40 11 6 $25 7 5 $16 PERFORMANCE SHARE UNITS We grant performance share units to align certain elements of our senior management compensation with our shareholder returns. Performance share units are payable in either cash or stock as elected by the employee; therefore they are classified as a liability award in accordance with SFAS 123(R). Performance share units vest after a three-year performance period only when our total shareholder return (reflecting daily stock price appreciation and compound reinvestment of dividends) is positive and outperforms companies in a defined peer group of direct competitors determined by the Compensation Committee of our Board of Directors. The percentage of units that vest depends on our relative position at the end of the performance period and can range from 0% to 125% of the number of units granted. The liability is remeasured and the appropriate earnings adjustment is taken at each fiscal quarter-end during the vesting period. The price we used to remeasure the performance share units granted in 2005 was the closing market price of our common stock on the current period-end date. To remeasure the performance share units granted in 2006 and following, we use the 30-day average closing market price of our common stock leading up to the current period-end date. The price used to issue stock or cash for the performance share units upon vesting is the closing market price of our common stock on the vest date.
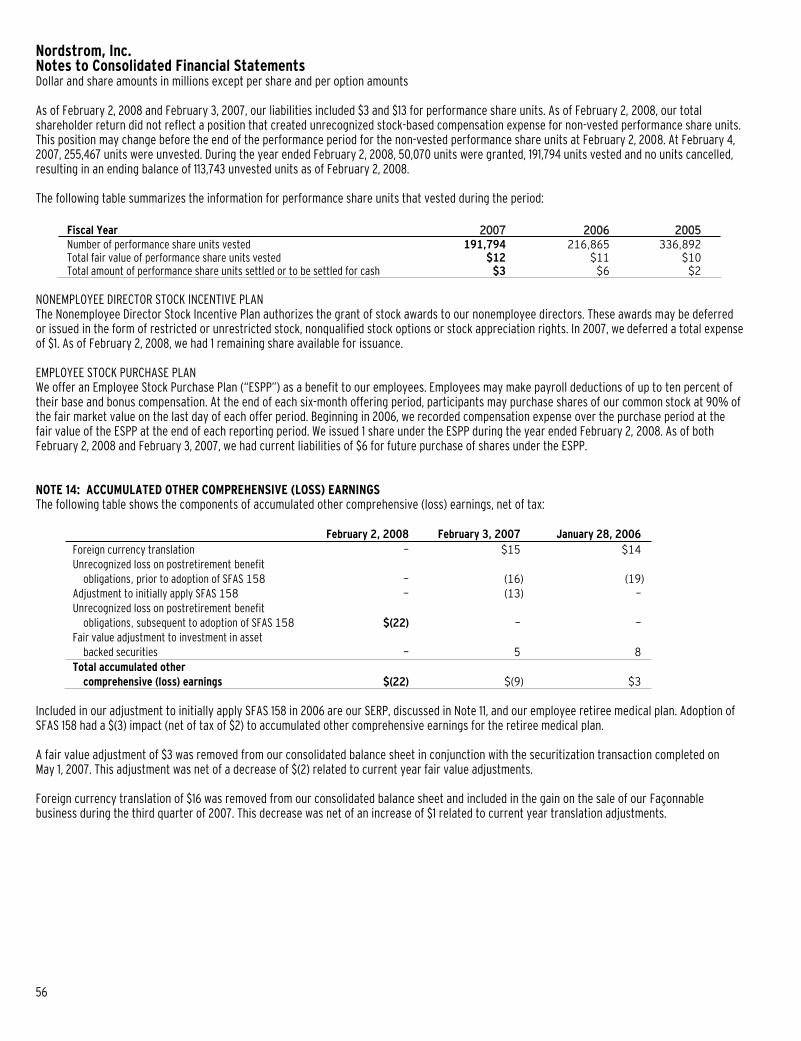
56
Nordstrom, Inc. Notes to Consolidated Financial Statements Dollar and share amounts in millions except per share and per option amounts
As of February 2, 2008 and February 3, 2007, our liabilities included $3 and $13 for performance share units. As of February 2, 2008, our total shareholder return did not reflect a position that created unrecognized stock-based compensation expense for non-vested performance share units. This position may change before the end of the performance period for the non-vested performance share units at February 2, 2008. At February 4, 2007, 255,467 units were unvested. During the year ended February 2, 2008, 50,070 units were granted, 191,794 units vested and no units cancelled, resulting in an ending balance of 113,743 unvested units as of February 2, 2008.
The following table summarizes the information for performance share units that vested during the period:
Fiscal Year 2007 2006 2005 Number of performance share units vested 191,794 216,865 336,892 Total fair value of performance share units vested $12 $11 $10 Total amount of performance share units settled or to be settled for cash $3 $6 $2
NONEMPLOYEE DIRECTOR STOCK INCENTIVE PLAN The Nonemployee Director Stock Incentive Plan authorizes the grant of stock awards to our nonemployee directors. These awards may be deferred or issued in the form of restricted or unrestricted stock, nonqualified stock options or stock appreciation rights. In 2007, we deferred a total expense of $1. As of February 2, 2008, we had 1 remaining share available for issuance.
EMPLOYEE STOCK PURCHASE PLAN We offer an Employee Stock Purchase Plan (“ESPP”) as a benefit to our employees. Employees may make payroll deductions of up to ten percent of their base and bonus compensation. At the end of each six-month offering period, participants may purchase shares of our common stock at 90% of the fair market value on the last day of each offer period. Beginning in 2006, we recorded compensation expense over the purchase period at the fair value of the ESPP at the end of each reporting period. We issued 1 share under the ESPP during the year ended February 2, 2008. As of both February 2, 2008 and February 3, 2007, we had current liabilities of $6 for future purchase of shares under the ESPP.
NOTE 14: ACCUMULATED OTHER COMPREHENSIVE (LOSS) EARNINGS The following table shows the components of accumulated other comprehensive (loss) earnings, net of tax:
February 2, 2008 February 3, 2007 January 28, 2006 Foreign currency translation — $15 $14 Unrecognized loss on postretirement benefit
obligations, prior to adoption of SFAS 158 — (16) (19) Adjustment to initially apply SFAS 158 — (13) —
Unrecognized loss on postretirement benefit obligations, subsequent to adoption of SFAS 158 $(22) — —
Fair value adjustment to investment in asset backed securities — 5 8 Total accumulated other
comprehensive (loss) earnings $(22) $(9) $3
Included in our adjustment to initially apply SFAS 158 in 2006 are our SERP, discussed in Note 11, and our employee retiree medical plan. Adoption of SFAS 158 had a $(3) impact (net of tax of $2) to accumulated other comprehensive earnings for the retiree medical plan.
A fair value adjustment of $3 was removed from our consolidated balance sheet in conjunction with the securitization transaction completed on May 1, 2007. This adjustment was net of a decrease of $(2) related to current year fair value adjustments.
Foreign currency translation of $16 was removed from our consolidated balance sheet and included in the gain on the sale of our Façonnable business during the third quarter of 2007. This decrease was net of an increase of $1 related to current year translation adjustments.
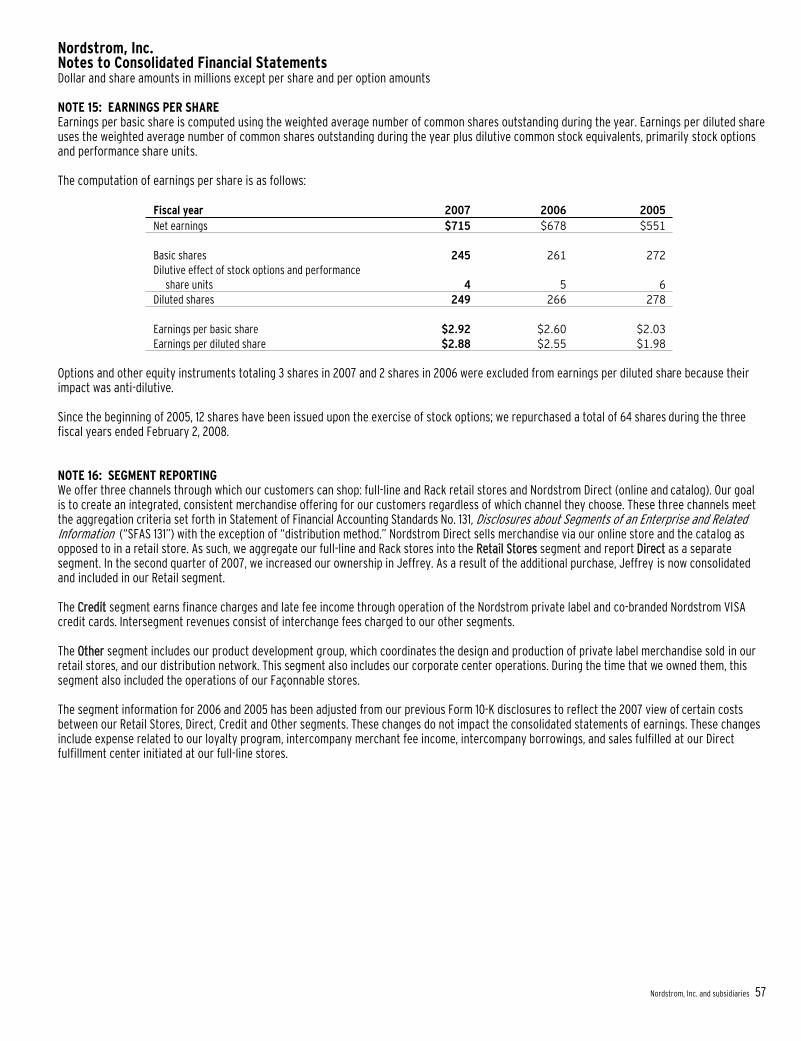
Nordstrom, Inc. and subsidiaries 57
Nordstrom, Inc. Notes to Consolidated Financial Statements Dollar and share amounts in millions except per share and per option amounts
NOTE 15: EARNINGS PER SHARE Earnings per basic share is computed using the weighted average number of common shares outstanding during the year. Earnings per diluted share uses the weighted average number of common shares outstanding during the year plus dilutive common stock equivalents, primarily stock options and performance share units.
The computation of earnings per share is as follows:
Fiscal year 2007 2006 2005 Net earnings $715 $678 $551
Basic shares 245 261 272 Dilutive effect of stock options and performance share units 4 5 6 Diluted shares 249 266 278
Earnings per basic share $2.92 $2.60 $2.03 Earnings per diluted share $2.88 $2.55 $1.98
Options and other equity instruments totaling 3 shares in 2007 and 2 shares in 2006 were excluded from earnings per diluted share because their impact was anti-dilutive.
Since the beginning of 2005, 12 shares have been issued upon the exercise of stock options; we repurchased a total of 64 shares during the three fiscal years ended February 2, 2008.
NOTE 16: SEGMENT REPORTING We offer three channels through which our customers can shop: full-line and Rack retail stores and Nordstrom Direct (online and catalog). Our goal is to create an integrated, consistent merchandise offering for our customers regardless of which channel they choose. These three channels meet the aggregation criteria set forth in Statement of Financial Accounting Standards No. 131, Disclosures about Segments of an Enterprise and Related Information (“SFAS 131”) with the exception of “distribution method.” Nordstrom Direct sells merchandise via our online store and the catalog as opposed to in a retail store. As such, we aggregate our full-line and Rack stores into the Retail Stores segment and report Direct as a separate segment. In the second quarter of 2007, we increased our ownership in Jeffrey. As a result of the additional purchase, Jeffrey is now consolidated and included in our Retail segment.
The Credit segment earns finance charges and late fee income through operation of the Nordstrom private label and co-branded Nordstrom VISAcredit cards. Intersegment revenues consist of interchange fees charged to our other segments.
The Other segment includes our product development group, which coordinates the design and production of private label merchandise sold in our retail stores, and our distribution network. This segment also includes our corporate center operations. During the time that we owned them, this segment also included the operations of our Façonnable stores.
The segment information for 2006 and 2005 has been adjusted from our previous Form 10-K disclosures to reflect the 2007 view of certain costs between our Retail Stores, Direct, Credit and Other segments. These changes do not impact the consolidated statements of earnings. These changes include expense related to our loyalty program, intercompany merchant fee income, intercompany borrowings, and sales fulfilled at our Direct fulfillment center initiated at our full-line stores.

58
Nordstrom, Inc. Notes to Consolidated Financial Statements Dollar and share amounts in millions except per share and per option amounts
The following table summarizes net sales by merchandise category:
Fiscal year 2007 2006 2005 Women’s apparel $3,063 $2,963 $2,710 Shoes 1,784 1,731 1,591 Men’s apparel 1,571 1,561 1,389 Cosmetics 950 942 847 Women’s accessories 941 848 720 Children’s apparel 285 286 266 Other 234 230 200 Total $8,828 $8,561 $7,723
The following table presents our sales by merchandise category as a percentage of net sales:
Fiscal year 2007 2006 2005 Women’s apparel 35% 35% 35% Shoes 20% 20% 21% Men’s apparel 18% 18% 18% Cosmetics 11% 11% 11% Women’s accessories 11% 10% 9% Children’s apparel 3% 3% 3% Other 2% 3% 3%
In general, we use the same measurements to compute earnings before income taxes for reportable segments as we do for the consolidated company. However, redemptions of our Nordstrom Notes® are included in net sales for our Retail Stores segment. The sales amount in our Other segment includes an entry to eliminate these transactions from our consolidated net sales. There is no impact to consolidated earnings before income taxes for this adjustment. In addition, our sales return reserve and other corporate adjustments are recorded in the Other segment. Other than described above, the accounting policies of the operating segments are the same as those described in the summary of significant accounting policies in Note 1.
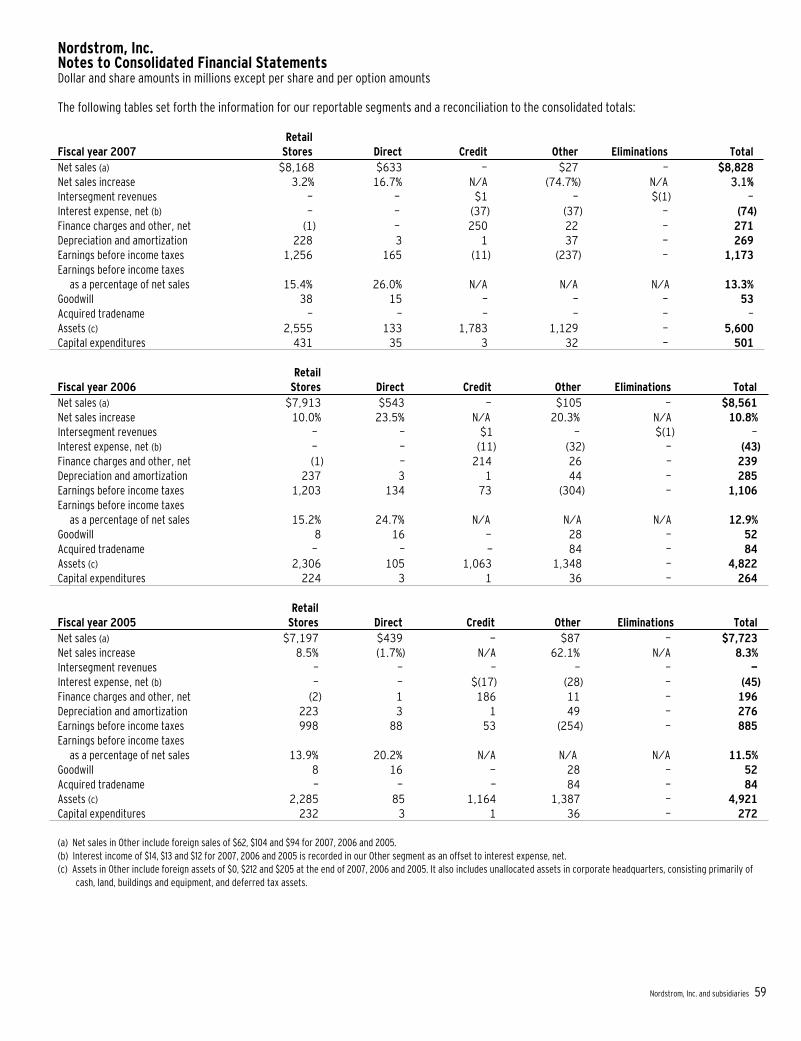
Nordstrom, Inc. and subsidiaries 59
Nordstrom, Inc. Notes to Consolidated Financial Statements Dollar and share amounts in millions except per share and per option amounts
The following tables set forth the information for our reportable segments and a reconciliation to the consolidated totals:
Retail Fiscal year 2007 Stores Direct Credit Other Eliminations Total Net sales (a) $8,168 $633 — $27 — $8,828 Net sales increase 3.2% 16.7% N/A (74.7%) N/A 3.1%Intersegment revenues — — $1 — $(1) —Interest expense, net (b) — — (37) (37) — (74)Finance charges and other, net (1) — 250 22 — 271Depreciation and amortization 228 3 1 37 — 269Earnings before income taxes 1,256 165 (11) (237) — 1,173Earnings before income taxes as a percentage of net sales 15.4% 26.0% N/A N/A N/A 13.3% Goodwill 38 15 — — — 53Acquired tradename — — — — — —Assets (c) 2,555 133 1,783 1,129 — 5,600Capital expenditures 431 35 3 32 — 501
Retail Fiscal year 2006 Stores Direct Credit Other Eliminations Total Net sales (a) $7,913 $543 - $105 — $8,561 Net sales increase 10.0% 23.5% N/A 20.3% N/A 10.8% Intersegment revenues — — $1 — $(1) —Interest expense, net (b) — — (11) (32) — (43)Finance charges and other, net (1) — 214 26 — 239Depreciation and amortization 237 3 1 44 — 285Earnings before income taxes 1,203 134 73 (304) — 1,106Earnings before income taxes as a percentage of net sales 15.2% 24.7% N/A N/A N/A 12.9% Goodwill 8 16 - 28 — 52Acquired tradename — — - 84 — 84Assets (c) 2,306 105 1,063 1,348 — 4,822Capital expenditures 224 3 1 36 — 264
Retail Fiscal year 2005 Stores Direct Credit Other Eliminations Total Net sales (a) $7,197 $439 - $87 — $7,723 Net sales increase 8.5% (1.7%) N/A 62.1% N/A 8.3%Intersegment revenues — — — — — —Interest expense, net (b) — — $(17) (28) — (45)Finance charges and other, net (2) 1 186 11 — 196Depreciation and amortization 223 3 1 49 — 276Earnings before income taxes 998 88 53 (254) — 885Earnings before income taxes as a percentage of net sales 13.9% 20.2% N/A N/A N/A 11.5%Goodwill 8 16 - 28 — 52Acquired tradename — — — 84 — 84Assets (c) 2,285 85 1,164 1,387 — 4,921Capital expenditures 232 3 1 36 — 272
(a) Net sales in Other include foreign sales of $62, $104 and $94 for 2007, 2006 and 2005. (b) Interest income of $14, $13 and $12 for 2007, 2006 and 2005 is recorded in our Other segment as an offset to interest expense, net. (c) Assets in Other include foreign assets of $0, $212 and $205 at the end of 2007, 2006 and 2005. It also includes unallocated assets in corporate headquarters, consisting primarily of
cash, land, buildings and equipment, and deferred tax assets.
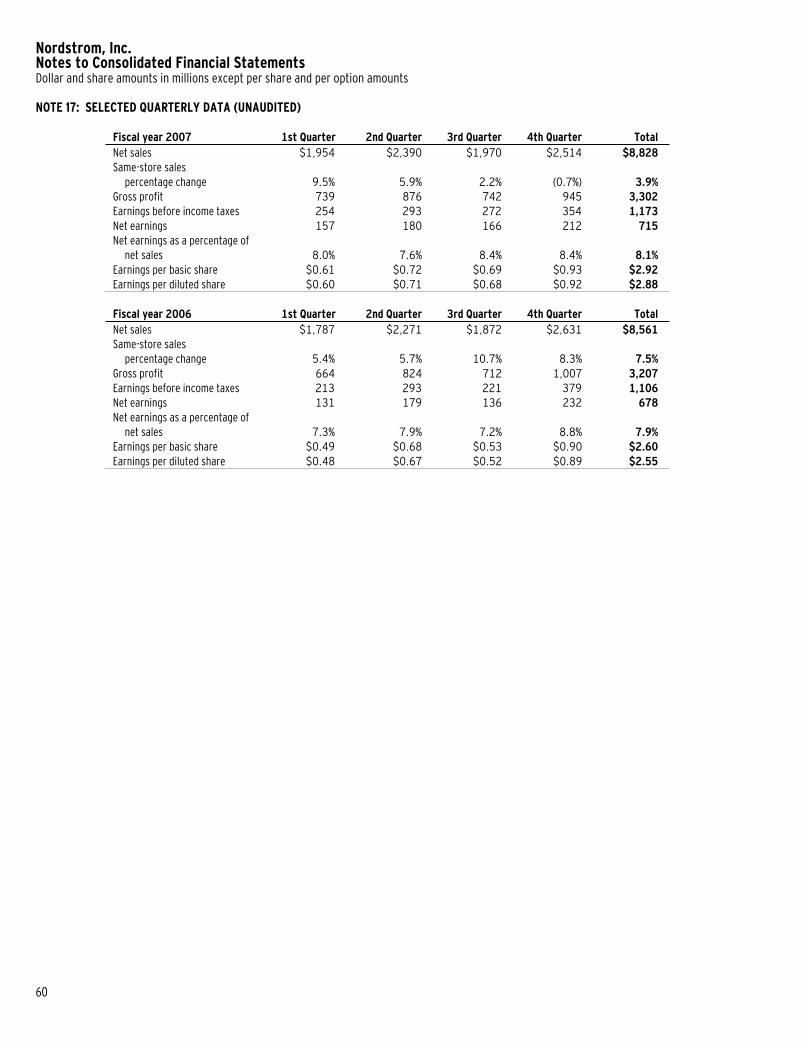
60
Nordstrom, Inc. Notes to Consolidated Financial Statements Dollar and share amounts in millions except per share and per option amounts
NOTE 17: SELECTED QUARTERLY DATA (UNAUDITED)
Fiscal year 2007 1st Quarter 2nd Quarter 3rd Quarter 4th Quarter Total Net sales $1,954 $2,390 $1,970 $2,514 $8,828 Same-store sales percentage change 9.5% 5.9% 2.2% (0.7%) 3.9% Gross profit 739 876 742 945 3,302 Earnings before income taxes 254 293 272 354 1,173 Net earnings 157 180 166 212 715 Net earnings as a percentage of net sales 8.0% 7.6% 8.4% 8.4% 8.1% Earnings per basic share $0.61 $0.72 $0.69 $0.93 $2.92 Earnings per diluted share $0.60 $0.71 $0.68 $0.92 $2.88
Fiscal year 2006 1st Quarter 2nd Quarter 3rd Quarter 4th Quarter Total Net sales $1,787 $2,271 $1,872 $2,631 $8,561 Same-store sales percentage change 5.4% 5.7% 10.7% 8.3% 7.5% Gross profit 664 824 712 1,007 3,207 Earnings before income taxes 213 293 221 379 1,106 Net earnings 131 179 136 232 678 Net earnings as a percentage of net sales 7.3% 7.9% 7.2% 8.8% 7.9% Earnings per basic share $0.49 $0.68 $0.53 $0.90 $2.60 Earnings per diluted share $0.48 $0.67 $0.52 $0.89 $2.55
Nordstrom, Inc. and subsidiaries 61
Item 9. Changes in and Disagreements With Accountants on Accounting and Financial Disclosure.
None.
Item 9A. Controls and Procedures.
As of the end of the period covered by this Annual Report on Form 10-K, the Company performed an evaluation under the supervision and with the participation of management, including our President and Chief Financial Officer, of the design and effectiveness of our disclosure controls and procedures (as defined in rules 13a-15(e) or 15d-15(e) under the Securities Exchange Act of 1934 (the “Exchange Act”)). Based upon that evaluation, our President and our Chief Financial Officer concluded that, as of the end of the period covered by this Annual Report, our disclosure controls and procedures were effective in the timely and accurate recording, processing, summarizing and reporting of material financial and non-financial information within the time periods specified within the Commission’s rules and forms. Our President and Chief Financial Officer also concluded that our disclosure controls and procedures were effective to ensure that information required to be disclosed in the reports that we file or submit under the Exchange Act is accumulated and communicated to our management, including our President and Chief Financial Officer, to allow timely discussions regarding required disclosure.
There have been no changes in our internal control over financial reporting (as defined in Rules 13a-15(f) or 15d-15(f) of the Exchange Act) duringour most recently completed fiscal quarter that have materially affected, or are reasonably likely to materially affect, our internal control over financial reporting.
The following information required under this item is filed as part of this report:
PageManagement Responsibility for Financial Information 33 Management’s Report on Internal Control Over Financial Reporting 33 Report of Independent Registered Public Accounting Firm 34
Item 9B. Other Information.
None.
PART III
Item 10. Directors, Executive Officers and Corporate Governance of the Registrant.
The information required under this item is included in the following sections of our Proxy Statement for our 2008 Annual Meeting of Shareholders, which sections are incorporated by reference herein and will be filed within 120 days after the end of our fiscal year:
Executive Officers Election of Directors Board Committees Director Nominating Process Web site Access to Corporate Governance Documents Section 16(a) Beneficial Ownership Reporting Compliance Corporate Governance
The certifications of our President and Chief Financial Officer required pursuant to Sections 302 and 906 of the Sarbanes-Oxley Act of 2002 are included as exhibits to this Annual Report on Form 10-K and were included as exhibits to each of our quarterly reports on Form 10-Q. Our President certified to the New York Stock Exchange (NYSE) on June 14, 2007 pursuant to Section 303A.12(a) of the NYSE’s listing standards, that he was not aware of any violation by the Company of the NYSE’s corporate governance listing standards as of that date.
Item 11. Executive Compensation.
The information required under this item is included in the following sections of our Proxy Statement for our 2008 Annual Meeting of Shareholders, which sections are incorporated by reference herein and will be filed within 120 days after the end of our fiscal year:
Compensation of Executive Officers Compensation Committee Report Director Compensation Compensation Committee Interlocks and Insider Participation

62
Item 12. Security Ownership of Certain Beneficial Owners and Management and Related Shareholder Matters.
The information required under this item is included in the following section of our Proxy Statement for our 2008 Annual Meeting of Shareholders, which sections are incorporated by reference herein and will be filed within 120 days after the end of our fiscal year:
Security Ownership of Certain Beneficial Owners and Management Equity Compensation Plans
Item 13. Certain Relationships and Related Transactions.
The information required under this item is included in the following sections of our Proxy Statement for our 2008 Annual Meeting of Shareholders, which sections are incorporated by reference herein and will be filed within 120 days after the end of our fiscal year:
Election of Directors Certain Relationships and Related Transactions
Item 14. Principal Accountant Fees and Services.
The information required under this item is included in the following section of our Proxy Statement for our 2008 Annual Meeting of Shareholders, which section is incorporated by reference herein and will be filed within 120 days after the end of our fiscal year:
Ratification of the Appointment of Independent Registered Public Accounting Firm
PART IV
Item 15. Exhibits, Financial Statement Schedules.
The following information required under this item is filed as part of this report:
(a)1. FINANCIAL STATEMENTS Page
Management Responsibility for Financial Information 33 Management’s Report on Internal Control Over Financial Reporting 33 Report of Independent Registered Public Accounting Firm 34 Report of Independent Registered Public Accounting Firm 35 Consolidated Statements of Earnings 36 Consolidated Balance Sheets 37 Consolidated Statements of Shareholders’ Equity 38 Consolidated Statements of Cash Flows 39
(a)2. FINANCIAL STATEMENT SCHEDULE Page
Schedule II - Valuation and Qualifying Accounts 65
(a)3. EXHIBITS
Exhibits are incorporated herein by reference or are filed with this report as set forth in the Index to Exhibits on pages 66 through 70 hereof.
All other schedules and exhibits are omitted because they are not applicable, not required, or because the information required has been given as part of this report.

Nordstrom, Inc. and subsidiaries 63
SIGNATURES
Pursuant to the requirements of Section 13 or 15(d) of the Securities Exchange Act of 1934, the Registrant has duly caused this report to be signed on its behalf by the undersigned, thereunto duly authorized.
NORDSTROM, INC. (Registrant)
/s/ Michael G. KoppelMichael G. Koppel
Executive Vice President and Chief Financial Officer(Principal Financial Officer)
Date: March 21, 2008
Pursuant to the requirements of the Securities Exchange Act of 1934, this report has been signed below by the following persons on behalf of the Registrant and in the capacities and on the date indicated.
Principal Financial Officer: Principal Executive Officer:
/s/ Michael G. Koppel /s/ Blake W. NordstromMichael G. Koppel Blake W. Nordstrom
Executive Vice President and Chief Financial Officer President
Principal Accounting Officer:
/s/ James A. HowellJames A. Howell
Vice President – Finance
Directors:
/s/ Phyllis J. Campbell /s/ Enrique Hernandez, Jr.Phyllis J. Campbell Enrique Hernandez, Jr.
Director Chairman of the Board of Directors
/s/ Robert G. MillerJeanne P. Jackson Robert G. Miller
Director Director
/s/ Blake W. Nordstrom /s/ Erik B. NordstromBlake W. Nordstrom Erik B. Nordstrom
Director Director
/s/ Peter E. Nordstrom /s/ Philip G. SatrePeter E. Nordstrom Philip G. Satre
Director Director
/s/ Alison A. WinterAlison A. Winter
Director
Date: March 21, 2008

64
CONSENT OF INDEPENDENT REGISTERED PUBLIC ACCOUNTING FIRM
To the Board of Directors and Shareholders of Nordstrom, Inc.:
We consent to the incorporation by reference in Registration Statement Nos. 033-18321, 333-63403, 333-40064, 333-40066, 333-79791, 333-101110, 333-118756, and 333-146049 on Form S-8 and Nos. 333-59840, 333-69281, and 333-147664 on Form S-3 of our report dated March 20, 2008, relating to the consolidated financial statements and financial statement schedule of Nordstrom, Inc. (which report expressed an unqualified opinion and included an explanatory paragraph regarding the change in accounting for stock-based compensation upon adoption of Statement of Financial Accounting Standards No. 123(R), Share-Based Payment), and our report dated March 20, 2008, relating to the effectiveness of Nordstrom, Inc.’s internal control over financial reportingappearing in this Annual Report on Form 10-K of Nordstrom, Inc. for the year ended February 2, 2008.
/s/ Deloitte & Touche LLP Seattle, Washington March 21, 2008

Nordstrom, Inc. and subsidiaries 65
NORDSTROM, INC. AND SUBSIDIARIES
SCHEDULE II - VALUATION AND QUALIFYING ACCOUNTS
(Dollars in millions)
Column A Column B Column C Column D Column E Additions
Description Balance at beginning
of period Charged to costs
and expenses Deductions Balance at end of period
Deducted from related consolidated balance sheet account
Allowance for doubtful accounts: Year ended:
February 2, 2008 $17 $86 (A) $30 (B) $73 February 3, 2007 18 17 18 (B) 17 January 28, 2006 19 21 22 (B) 18
Reserves Allowance for sales return, net: Year ended:
February 2, 2008 $55 $1,023 $1,022 (C) $56 February 3, 2007 51 894 890 (C) 55 January 28, 2006 50 805 804 (C) 51
(A) These expenses do not include write-offs of $21 related to the one-time transition of our VISA portfolio to on-balance sheet, which were included in Finance charges and other, net. (B) Deductions consist of write-offs of uncollectible accounts, net of recoveries. (C) Deductions consist of actual returns offset by the value of the merchandise returned and the sales commission reversed.
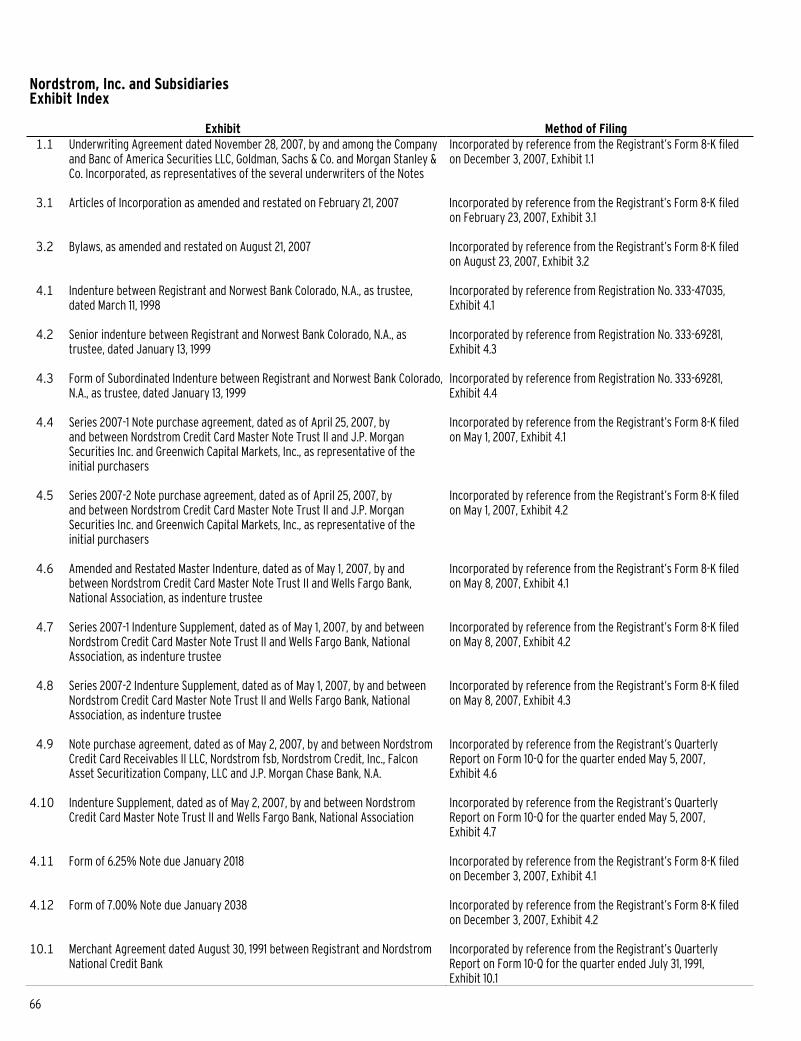
66
Nordstrom, Inc. and Subsidiaries Exhibit Index
Exhibit Method of Filing 1.1 Underwriting Agreement dated November 28, 2007, by and among the Company
and Banc of America Securities LLC, Goldman, Sachs & Co. and Morgan Stanley & Co. Incorporated, as representatives of the several underwriters of the Notes
Incorporated by reference from the Registrant’s Form 8-K filed on December 3, 2007, Exhibit 1.1
3.1 Articles of Incorporation as amended and restated on February 21, 2007 Incorporated by reference from the Registrant’s Form 8-K filed on February 23, 2007, Exhibit 3.1
3.2 Bylaws, as amended and restated on August 21, 2007 Incorporated by reference from the Registrant’s Form 8-K filed on August 23, 2007, Exhibit 3.2
4.1 Indenture between Registrant and Norwest Bank Colorado, N.A., as trustee, dated March 11, 1998
Incorporated by reference from Registration No. 333-47035, Exhibit 4.1
4.2 Senior indenture between Registrant and Norwest Bank Colorado, N.A., as trustee, dated January 13, 1999
Incorporated by reference from Registration No. 333-69281, Exhibit 4.3
4.3 Form of Subordinated Indenture between Registrant and Norwest Bank Colorado, N.A., as trustee, dated January 13, 1999
Incorporated by reference from Registration No. 333-69281, Exhibit 4.4
4.4 Series 2007-1 Note purchase agreement, dated as of April 25, 2007, by and between Nordstrom Credit Card Master Note Trust II and J.P. Morgan Securities Inc. and Greenwich Capital Markets, Inc., as representative of the initial purchasers
Incorporated by reference from the Registrant’s Form 8-K filed on May 1, 2007, Exhibit 4.1
4.5 Series 2007-2 Note purchase agreement, dated as of April 25, 2007, by and between Nordstrom Credit Card Master Note Trust II and J.P. Morgan Securities Inc. and Greenwich Capital Markets, Inc., as representative of the initial purchasers
Incorporated by reference from the Registrant’s Form 8-K filed on May 1, 2007, Exhibit 4.2
4.6 Amended and Restated Master Indenture, dated as of May 1, 2007, by and between Nordstrom Credit Card Master Note Trust II and Wells Fargo Bank, National Association, as indenture trustee
Incorporated by reference from the Registrant’s Form 8-K filed on May 8, 2007, Exhibit 4.1
4.7 Series 2007-1 Indenture Supplement, dated as of May 1, 2007, by and between Nordstrom Credit Card Master Note Trust II and Wells Fargo Bank, National Association, as indenture trustee
Incorporated by reference from the Registrant’s Form 8-K filed on May 8, 2007, Exhibit 4.2
4.8 Series 2007-2 Indenture Supplement, dated as of May 1, 2007, by and between Nordstrom Credit Card Master Note Trust II and Wells Fargo Bank, National Association, as indenture trustee
Incorporated by reference from the Registrant’s Form 8-K filed on May 8, 2007, Exhibit 4.3
4.9 Note purchase agreement, dated as of May 2, 2007, by and between Nordstrom Credit Card Receivables II LLC, Nordstrom fsb, Nordstrom Credit, Inc., Falcon Asset Securitization Company, LLC and J.P. Morgan Chase Bank, N.A.
Incorporated by reference from the Registrant’s Quarterly Report on Form 10-Q for the quarter ended May 5, 2007, Exhibit 4.6
4.10 Indenture Supplement, dated as of May 2, 2007, by and between Nordstrom Credit Card Master Note Trust II and Wells Fargo Bank, National Association
Incorporated by reference from the Registrant’s Quarterly Report on Form 10-Q for the quarter ended May 5, 2007, Exhibit 4.7
4.11 Form of 6.25% Note due January 2018 Incorporated by reference from the Registrant’s Form 8-K filed on December 3, 2007, Exhibit 4.1
4.12 Form of 7.00% Note due January 2038 Incorporated by reference from the Registrant’s Form 8-K filed on December 3, 2007, Exhibit 4.2
10.1 Merchant Agreement dated August 30, 1991 between Registrant and Nordstrom National Credit Bank
Incorporated by reference from the Registrant’s Quarterly Report on Form 10-Q for the quarter ended July 31, 1991, Exhibit 10.1

Nordstrom, Inc. and subsidiaries 67
Exhibit Method of Filing 10.2 Nordstrom Supplemental Executive Retirement Plan (2003 Restatement) Incorporated by reference from the Registrant’s Quarterly
Report on Form 10-Q for the quarter ended November 1, 2003, Exhibit 10.1
10.3 Investment Agreement dated October 8, 1984 between the Registrant and Nordstrom Credit, Inc.
Incorporated by reference from the Nordstrom Credit, Inc. Form 10, Exhibit 10.1
10.4 1997 Nordstrom Stock Option Plan, amended and restated on February 16, 2000
Incorporated by reference from the Registrant’s Quarterly Report on Form 10-Q for the quarter ended August 2, 2003, Exhibit 10.1
10.5 Amendment 2005-1 to the Nordstrom 401(k) Plan & Profit Sharing dated January 1, 2004
Incorporated by reference from the Registrant’s Annual Report on Form 10-K for the year ended January 28, 2006, Exhibit 10.6
10.6 Amendment 2005-2 to the Nordstrom 401(k) Plan & Profit Sharing dated January 1, 2004
Incorporated by reference from the Registrant’s Annual Report on Form 10-K for the year ended January 28, 2006, Exhibit 10.7
10.7 Commercial Paper Dealer Agreement dated October 2, 1997 between Registrant and Bancamerica Securities, Inc.
Incorporated by reference from the Registrant’s Quarterly Report on Form 10-Q for the quarter ended October 31, 1997, Exhibit 10.1
10.8 Commercial Paper Agreement dated October 2, 1997 between Registrant and Credit Suisse First Boston Corporation
Incorporated by reference from the Registrant’s Quarterly Report on Form 10-Q for the quarter ended October 31, 1997, Exhibit 10.2
10.9 Issuing and Paying Agency Agreement dated October 2, 1997 between Registrant and First Trust of New York, N.A.
Incorporated by reference from the Registrant’s Quarterly Report on Form 10-Q for the quarter ended October 31, 1997, Exhibit 10.3
10.10 Performance Undertaking dated December 4, 2001 between Registrant and Bank One, N.A.
Incorporated by reference from the Registrant’s Annual Report on Form 10-K for the year ended January 31, 2002, Exhibit 10.38
10.11 Promissory Note dated April 18, 2002 between 1700 Seventh, L.P. and New York Life Insurance Company
Incorporated by reference from the Registrant’s Quarterly Report on Form 10-Q for the quarter ended April 30, 2002, Exhibit 10.2
10.12 Promissory Note dated April 18, 2002 between 1700 Seventh, L.P. and Life Investors Insurance Company of America
Incorporated by reference from the Registrant’s Quarterly Report on Form 10-Q for the quarter ended April 30, 2002, Exhibit 10.3
10.13 Guaranty Agreement dated April 18, 2002 between Registrant, New York Life Insurance Company and Life Investors Insurance Company of America
Incorporated by reference from the Registrant’s Quarterly Report on Form 10-Q for the quarter ended April 30, 2002, Exhibit 10.4
10.14 The 2002 Nonemployee Director Stock Incentive Plan Incorporated by reference from the Registrant’s Quarterly Report on Form 10-Q for the quarter ended July 31, 2002, Exhibit 10.1
10.15 Nordstrom, Inc. Leadership Separation Plan (Restated Effective March 1, 2005) Incorporated by reference from Registrant’s Annual Report on Form 10-K for the year ended January 29, 2005, Exhibit 10.43
10.16 Nordstrom, Inc. Executive Management Group Bonus Plan Incorporated by reference from Registrant’s definitive proxy statement filed with the Commission on April 15, 2004
10.17 2004 Equity Incentive Plan Incorporated by reference from Registrant’s definitive proxy statement filed with the Commission on April 15, 2004

68
Exhibit Method of Filing 10.18 Commitment of Nordstrom, Inc. to Nordstrom fsb dated June 17, 2004 Incorporated by reference from the Registrant’s Quarterly
Report on Form 10-Q for the quarter ended July 31, 2004, Exhibit 10.4
10.19 Nordstrom fsb Segregated Earmarked Deposit Agreement and Security Agreement by and between Nordstrom fsb and Nordstrom, Inc. dated July 1, 2004
Incorporated by reference from the Registrant’s Quarterly Report on Form 10-Q for the quarter ended July 31, 2004, Exhibit 10.5
10.20 Revolving Credit Facility Agreement dated November 4, 2005, between Registrant and each of the initial lenders named therein as Lenders, JPMorgan Chase Bank, N.A. and Wells Fargo Bank, N.A., as Syndication Agents, U.S. Bank, National Association, as Documentation Agent and Bank of America, N.A. as administrative agent
Incorporated by reference from the Registrant’s Quarterly Report on Form 10-Q for the quarter ended October 29, 2005, Exhibit 10.1
10.21 Press release dated August 21, 2007 announcing that its Board of Directors authorized a $1.5 billion share repurchase program
Incorporated by reference from the Registrant’s Form 8-K filed on May 8, 2007, Exhibit 99.6
10.22 Press release dated November 19, 2007 announcing that its Board of Directors authorized a $1.0 billion share repurchase program
Incorporated by reference from the Registrant’s Form 8-K filed on May 8, 2007, Exhibit 99.6
10.23 Director Compensation Summary Incorporated by reference from the Registrant’s Annual Report on Form 10-K for the year ended February 3, 2007, Exhibit 10.54
10.24 Nordstrom, Inc. Employee Stock Purchase Plan (2006 Restatement) Incorporated by reference from the Registrant’s definitive proxy statement on Schedule 14A filed with the Commission on April 13, 2006, Exhibit 10.4
10.25 2007 Stock Option Notice Award Agreement and Form of Notice Incorporated by reference from the Registrant’s Form 8-K filed on February 26, 2007, Exhibit 10.1
10.26 2007 Performance Share Unit Award Agreement and Form of Notice Incorporated by reference from the Registrant’s Form 8-K filed on February 26, 2007, Exhibit 10.2
10.27 Form of Restricted Stock Award under the 2002 Nonemployee Director Stock Incentive Plan
Incorporated by reference from the Registrant’s Quarterly Report on Form 10-Q for the quarter ended August 4, 2007, Exhibit 10.1
10.28 Nordstrom, Inc. 2002 Nonemployee Director Stock Incentive Plan (2007 Amendment)
Incorporated by reference from the Registrant’s Form 8-K filed on November 19, 2007, Exhibit 10.39
10.29 Nordstrom Executive Deferred Compensation Plan (2007 Restatement) Incorporated by reference from the Registrant’s Form 8-K filedon November 19, 2007, Exhibit 10.40
10.30 Nordstrom Directors Deferred Compensation Plan (2007 Restatement) Incorporated by reference from the Registrant’s Form 8-K filedon November 19, 2007, Exhibit 10.41
10.31 Nordstrom, Inc. 2004 Equity Incentive Plan (2007 Amendment) Incorporated by reference from the Registrant’s Form 8-K filed on November 19, 2007, Exhibit 10.44
10.32 First Amendment to Merchant Agreement and Operating Procedures dated August 30, 1991 between Registrant and Nordstrom National Credit Bank,dated March 1, 2000
Filed herewith electronically
10.33 Second Amendment to Merchant Agreement and Operating Procedures dated August 30, 1991 between Registrant and Nordstrom National Credit Bank,dated March 2, 2000
Filed herewith electronically
10.34 Third Amendment to Merchant Agreement and Operating Procedures dated August 30, 1991 between Registrant and Nordstrom National Credit Bank,dated October 1, 2001
Filed herewith electronically

Nordstrom, Inc. and subsidiaries 69
Exhibit Method of Filing 10.35 Fourth Amendment to Merchant Agreement and Operating Procedures dated
August 30, 1991 between Registrant and Nordstrom National Credit Bank, dated November 1, 2002
Filed herewith electronically
10.36 Fifth Amendment to Merchant Agreement and Operating Procedures dated
August 30, 1991 between Registrant and Nordstrom National Credit Bank, dated November 1, 2005
Filed herewith electronically
10.37 Sixth Amendment to Merchant Agreement and Operating Procedures dated
August 30, 1991 between Registrant and Nordstrom National Credit Bank, dated May 1, 2007
Filed herewith electronically
10.38 Forms of Notice of 1999 Stock Option Grant and Stock Option Agreements under
the Nordstrom, Inc. 1997 Equity Incentive Plan Filed herewith electronically
10.39 Form of Notice of 2000 Stock Option Grant and Stock Option Agreement under
the Nordstrom, Inc. 1997 Equity Incentive Plan Filed herewith electronically
10.40 Forms of Notice of 2001 Stock Option Grant and Stock Option Agreement under
the Nordstrom, Inc. 1997 Equity Incentive Plan Filed herewith electronically
10.41 Form of Notice of 2002 Stock Option Grant and Stock Option Agreement under
the Nordstrom, Inc. 1997 Equity Incentive Plan Filed herewith electronically
10.42 Form of Notice of 2003 Stock Option Grant and Stock Option Agreement under
the Nordstrom, Inc. 1997 Equity Incentive Plan Filed herewith electronically
10.43 Form of Notice of 2004 Stock Option Grant and Stock Option Agreement under
the Nordstrom, Inc. 1997 Equity Incentive Plan Filed herewith electronically
10.44 Form of Notice of 2005 Stock Option Grant and Stock Option Agreement under
the Nordstrom, Inc. 2004 Equity Incentive Plan Incorporated by reference from the Registrant’s Form 8-K filed on March 1, 2005, Exhibit 10.1
10.45 Form of Notice of 2006 Stock Option Grant and Stock Option Agreement under
the Nordstrom, Inc. 2004 Equity Incentive Plan Filed herewith electronically
10.46 Form of 2006 Performance Share Unit Notice and Performance Share Unit
Award Agreement Incorporated by reference from the Registrant’s Form 8-K filed on February 28, 2006, Exhibit 10.1
10.47 Nordstrom 401(K) Plan & Profit Sharing, as amended and restated on
January 1, 2004 Incorporated by reference from the Registrant’s Annual Report on Form 11-K for the year ended December 31, 2003, Exhibit 99.2
10.48 Employment Letter with Mr. Paul Favaro, effective February 1, 2005 Incorporated by reference from the Registrant’s Form 8-K filed on January 12, 2005, Exhibit 99.1
10.49 Participation Agreement, dated as of May 1, 2007, by and between Nordstrom fsb, a seller and Nordstrom Credit, Inc., as purchaser
Incorporated by reference from the Registrant’s Form 8-K filed on May 8, 2007, Exhibit 99.1
10.50 Servicing Agreement, dated as of May 1, 2007, by and between Nordstrom fsb, and Nordstrom Credit, Inc.
Incorporated by reference from the Registrant’s Form 8-K filed on May 8, 2007, Exhibit 99.2
10.51 Amended and Restated Receivables Purchase Agreement, dated as of May 1, 2007, by and between Nordstrom Credit, Inc., as seller and Nordstrom Credit Card Receivables II LLC, as purchaser
Incorporated by reference from the Registrant’s Form 8-K filed on May 8, 2007, Exhibit 99.3
10.52 Amended and Restated Transfer and Servicing Agreement, dated as of May 1, 2007, by and between Nordstrom Credit Card Receivables II LLC, as transferor, Nordstrom fsb, as servicer, Wells Fargo Bank, National Association, as indenture trustee, and Nordstrom Credit Card Master Note Trust II, as issuer
Incorporated by reference from the Registrant’s Form 8-K filed on May 8, 2007, Exhibit 99.4

70
Exhibit Method of Filing 10.53 Second Amended and Restated Trust Agreement, dated as of May 1, 2007, by and
between Nordstrom Credit Card Receivables II LLC, as transferor, and Wilmington Trust Company, as owner trustee
Incorporated by reference from the Registrant’s Form 8-K filed on May 8, 2007, Exhibit 99.5
10.54 Amended and Restated Administration Agreement, dated as of May 1, 2007, by and between Nordstrom Credit Card Master Note Trust II, as issuer, and Nordstrom fsb, as administrator
Incorporated by reference from the Registrant’s Form 8-K filed on May 8, 2007, Exhibit 99.6
10.55 Form of 2005 Performance Share Unit Notice and Performance Share Unit Award Agreement
Incorporated by reference from the Registrant’s Form 8-K filed on March 1, 2005, Exhibit 10.2
10.56 Amendment 2006-1 to the Nordstrom, Inc. Leadership Separation Plan Filed herewith electronically
21.1 Significant subsidiaries of the Registrant Filed herewith electronically
23.1 Consent of Independent Registered Public Accounting Firm Filed as page 64 of this report
31.1 Certification of President required by Section 302(a) of the Sarbanes- Oxley Act of 2002
Filed herewith electronically
31.2 Certification of Chief Financial Officer required by Section 302(a) of the Sarbanes-Oxley Act of 2002
Filed herewith electronically
32.1 Certification of President and Chief Financial Officer pursuant to 18 U.S.C. 1350, as adopted pursuant to Section 906 of the Sarbanes-Oxley Act of 2002
Furnished herewith electronically
Nordstrom, Inc. and subsidiaries 71
Executive Officers
Laurie M. Black, 49 Executive Vice President, General Merchandise Manager, Cosmetics Division
Paul F. Favaro, 50 Executive Vice President, Strategy and Development
Linda Toschi Finn, 60Executive Vice President, Marketing
James A. Howell, 42 Vice President, Finance
Lisa G. Iglesias, 42 Executive Vice President, GeneralCounsel and Corporate Secretary
Jeffrey S. Kalinsky, 45 Executive Vice President,Designer Merchandising
Kevin T. Knight, 52Executive Vice President, Chairman and Chief Executive Officer of Nordstrom fsb, President, Nordstrom Credit, Inc.
Michael G. Koppel, 51 Executive Vice President and Chief Financial Officer
Daniel F. Little, 46 Executive Vice President and Chief Administrative Officer
David Loretta, 40 Treasurer and Vice President
Scott A. Meden, 45 Executive Vice President and President, Nordstrom Rack
Jack H. Minuk, 53 Executive Vice President, General Merchandise Manager, Shoe Division
Margaret Myers, 61 Executive Vice President, General Merchandise Manager, Accessories and Women’s Specialized Divisions
Blake W. Nordstrom, 47President
Erik B. Nordstrom, 44 Executive Vice President,President of Stores
James (Jamie) F. Nordstrom, Jr., 35Executive Vice President,President, Nordstrom Direct
Peter E. Nordstrom, 46Executive Vice President,President of Merchandising
James R. O’Neal, 49Executive Vice President and President, Nordstrom Product Group
Loretta Soffe, 41 Executive Vice President, General Merchandise Manager, Women’s Apparel Division
Delena M. Sunday, 47Executive Vice President, Human Resources and Diversity Affairs
David M. Witman, 49Executive Vice President,General Merchandise Manager,Menswear and Kidswear Divisions

72
Board of Directors and Committees
Board of Directors
Phyllis J. Campbell, 56 President and CEO, The Seattle Foundation Seattle, Washington
Enrique Hernandez, Jr., 52 Nordstrom, Inc. Chairman of the Board President and CEO, Inter-Con Security Systems, Inc. Pasadena, California
Jeanne P. Jackson, 56Founder and General Partner, MSP Capital Newport Beach, California
Robert G. Miller, 63 Chairman of the Board of Directors, Rite-Aid, Inc. Camp Hill, Pennsylvania andChief Executive Officer, Albertsons LLC Boise, Idaho
Blake W. Nordstrom, 47 PresidentNordstrom, Inc. Seattle, Washington
Erik B. Nordstrom, 44 Executive Vice President and President of Stores Nordstrom, Inc. Seattle, Washington
Peter E. Nordstrom, 46Executive Vice President and President of Merchandising Nordstrom, Inc. Seattle, Washington
Philip G. Satre, 58Private Equity Investor Reno, Nevada
Alison A. Winter, 61 FounderBraintree Holdings, LLC Pasadena, California
Audit Committee Phyllis J. Campbell, Chair Jeanne P. Jackson Robert G. Miller Philip G. Satre Alison A. Winter
Compensation Committee Alison A. Winter, Chair Enrique Hernandez, Jr. Jeanne P. Jackson Robert G. Miller
Corporate Governance andNominating Committee Enrique Hernandez, Jr., Chair Philip G. Satre Alison A. Winter
Executive Committee Enrique Hernandez, Jr., Chair Blake W. Nordstrom Erik B. Nordstrom Peter E. Nordstrom
Finance Committee Jeanne P. Jackson, Chair Phyllis J. Campbell Robert G. Miller Peter E. Nordstrom Philip G. Satre

Nordstrom, Inc. and subsidiaries 73
Shareholder Information
Independent Registered Public Accounting Firm Deloitte & Touche LLP Seattle, Washington
CounselLane Powell PC Seattle, Washington
Transfer Agent and Registrar The Bank of New York Mellon P. O. Box 3316 South Hackensack, New Jersey 07606 Telephone (800) 318-7045 TDD for Hearing Impaired (800) 231-5469 Foreign Shareholders (201) 329-8660 TDD Foreign Shareholders (201) 329-8354
General Offices 1617 Sixth Avenue Seattle, Washington 98101-1742 Telephone (206) 628-2111
Annual Meeting May 20, 2008 at 11:00 a.m. Pacific Daylight Time Benaroya Hall Illsley Ball Nordstrom Recital Hall 200 University Street Seattle, Washington 98101-3428
Form 10-K The Company’s annual report on Form 10-K for the year ended February 2, 2008 will be provided to shareholders upon request to:
Nordstrom, Inc. Investor Relations P. O. Box 2737 Seattle, Washington 98111 (206) 303-3200 [email protected]
Shareholder Information Additional shareholder information, including Nordstrom’s Corporate Governance Guidelines and Code of Business Conduct and Ethics, is available online at www.nordstrom.com(Investor Relations, Corporate Governance). The Company intends to provide disclosure of any amendments or waivers to its Code of Business Conduct and Ethics online within four business days following the date of amendment or waiver. In addition, the Company is always willing to discussmatters of concern to shareholders. (206) 303-3200 [email protected]
Certifications We have filed the required certifications under Section 302 of the Sarbanes-Oxley Act of 2002 regarding the quality of our public disclosures as Exhibits 31.1 and 31.2 to our annual report on Form 10-K for the year ended February 2, 2008. After our 2008 Annual Meeting of Shareholders, we intend to file with the New York Stock Exchange the CEO certification regarding our compliance with the NYSE’s corporate governance listing standards as required by NYSE Rule 303A.12(a).
© 2007 Nordstrom, Inc.


AN
NU
AL
RE
PO
RT
20
07
PLEASE RECYCLE
Nordstrom, Inc. Annual Report2 700