a multi-objective robust optimization model for location...
TRANSCRIPT

Scientia Iranica E (2015) 22(6), 2604{2620
Sharif University of TechnologyScientia Iranica
Transactions E: Industrial Engineeringwww.scientiairanica.com
A multi-objective robust optimization model forlocation-allocation decisions in two-stage supply chainnetwork and solving it with non-dominated sorting antcolony optimization
J. Bagherinejad� and M. Dehghani
Department of Industrial Engineering, Faculty of Engineering and Technology, Alzahra University, Tehran, Iran.
Received 29 October 2013; received in revised form 11 July 2014; accepted 28 September 2014
KEYWORDSRobust multi-objectiveoptimization;Location-allocation;Multi-vehicle;Uncertainty;Non-dominatedsorting ant colonyoptimization;NSGA-II.
Abstract. This study proposes a new, robust multi-objective model for capacitated multi-vehicle allocation of customers to potential Distribution Centers (DCs) under uncertainenvironment. Uncertainty is de�ned by discrete scenarios on demands where occurrenceprobability of each scenario is known. The optimization objectives are to minimize transittime and total cost, including opening cost, assumed for opening potential DCs and shippingcost from DCs to the customers, where considering di�erent types of vehicles leads to amore realistic model and causes more con ict in these two objectives. A swarm intelligence-based algorithm named Non-dominated Sorting Ant Colony Optimization (NSACO) isused as the optimization tool. The proposed methodology is based on a new variant ofAnt Colony Optimization (ACO) customized in multi-objective optimization problem ofthis research. For ensuring the authenticity of the proposed method, the computationalresults are compared with those obtained by NSGA-II. Results show the advantages andthe e�ectiveness of the used method in reporting the optimal Pareto front of the proposedmodel. Moreover, the optimal solutions of the robust optimization model are insensitiveto the disturbance of parameters under di�erent scenarios, thus the risk of decision can bee�ectively reduced.© 2015 Sharif University of Technology. All rights reserved.
1. Introduction
Supply Chain Management (SCM) is a set of ap-proaches utilized to e�ciently integrate the suppliers,manufacturers, warehouses, and stores, so that themerchandise is produced and distributed at the rightquantities, to the right locations, and at the right time,in order to minimize system-wide costs while satisfyingservice level requirements [1]. The above de�nitionreveals that there are many independent entities in a
*. Corresponding author. Tel.: +98 21 8804 4040-2178E-mail addresses: [email protected] (J. Bagherinejad);minadehghani [email protected] (M. Dehghani)
supply chain, each of which tries to maximize its owninherent objective functions in business transactions.This is a complicated problem as too many factorsare involved and need more than one objective to besatis�ed, simultaneously. In traditional SCM, the focusof the designs of supply chain network is usually onsingle objective, minimum cost, or maximum pro�t.However, the design, planning, and scheduling projectsusually involve trade-o�s among di�erent incompatiblegoals such as fair pro�t distribution among all mem-bers, customer service levels, �ll-rates, safe inventorylevels, volume exibility, etc. Hence, real supply chainsare to be optimized simultaneously considering morethan one objective. Many of the problems that occur in
J. Bagherinejad and M. Dehghani/Scientia Iranica, Transactions E: Industrial Engineering 22 (2015) 2604{2620 2605
supply chain optimization are combinatorial in nature,and picking a set of optimal solutions in the caseof multi-objective formulations requires an algorithmthat can e�ciently search the entire objective space,using small amounts of computation time. Literatureshows that evolutionary and swarm intelligence-basedalgorithms perform well in this respect and give goodoptimal results when applied to many combinatorialproblems.
E�cient allocation of customers to DistributionCenters (DCs) always plays an important role indeveloping a awless and reliable supply chain. Inthis paper, two-stage supply chain network, includingthe distribution centers and the customers are consid-ered. There are customers with uncertain demandsand potential places which are candidates to serve asdistribution centers called potential DCs.
Each of the potential DCs can be shipped to anyof the customers. This study proposes the utility ofa new swarm intelligence-based algorithm called Non-dominated Sorting Ant Colony Optimization algorithm(NSACO) and the Non-dominated Sorting GeneticAlgorithm (NSGA-II) for simultaneous robust opti-mization of two objectives, including minimizing thetotal transit time and total cost.
2. Prior related works
Since this research concentrates on location-allocationdecisions, robust multi-objective optimization usingant colony optimization algorithm and NSGA-II, thissection deals with prior works related to all these areas.
Many researchers worked on basic facility loca-tion problem formulations recognized as static anddeterministic which take constant, known quantities asinputs and derive a single solution to be implementedat one point in time. These fundamental locationproblems are categorized into median problems [2],covering problems [3], center problems [3], etc. Later,focus was shifted to location-allocation problems whichsimultaneously locate facilities and dictate ows be-tween facilities and demands. Warszawski and Peer(1973) [4] are among the �rst who studied the multi-commodity location problem. Their models consider�xed location costs and linear transportation costs andassume that each warehouse can be assigned at mostone commodity.
In literature, another set of problems is called�xed charge facility location problems which consider�xed charge associated with locating at each poten-tial facility site. There are two types of problems,including capacitated and uncapacitated plant loca-tion problems. Uncapacitated and capacitated plantlocation models are extensively dealt with in [5] andcapacitated plant location models in [6]. Hajiaghaei-Keshteli (2011) [7] considered two stages of supply
chain network including Distribution Centers (DCs)and customers. His proposed model selects somepotential places as distribution centers in order tosupply demands of all customers; and in order to solvethe given problem, two algorithms, genetic algorithmand arti�cial immune algorithm, were developed.
Di�erent methodologies are found in the literaturefor treating multi-objective optimization problems.These are the weighted-sum method, the "-constraintmethod, the goal-programming method, fuzzy method,etc. [8]. Zhou et al. (2003) [9] proposed a mathe-matical model and an e�cient solution procedure forthe bi-criteria allocation problem involving multiplewarehouses with di�erent capacities. The Bi-criteriaMultiple Warehouse Allocation Problem (BMWAP)is similar to the well-known generalized assignmentproblem, but it is more challenging to solve due to itsmultiple criteria structure.
Ordonez and Zhao (2007) [10] investigated therobust capacity expansion problem of network owsunder demand and travel time uncertainty. Theyprovided complexity results for the two-stage network ow and design problem. Further, the problem oflocating a competitive facility in the plane in thepresence of uncertain demand was studied in [11] with adeviation robustness criterion. Baron et al. (2011) [12]applied robust optimization to the problem of locatingfacilities in a network facing uncertain demand overmultiple periods. They considered a multi-period�xed-charge network location problem for which theyshow that di�erent models of uncertainty lead to verydi�erent solution network topologies, with the modelwith box uncertainty set opening fewer, larger facilities.Gabrel et al. (2011) [13] investigated a robust version ofthe location transportation problem with an uncertaindemand using a two-stage formulation. The resultingrobust formulation is a convex (nonlinear) program,and the authors apply a cutting plane algorithm tosolve the problem exactly. Gulpinar et al. (2013) [14]considered a stochastic facility location problem inwhich multiple capacitated facilities serve customerswith a single product, with uncertain customer de-mand and a constraint on the stock-out probability.Ghahtarani and Naja� (2013) [15] proposed a robustoptimization model for the multi-objective portfolioselection problem that uses a Goal Programming (GP)approach.
Non-dominated Sorting Genetic Algorithm II(NSGA-II), multi-objective ACO (MOACO), andMulti-Objective PSO (MOPSO) are few examples ofmulti-objective metaheuristic optimization algorithmsof this type [16]. Chan and Kumar (2009) [17] dis-cussed a Multiple Ant Colony Optimization (MACO)approach in an e�ort to design a balanced and e�cientsupply chain network that maintains the best balanceof transit time and customer service. The focus of their

2606 J. Bagherinejad and M. Dehghani/Scientia Iranica, Transactions E: Industrial Engineering 22 (2015) 2604{2620
paper is on the e�ective allocation of the customers tothe DCs with the two-fold objective of minimizationof the transit time and degree of imbalance of theDCs. Kalhor et al. (2011) [18] proposed a non-dominated archiving ant colony approach to solve thestochastic time-cost trade-o� optimization problem.Mostafavi and Afshar (2011) [19] used a powerful antcolony algorithm known as non-dominated archivingmulti-colony ant algorithm (NA-ACO) to solve theoptimal Waste Load Allocation as a multi-objectiveoptimization problem. Srinivas and Deb (1994) [20]used the non-dominated sorting concept on the GA.Then, NSGA-II, which was proposed by Deb et al.(2000) [21], is one of the most e�cient and famousmulti-objective evolutionary algorithms. Bhattacharyaand Bandyopadhyay (2010) [22] solved the con ictingbi-objective facility location problem with certain de-mand by NSGA II evolutionary algorithm. Shankar etal. (2013) [23] proposed a bi-objective optimizationof supply chain design and distribution operationsusing Multi-Objective Hybrid Particle Swarm Opti-mization algorithm (MOHPSO). This heuristic incor-porates non-dominated sorting procedure to achievebi-objective optimization of two con icting objectives.Sadeghi et al. (2014) [24] proposed a hybrid vendormanaged inventory and redundancy allocation opti-mization problem in supply chain management, andthey used NSGA-II for solving their problem.
The above literature review indicates that verylittle research has been carried out to implement swarmintelligence-based algorithms in robust multi-objectiveoptimization for supply chain network. The purposeof this paper is to formulate and analyze a location-allocation model for a multi-vehicle single product intwo-stage Supply Chain (SC) network with respect tothe con icting objectives including minimizing totaltransit time and total cost, using NSACO and NSGA-II algorithms. The total cost involves opening costassumed for opening potential DCs and shipping costfrom DCs to the customers. The proposed modelshould lead to a �nal two-stage SC design which wouldrepresent the desired compromise among the di�erentobjectives from the decision-maker's perspective.
3. Background
3.1. Multi-objective optimizationMulti-objective optimizations concerned with mathe-matical optimization problems involve more than oneobjective function to be optimized simultaneously. Toobtain the optimal solution, there will be a set ofoptimal trade-o�s between the con icting objectives,where the set of optimal solution is known as Paretofront. A multi-objective optimization problem isde�ned as the maximization or the minimization ofmany objectives subject to equality and inequality
constraints. The multi-objective optimization problemcan be formulated as follows:
Max:=Min:fi(x); i = 1; :::; Nobj: (1)
Subject to constraints:
gj(x) = 0; j = 1; :::;M;
hk(x) � 0; k = 1; :::;K; (2)
where fi is the ith objective function, x is the decisionvector, Nobj is the number of objectives, gj is thejth equality constraint, and hk is the kth inequalityconstraint.
There are techniques such as weighting methodsand "-constraint method which transfer multi-objectiveproblems to a single-objective one, using di�erent com-binations of a weighting vector and constraints. Thus,each optimal solution can be assigned to a speci�ccombination of weighting vector and constraint. Hence,in each run of the algorithm, a single solution canbe achieved. However, multi-objective metaheuristicalgorithms are capable of �nding almost all candidatesolutions (Pareto) in a single run. Metaheuristicalgorithms can perform optimal/near-optimal solu-tions in all types of problems (linear/nonlinear, dis-crete/continuous, convex/non-convex) especially withincomplete or imperfect information or limited compu-tation capacity.
A set of solutions resulting from a program run,without using any techniques such as the weight-ing approach that are directly related to decision-makers' opinions, is the most important advantageof metaheuristic algorithms in the �eld of multi-objective optimization. In this paper, two multi-objective metaheuristic algorithms, the NSGA-II andNSACO algorithm are used as optimization tools inextraction solution of the developed deterministic andnon-deterministic models.
3.2. Robust multi-objective optimizationMany real-world optimization problems are subjectto uncertainties and noise. These uncertainties andnoise are caused by manufacturing errors, measurementerrors, external factors, and inability to predict thefuture events. The uncertainties emerge in di�erentparts of the optimization process.
One of the basic assumptions in stochastic pro-gramming is that the probability distribution functionof the uncertain parameter is known. The goal ofthe stochastic model is often to obtain an optimalsolution, which can minimize the expected value ofthe objective. However, in robust optimization, theuncertain parameters are described by the discretescenarios or a continuous range. Robust optimization isan approach that deals with the uncertainty parameters

J. Bagherinejad and M. Dehghani/Scientia Iranica, Transactions E: Industrial Engineering 22 (2015) 2604{2620 2607
Figure 1. E�ects of robust and sensitive solutions onobjective functions.
in mathematical models and guarantees the feasibilityof the solutions. The goal of this optimization methodis to obtain an optimal solution, which is insensitiveto almost all the samples of the uncertain parameters.Some minor deviations in the input variables of asystem to be optimized may result in great deviationsin the objective function values. The goal of robustoptimization is not only to optimize the objectives, butalso to take care of deviations of objective function val-ues caused by small or large changes or uctuations inthe input variables. For multi-objective optimization,this means that, instead of looking for the global non-robust Pareto front, one is looking for the global robustPareto front that means the Pareto fronts for di�erentlevels of uncertainty. Figure 1 illustrates the conceptof the robustness of the solutions, where Figure 1(a)corresponds to the solution space (x1 and x2) andFigure 1(b) represents the objective space (f1 and f2).
For illustration purpose, it is assumed that wedeal with minimization problem of two objective func-tions for which solutions A and B are found. As seenin Figure 1, solution A is better than solution B sinceboth objective functions of solution A are smaller thanthose of solution B. However, let us assume that any uctuation occurs in the solutions as depicted by acircle in Figure 1(a). The uctuation of solution Ais denoted by light gray circle and that for solution Bis shaded by dark gray circle. Under these uctuatedconditions, the corresponding objective functions alsoshow some perturbations which are depicted by ellipsesin Figure 1(b). It is noteworthy that solution A showslarge dispersion in objective space, whereas solutionB is just perturbed by a small amount in objectivespace. Considering the worst condition, solution B ispreferred to solution A, because the maximally per-turbed objective functions of solution A are larger thanthose of solution B. Thus, solution A is inferior to thesolution B in the worst case. In other words, solutionB is more insensitive to the perturbation in termsof objective functions, and such insensitive solutionsare said to be robust [25]. The robust optimizationincludes some formulations as regret model, variabilitymodel, and some other de�nitions such as the worst case
analysis, which includes two principles named minimaxand maximin [26].
To achieve robustness in the solutions, the regretmodel is used in this research. In regret model,the regret value of the scenario is described by thedi�erence between the objective value of the feasiblesolution and the best objective value. It can bedenoted by the absolute di�erence or relative di�erence.In the bi-objective problem, let S denote the set ofscenarios. For 8s 2 S, x is the feasible solution ofthe deterministic programming model, Ps, while Z1s(x)and Z2s(x) are the objective values of Ps with thesolution x; Z�1s and Z�2s are the optimal objectivevalues of Ps. Given a constant !1, !2 > 0, if[Z1s(x)� Z�1s] =Z�1s � !1 and [Z2s(x)� Z�2s] =Z�2s � !2under every scenario s 2 S, then x is the robustsolution of Ps. (Z1s(x)� Z�1s) and (Z2s(x)� Z�2s) arethe absolute regret values and [Z1s(x)� Z�1s] =Z�1s and[Z2s(x)� Z�2s] =Z�2s are the relative regret values. !1and !2 are the regret coe�cients. There might beseveral robust solutions, and the best robust solutionshould be found out. Thus, the following model can beobtained:
Pro : minXs
�sZ1s(x);
minXs
�sZ2s(x): (3)
Subject to:
[Z1s(x)� Z�1s] =Z�1s � !1;
[Z2s(x)� Z�2s] =Z�2s � !2: (4)
For 8s 2 S, �s denotes the probability of scenario s,where
Pss=1 �s = 1. The optimal Pareto solutions of
the above model are the best robust solutions (robustPareto front) of the original problem [26].
4. Description of problem and model
In this paper, a location-allocation model for multi-vehicle single product in two-stage supply chain net-work is developed. This model includes distributioncenters, and customers with respect to two con ictingobjectives consist of minimizing total transit time andtotal cost. The total cost here involves opening cost,assumed for opening potential DCs, and shipping cost,from DCs to the customers. The proposed modelselects some potential places as distribution centers inorder to supply demands of all customers. It is assumedthat distribution centers have unequal capacities, andeach customer must be served from a single distributioncenter. Uncertainty is de�ned by discrete scenarios ondemands where occurrence probability of each scenario
2608 J. Bagherinejad and M. Dehghani/Scientia Iranica, Transactions E: Industrial Engineering 22 (2015) 2604{2620
is known. Considering di�erent types of vehicles leadto a more realistic model and cause more con ict inthe two objectives of the proposed problem, since afast vehicle (because of high technology or having lowcapacity) has more cost, and a vehicle with low costcan lead to higher transit time.
According to Section 3.2, to solve the robustoptimization model, we need the optimal objectivevalues of the deterministic optimization model; we �rstde�ne the multi-objective model with deterministicdemand, and then, we formulate the robust multi-objective model with uncertain demand.
4.1. Multi-objective model with deterministicdemand
Let us denote I as a set of nodes representing mcustomers, J as a set of nodes representing p potentialdistribution centers (locations), V as a set of types ofvehicles for transferring process so that the number ofvehicles is assumed to be unlimited, and E as a setof edges representing a connection between customersand DCs. di denotes the demand of customer i; fjis the �xed cost for opening a potential DC at sitej; qv is the capacity of type of vehicle v, v 2 V ;and the associated capacity qj for such DC; dij is thedistance between DC j and customer i; cvij is the costof assigning customer i to DC located at site j withtype of vehicle v; and tvij is the transit time betweencustomer i to DC located at site j with type of vehiclev. All parameters introduced above are assumed tobe non-negative. The binary variable yj is 1 if a DCis located at site j and 0 otherwise. Similarly, binaryvariable xvij is equal to 1 if customer i is served bythe DC located at site j with type of vehicle v 2 Vand 0 otherwise. The bi-objective capacitated multi-vehicle allocation of customers to distribution centersproblem can be formulated as the following binaryinteger programming:
min z1 =VXv=1
pXj=1
mXi=1
didijcvijxvij +
pXj=1
fjyj ; (5)
min z2 =VXv=1
pXj=1
mXi=1
tvijxvij : (6)
Subject to:VXv=1
pXj=1
xvij = 1; i = 1; :::;m; (7)
VXv=1
mXi=1
dixvij � qjyj ; j = 1; :::; p; (8)
mXi=1
pXj=1
dixvij � qv; v = 1; :::; V; (9)
xvij ; yj 2 f0; 1g; 8i = 1; :::;m; 8j = 1; :::; p;
8v = 1; :::; V: (10)
The objective function (Eq. (5)) minimizes the totalcost of opening distribution centers and assigningcustomers to such distribution centers, while objectivefunction (Eq. (6)) minimizes total transit time betweendistribution centers and customers allocated to them.Constraints (Eq. (7)) guarantee that each customeris served by exactly one DC and also guarantee thateach customer's demand is transferred by exactly onevehicle, while capacity constraints (Eq. (8)) ensure thatthe total demand assigned to a DC cannot exceed itscapacity. The constraints (Eq. (9)) ensure that thetotal demand transferred by a vehicle cannot exceedits capacity. In this paper, capacity constraints ofDCs have been relaxed through considering penaltyfunction. In general, a penalty function approach isas follows. Given an optimization problem:
min f(X);
s.t. X 2 A;X 2 B; (11)
where X is a vector of decision variables, the con-straints \X 2 A" are relatively easy to satisfy, and theconstraints \X 2 B" are relatively di�cult to satisfy.The problem can be reformulated as:
min f(X) + p (d(X;B)) ;
s.t. X 2 A; (12)
where d(X;B) is a metric function describing thedistance of the solution vector X from the region B,and p(0) is a monotonically non-decreasing penaltyfunction such that p(0) = 0. Furthermore, any optimalsolution of Eq. (12) will provide an upper bound on theoptimum for Eq. (11), and this bound will be in generaltighter than that obtained by simply optimizing f(X)over A.
In this paper, the objective functions are asfollows:
min z1 = z1 + �1:V i;
min z2 = z2 + �2:V i; (13)
where �1:V i and �:V i are penalty functions. �1 and�2 are two positive coe�cients where they are usuallyconsidered greater than max(z1) and max(z2), respec-tively. Also, V i represents relatively the violation of thevalue of capacity constraints related to DCs (Eq. (8)):
V i =
VXv=1
mXi=1
dixvij � qjyj!=qjyj ;

J. Bagherinejad and M. Dehghani/Scientia Iranica, Transactions E: Industrial Engineering 22 (2015) 2604{2620 2609
ifVXv=1
mXi=1
dixvij > qjyj ; j = 1; :::; p: (14)
And also:
V i = 0; ifVXv=1
mXi=1
dixvij � qjyj ; j = 1; :::; p:
Besides ful�lling other constraints (Eqs. (7) and (9)),the solutions with V i = 0 are feasible, otherwise thesolutions are infeasible.
4.2. The robust multi-objective model withuncertain demand
As mentioned in Section 3.2, the formulation of theregret model is applied in this paper. It is assumedthat the demand is uncertain in the future with severalpossible scenarios, while the other parameters aredeterministic. The parameters in the robust model areall deterministic under a certain scenario s. Hence,in each scenario, the distribution center location andallocation problem can be described as a deterministicoptimization model. In other words, for a non-deterministic model with S scenarios on demand, Sdeterministic models should be considered. For 8s 2S, the optimal objective values of the deterministicoptimization model is denoted by Z�1s and Z�2s. x isfeasible under all scenarios, and Z1s(x) and Z2s(x)denote the objective values of x under scenario s.Given the regret coe�cients (con�dence level), !1, and!2 > 0, if and only if [z1s(x)� z�1s] =z�1s � !1 and[z2s(x)� z�2s] =z�2s � !2 under every scenario s 2 S, xis the robust solution of this problem. There might beseveral robust solutions, and the best robust solutionsshould be found out. Thus, the robust multi-objectiveoptimization model (Pro) of capacitated multi-vehiclelocation and allocation problem can be formulated asfollows:
Pro : min z1 =SXs=1
�sz1s(x); (15)
min z2 =SXs=1
�sz2s(x): (16)
Subject to:
z1s(x) =VXv=1
pXj=1
mXi=1
disdijcvijxvij +
pXj=1
fjyj ;
8s = 1; :::; S; (17)
z2s(x) =VXv=1
pXj=1
mXi=1
tvijxvij ; 8s = 1; :::; S; (18)
VXv=1
pXj=1
xvij = 1; 8i = 1; :::;m; 8s = 1; :::; S; (19)
VXv=1
mXi=1
disxvij � qjyj ; 8j = 1; :::; p; 8s = 1; :::; S;(20)
mXi=1
pXj=1
disxvij � qv; 8v = 1; :::; V; 8s = 1; :::; S;(21)
[z1s(x)� z�1s] =z�1s � !1; (22)
[z2s(x)� z�2s] =z�2s � !2; (23)
xvij ; yj 2 f0; 1g; 8i = 1; :::;m; 8j = 1; :::; p;
8v = 1; :::; V: (24)
In the above model, Eq. (15) is the �rst objective,which is aiming at the total average cost in all sce-narios, while the second objective function Eq. (16)is aiming at the total average transit time in allscenarios. Eq. (22) and Eq. (23) ensure that thefeasible solution of model Pro should meet the re-quirement of the robust solution. The optimal Paretosolutions of the above model are the best robustsolutions (robust Pareto front) of the original prob-lem.
5. Solution procedure
A main branch in the theory of computation, namedcomputational complexity, considers classifying com-putational problems regarding their inherent di�culty.Some important complexity classes are P, NP, NP-complete, NP-hard, EXP-space, EXP-time, P-space,etc. Many real-world optimization problems belong tothe class of NP-hard, and in order to solve NP-hardproblems, there are no provably e�cient algorithms,i.e. exact methods cannot solve the problems innormal time. According to the performed studies,metaheuristic algorithms are suitable tools to optimizethis class of problems [27]. Mirchandani and Francis(1990) [28] showed that Capacitated Facility LocationProblem (CFLP) is NP-hard. Minoux (2010) [29]proved that the robust network design problem withuncertain demand is NP-hard. Since the proposedbi-objective models known in Sections 4.1 and 4.2consist of the above NP-hard problems, these areNP-hard as well. This justi�es the use of a meta-heuristic algorithm. In this section, the well-knownMulti-Objective Evolutionary Algorithm (MOEA) ofNSGA-II and a new swarm intelligence based al-gorithm called Non-dominated Sorting Ant ColonyOptimization (NSACO) are presented to solve theproblem.

2610 J. Bagherinejad and M. Dehghani/Scientia Iranica, Transactions E: Industrial Engineering 22 (2015) 2604{2620
5.1. Non-dominated Sorting GeneticAlgorithm-II (NSGA-II)
A population-based search MOEA can present a setof Pareto optimal solutions of multi-objective opti-mization problems involving two or more con ictingobjectives. One of these MOEAs that is frequently usedin many optimization problems as the best technique togenerate Pareto frontiers is the Non-dominated SortingGenetic Algorithm-II (NSGA-II) proposed by Deb etal. (2000) [21]. To start NSGA-II, one �rst randomlygenerates a population P1 with size nPop chromosomes(solutions) and then sorts the chromosomes in P1into several fronts of non-dominated solutions. Allchromosomes in this population are sorted into dif-ferent front levels based on the domination of paircomparison. Each front level is assigned a �tness(or a rank) which equals its non-domination level.Level 1 is the top level in which the individual isdominated by none of the other chromosomes; level2 is the secondary level in which the chromosome isdominated by some chromosomes only in level 1, andso on. Considering the obtained chromosomes usingthe tournament selection operator for P1, the o�springpopulation O1 is created with respect to the crossoverprobability (Pc) and the mutation probability (Pm).Moreover, the algorithm obtains the objective valuesof each chromosome in P1 and O1.
After merging P1 and O1 to form Rt, the al-gorithm sorts Rt in several non-dominated fronts Fi,where the best Fis form the next population Pt+1.Since the size of Pt+1 is equal to the size of Pt,all of the elements from a front cannot be in Pt+1.Hence, when a front is added to Pt+1 incompletely, thecrowding distance approach is applied. The crowdingdistance is an important concept proposed by Deb etal. (2000) [21] in his algorithm NSGA-II. It servesfor getting an estimate of the density of solutionssurrounding a particular solution in the population.Figure 2 shows the calculation of the crowding distanceof point i which is an estimate of the size of the largestcuboid enclosing I without including any other points.
Figure 2. Crowding distance computation.
Figure 3. Graphical representation of NSGA-II.
In fact, the crowding distance is a measure of how closean individual is to its neighbors. Consequently, therequired population is organized from the top elementsof the front without losing good solutions (elitism).The algorithm creates Ot+1 from Pt+1 using a crowdingdistance method and crossover and mutation operators.
Regarding the stopping criteria and iterating theabove stages, the algorithm hopefully presents the bestPareto optimal solutions. Figure 3 shows a graphicalrepresentation of NSGA-II. For more details on theimplementation of NSGA-II see [21,30].
5.2. Non-dominated sorting ant colonyoptimization method
Ant Colony Optimization (ACO) algorithms are themost successful and widely recognized algorithmic tech-niques based on real ant behaviors [31]. Several paperswere proposed to extend the Ant Colony Optimization(ACO) method in order to handle a multi-objectiveoptimization problem [17-19].
In this paper, a swarm intelligence-based al-gorithm named Non-dominated Sorting Ant ColonyOptimization (NSACO) is proposed to tackle the bi-objective capacitated multi-vehicle allocation of cus-tomers to distribution centers problem in uncertainenvironment. NSACO algorithm is based on thesame non-dominated sorting concept used in NSGA-II.The proposed methodology is based on a new variantof ACO specialized in multi-objective optimizationproblem. Steps of the NSACO are as follows.
In the �rst step, a colony of ants with size nAntis considered. Then, ACO parameters such as �, �, �,etc. are initialized, where � and � are parameters usedfor controlling the exponential weight of the pheromonetrail and the heuristic exponential weight, respectively,and � is evaporation rate [31]. Also in this step, thevalue of the initial pheromone trail, �0, is determinedand the tabu lists of all ants are constructed, whichcontain all the unvisited nodes for each ant and thelist of optimal paths traversed by the ants. The initialpheromone intensity, �ij , or the path from nodes i to jis set equal to �0, that is �ij = �0 and ��ij = 0.
J. Bagherinejad and M. Dehghani/Scientia Iranica, Transactions E: Industrial Engineering 22 (2015) 2604{2620 2611
In the second step, for each ant of the colony, anew solution using ACO probabilistic rule is created.It means that, for each ant, a DC vector, an allocationmatrix and a vehicle vector are assigned. The DC vec-tor is a binary vector that indicates the opening or notopening DCs, the allocation matrix is a binary matrixthat indicates the allocation of customers to the locatedDCs, and the vehicle vector is an integer vector thatindicates the type of vehicle for transferring customer'sdemand. The allocation matrix and vehicle vector forma three-dimensional decision variable named xvij . Then,objective values for this solution are calculated andevaluated.
In order to construct the solution, ant k currentlyat node i determines the next node to visit, nodej, by applying the sampling approach known as theRoulette Wheel Selection. For this purpose, �rst,movement probability for ant k from node i to othernodes including the neighbors of the node i, must becalculated. Sk(i) is a Tabu list to avoid creating a loop,containing those unvisited nodes for ant k currentlyat node i. Therefore, node j 2 Sk(i) is the noderandomly chosen from the list Sk(i) according to thepseudo random proportional distribution rule Eq. (25)and the Roulette wheel selection [31]:
P kij = ��ij��ij=
Xu2Sk(i)
���iu�
�iu
�;
if j 2 Sk(i); otherwise P kij = 0; (25)
where P kij is the probability that ant k chooses to movefrom node i to node j, and �ij is a heuristic value whichequals to the inverse of the length from node i to nodej, �ij is the amount of pheromone trail of the path fromnode i to node j, � and � are two parameters used forcontrolling the exponential weight of the pheromonetrail and the heuristic value. Then, after calculatingthe probability values, the Roulette wheel selection isused to select next node among these existing neighbornodes [32]. In this paper, this process is occurred threetimes for constructing the DC vector, the allocationmatrix, and the vehicle vector.
In the third step, after all the ants of thecolony traversed their paths, the non-dominated sort-ing method is applied, where the entire populationis sorted into various non-domination fronts. In aminimization problem, a vector x(1) is partially lessthan another vector x(2),
�x(1) < x(2)� when no value
of x(2) is less than x(1) and at least one value of x(2)
is strictly greater than x(1) [33]. A solution whichis not partially less is a dominated solution and asolution which cannot be dominated throughout anexisting solution set is called a non-dominated solutionor Pareto front. The �rst front being completely a non-dominant set in the current population and the second
front being dominated by the individuals in the �rstfront only and the front goes so on. Each individualin each front is assigned �tness values or based onfront in which they belong to. Individuals in the �rstfront are given a �tness value of 1 and individuals inthe second are assigned a �tness value of 2 and soon. A major di�erence of NSACO and NSGA-II isthat in NSACO, an additional population because ofoperators like crossover and mutation is not generated,and population size always equals nAnt. Also, all antsof a colony are sorted based on quality and disciplinefactors, simultaneously. Therefore, in addition to the�tness value, a parameter called crowding distance iscalculated for each ant to ensure the best distributionof the non-dominated solutions.
Once the non-dominated solutions are found,other (dominated) solutions are discarded and onceagain the pheromone trails are updated and evapora-tion process is occurred according to non-dominatedsolutions. In this paper, three pheromone trails matrixare designed for DC vector, allocation matrix andvehicle vector. The pheromone trails matrix for DCvector is a 2 � p dimensions matrix, in which 2 isidenti�ed as open or closed state of each DC, that the�rst row and the second row are considered for closingand opening the DCs, respectively, and p is identi�edas the number of DCs (Eq. (26)). The pheromonetrails matrix for allocation matrix is a p�m dimensionsmatrix, in which p and m are identi�ed as number ofDCs and number of customers, respectively (Eq. (27)),and the pheromone trails matrix for vehicle vector isa V � m dimensions matrix, in which V and m areidenti�ed as types of vehicles and number of customers,respectively (Eq. (28)).
�1 =��11 : : �1p�21 : : �2p
�; (26)
�2 =��11 : : �1m�p1 : : �pm
�; (27)
�3 =��11 : : �1m�v1 : : �vm
�: (28)
The heuristic information matrix for DC vector is a 2�p dimensions matrix, in which 2 is identi�ed as closedor open state of each DC, in which the �rst row andthe second row are considered for �xed cost for openingpotential DCs and inverse of �xed cost for openingpotential DCs, respectively, and p is identi�ed as thenumber of DCs (Eq. (29)). The heuristic informationmatrix for allocation matrix is a P � m dimensionsmatrix, in which p and m are identi�ed as numberof DCs and number of customers, respectively, whichcontains inverse of distance values between customersand DCs (Eq. (30)), and the heuristic information

2612 J. Bagherinejad and M. Dehghani/Scientia Iranica, Transactions E: Industrial Engineering 22 (2015) 2604{2620
matrix for vehicle vector is a V �m dimensions matrix,in which V and m are identi�ed as types of vehiclesand number of customers, respectively, which containsinverse of shipping cost from DCs to customers. Thereare three heuristic information matrices 8j = 1; :::; p(Eq. (31)).
�1 =�f1 :: fp
1=f1 :: 1=fp
�; (29)
�2 =
241=d11 :: 1=d1m: :: :
1=dp1 :: 1=dpm
35 ; (30)
�3 =
241=c1j1 :: 1=cmj1: :: :
1=c1jv :: 1=cmjv
35 : (31)
The pheromone trails are updated according to thenon-dominated solutions in the Pareto front, andin order to prevent unlimited accumulation of thepheromone trails and help the algorithm to forget baddecisions of formers, evaporation process is applied onpheromone trails. This updating process a�ects theselection of new solutions using ACO probabilistic rulein the next iteration. This cycle is repeated for a pre-de�ned number of iterations known as Cycle Iteration.At the end of running this algorithm, the present non-dominated solutions in the last iteration are the opti-mal solutions of the multi-objective problem. Figure 4shows a graphical representation of NSACO.
Figure 4. Graphical representation of NSACO.
5.3. Adaptive algorithms for solving themulti-objective robust optimization
In this paper, two metaheuristic algorithms, NSGA-IIand NSACO, are proposed as the optimization tools.The algorithms are coded in MATLAB software andtested on a Core 2 Duo/2.66 GHz processor. Stepsof adaptive algorithms for solving the multi-objectiverobust optimization model by NSGA-II and NSACOare as follows:
Step 1. Considering a for loop over the number ofscenarios for demand;
Step 2. Solving the bi-objective deterministic modelin all scenarios by NSGA-II or NSACO andsaving the objective values of Pareto front, Z�1sand Z�2s, in memory of algorithms;
Step 3. After optimizing the deterministic models inall scenarios, the �rst three fronts of solutionsfor each model (each scenario) are consideredtogether in a set named good solutions;
Step 4. For each solution in the set good solutions,feasibility survey is done according to theconstraints (Eqs. (19), (20) and (21));
Step 5. The solutions that are feasible in all scenariosof demands simultaneously are stored in anarchive named feasible solutions;
Step 6. For each solution in feasible solutions archive:Step 6.1. Calculating objective values for
each scenario (z1s(x) and z2s(x))according to Eqs. (17) and (18);
Step 6.2. Feasibility survey according tothe regret constraints (Eqs. (22)and (23));
Step 6.3. If all regret constraints are satis-�ed for a solution, that solution isstored in an archive named robustsolutions, as a robust solution.
Step 7. After �nding all robust solutions and savingthem to robust solutions archive, the objectivevalues of each robust solution are calculatedaccording to Eqs. (15) and (16);
Step 8. Non-dominated sorting and crowding distancemethods are done on robust solutions archive;
Step 9. The robust Pareto front is found.
In this paper, sixteen numerical examples, in-cluding eight cases in small scale and eight cases inlarge scale are considered for experimental study whichpresents di�erent levels of di�culty for alternativesolution approaches.
Initial population size is assumed 100 and 200 forsmall and large scales, respectively. Problem size di�ersfrom each other by changing DCs/customer's numbers,types of vehicles, and number of scenarios of demand.

J. Bagherinejad and M. Dehghani/Scientia Iranica, Transactions E: Industrial Engineering 22 (2015) 2604{2620 2613
6. Parameter tuning
In order to obtain solutions with better quality, theparameters of both algorithms are adjusted in thissection using an auto tuning approach. For NSGA-IIparameters, �rst, some random numbers, for example,10 numbers in the range 0.55 to 0.85, are selectedrandomly for Pc. This range is considered accordingto existing literature in the �eld of genetic algorithms.It could be considered in 0 to 1 in the most pessimisticcase. For each random number in the range, NSGA-II algorithm runs, and the results are saved. Then,by observing the best solutions, we tried the nextrandom numbers that could be close to the Pc ofthe best solutions. In fact, after observing the bestsolutions, lower and upper bound of the range areupdated according to good values of Pc. Exactly thesame procedure in the range 0 to 0.45 is repeated forPm. This process is performed by an external NSGA-IIprogram for auto tuning parameters. Figures 5 and 6show that Pc equals 0.73, and Pm equals 0.37.
As shown in these �gures, Pc and Pm are tunedin 15th iteration, approximately. If in each iteration,10 random numbers are considered, Pc and Pm aretuned with considering 150 times running of NSGA-II algorithm. As previously mentioned, for NSACO
Figure 5. Auto tuning parameters (crossoverprobability).
Figure 6. Auto tuning parameters (mutationprobability).
parameters, some numbers, for example, 10 numbersin the range 0.8 to 1.8, are selected randomly for �1,pheromone exponential weight for DC vector, and thenby observing the best solutions, we tried the nextrandom numbers that could be close to the �1 of thebest solutions.
Exactly the same procedure in the range 0.05to 0.6 is repeated for �1, heuristic exponential weightfor DC vector. These initial ranges are consideredaccording to both existing literature in the �eld ofACO algorithm and some tentative running of NSACOprogram. This procedure is repeated for other parame-ters. This process is performed by an external NSACOprogram for auto tuning parameters.
The parameters of NSACO for all optimizationcases are summarized in Table 1.
7. Performance evaluation of the algorithms
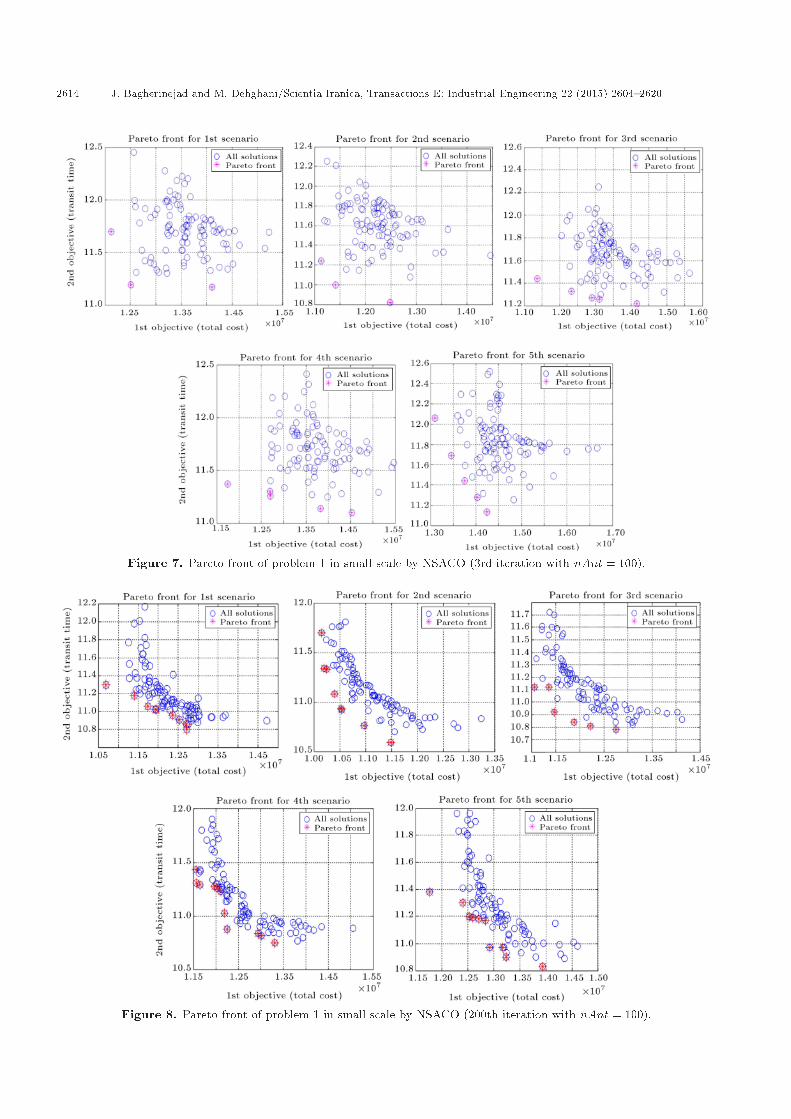
To illustrate the performance of the used proceduresto optimize the proposed models, problem 1 in smallscale is considered as an example. As mentionedbefore, for solving the bi-objective robust model, �rst,the deterministic models 8s 2 S should be solved.Figures 7 and 8 show the performance of the proposed
Table 1. NSACO parameters.
�1 (Pheromone exponential weight for DC vector) 1.30�1 (Heuristic exponential weight for DC vector) 0.40�2 (Pheromone exponential weight for allocation matrix) 1.58�2 (Heuristic exponential weight for allocation matrix) 0.33�3 (Pheromone exponential weight for vehicle vector) 1.34�3 (Heuristic exponential weight for vehicle vector) 0.52� (Evaporation rate) 0.05
2614 J. Bagherinejad and M. Dehghani/Scientia Iranica, Transactions E: Industrial Engineering 22 (2015) 2604{2620
Figure 7. Pareto front of problem 1 in small scale by NSACO (3rd iteration with nAnt = 100).
Figure 8. Pareto front of problem 1 in small scale by NSACO (200th iteration with nAnt = 100).

J. Bagherinejad and M. Dehghani/Scientia Iranica, Transactions E: Industrial Engineering 22 (2015) 2604{2620 2615
Figure 9. Robust Pareto solutions by NSACO &NSGA-II (problem 2 in small scale, in 200th iteration withnpop = 100).
algorithm, NSACO, in the 3rd and 200th iterationswith �ve scenarios on demand.
Figure 9 shows all robust solutions and robustPareto solutions for problem 2 in small scale as anexample. Also, to view the output of the decisionvariables, the robust Pareto solutions of problem 6 insmall scale are given in the Appendix.
To check the quality of solutions obtained by theNSACO, four evaluation metrics including: (1) Num-ber of Pareto solutions (NOS), (2) Maximum spreador diversity metric [34], (3) Mean Ideal Distance (MID)metric [35], and (4) time of running have been used.Diversity and MID metrics are formulated as follows:
Diversity =
vuut mXj=1
�maxn
f jn �minnf jn�2; (32)
MID =nXi=1
Cin; (33)
Figure 10. MID metric comparisons for problem 2 insmall scale.
where in Eq. (32), m is the number of objectives, nis the number of Pareto solutions, and in Eq. (33),n is the number of Pareto solutions and Ci is thedistance of ith Pareto solution from ideal point ((0,0)in bi-objective minimization).
Figure 10 shows MID metrics comparison forproblem 2 in small scale for �rst scenario (determin-istic optimization). For better display, MID axisis considered under logarithmic scale. As shown inFigure 10, in the �rst iterations, there are moreinfeasible solutions and they cause adding large penaltyfunctions to objective values, but during the processof algorithm, the infeasible solutions, because of greatobjective values are discarded and objective values aremore real and then convergence process goes smoothly.
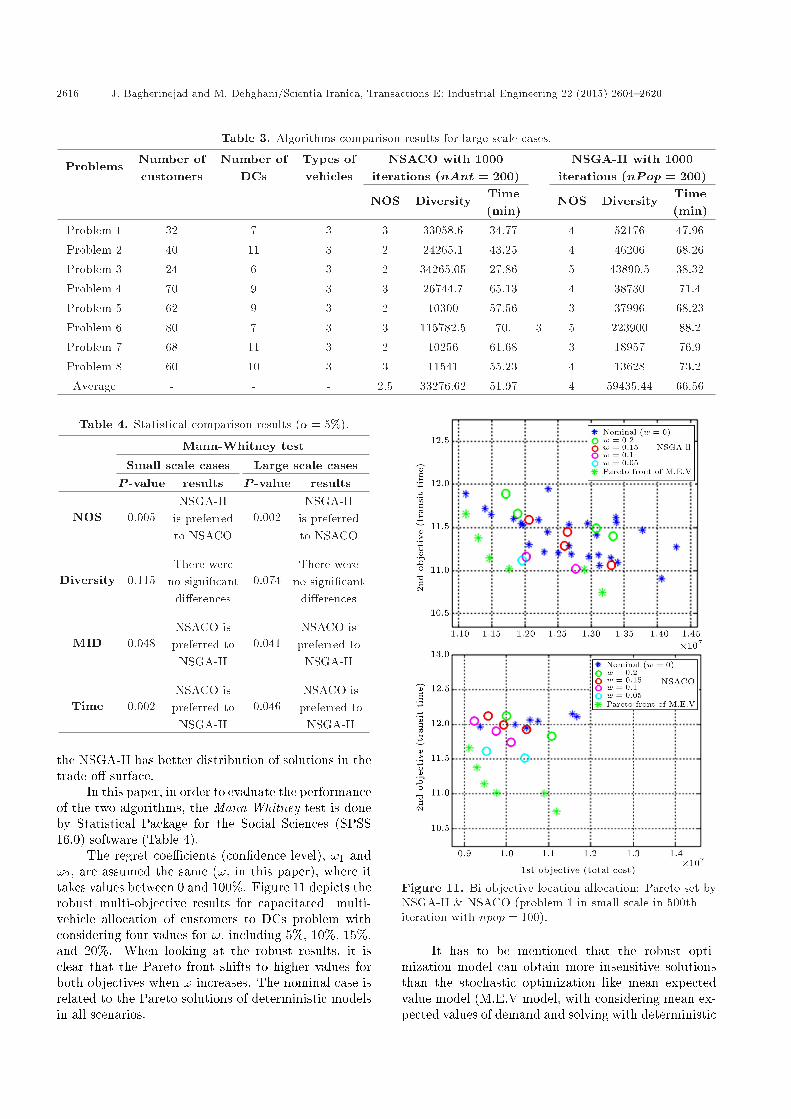
Tables 2 and 3 show the algorithms comparison re-sults for some small and large scale bi-objective robustoptimization problems with iteration number 1000.From these results, it can be seen that the NSACOis more e�cient than NSGA-II in the viewpoint ofoptimality, but, according to the Diversity and NOS,
Table 2. Algorithms comparison results for small scale cases.
Problems Number ofcustomers
Number ofDCs
Types ofvehicles
NSACO with 1000iterations (nAnt = 100)
NSGA-II with 1000iterations (nPop = 100)
NOS Diversity Time(min)
NOS Diversity Time(min)
Problem 1 21 7 3 2 105431.27 10.09 3 149360.85 15.93Problem 2 8 3 2 3 10942.25 5.65 3 21692.69 9.34Problem 3 15 3 2 2 19982.57 9.11 4 37299.6 12.15Problem 4 10 4 2 3 21503.86 7.03 4 34390 11.62Problem 5 12 5 2 3 18559.97 7.86 4 40290 13.74Problem 6 14 6 3 2 12982.57 8.69 3 22644.23 11.88Problem 7 20 5 2 3 1074.63 9.49 4 1474.63 14.06Problem 8 26 4 2 3 958.78 11.37 5 1548.52 17.09Average - - - 2.625 23929.49 8.66 3.725 38587.57 13.23
2616 J. Bagherinejad and M. Dehghani/Scientia Iranica, Transactions E: Industrial Engineering 22 (2015) 2604{2620
Table 3. Algorithms comparison results for large scale cases.
Problems Number ofcustomers
Number ofDCs
Types ofvehicles
NSACO with 1000iterations (nAnt = 200)
NSGA-II with 1000iterations (nPop = 200)
NOS Diversity Time(min)
NOS Diversity Time(min)
Problem 1 32 7 3 3 33058.6 34.77 4 52176 47.96
Problem 2 40 11 3 2 24265.1 43.25 4 46206 68.26
Problem 3 24 6 3 2 34265.05 27.86 5 43890.5 38.32
Problem 4 70 9 3 3 26744.7 65.13 4 38730 71.4
Problem 5 62 9 3 2 10300 57.56 3 37996 68.23
Problem 6 80 7 3 3 115782.5 70. 3 5 223900 88.2
Problem 7 68 11 3 2 10256 61.68 3 18957 76.9
Problem 8 60 10 3 3 11541 55.23 4 13628 73.2
Average - - - 2.5 33276.62 51.97 4 59435.44 66.56
Table 4. Statistical comparison results (� = 5%).
Mann-Whitney testSmall scale cases Large scale casesP -value results P -value results
NOS 0.005NSGA-II
is preferredto NSACO
0.002NSGA-II
is preferredto NSACO
Diversity 0.115There were
no signi�cantdi�erences
0.074There were
no signi�cantdi�erences
MID 0.048NSACO is
preferred toNSGA-II
0.041NSACO is
preferred toNSGA-II
Time 0.002NSACO is
preferred toNSGA-II
0.046NSACO is
preferred toNSGA-II
the NSGA-II has better distribution of solutions in thetrade-o� surface.
In this paper, in order to evaluate the performanceof the two algorithms, the Mann-Whitney test is doneby Statistical Package for the Social Sciences (SPSS16.0) software (Table 4).
The regret coe�cients (con�dence level), !1 and!2, are assumed the same (!, in this paper), where ittakes values between 0 and 100%. Figure 11 depicts therobust multi-objective results for capacitated multi-vehicle allocation of customers to DCs problem withconsidering four values for !, including 5%, 10%, 15%,and 20%. When looking at the robust results, it isclear that the Pareto front shifts to higher values forboth objectives when ! increases. The nominal case isrelated to the Pareto solutions of deterministic modelsin all scenarios.
Figure 11. Bi-objective location allocation: Pareto set byNSGA-II & NSACO (problem 1 in small scale in 500thiteration with npop = 100).
It has to be mentioned that the robust opti-mization model can obtain more insensitive solutionsthan the stochastic optimization like mean expectedvalue model (M.E.V model, with considering mean ex-pected values of demand and solving with deterministic

J. Bagherinejad and M. Dehghani/Scientia Iranica, Transactions E: Industrial Engineering 22 (2015) 2604{2620 2617
Table 5. Comparison between the results of stochastic optimization model and robust optimization model for problem 5in small scale.
Scenario Objectivefunctions
Z�s Zros Zsos"ro�d(%)
"so�d(%)
1
Total cost
287055.47 289889.31 313891.44 0.99 9.352 264934.74 309011.22 320197.39 16.64 20.863 265999.90 334929.45 301672.11 25.91 13.414 296305.81 296418.94 296496.34 0.038 0.065 353423.26 355750.82 496563.70 0.66 40.50
1
Total transit time
1.68 1.88 1.71 11.90 1.782 1.73 1.88 1.75 8.67 1.163 1.77 1.88 1.79 6.21 1.134 1.67 1.88 1.69 12.57 1.195 1.71 1.88 2.38 9.94 39.00
model), especially when the data distribution is largecompared to the average. The robust optimizationmodel in the both objectives does not change a lotunder all scenarios, thus the risk of decision can bee�ectively reduced.
Table 5 shows the comparison between the resultsof stochastic optimization model (M.E.V model) androbust optimization model. As an example, the �rstmember of Pareto front in each scenario for problem 5in small scale is considered. The relative di�erencebetween Zsos and Z�s can be obtained by:
"so�d = f(Zsos � Z�s )=Z�s g � 100%:
The relative di�erence between Zros and Z�s can beobtained by:
"ro�d = f(Zros � Z�s )=Z�s g � 100%;
where Z�s , Zsos and Zros are the objective values of deter-ministic model, stochastic optimization model (M.E.Vmodel), and robust optimization model, respectively.
It can be concluded from Table 5 that the "so�dfor 1st objective and 2nd objective is uctuating from0.06 to 40.5% and 1.13 to 39%, respectively, while "ro�dfor 1st objective and 2nd objective is uctuating from0.038 to 25.91% and 6.21 to 12.57%, respectively. Thelatter is more stable.
8. Discussion and conclusion
Nowadays, the competition is vital for the �rms'survival in SCs. Then, the basic priority for supplychain management should be designing the SC networkproperly, to gain competitive advantage. In this paper,a multi-objective robust optimization model for ca-pacitated multi-vehicle allocation of customers to DCsin two-stage SC considering distribution centers andcustomers is proposed. The optimization objectives are
to minimize transit time and total cost. Results showthe trade-o� between total transit time and total cost,since the di�erent types of vehicles used in the modelcause more con ict in these two objectives.
In this paper, swarm intelligence-based algorithmnamed Non-dominated Sorting Ant Colony Optimiza-tion (NSACO) is presented to �nd Pareto fronts. Theproposed methodology is based on a new variant ofAnt Colony Optimization (ACO) customized in multi-objective optimization problem. The crowding distancetechnique is used to ensure the best distribution of thenon-dominated solutions.
For ensuring the robustness of the proposedmethod and giving a practical sense of this study,the computational results are compared with thoseobtained by Non-dominated Sorting Genetic Algo-rithms (NSGA-II). Results show the advantages ande�ectiveness of the used procedures in reporting theoptimal Pareto front of the proposed deterministic andnon-deterministic models.
Moreover, it can be seen that the NSACO is moree�cient than NSGA-II in the viewpoint of optimalityand running time saving, but the NSGA-II has bet-ter distribution of solutions in the trade-o� surface.Also, the optimal solutions of the robust optimizationmodel are insensitive to the disturbance of parametersunder di�erent scenarios, and the robust optimizationmodel can obtain better solutions than the stochasticoptimization model, thus the risk of decision can bee�ectively reduced.
Future research may develop the NSACO toincrease the diversity of solutions. Additionally, it maybe combined routing with location-allocation problem.Furthermore, given the successful application of aNSACO to the bi-objective warehouse allocation prob-lem, the used algorithm can be modi�ed to obtain non-dominated solutions for warehouse allocation problemswith more than two objectives.
2618 J. Bagherinejad and M. Dehghani/Scientia Iranica, Transactions E: Industrial Engineering 22 (2015) 2604{2620
References
1. Simchi-Levi, D. Kaminsky, P. and Simchi-Levi, E.,Designing and Managing the Supply Chain, New York:Irwin McGraw-Hill (2000).
2. ReVelle, C. \The maximum capture or `sphere ofin uence' location problem: Hoteling revisited on anetwork", Journal of Regional Science, 26(2), pp. 343-358 (1986).
3. Daskin, M.S., Network and Discrete Location: ModelsAlgorithms and Applications, New York: Wiley (1995).
4. Warszawski, A. and Peer, S. \Optimizing the locationof facilities on a building site", Operational ResearchQuarterly, 24, pp. 35-44 (1973).
5. ReVelle, C.S., Eiselt, H.A. and Daskin, M.S. \Abibliography for some fundamental problem categoriesin discrete location science", European Journal ofOperational Research, 184, pp. 817-848 (2008).
6. Sridharan, R. \The capacitated plant location prob-lem", European Journal of Operational Research, 87,pp. 203-213 (1995).
7. Hajiaghaei-Keshteli, M. \The allocation of customersto potential distribution centers in supply chain net-works: GA and AIA approaches", Applied Soft Com-puting, 11, pp. 2069-2078 (2011).
8. Chen, C.L. and Lee, W.C. \Multi-objective optimiza-tion of multi-echelon supply chain networks, withuncertain product demands and prices", Computersand Chemical Engineering, 28, pp. 1131-1144 (2004).
9. Zhou, G., Min, H. and Gen, M. \A genetic algorithmapproach to the bi-criteria allocation of customersto warehouses", International Journal of ProductionEconomics, 86, pp. 35-45 (2003).
10. Ordonez, F. and Zhao, J. \Robust capacity expansionof network ows", Networks, 50, pp. 136-145 (2007).
11. Blanquero, R., Carrizosa, E. and Hendrix, E.M.T.\Locating a competitive facility in the plane with arobustness criterion", European Journal of OperationalResearch, 215, pp. 21-24 (2011).
12. Baron, O., Milner, J. and Naseraldin, H. \Facilitylocation: A robust optimization approach", Productionand Operations Management, 20, pp. 772-785 (2011).
13. Gabrel, V., Lacroix, M., Murat, C. and Remli \Ro-bust location transportation problems under uncertaindemands", Combinatorial Optimization, Discrete Ap-plied Mathematics, 164(1), pp. 100-111 (2014).
14. Gulpinar, N., Pachamanova, D. and Canakoglu, E.\Robust strategies for facility location under uncer-tainty", European Journal of Operational Research,225, pp. 21-35 (2013).
15. Ghahtarani, A. and Naja�, A.A. \Robust goal pro-gramming for multi-objective portfolio selection prob-lem", Economic Modeling, 33, pp. 588-592 (2013).
16. Xing, H. and Qu, R. \A non-dominated sorting geneticalgorithm for bi objective network coding based mul-
ticast routing problems", Information Sciences., 233,pp. 36-53 (2013).
17. Chan, F.T.S. and Kumar, N. \E�ective allocationof customers to distribution centers: A multipleant colony optimization approach", Robotics andComputer-Integrated Manufacturing, 25(1), pp. 1-12(2009).
18. Kalhor, E., Khanzadi, M., Eshtehardian, E. andAfshar, A. \Stochastic time-cost optimization usingnon-dominated archiving ant colony approach", Au-tomation in Construction, 20, pp. 1193-1203 (2011).
19. Mostafavi, S.A. and Afshar, A. \Waste load alloca-tion using non-dominated archiving multi-colony antalgorithm", Procedia Computer Science, 3, pp. 64-69(2011).
20. Srinivas, N. and Deb, K. \Multi-objective optimiza-tion using non-dominated sorting genetic algorithms",Evolutionary Computation, 2(3), pp. 221-248 (1994).
21. Deb, K., Agrawal, S., Pratap, A. and Meyarivan, T. \Afast elitist non-dominated sorting genetic algorithm formulti-objective optimization: NSGA-II", in Proceed-ings of the 6th International Conference on ParallelProblem Solving from Nature, pp. 849-58 (2000).
22. Bhattacharya, R. and Bandyopadhyay, S. \Solvingcon icting bi-objective facility location problem byNSGA II evolutionary algorithm", The InternationalJournal of Advanced Manufacturing Technology, 51,Issue 1-4, pp. 397-414 (2010).
23. Shankar, B.L., Basavarajappa, S., Chen, J.C.H. andKadadevaramath, R.S. \Location and allocation deci-sions for multi-echelon supply chain network -A multi-objective evolutionary approach", Expert Systems withApplications, 40, pp. 551-562 (2013).
24. Sadeghi, J., Sadeghi, S. and Akhavan Niaki, S.T.\A hybrid vendor managed inventory and redundancyallocation optimization problem in supply chain man-agement: An NSGA-II with tuned parameters", Com-puters & Operations Research, 41, pp. 53-64 (2014).
25. Ok, S.Y., Lee, S.Y. and Park, W. \Robustmulti-objective maintenance planning of deterioratingbridges against uncertainty in performance model",Advances in Engineering Software, 65, pp. 32-42(2013).
26. Baohua, W. and Shiwei, H. \Robust optimizationmodel and algorithm for logistics center location andallocation under uncertain environment", Journal ofTransportation Systems Engineering and InformationTechnology, 9(2), Online English edition of the Chineselanguage journal (2009).
27. Talbi, E.G., Meta-Heuristics: From Design to Imple-mentation, New York: Wiley (2009).
28. Mirchandani, P.B. and Francis, R.L., Discrete LocationTheory, New York: Wiley (1990).
29. Minoux, M. \Robust network optimization under-polyhedral demand uncertainty is NP-hard", DiscreteApplied Mathematics, 158, pp. 597-603 (2010).

J. Bagherinejad and M. Dehghani/Scientia Iranica, Transactions E: Industrial Engineering 22 (2015) 2604{2620 2619
30. Deb, K., Multi-Objective Optimization Using Evolu-tionary Algorithms, England: John Wiley and Sons,Ltd (2001).
31. Dorigo, M. and Stutzle, T., Ant Colony Optimization,Cambridge, MA: MIT Press (2004).
32. Xia, X. \Particle swarm optimization method basedon chaotic local search and roulette wheel mecha-nism", International Conference on Applied Physicsand Industrial Engineering, Physics Procedia, 24(A),pp. 269-275 (2012).
33. Tamura, K. and Miura, S. \Necessary and su�cientconditions for local and global non-dominated so-lutions in decision problems with multi-objectives",Journal of Optimization Theory and Applications.,28(4), pp. 501-523 (1979).
34. Zitzler, E. \Evolutionary algorithms for multi-objective optimization: Methods and applications",PhD. Thesis, Dissertation ETH No. 13398, SwissFederal Institute of Technology (ETH) (1999).
35. Karimi, N., Zandieh, M. and Karamooz, H.R. \Bi-objective group scheduling in hybrid exible owshop: A multi-phase approach", Expert Systems withApplications, 37, pp. 4024-4032 (2010).
Appendix A
The robust Pareto solutions for problem 6 in small scalein 200th iteration by NSACO algorithm are as follows(where number of customers = 14, number of DCs =6, types of vehicles = 3):
Number of robust Pareto front members = 2.
Robust Pareto front:
For the 1st element of Robust Pareto front, depotvector is: y = 1 1 1 1 1 1.Allocation matrix for the 1st element of Robust Paretofront is shown in Table A.1.
For the 2nd element of robust Pareto front, depotvector is: y = 1 1 1 1 0 1.Allocation matrix for the 2nd element of Robust Paretofront is shown in Table A.2.
Final objective values:For the 1st element of robust Pareto front, objectivevalues are:
Total cost = 1.1391e+006,Transit time = 3.2200.
For the 2nd element of robust Pareto front, objectivevalues are:
Total Cost = 1.1747e+006,Transit Time = 3.1300.
Table A.1. Allocation matrix for the 1st element ofrobust Pareto front.
x =
DC1 DC2 DC3 DC4 DC5 DC6 Types ofvehicles
Customer 1 0 0 1 0 0 0 3
Customer 2 0 0 1 0 0 0 2
Customer 3 0 0 0 1 0 0 2
Customer 4 0 0 1 0 0 0 3
Customer 5 0 1 0 0 0 0 1
Customer 6 0 0 0 0 0 1 3
Customer 7 1 0 0 0 0 0 3
Customer 8 0 1 0 0 0 0 2
Customer 9 0 0 0 0 0 1 3
Customer 10 1 0 0 0 0 0 1
Customer 11 0 0 0 0 0 1 3
Customer 12 0 1 0 0 0 0 2
Customer 13 0 0 0 1 0 0 3
Customer 14 0 0 0 0 1 0 3
Table A.2. Allocation matrix for the 2nd element ofrobust Pareto front.
x =
DC1 DC2 DC3 DC4 DC5 DC6 Types ofvehicles
Customer 1 0 0 0 0 0 1 3
Customer 2 0 0 1 0 0 0 1
Customer 3 0 0 0 1 0 0 3
Customer 4 0 1 0 0 0 0 2
Customer 5 0 0 1 0 0 0 3
Customer 6 0 1 0 0 0 0 3
Customer 7 0 0 0 0 0 0 1
Customer 8 0 0 0 0 0 1 3
Customer 9 0 0 1 0 0 0 3
Customer 10 1 0 0 0 0 0 2
Customer 11 0 0 0 0 0 1 3
Customer 12 1 0 0 0 0 0 2
Customer 13 0 0 1 0 0 0 3
Customer 14 1 0 0 0 0 0 3
Biographies
Jafar Bagherinejad received his PhD degree fromBradford University, UK (1997), and is an AssociateProfessor of the Industrial Engineering Department,Faculty of Engineering and Technology, Alzahra Uni-versity, Tehran, Iran. His research interest areas arelocation-allocation problems including queuing models,

2620 J. Bagherinejad and M. Dehghani/Scientia Iranica, Transactions E: Industrial Engineering 22 (2015) 2604{2620
queueing systems, project management and control,especially on scheduling problems, quality manage-ment, control and quality systems and innovationand technology engineering and engineering manage-ment. His professional and teaching experiences are:The Dean of Engineering and Technology Faculty,Alzahra University, 2000-2007, and the head of In-dustrial Engineering Department, 2011-2015; Teachingat Industrial Engineering Department, since 2000,for undergraduate and postgraduate students in the
Industrial Engineering and Information TechnologyManagement programs. Further, he has several pa-pers published in the national and international Jour-nals.
Mina Dehghani received her both BS and MS degreesin Industrial Engineering from Alzahra University,Tehran, Iran in 2011 and 2013, respectively. Hermain research interests include: optimization, location,meta-heuristics algorithms and SCM.