a mössbauer-based xanes calibration for hydrous basalt ......148 to isolate the effects of beam...
TRANSCRIPT

1
REVISION 1 1
American Mineralogist Manuscript 6268 2
3
A Mössbauer-based XANES calibration for hydrous basalt glasses reveals 4
radiation-induced oxidation of Fe 5
ELIZABETH COTTRELL1,*
, ANTONIO LANZIROTTI2, BJORN MYSEN
3,
SUZANNE BIRNER
1,4, 6
KATHERINE A. KELLEY5, ROMAN BOTCHARNIKOV
6,7, FREDRICK A. DAVIS
1,8, MATTHEW 7
NEWVILLE2 8
1NMNH, Smithsonian Inst., Washington, DC 20560 USA 9
(*correspondence: [email protected]) 10
2University of Chicago, Chicago, IL 60637 USA 11
3Geophys. Lab., Carnegie Inst. Washington, DC 20015 USA 12
4Dept. Geol. Sci., Stanford Univ., Stanford, CA 94305 USA 13
5GSO, Univ. of Rhode Island, Narragansett, RI 20882 USA 14
6Inst. Mineralogie, Leibniz Univ. Hannover, D-30167 GE 15
7Inst. Geowiss., Gutenberg Univ. Mainz, D-55128 GE 16
17 8DEES, Univ. of Minnesota Duluth, Duluth, MN 55812 USA 18
19
ABSTRACT 20
Oxygen fugacity (fO2) exerts first-order control on the geochemical evolution of 21
planetary interiors, crusts, and hydrospheres, and the Fe3+/ΣFe ratios of silicate glasses 22
provide a useful proxy for fO2. Fe K-edge micro X-ray Absorption Near-Edge Structure 23
(XANES) spectroscopy allows researchers to micro-analytically determine the Fe3+/ΣFe 24
2
ratios of silicate glasses with high precision. In this study we characterize hydrous and 25
anhydrous basalt glass standards with Mössbauer and XANES spectroscopy and show 26
that synchrotron radiation causes progressive changes to the XANES spectra of hydrous 27
glasses as a function of radiation dose (here defined as total photons delivered per square 28
micron), water concentration, and initial Fe3+/ΣFe ratio. 29
30
We report experiments from 8 different radiation dose conditions and show that Fe in 31
hydrous silicate glasses can undergo rapid oxidation upon exposure to radiation. The rate 32
and degree of oxidation correlates with radiation dose and the product of water 33
concentration and ferrous/ferric iron oxide ratio on a molar basis 34
(Φ=XHO1.5*XFeO/XFeO1.5). For example, a basalt glass with 4.9 wt.% dissolved H2O 35
and Fe3+/ΣFe = 0.19 from its Mössbauer spectrum may appear to have a Fe3+/ΣFe ≥ 0.35 36
when analysed over several minutes at a nominal flux density of ~2x10⁹ photons/sec/µm2. 37
This radiation-induced increase in Fe3+/ΣFe ratio would lead to an overestimation of fO2 38
by ~ 2 orders of magnitude, with dramatic consequences for the interpretation of 39
geological processes. 40
41
The sample area exposed to radiation shows measureable hydrogen loss, consistent with 42
radiation-induced breaking of O—H bonds, associated H migration and loss, and 43
oxidation of Fe2+. This mechanism is consistent with the observation that anhydrous 44
glasses show no damage under any beam conditions. Cryogenic cooling does not 45
mitigate, but rather accelerates, iron oxidation. The effects of beam damage appear to 46
persist indefinitely. 47

3
48
We detect beam damage at the lowest photon flux densities tested (3x10⁶ 49
photons/sec/µm2); however, at flux densities ≤ 6x10⁷ photons/sec/m2, the hydrous glass 50
calibration curve defined by the centroid (derived from XANES spectra) and Fe3+/ΣFe 51
ratios (derived from Mössbauer spectra), is indistinguishable from the anhydrous 52
calibration curve within the accuracy achievable with Mössbauer spectroscopy. Thus, 53
published Fe3+/ΣFe ratios from hydrous glasses measured at low photon flux densities are 54
likely to be accurate within measurement uncertainty with respect to what would have 55
been measured by Mössbauer spectroscopy. 56
57
These new results demonstrate that to obtain accurate Fe3+/ΣFe ratios from hydrous, 58
mafic, silicate glasses, it is first necessary to carefully monitor changes in the XANES 59
spectra as a function of incident dose (e.g., fixed-energy scan). Defocusing and 60
attenuating the beam may prevent significant oxidation of Fe in mafic water-bearing 61
glasses. 62
63
INTRODUCTION 64
The Fe3+/Fe ratio of silicate glass may serve as a direct proxy for the oxygen fugacity 65
(fO2) of an igneous system and exerts control on phase equilibria, physical properties, and 66
the valence state of other heterovalent elements in solution (e.g. Carmichael, 1991; Kress 67
and Carmichael, 1991; Sack et al., 1980). The use of Fe-K-edge XANES to obtain 68
Fe3+/Fe ratios of hydrous silicate glasses has proliferated in recent years owing to the 69
outstanding precision achievable and micron-scale spatial resolution afforded (e.g. 70

4
Botcharnikov et al., 2005; Brounce et al., 2014a; Cottrell and Kelley, 2011; Gaetani et al., 71
2012; Helz et al., 2017; Kelley and Cottrell, 2009; Kelley and Cottrell, 2012; Le Voyer et 72
al., 2015; Matjuschkin et al., 2015; Moor et al., 2013; Moussallam et al., 2014; Shorttle et 73
al., 2015; Stamper et al., 2014; Wilke et al., 2006). Most Fe-XANES calibration studies 74
have focused on anhydrous glasses, in large part because fO2 can be easily controlled in 75
1-atmopshere gas-mixing furnaces (Berry et al., 2003; Cottrell et al., 2009; Dyar et al., 76
2016; Fiege et al., 2017; Wilke et al., 2001; Wilke et al., 2005; Zhang et al., submitted; 77
Zhang et al., 2016). Given the recent surge in Fe-XANES-based research, however, it is 78
important to understand and quantify how dissolved water and radiation-induced 79
chemical reactions may modify the spectral features used to determine Fe3+/Fe ratios. 80
81
Fe-XANES pre-edge features are sensitive to the coordination environment and oxidation 82
state of Fe (e.g. Henderson et al., 2014 and references therein). The potential effects of 83
water dissolved in silicate glass on the structural environment of Fe are therefore of great 84
interest to practitioners of XANES. In their Mössbauer studies on glasses, Wilke et al. 85
(2002, 2006) observed differences in the hyperfine fields and coordination environments 86
between hydrous and anhydrous glasses, but postulated that the differences emerged 87
during quench. Wilke and co-workers concluded that there is no detectable influence of 88
water on the local structural environment of Fe in melts. The effect of dissolved water on 89
the oxidation state of Fe in melts has been the subject of more study and debate, but 90
XANES and wet-chemical studies of mafic glasses synthesized at fixed fO2 have shown 91
water to have no effect on Fe3+/Fe ratios (Botcharnikov et al., 2005; Gaillard et al., 92
2001; Moore et al., 1995). Given that Fe coordination affects pre-edge intensities, but not 93

5
the pre-edge centroids most commonly employed to extract Fe3+/Fe ratios (Bajt et al., 94
1994; Cottrell et al., 2009; Wilke et al., 2005), and the difficulty of independently varying 95
fO2 and fH2O in experimental systems, relatively little effort has been applied to 96
calibrating hydrous glasses for XANES determinations of Fe3+/Fe ratios. 97
98
Electron and X-ray beam interactions with materials can shift the oxidation state of 99
various elements in biological, amorphous, and crystalline materials (e.g. Corbett et al., 100
2007; Eeckhout et al., 2005; Shimizugawa et al., 2001; Gonçalves Ferreira et al., 2013). 101
For example, sulfur dissolved in silicate glass may become oxidized or reduced upon 102
exposure to electron and X-ray beams (Klimm et al., 2012; Rowe et al., 2007; Wilke et 103
al., 2008). Relatively little work has been done to investigate the potential effects of 104
radiation on Fe speciation in silicate glasses. Wilke et al. (2005) and Cottrell et al. (2009) 105
assessed, but saw no evidence for, radiation-induced beam damage in XANES spectra of 106
anhydrous basalt glasses collected at bending magnet sources. Shorttle et al. (2015) 107
assessed beam damage in glasses with <1 wt.% water, and observed an increase in the 108
intensity of the second pre-edge multiplet with time (radiation dose) using an 109
unattenuated undulator-source that was “barely above instrument stability” (i.e. was 110
within the noise). The study of Moussallam et al. (2016) was not able to detect beam 111
damage by analyzing successive XANES spectra collected at a single spot on glasses 112
with <1 wt.% water at an attenuated undulator-source. However, as new radiation sources 113
come online that can deliver higher flux densities to a sample, and studies of hydrous 114
silicate glass proliferate, we find it prudent to examine the potential for radiation to 115
induce beam damage. 116
6
117
SAMPLES AND METHODS 118
Samples. We examine 27 glasses of basaltic composition in this study: 13 anhydrous 119
basalt glasses from the study of (Cottrell et al., 2009), which are available to the 120
community upon request to Smithsonian’s National Rock Collection, and 14 hydrous 121
glasses (0.72 to 4.82 wt.% dissolved total H2O) from the study of (Botcharnikov et al., 122
2005). For this study, all analyses were performed on double-side polished glass wafers 123
of approximately 50-100m in thickness. Details of the experimental methods and 124
complete sample characterizations can be found in Cottrell et al. (2009), Cottrell and 125
Kelley (2011) (including wet-chemical analyses), and Botcharnikov et al. (2005). 126
127
Analytical Methods. 128
Mössbauer Spectroscopy. Cottrell et al. (2009) and Botcharnikov et al. (2005) report 129
Fe3+/Fe ratios for each glass based on room temperature Mössbauer spectroscopy, 130
without correction for recoilless fraction. We re-report their results in Table 1, along with 131
new fits to the hydrous B glasses discussed below. Method details for previously reported 132
fits can be found in Cottrell et al. (2009) and Botcharnikov et al. (2005). Cottrell et al. 133
(2009) applied the distribution fitting method of Alberto et al. (1996), which adopts a 134
two-dimensional (2D) Gaussian probability distribution function for the isomer shift and 135
quadrupole splitting. This routine minimizes the error (reduced χ2 values) between the 136
data and the absorption envelope that arises from the contribution of paramagnetic 137
quadrupole doublets. The area of the fitted ferric doublet relative to the entire absorption 138
envelope provides the Fe3+/Fe ratio. Using the software package RECOIL (Lagarec and 139

7
Rancourt, 1998), Botcharnikov et al. (2005) applied an extended Voigt-based fitting 140
(xVBF) method that also assumes a two-dimensional Gaussian distribution of hyperfine 141
parameters for ferric and ferrous iron (Lagarec and Rancourt, 1997). The relative area 142
ratios provide the Fe3+/Fe ratios, and the uncertainties estimated by Botcharnikov et al. 143
(2005) that we re-report in Table 1 reflect counting statistics, variation in the results from 144
the application of multiple fitting models, and the possible effect of neglecting the 145
recoilless fraction. 146
147
To isolate the effects of beam damage, deconvolution of the Mössbauer spectra for 148
hydrous and anhydrous glasses must be consistent. Both xVBF and Alberto et al. (1996) 149
methods fit multiple distributions (based on a Gaussian distribution of Lorentzian line 150
shapes). The site distributions derive from maxima in the probability functions that 151
describe the ferrous and ferric hyperfine field distributions (Mysen et al., 2006, and 152
references therein). Zhang et al. (submitted) show that both approaches yield consistent 153
Fe3+/Fe ratios for the AII and LW glasses. To test for systematic bias between the 154
Cottrell et al. (2009) and Botcharnikov et al. (2005) approaches, we obtained the raw 155
spectra of Botcharnikov et al. (2005), collected at Bayerisches Geoinstitute, University of 156
Bayreuth, and refit 14 of them using the same methods used by Cottrell et al. (2009). This 157
ensures that our analysis of oxidative beam damage from synchrotron radiation will not 158
be affected by inter-laboratory bias in the Mössbauer fitting protocols. 159
160
X-ray Absorption Near Edge Structure (XANES) Spectroscopy. Cottrell et al. (2009) and 161
Botcharnikov et al. (2005) report on Fe K-edge XANES spectra collected previously for 162

8
the glasses used in this study. The former collected spectra at the bending magnet station 163
X26A at the National Synchrotron Light Source (NSLS), Brookhaven National 164
Laboratory, New York, USA, and the latter at the Hamburger 165
Synchrotronstrahulungslabor (HASYLAB), Hamburg, GE. Details about those facilities, 166
collection procedures, and fitting routines can be found in Cottrell et al. (2009) and 167
Botcharnikov et al. (2005). 168
169
For this study, we collected new Fe K-edge XANES spectra on the AII, LW, and B series 170
glasses in fluorescence mode in six synchrotron beam sessions: two on bending magnet 171
station X26A at NSLS in 2015, and four at station 13-ID-E (GSECARS) at the Advanced 172
Photon Source (APS), Argonne National Laboratory, IL, USA, in 2014 - 2016. We 173
applied 8 radiation dose conditions that we detail in Table 2. We cast our results in terms 174
of radiation dose so that the results can be easily generalized to other facilities and 175
beamline configurations. For these experiments it is more convenient and descriptive to 176
represent the mean energy imparted to the sample in terms of flux density, rather than in 177
the more standard SI units of Gray. However, the absorbed dose in Gray (absorption of 178
one joule of radiation energy per kilogram of sample) can be calculated by assuming an 179
average basaltic glass composition and density and the depth at which the incident 180
radiation falls to 1/e within the glass (Henke et al. 1993). For basaltic glass, the flux 181
density is equivalent to ~75-80 times the dose in Grays/sec (Table 2). As we describe 182
below, in all sessions, and at all facilities, we set the area-weighted average energy of the 183
pre-edge peaks (the centroid) equal to 7112.3 for anhydrous glass standard LW_0 184
(Cottrell et al., 2009). LW_0 is analysed frequently throughout all analytical sessions. 185

9
Normalization of all centroids to the energy drift-corrected centroid of LW_0 accounts 186
for within-session instrumental drift in the monochromator energy calibration and for 187
differences in monochromator calibration between facilities and between sessions (Bajt et 188
al., 1994; Cottrell et al., 2009). The empirical drift-corrected precision (1σ) of the area-189
weighted centroid positions collected over a ten-year period on the AII and LW glasses is 190
0.004±0.009 eV (n for each glass = 30-50) (Zhang et al., submitted). 191
192
We did not correct for over-absorption effects (Manceau et al., 2002). In fluorescence 193
mode XANES, over-absorption can result in a decrease in the amplitude of the absorption 194
peaks in samples where the absorber mass is high. This can result in a relative increase in 195
the pre-edge peak intensities relative to the main absorption edge, but it does not impact 196
the relative intensities of the two pre-edge peak multiplets or their energy positions 197
(Botcharnikov et al., 2005; Cottrell et al., 2009; Zhang et al., 2016). Moreover, while 198
over-absorption can affect pre-edge peak intensities, all glass compositions examined 199
here have sufficiently high total FeO contents (7-12 wt.%) and thicknesses (> 50m) to 200
be in the infinite thickness regime. 201
202
X26A, NSLS, Brookhaven National Laboratory, USA. NSLS (decommissioned in 203
October, 2014) operated at 2.8 GeV and 300 mA. We collected fluorescence spectra on 204
the B series glasses at bending magnet beamline X26A using summed energy dispersive 205
spectra from a 4-element Vortex ME-4 silicon drift diode detector and two single element 206
Vortex-EX detectors (Hitachi) with pulse processing provided by an XMap digital 207
spectrometer system (XIA). The first derivative of Fe K-edge spectra (E0) collected on 208

10
zero-valent Fe E0 is 7112.0 eV. All other methods details are as reported by Cottrell et al. 209
(2009). The incident beam flux at X26A was consistently ~3x10⁹ photons/sec and the 210
spot size was 9 x 5 microns such that the photon flux density was ~ 6.7x10⁷ 211
photons/sec/um2 (Table 2); after a 15.5 minute collection the absorbed dose per spectrum 212
was ~6x10¹⁰ photons/um2. 213
214
13-ID-E, GSECARS, Advanced Photon Source, Argonne National Laboratory, USA. 215
Details regarding the beamline configuration for 13-ID-E can be found in Sutton et al. 216
(2017). This undulator-based beam line at APS operates at 7 GeV and 85-101 mA. We 217
collected fluorescence spectra with a Vortex ME4 silicon-drift diode detector array 218
coupled to a high-speed digital spectrometer system (Quantum Xpress3). A cryogenically 219
cooled double-crystal Si (311) monochromator provided the monochromatic radiation. 220
The first derivative of Fe K-edge spectra (E0) collected on zero-valent Fe E0 is 7110.75 221
eV. We collected spectra from 7012 to 7102 eV in 2.5 eV steps with 1 sec dwell; from 222
7102 to 7132 eV (pre-edge region) in 0.1 eV steps with 1 sec dwell and from 7132 to 223
7492 eV (XAFS region) in 2.3 angstrom steps with 1 sec dwell. We edge-step normalized 224
the spectra collected at 13-ID-E by the average intensity between 7315 and 7320eV 225
where the spectra were flat. 226
227
The 13-ID-E beamline is capable of delivering and detecting in excess of 1x10¹² 228
photons/sec within a focused spot size of 2 x 2 microns at the Fe K-edge, so that focused 229
flux densities of ~5x10¹¹ photons/sec/m2 are possible – four orders of magnitude higher 230
than what was possible at X26A. We collected the experimental data presented here over 231

11
a ~104 range in flux density to precisely assess the spectral response to absorbed radiation 232
dose. At 13-ID-E we collected spectra using 6 protocols where incident flux density was 233
adjusted, through uspstream aperturing of the X-ray beam; through filtering using varying 234
thicknesses of aluminium foil; and through defocusing of the incident beam on the 235
sample. These conditions are reported in Table 2. 236
237
We also conducted one set of analyses at 13-ID-E under cryogenic conditions, using a 238
customized cryogenic stage described in Tappero et al. (2016, 2017), to investigate the 239
degree to which cryogenic cooling may mitigate the observed iron oxidation. We 240
collected a time series at an energy of 7113.3 eV at both ambient and cryogenic 241
conditions reported in Table 2. 242
243
Fourier Transform Infrared (FTIR) Spectroscopy 244
Glass chip B10 (Table 1) was analyzed by FTIR for dissolved total H2O using a Thermo 245
Nicolet iS50 FTIR bench spectrometer coupled with a Continuum IR microscope with 246
automated mapping capability at the Graduate School of Oceanography, University of 247
Rhode Island. We mapped an area on a chip of B10 that had been purposely exposed to 248
high photon flux at beamline 13-ID-E. The map was collected using transmission FTIR 249
with a 20 x 20 µm square aperture and no overlap between pixels. Each spectrum was 250
collected over 1200-6000 cm-1 wavenumbers using 256 scans at 1 cm-1 resolution. 251
Individual transmission spectra were reduced for H2OTotal after fitting the spectral 252
background with a spline function and calculating the net intensity of the absorbance 253
band at 3500 cm-1. The H2OTotal concentration was then calculated using the Beer-254

12
Lambert law, a calculated density of 2.90 g/cm3, thickness of 49±1 µm, and the molar 255
absorption coefficient ε3530=63 , which is assumed constant within the compositional 256
range of basalts (Dixon et al., 1995). 257
258
RESULTS 259
Mössbauer Spectra 260
Mössbauer-derived Fe3+/Fe ratios are not very sensitive to fitting philosophy or method, 261
but in this study we re-fit the B glass spectra acquired by Botcharnikov et al. (2005) to 262
eliminate any potential bias between the disparate fitting routines of Cottrell et al. (2009) 263
and Botcharnikov et al. (2005). In addition, our new fits allow us to report hyperfine 264
parameters for these glasses that may aid in understanding the structural environment of 265
Fe in hydrous and anhydrous glasses. We provide the Mössbauer spectra from 266
Botcharnikov et al. (2005) and our fits from this study (both raw data and plots) in the 267
Supplementary Material. 268
269
Two quadrupole doublets, one ferric with a low IS of 0.4 to 0.6 mm/s (relative to Fe 270
metal) and low QS of 0.8 to 1.1 mm/s, and one ferrous with a high isomer shift of 0.8 to 271
1.0 mm/s and quadrupole splitting of 1.9 to 2.2 mm/s, describe the Mössbauer spectra of 272
the B glasses (Table 1, and Figures S1, S2). The Botcharnikov et al. (2005) study did not 273
report hyperfine parameters, but the hyperfine parameters derived from the glass spectra 274
in this study are similar to those reported previously in the literature for silicate glasses 275
(Alberto et al., 1996; Jayasuriya et al., 2004; Mysen et al., 1985a; Zhang et al., 2016). 276
Ferrous iron IS and QS in the hydrous B glasses are within error of those for the 277

13
anhydrous glasses for all but the most highly oxidized glasses, for which the quadrupole 278
splitting in the hydrous glasses is higher. The QS for ferric iron is smaller in hydrous 279
glasses than in anhydrous glasses by approximately 0.25 to 0.45 mm/s. The IS of ferric 280
iron is slightly higher in the hydrous glasses than in the anhydrous glasses, and decreases 281
with increasing Fe3+/Fe ratio, as expected (Mysen and Richet, 2005; Mysen and Virgo, 282
1989; Mysen et al., 2006). While many factors influence the coordination of ferric iron in 283
silicate glasses (Mysen and Richet, 2005), the greater ferric IS observed in the hydrous 284
glasses suggests that the O—Fe3+ bong length is longer, and weaker (e.g.Johnson et al., 285
1999), and that ferric iron is in higher average coordination (greater domination of VIFe3+) 286
in the hydrous B glasses than in the anhydrous AII and LW glasses. Higher coordination 287
of ferric iron in the hydrous glasses is consistent with results from (Wilke et al., 2002; 288
Wilke et al., 2006), and is corroborated by XANES spectra, as we discuss below. 289
290
The Fe3+/Fe ratios in the B glasses, as determined by the new fits reported here, range 291
from 0.12 to 0.56, compared to 0.10 to 0.60 for those same glasses reported in 292
Botcharnikov et al. (2005). The Fe3+/Fe ratios of all B glasses with nominal Fe3+/Fe 293
<0.50 agreed within 1 (2.7% absolute) with the values reported by Botcharnikov et al. 294
(2005). The three glasses with Fe3+/Fe ratios > 0.50 agreed within 2of the 295
uncertainties on the fits (4.4% absolute). These fits are within the commonly accepted 296
uncertainty of the technique, which ranges from 1 to 6% in absolute Fe3+/Fe ratio 297
(Dyar et al., 1987; Mysen et al., 1985a; Mysen et al., 1985b). Fe3+/Fe ratios from the 298
Botcharnikov et al. (2005) study correlate very well with ratios obtained in this study (R2 299
> 0.99, m = 0.9, b = 1.87). Consistent with the results of Cottrell et al. (2009), Zhang et 300

14
al. (2015), and Zhang et al. (submitted), inclusion of a second doublet in the present study 301
did not reduce the χ2 of the fits. 302
303
XANES 304
Bending Magnet Beamlines, X26A NSLS. 305
Full XANES spectra of hydrous B and anhydrous AII and LW glasses collected at 306
bending magnet beamline X26A are shown in Figure 1. We provide spectra for AII and 307
LW anhydrous glasses for a 2014 NSLS session for reference (there is no substantive 308
change since their initial publication in Cottrell et al., 2009). As demonstrated by 309
Botcharnikov et al. (2005) for previous XANES analyses of the B glasses, the energy of 310
the main absorption edge, the ratio of pre-edge peak intensities, and the area-weighted 311
average energy of the pre-edge peaks (the centroid) in the XANES spectra shift smoothly 312
as a function of Fe3+/Fe ratio (e.g., Berry et al., 2003; Botcharnikov et al., 2005; Cottrell 313
et al., 2009; Wilke et al., 2005). The shift in centroid energy provides a precise proxy for 314
Fe3+/Fe ratio in basaltic glasses, especially for Fe3+/Fe ratios below 0.50 (Henderson et 315
al., 2014). We report the centroids and pre-edge peak intensities for all glasses in Table 3. 316
We provide all fitting parameters in Table S2. Consistent with the results of Cottrell et al. 317
(2009), centroids obtained from spatially independent spectra are precise to ≤ ±0.01 eV. 318
319
For anhydrous LW and AII glasses and hydrous B glasses, we plot the Fe3+/Fe ratios 320
derived from Mössbauer fits determined by Botcharnikov et al. (2005) and this study 321
against the Fe3+/Fe ratios derived from XANES at low flux using the anhydrous 322
calibration curve of Cottrell et al. (2009). Regardless of which set of Mössbauer values 323

15
are used, the Fe3+/Fe ratios of the hydrous glasses fall within 1of a 1:1 relationship 324
(Figure 2a). 325
326
Undulator-based Beamlines, 13-ID-E, APS. 327
Full XANES spectra of AII, LW, and B glasses collected at insertion device beamline 13-328
ID-E (GSECARS) are shown in Figure 1 and we provide fitting parameters in Table S2. 329
330
Condition XANES1, Anhydrous Glasses. We report centroids (area weighted average 331
energy of the two pre-edge multiplets) under “nominal” operating conditions at 13-ID-E, 332
our condition “XANES1,” for each glass in Table 3. 333
334
Under normal high flux operating conditions at station 13-1D-E, we recover the Fe3+/Fe 335
ratios of anhydrous glasses when we use the calibration of Cottrell et al. (2009), which 336
was developed at low flux. Anhydrous glass Fe3+/Fe ratios derived from XANES at 337
high flux fall within 1of a 1:1 relationship with the Mossbauer-derived values (Figure 338
2b). Supplemental Figure S3a and Table 3 show that high flux centroids are on average 339
within ±0.008eV (within 1 of low flux centroids. One might conclude from this that the 340
centroid, as a spectral feature, is a robust proxy for assessment of the Fe3+/Fe ratio for 341
anhydrous glasses. We emphasize again, however, the importance of normalizing to a 342
standard. While the centroids at the two facilities are reproducible, the individual spectral 343
features are not. Differences in modelled spectral features (Figures S3b,c,d), and the raw 344
spectra (Figure S4), reflect the smaller vertical emittance of the 13-ID-E undulator 345
electron beam compared to the X26A bending magnet source, and the optical 346

16
configuration at each beamline. That we reproduce the centroids of anhydrous glasses 347
across facilities to approximately ± 0.01 eV is a non-trivial result. Fiege et al. (2017) state 348
that the “overall uncertainty” in the centroid is an order of magnitude higher (± 0.1 eV). 349
We attribute the high precision we achieve primarily to ensuring that we account for 350
instrumental drift within and between analytical sessions by shifting the energy of all 351
centroids such that the centroid of LW_0 7112.3 eV. The key result is that the 352
anhydrous glass centroids remain stable within uncertainty at all beam conditions and 353
across all facilities. 354
355
Condition XANES1, Hydrous Glasses. At a given Fe3+/Fe ratio, the centroids of hydrous 356
B glasses are variably shifted to higher values at 13-ID-E under nominal operating 357
conditions (XANES1), in stark contrast to the highly reproducible anhydrous glasses 358
(Table 3). For some hydrous glasses (e.g., B20), we derive the same centroid within 359
0.003eV (within 1) between facilities, but for others (e.g., B11) we derive a centroid up 360
to 0.25eV higher (25 higher) under high flux conditions than low flux conditions 361
(Figure S4). This manifests as XANES-derived Fe3+/Fe ratios that are up to 1.7 times 362
higher than those derived from Mössbauer spectroscopy (Figure 2b). 363
364
Intensity of 2nd
Multiplet with Time. To better evaluate how the Fe XANES spectra of 365
these glasses evolve with accumulated radiation dose, we conducted experiments to 366
monitor changes in the intensity of the second pre-edge multiplet at 7113.3 eV (attributed 367
to Fe3+) as a function of time and flux density (i.e. dose). Glass B11 was used for this 368
experiment; it is the most hydrous in the suite under study, with 4.82 wt.% total dissolved 369

17
water. This glass is relatively reduced relative to other hydrous glasses tested, with a 370
Fe3+/Fe = 0.19. 371
372
Figure 3 plots the peak amplitude of the second pre-edge multiplet peak of hydrous glass 373
B11 with time, measured at high flux density and low flux density under both ambient 374
and cryogenically cooled conditions. We first consider data collected at ambient 375
temperature. Peak amplitude increases with time under high and low flux conditions, with 376
a rapid increase observed within the first 100 seconds of high flux irradiation. The higher 377
photon flux density generated by the focused beam causes a greater increase in the 378
amplitude of the second pre-edge multiplet at all time points. However, when the change 379
in amplitude is measured relative to the dose delivered, the amplitude of the second 380
multiplet (extent of damage) increases at approximately the same rate in high and low 381
flux density conditions. This evidences the dose-dependence of the spectral change. 382
While low flux beam damage does not affect the centroid of these hydrous glasses within 383
the measurement error of our calibration (Figures 2, S5), these data show that damage 384
occurs in hydrous glasses even at low flux density. 385
386
We then explored the degree to which cryogenic cooling impacts spectral evolution with 387
time. Studies over a broad range of incident beam energies show that cryo-cooling of 388
biological samples significantly reduces damage due to mass (water) loss during 389
exposure to ionizing radiation (e.g. Dubochet et al., 1988; Steinbrecht and Zierold, 2012). 390
Cryo-cooling may also potentially reduce the rate of beam-induced changes in metal 391
valence state in some materials (Corbett et al., 2007; Grabolle et al., 2006), although the 392

18
degree to which this mitigates the effects is debated (Beetz and Jacobsen, 2003; Meents 393
et al., 2010). We repeated the time series experiments described previously on sample 394
B11, with the glass held at -195°C. The measurements show the surprising result that at 395
cryogenic temperatures, under both high and low flux density conditions, the relative rate 396
of Fe oxidation increases. Beam damage is worse at cryogenic temperatures. 397
398
It is also instructive to see that spectral changes plateau under all conditions studied 399
within 3-16 minutes. It takes anywhere from approximately 4 to 30 minutes to collect an 400
entire quality XANES spectrum on glass with FeO concentrations between 5 and 10 wt.% 401
(e.g. Cottrell and Kelley, 2011; Shorttle et al., 2015). Therefore, successive XANES 402
spectra, collected at a single sample position, may not show any measurable change if 403
damage begins to plateau before acquisition of the first spectrum is finished. 404
405
Conditions XANES3, 4. Successive Analysis at one position. Using glass B11 again, we 406
show in Figure 4a and Table S3 how the centroids of successive analyses on the same 407
spot in glass B11 increase if we employ condition XANES4, a very low flux achieved by 408
attenuating and defocusing the beam to 50x50m. The centroid increases approximately 409
logarithmically in energy for each successive spectrum. Contrast this with successive 410
spots at the same incident flux, but with the beam focused to 2x2m (XANES3), in which 411
case the total number of photons delivered to a given area (photons/m2) is higher after 412
one spectral acquisition than after successive analyses under condition XANES4. The 413
centroid is commensurately higher, and plateaus after one acquisition. Consistent with 414
Cottrell et al., 2009, we observe no change in the centroid or pre-edge peak intensities 415
19
with successive analyses on anhydrous glass AII_0. Figure 4b reveals how the integrated 416
intensity (area) of the Gaussian extracted for the first multiplet (IFe2+) decreases while the 417
integrated intensity of the second multiplet (IFe3+) increases. Evolution of the spectra in 418
this manner is consistent with oxidation of Fe2+ to Fe3+. 419
420
Observations of the raw spectra (Figure 5) confirm the spectral evolution seen in the 421
modelled parameters. Raw spectra collected sequentially at a given position on sample 422
B11, under condition XANES4, show decreases in the intensity of the first pre-edge 423
multiplet and increases in intensity of the second pre-edge multiplet. In addition, we see 424
the main absorption edge move to higher energy as radiation dose accumulates. Spectral 425
changes are consistent with an increase in the average oxidation state of Fe with 426
increasing radiation dose. 427
428
Beam Damage Persists Indefinitely 429
To assess the longevity of beam damage, we mapped glass B11 approximately one year 430
after a session in which we investigated beam damage. In figure 6, image brightness 431
scales with the ratio between the Fe K fluorescence peak amplitude at 7113.2 eV, the 432
energy maximum for the Fe3+ pre-edge multiplet peak, and at 7111.6 eV, the energy 433
maximum for the Fe2+ pre-edge multiplet peak. In the false-color inset, the bright white 434
areas correspond to previously analysed spots. From this map it is evident that areas 435
exposed to high radiation dose retain higher Fe3+/Fe2+ ratios than adjacent areas that were 436
not exposed to the X-ray beam at least one year after exposure. Beam damage persists 437
indefinitely. 438

20
439
Coordination of Fe in Hydrous and Anhydrous Glasses 440
Figure 7 compares the summed integrated pre-edge intensities (IFe2+ + IFe3+) of hydrous 441
and anhydrous glasses as a function of their centroids – what Wilke et al. (2001) coined a 442
“variogram.” A negative non-linear correlation between coordination and oxidation state 443
is inferred for glasses as well as minerals with mixed geometries (e.g. Jackson et al., 444
2005; Wilke et al., 2001). Because IFe2+ and IFe3+ are extremely sensitive to detector dead 445
time, edge-step normalization procedure, self-absorption etc., they are generally not 446
comparable between facilities and are even difficult to compare between analytical 447
sessions at the same facility (Cottrell et al., 2009). We only compare spectra acquired at 448
APS in Figure 7; these have been collected and processed under conditions as uniform as 449
can be practically achieved. 450
451
All glasses display typical pre-edge intensities indicative of 5-fold or mixed 4-fold and 6-452
fold coordination (Wilke et al., 2001; Wilke et al., 2005). We see that hydrous glasses fall 453
along the same trend of increasing integrated pre-edge intensity with centroid energy 454
under both the high flux density condition XANES3 and the low flux density condition 455
XANES4. Covariation in the oxidation state and coordination of Fe in these glasses is 456
consistent with a shift in Fe coordination upon exposure to radiation only in proportion to 457
the shift in Fe oxidation state. This analysis therefore also points to actual oxidation of 458
Fe2+ to Fe3+ in the hydrous glasses. 459
460
The variogram also corroborates the site geometry analysis of the Mössbauer spectra, 461
21
which revealed higher Fe3+ isomer shift (and smaller quadrupole splitting) in hydrous B 462
glasses relative to anhydrous glasses (Figure S1), consistent with longer, weaker, O—463
Fe3+ bonds, and Fe3+ in higher coordination in the hydrous glasses than the anhydrous AII 464
and LW glasses. In Figure 7, anhydrous glasses display higher integrated intensities 465
(lower average coordination) than hydrous glasses at any given centroid energy, 466
consistent with longer and weaker O—Fe3+ bonds in the hydrous glasses. Correcting for 467
over-absorption does not change this relationship. 468
469
DISCUSSION 470
Beam Damage Mechanism 471
The 1s absorption edge and pre-edge peaks in 3d transition metals, like Fe, are due to 472
electron transitions from 1s to 3d states (e.g. Henderson et al., 2014). Quadrupole (1s3d) 473
and dipole (1s to the 4p character of the 3d band) transitions are possible in silicate 474
glasses, owing to iron’s mixed coordination. In XANES spectra, Fe2+ exhibits 2 or 3 pre-475
edge peaks, and Fe3+ exhibits 1 or 2 pre-edge peaks, depending on coordination (Westre 476
et al., 1997). IFe2+ and IFe3+ increase as coordination number decreases (i.e. with higher 477
extents of 3d + 4p mixing) because of the added dipole contribution (Penner-Hahn, 2005; 478
Roe et al., 1984; Westre et al., 1997). The relative integrated intensities and energies of 479
the pre-edge peaks therefore depend on the metal site geometry: the relative proportions 480
of Fe2+ and Fe3+ and their coordination as tetrahedral (4-fold) or octahedral (6-fold) 481
(Henderson et al., 2014; Wilke et al., 2001). Thus, it is necessary to evaluate the degree 482
to which the observed beam-induced changes in the XANES spectra reflect changes in 483
effective Fe valence as compared to coordination, particularly since in glasses these 484

22
effects are coupled. 485
486
We considered the possibility that exposure to radiation in hydrous glasses, but not 487
anhydrous glasses, might increase 3d-4p hybridization of Fe3+ centers. For example, 488
Fe3+—OH- bonds could respond differently to radiation than Fe3+—O bonds. Augmented 489
hybridization of Fe3+ centers in hydrous glasses would increase the dipole contribution to 490
the second multiplet, increase its integrated intensity, and increase the centroid, without 491
any change in the actual average oxidation state of Fe. Yet, several lines of evidence 492
argue against this possibility. First, upon exposure to a high photon flux density, the 493
XANES spectra of the hydrous glasses show that the Fe3+ multiplet integrated intensity 494
increases and the Fe2+ multiplet intensity concomitantly decreases (Figure 4). Moreover, 495
the white line shifts to progressively higher energy as well (Figure 5). These three 496
spectral changes together are much more consistent with oxidation of Fe2+ to Fe3+ than an 497
increase in 3d-4p hybridization, as the latter would result in neither a decrease in the 498
intensity of the first multiplet, nor a shift in the main edge. 499
500
Because no measurable change in the XANES spectra is observed as a function of dose in 501
spectra collected from anhydrous glasses (e.g. Figures 2, 4), we hypothesize that the 502
changes we observe in the spectra of hydrous B glasses with exposure to ionizing 503
radiation relates to their dissolved water contents. Here we use Fe3+/FeMöss – 504
Fe3+/FeXANES as a proxy for beam-induced Fe oxidation, where Mössbauer spectra 505
establish the “true” Fe3+/Fe ratio, and the XANES centroid the “apparent” Fe3+/Fe 506
ratio (Table 3). Indeed, when we compare glass B8 to B16, glasses of similar Fe3+/Fe 507

23
ratio, we see that the centroid of glass B16, with > 3.6 times more dissolved water, is 508
overestimated by ~70%, whereas the centroid of glass B8 is overestimated by ~27% 509
when exposed to the same radiation dose. Figure 8a shows, however, that total dissolved 510
H2O in the glasses does not correlate with beam-induced Fe oxidation. For example, the 511
anhydrous XANES calibration of Cottrell et al. (2009) predicts the Fe3+/Fe ratio of 512
hydrous glass B17, with 4.67 wt.% total water, within error of its “true” value, while the 513
centroid of B11, with nearly indistinguishable dissolved water content, is overestimated 514
by >70% (Figure 4, 11). The latter overestimation of Fe3+/Fe ratio leads to 515
overestimation of fO2 by two orders of magnitude. 516
517
Following this, it is also clear that when the initial oxidation state of Fe is high, the 518
spectral response to radiation (beam damage) is lessened (Figure 8b). Upon exposure to 519
the same high photon dose (condition XANES1), the Fe3+/Fe ratios of hydrous glasses 520
with lower Fe3+/Fe ratios are greatly overestimated in comparison to glasses with higher 521
Fe3+/∑Fe ratios, which appear to be well predicted by the Mössbauer calibration (R2 522
linear correlation = 0.53; R2 exponential correlation = 0.72, Figure 8b). 523
524
All the evidence suggests to us that the mechanism of Fe oxidation involves breaking of 525
O—H bonds by incident ionizing radiation, loss of hydrogen, and concomitant oxidation 526
of Fe2+ to Fe3+. One possible reaction, analogous to that proposed for radiation-induced 527
oxidation of S dissolved in hydrous silicate glasses by Klimm et al. (2012) is: 528
𝐻2𝑂 + 2𝐹𝑒2+𝑂 → 𝐻2 (𝑔𝑎𝑠?)↑ + 𝐹𝑒2
3+𝑂3
The loss of hydrogen gas is consistent with the longevity of the beam damage, as 529

24
discussed above and shown in Figure 6. This mechanism is also consistent with the 530
observed dependence on both the initial Fe3+/Fe ratio and the dissolved water content of 531
the hydrous glass. 532
533
The hypothesized mechanism suggests that a fruitful metric for predicting the 534
susceptibility of hydrous glass to beam damage is the molar ratio of dissolved total water 535
to the ferric/ferrous ratio as determined by Mössbauer spectroscopy 536
(Φ=XHO1.5*XFeO/XFeO1.5 ratio) (Table 1). We find that beam damage susceptibility, 537
Φ, correlates strongly with the extent to which high photon flux XANES1 overestimates 538
the Fe3+/Fe ratio (R2 = 0.92, n=14, b ≡ 0 because anhydrous glasses show no damage) 539
(Figure 8c). 540
541
Inspection of the raw spectra of the B glasses under conditions XANES3 and XANES4 542
confirms that spectral changes increase as a function of dose and increasing Φ, with 543
anhydrous glasses showing no spectral change (Figure 9). Visual inspection also verifies 544
that the spectral features all evolve in a manner consistent with oxidation of ferrous iron 545
to ferric iron: IFe2+ falls; IFe3+ grows; and the K edge shifts to higher energy. Spectral 546
changes increase in proportion to Φ. We provide the raw spectra for Figure 9 in Table S4. 547
548
We tested this hypothesis by subjecting glass B10 to a 25 µm beam of high photon flux 549
of ~1x10¹² photons/sec for ~ 12 minutes (Figure 10). We subsequently mapped the area 550
surrounding this spot on the sample via Fourier Transform Infrared spectroscopy (FTIR). 551
The FTIR data show that the area of the glass adjacent to the exposed spot (e.g., pixel 1, 552

25
Figure 10) also has significantly lower dissolved H2O than areas of the glass distant from 553
exposure (e.g., pixel 2, Figure 10). We reduced individual FTIR spectra from pixels 1 and 554
2 by fitting the background of the total H2O absorption band at 3500 cm-1 with a spline 555
function that was then subtracted from the spectra before measuring the band height. This 556
analysis shows that pixel 2, away from the potential damage zone, has a total dissolved 557
H2O content of 2.43 wt.%, which is identical to the reported H2O content for this glass by 558
Botcharnikov et al. (2005). The dissolved H2O content of pixel 1, however, is 900 ppm 559
lower (2.34 wt.%). Pixel 1 is not coincident with the location of the XANES beam at the 560
sample surface. Rather, the incident X-ray beam intersects the sample surface at a 45° 561
angle relative to the FTIR incident beam, which is normal to the sample surface. The high 562
flux X-ray beam travelled through the sample, from right to left in Figure 10, at 45° 563
angle, and thus interacted with the glass chip to the left of the beam cross-hair location. 564
We conclude from this assessment that exposure of this sample to a high-flux XANES 565
beam caused both oxidation of Fe and loss of H2O from the glass, which supports the 566
proposed mechanism of Fe oxidation via hydrogen loss. We note that only a few percent 567
of the Fe fluorescence we measure comes from the sample surface. The geometrical 568
considerations we present above and the magnitude of the spectral changes and water loss 569
we observe require chemical changes to the bulk affected volume. Damage cannot be 570
limited to the sample surface. 571
572
Cryo-cooling has been shown to mitigate beam damage (e.g. Steinbrecht and Zierold, 573
2012; Corbett et al., 2007). Our finding that cryo-cooling exacerbated Fe2+ oxidation in 574
hydrous glass is an important and counterintuitive observation. We have shown that 575

26
hydrogen concentrations in the glass are lower in areas that have experienced oxidizing 576
beam damage, consistent with radiation-induced breaking of O—H bonds, and 577
preferential diffusion of hydrogen, relative to oxygen, away from the area. Because it is 578
the relative diffusivity of hydrogen and oxygen that matters, and diffusivity depends 579
strongly on temperature, we speculate that oxygen is able to diffuse farther from the 580
analysed spot in the room temperature case than the cryo-cooled case (whereas hydrogen 581
is always able to diffuse away). This may be why cryo-cooling is counterproductive 582
when attempting to mitigate radiation-induced oxidation of Fe in hydrous silicate glass. 583
Indeed, Gonçalves Ferreira et al. (2013) found that heating soda-lime glasses to 500ºC 584
actually mitigated radiation-induced reduction of iron, emphasizing that the effect of 585
temperature on beam damage will depend on the nature and mechanism of beam damage 586
and is difficult to predict a priori. 587
588
IMPLICATIONS 589
Prior XANES studies of hydrous glasses 590
We have shown that synchrotron radiation causes progressive changes to the XANES 591
spectra of hydrous glasses, but not anhydrous glasses, as a function of radiation dose. 592
Spectral changes are consistent with preferential migration of hydrogen relative to 593
oxygen, and oxidation of iron, in the analysis spot. Our study reveals that oxidative beam 594
damage occurs in hydrous glasses even at the lowest flux densities achieved, but that 595
damage is not detectable outside of the error of anhydrous calibrations with exposure to 596
radiation doses typically found at bending magnet sources. Conversely, it would be 597
prudent to re-evaluate results from studies carried out on hydrous glasses at undulator 598

27
beam lines using a focused spot. 599
600
Mafic glasses may be synthesized experimentally with a wide range of Φ 601
(XHO1.5*XFeO/XFeO1.5) that may readily exceed those investigated in this study. Most 602
naturally occurring basaltic glasses, however, will have 0< Φ<1. For example, basaltic 603
glass inclusions in volcanic rocks from subduction zones have Φ ranging from ~0.34 to 604
~1; natural basaltic glasses from sea floor volcanoes erupting in back arc basins have 605
ratios ranging from ~0.2 to ~0.6; and mid-ocean ridge basalts have ratios between ~0.05 606
to ~0.28 (ranges estimated from data in Brounce et al. 2014b; Cottrell and Kelley, 2011; 607
Kelley and Cottrell, 2012; Zhang et al., submitted). Based on the work presented here, all 608
submarine basalts and undegassed melt inclusions would suffer significant beam damage 609
under nominal acquisition conditions (i.e. a focused beam) at unattenuated undulator 610
beam lines. We have also shown, however, that a radiation dose of ≤ 6 x 10⁷ 611
photons/sec/m2 mitigates (but does not prevent) beam damage on hydrous glasses with 612
Φ up to ~1. 613
614
We hypothesize that previous studies conducted at undulator beam lines have not 615
detected beam damage in hydrous glasses because, under nominal operating conditions, 616
radiation damage is maximum or “complete” after acquisition of a single spectrum (~600 617
seconds for spectra acquired under condition XANES1). Collection of multiple spectra at 618
a single position on the glass under condition XANES1 will therefore return the same 619
centroid because damage is complete (“saturated”) before the pre-edge is scanned the 620
first time (e.g. Moussallam et al., 2016; Moussallam et al., 2014). For materials with 621

28
relatively low Φ, it may be sufficient at an undulator source to attenuate the beam to 622
prevent beam damage from exceeding detection limits (e.g. Shorttle et al., 2015). We 623
have shown here, however, that even at the lowest fluxes achievable at 13-ID-E, 624
attenuation is insufficient to prevent beam damage; the beam must also be defocused. 625
626
Recommended analytical protocols for acquisition of Fe-XANES spectra on hydrous 627
glasses 628
Synchrotron radiation causes progressive changes to the XANES spectra of hydrous 629
glasses as a function of radiation dose and Φ. Dose is a function of photon flux, beam 630
diameter, and exposure time, and can/should be calculated and reported for any 631
synchrotron experiment. Attenuating the beam, defocusing the spot, or both, may 632
mitigate beam damage. Using a cryostat is unlikely to mitigate beam damage; it may 633
even exacerbate damage. This study suggests that a radiation dose of ≤ 6 x 10⁷ 634
photons/sec/m2 will allow the centroids of most terrestrial basalts to lie within analytical 635
error of anhydrous calibration curves. We emphasize that beam damage must be assessed 636
at each beamline and for the specific materials under analysis in a given study. 637
638
ACKNOWLEDGEMENTS 639
With admiration, we thank Catherine McCammon, who graciously provided her raw 640
Mössbauer spectra and laboratory notes to EC. We thank Tim Gooding and Tim Rose for 641
laboratory support at Smithsonian. EC gratefully acknowledges support from NSF EAR 642
1347248, NSF EAR 1426717 and NSF OCE 1433212. KK gratefully acknowledges 643
support from NSF EAR 1347330 and NSF OCE 1433182. We are grateful for support 644
29
from Smithsonian’s Scholarly Studies program. FD also acknowledges support from a 645
National Museum of Natural History Peter Buck Fellowship. We are grateful for support 646
for X26A from Department of Energy (DOE) GeoSciences DE-FG02-92ER14244. The 647
DOE Office of Science supported use of the NSLS under Contract No. DE-AC02-648
98CH10886. We acknowledge the support of GeoSoilEnviroCARS (Sector 13), which is 649
supported by the National Science Foundation - Earth Sciences (EAR-1128799), and the 650
Department of Energy, Geosciences (DE-FG02-94ER14466). This research used 651
resources of the Advanced Photon Source, a U.S. Department of Energy (DOE) Office of 652
Science User Facility operated for the DOE Office of Science by Argonne National 653
Laboratory under Contract No. DE-AC02-06CH11357. We thank editorial handling by 654
Sasa Bajt and Keith Putirka as well as two anonymous reviewers for constructive 655
comments that improved the submission. 656
657
658

30
REFERENCES 659
Alberto, H.V., Pinto da Cunha, J.L., Mysen, B.O., Gil, J.M., and Ayres de Campos, N. (1996) Analysis of 660 Mossbauer spectra of silicate glasses using a two-dimensional Gaussian distribution of hyperfine 661 parameters. Journal of Non-Crystalline Solids, 194, 48-57. 662
Arlot, S. and Celisse, A. (2010) A survey of cross-validation procedures for model 655 selection. Statist. 663 Surv. 4, 40-79. 664
Bajt, S., Sutton, S.R., and Delaney, J.S. (1994) X-Ray Microprobe Analysis of Iron Oxidation-States in 665 Silicates and Oxides Using X-Ray-Absorption near-Edge Structure (Xanes). Geochimica Et 666 Cosmochimica Acta, 58(23), 5209-5214. 667
Beetz, T., and Jacobsen, C. (2003) Soft X-ray radiation-damage studies in PMMA using a cryo-STXM. 668 Journal of Synchrotron Radiation, 10(3), 280-283. 669
Berry, A.J., O'Neill, H.S.C., Jayasuriya, K.D., Campbell, S.J., and Foran, G.J. (2003) XANES 670 calibrations for the oxidation state of iron in a silicate glass. American Mineralogist, 88(7), 967-671 977. 672
Botcharnikov, R.E., Koepke, J., Holtz, F., McCammon, C., and Wilke, M. (2005) The effect of water 673 activity on the oxidation and structural state of Fe in a ferro-basaltic melt. Geochimica Et 674 Cosmochimica Acta, 69(21), 5071-5085. 675
Brounce, M., Kelley, K., and Cottrell, E. (2014a) Variations in Fe3+/∑ Fe of Mariana arc basalts and 676 mantle wedge fO2. Journal of Petrology, 55(12), 2513-2536. 677
Brounce, M., Kelley, K.A., and Cottrell, E. (2014b) The Fe3+/ΣFe variations in Mariana Arc basalts and 678 primary fO2 of the mantle wedge. Journal of Petrology, 55(12), 2513-2536. 679
Carmichael, I.S.E. (1991) The Redox States of Basic and Silicic Magmas - a Reflection of Their Source 680 Regions. Contributions to Mineralogy and Petrology, 106(2), 129-141. 681
Corbett, M.C., Latimer, M.J., Poulos, T.L., Sevrioukova, I.F., Hodgson, K.O., and Hedman, B. (2007) 682 Photoreduction of the active site of the metalloprotein putidaredoxin by synchrotron radiation. 683 Acta Crystallographica Section D: Biological Crystallography, 63(9), 951-960. 684
Cottrell, E., and Kelley, K.A. (2011) The oxidation state of Fe in MORB glasses and the oxygen fugacity of 685 the upper mantle. Earth and Planetary Science Letters, 305(3-4), 270-282. 686
Cottrell, E., Kelley, K.A., Lanzirotti, A., and Fischer, R.A. (2009) High-precision determination of iron 687 oxidation state in silicate glasses using XANES. Chemical Geology, 268(3-4), 167-179. 688
Dixon, J.E., Stolper, E.M., and Holloway, J.R. (1995) An experimental study of water and carbon 689 dioxide solubilities in mid ocean ridge basaltic liquids .1. Calibration and solubility models. 690 Journal of Petrology, 36(6), 1607-1631. 691
Dubochet, J., Adrian, M., Chang, J.-J., Homo, J.-C., Lepault, J., McDowall, A.W., and Schultz, P. (1988) 692 Cryo-electron microscopy of vitrified specimens. Quarterly reviews of biophysics, 21(2), 129-228. 693
Dyar, M.D., Breves, E.A., Gunter, M.E., Lanzirotti, A., Tucker, J.M., Carey, C., Peel, S.E., Brown, E.B., 694 Oberti, R., and Lerotic, M. (2016) Use of multivariate analysis for synchrotron micro-XANES 695 analysis of iron valence state in amphiboles. American Mineralogist, 101(5), 1171-1189. 696
Dyar, M.D., Naney, M.T., and Swanson, S.E. (1987) Effects of Quench Methods on Fe3+/Fe2+ Ratios - a 697 Mossbauer and Wet-Chemical Study. American Mineralogist, 72(7-8), 792-800. 698
Eeckhout, S.G., Neisius, T., and Castañeda, C. (2005) Oxidation effects in beryl induced by synchrotron 699 radiation. Nuclear Instruments and Methods in Physics Research Section B: Beam Interactions 700 with Materials and Atoms, 229(1), 73-77. 701
Fiege, A., Ruprecht, P., Simon, A.C., Bell, A.S., Göttlicher, J., Newville, M., Lanzirotti, T., and Moore, G. 702 (2017) Calibration of Fe XANES for high-precision determination of Fe oxidation state in glasses: 703 Comparison of new and existing results obtained at different synchrotron radiation sources. 704 American Mineralogist, 102(2), 369-380. 705
Frost, B.R. (1991) Introduction to oxygen fugacity and its petrologic importance. In D.H. Lindsley, Ed. 706 Oxide minerals: Petrologic and magnetic significance, 25, p. 1-9. BookCrafters Inc., Chelsea, MI. 707
Gaetani, G.A., O’Leary, J.A., Shimizu, N., Bucholz, C.E., and Newville, M. (2012) Rapid reequilibration 708 of H2O and oxygen fugacity in olivine-hosted melt inclusions. Geology, 40(10), 915-918. 709
31
Gaillard, F., Scaillet, B., Pichavant, M., and Beny, J.L. (2001) The effect of water and fO(2) on the ferric-710 ferrous ratio of silicic melts. Chemical Geology, 174(1-3), 255-273. 711
Grabolle, M., Haumann, M., Müller, C., Liebisch, P., and Dau, H. (2006) Rapid loss of structural motifs in 712 the manganese complex of oxygenic photosynthesis by X-ray irradiation at 10–300 K. Journal of 713 Biological Chemistry, 281(8), 4580-4588. 714
Gonçalves Ferreira, P., de Ligny, D., Lazzari, O., Jean, A., Cintora Gonzalez, O., and Neuville, D.R. (2013) 715 Photoreduction of iron by a synchrotron X-ray beam in low iron content soda-lime silicate glasses. 716 Chemical Geology, 346, 106-112. 717
Helz, R., Cottrell, E., Brounce, M., and Kelley, K. (2017) Olivine-melt relationships and syneruptive redox 718 variations in the 1959 eruption of Kīlauea Volcano as revealed by XANES. Journal of 719 Volcanology and Geothermal Research, 333, 1-14. 720
Henderson, G.S., de Groot, F.M.F., and Moulton, B.J.A. (2014) X-ray Absorption Near-Edge Structure 721 (XANES) Spectroscopy. Reviews in Mineralogy and Geochemistry, 78(1), 75-138. 722
B.L. Henke, E.M. Gullikson, and J.C. Davis. (1993) X-ray interactions: photoabsorption, scattering, 723 transmission, and reflection at E=50-30000 eV, Z=1-92. Atomic Data and Nuclear Data Tables 724 Vol. 54 (no.2), 181-342. 725
Jackson, W.E., F., F., Yeager, M., Mabrouk, P.A., Rossano, S., Waychunas, G.A., Solomon, E.I., and 726 Brown, G.E. (2005) Multi-spectroscopic study of Fe(II) in silicate glasses: Implications for the 727 coordination environment of Fe(II) in silicate melts. Geochimica Et Cosmochimica Acta, 69, 728 4315. 729
Jayasuriya, K.D., O'Neill, H.S., Berry, A.J., and Campbell, S.J. (2004) A Mossbauer study of the oxidation 730 state of Fe in silicate melts. American Mineralogist, 89(11-12), 1597-1609. 731
Johnson, J., Johnson, C., Holland, D., Mekki, A., Appleyard, P., and Thomas, M. (1999) Transition metal 732 ions in ternary sodium silicate glasses: a Mössbauer and neutron study. Journal of non-crystalline 733 solids, 246(1), 104-114. 734
Kelley, K.A., and Cottrell, E. (2009) Water and the Oxidation State of Subduction Zone Magmas. Science, 735 325(5940), 605-607. 736
-. (2012) The influence of magmatic differentiation on the oxidation state of Fe in a basaltic arc magma. 737 Earth and Planetary Science Letters, 329, 109-121. 738
Klimm, K., Kohn, S.C., O'Dell, L.A., Botcharnikov, R.E., and Smith, M.E. (2012) The dissolution 739 mechanism of sulphur in hydrous silicate melts. I: Assessment of analytical techniques in 740 determining the sulphur speciation in iron-free to iron-poor glasses. Chemical Geology, 322-323, 741 237-249. 742
Kress, V.C., and Carmichael, I.S.E. (1991) The compressibility of silicate liquids containing Fe2O3 and the 743 effect of composition, temperature, oxygen fugacity and pressure on their redox states. 744 Contributions to Mineralogy and Petrology, 108, 82-92. 745
Lagarec, K., and Rancourt, D.G. (1998) RECOIL, Mössbauer spectral analysis software for windows 746 (version 1.0). Department of Physics, University of Ottawa, Canada. 747
Lagarec, K., and Rancourt, D. (1997) Extended Voigt-based analytic lineshape method for determining N-748 dimensional correlated hyperfine parameter distributions in Mössbauer spectroscopy. Nuclear 749 Instruments and Methods in Physics Research Section B: Beam Interactions with Materials and 750 Atoms, 129(2), 266-280. 751
Le Voyer, M., Cottrell, E., Kelley, K.A., Brounce, M., and Hauri, E.H. (2015) The effect of primary versus 752 secondary processes on the volatile content of MORB glasses: An example from the equatorial 753 Mid‐ Atlantic Ridge (5° N–3° S). Journal of Geophysical Research: Solid Earth, 120(1), 125-144. 754
Matjuschkin, V., Brooker, R.A., Tattitch, B., Blundy, J.D., and Stamper, C.C. (2015) Control and 755 monitoring of oxygen fugacity in piston cylinder experiments. Contributions to Mineralogy and 756 Petrology, 169(1), 1-16. 757
Meents, A., Gutmann, S., Wagner, A., and Schulze-Briese, C. (2010) Origin and temperature dependence 758 of radiation damage in biological samples at cryogenic temperatures. Proceedings of the National 759 Academy of Sciences, 107(3), 1094-1099. 760
Moor, J., Fischer, T., Sharp, Z., King, P., Wilke, M., Botcharnikov, R., Cottrell, E., Zelenski, M., Marty, 761 B., and Klimm, K. (2013) Sulfur degassing at Erta Ale (Ethiopia) and Masaya (Nicaragua) 762

32
volcanoes: Implications for degassing processes and oxygen fugacities of basaltic systems. 763 Geochemistry, Geophysics, Geosystems, 14(10), 4076-4108. 764
Moore, G., Righter, K., and Carmichael, I.S.E. (1995) The Effect of Dissolved Water on the Oxidation-765 State of Iron in Natural Silicate Liquids. Contributions to Mineralogy and Petrology, 120(2), 170-766 179. 767
Moussallam, Y., Edmonds, M., Scaillet, B., Peters, N., Gennaro, E., Sides, I., and Oppenheimer, C. (2016) 768 The impact of degassing on the oxidation state of basaltic magmas: A case study of Kīlauea 769 volcano. Earth and Planetary Science Letters, 450, 317-325. 770
Moussallam, Y., Oppenheimer, C., Scaillet, B., Gaillard, F., Kyle, P., Peters, N., Hartley, M., Berlo, K., and 771 Donovan, A. (2014) Tracking the changing oxidation state of Erebus magmas, from mantle to 772 surface, driven by magma ascent and degassing. Earth and Planetary Science Letters, 393, 200-773 209. 774
Mysen, B.O., Carmichael, I.S.E., and Virgo, D. (1985a) A Comparison of Iron Redox Ratios in Silicate-775 Glasses Determined by Wet-Chemical and Fe-57 Mossbauer Resonant Absorption Methods. 776 Contributions to Mineralogy and Petrology, 90(2-3), 101-106. 777
Mysen, B.O., and Richet, P. (2005) Silicate Glasses and Melts - Properties and Structure. 548 p. Elsevier, 778 New York. 779
Mysen, B.O., and Virgo, D. (1989) Redox equilibria, structure, and properties of Fe-bearing 780 aluminosilicate melts: Relationships between temperature, composition, and oxyen fugacity in the 781 system Na2O-Al2O3-SiO2-FeO. American Mineralogist, 74, 58-76. 782
Mysen, B.O., Virgo, D., Neumann, E.R., and Seifert, F.A. (1985b) Redox Equilibria and the Structural 783 States of Ferric and Ferrous Iron in Melts in the System Cao-Mgo-Al2o3-Sio2-Fe-O - 784 Relationships between Redox Equilibria, Melt Structure and Liquidus Phase-Equilibria. American 785 Mineralogist, 70(3-4), 317-331. 786
Penner-Hahn, J.E. (2005) X-ray Absorption Spectroscopy. 787 Roe, A., Schneider, D., Mayer, R., Pyrz, J., Widom, J., and Que Jr, L. (1984) X-ray absorption 788
spectroscopy of iron-tyrosinate proteins. Journal of the American Chemical Society, 106(6), 1676-789 1681. 790
Rowe, M.C., Kent, A.J.R., and Nielsen, R.L. (2007) Determination of sulfur speciation and oxidation state 791 of olivine hosted melt inclusions. Chemical Geology, 236(3-4), 303-322. 792
Sack, R.O., Carmichael, I.S.E., Rivers, M., and Ghiorso, M.S. (1980) Ferric-Ferrous Equilibria in Natural 793 Silicate Liquids at 1bar. Contributions to Mineralogy and Petrology, 75(4), 369-376. 794
Shimizugawa, J., Umesaki, M., Hanada, M., Sakai, M., and Qiu, M. (2001) X-ray induced reduction of rare 795 earth ion doped in Na2O-Al2O3-B2O3 glasses. Journal of synchrotron radiation, 8(2), 797-799. 796
Shorttle, O., Moussallam, Y., Hartley, M.E., Maclennan, J., Edmonds, M., and Murton, B.J. (2015) Fe-797 XANES analyses of Reykjanes Ridge basalts: Implications for oceanic crust's role in the solid 798 Earth oxygen cycle. Earth and Planetary Science Letters, 427, 272-285. 799
Stamper, C., Melekhova, E., Blundy, J., Arculus, R., Humphreys, M., and Brooker, R. (2014) Oxidised 800 phase relations of a primitive basalt from Grenada, Lesser Antilles. Contributions to Mineralogy 801 and Petrology, 167(1), 954. 802
Steinbrecht, R.A., and Zierold, K. (2012) Cryotechniques in biological electron microscopy. Springer 803 Science & Business Media. 804
Sutton, S.R., Lanzirotti, A., Newville, M., Rivers, M.L., Eng, P., and Lefticariu, L. (2017) Spatially 805 Resolved Elemental Analysis, Spectroscopy and Diffraction at the GSECARS Sector at the 806 Advanced Photon Source. Journal of Environment Quality, 0(0), 0. 807
Tappero, R., Smith, R.J., Acerbo, A.S., DiFabio, J., and Miller, L. (2016) Can cryo-cooling mitigate 808 chemical changes for hydrated samples? International Conference on X-ray Microscopy. 809
Tappero, R., Smith, R.J., Acerbo, A.S., Lanzirotti, A., Newville, M., Sutton, S.R., Northrup, P., O'Hara, S., 810 and Miller, L.M. (2017) A portable cryostage system for X-ray fluorescence microprobes. 14th 811 International Conference on the Biogeochemistry of Trace Elements (ICOBTE). 812
Westre, T.A., Kennepohl, P., DeWitt, J.G., Hedman, B., Hodgson, K.O., and Solomon, E.I. (1997) A 813 Multiplet Analysis of Fe K-Edge 1s-3d Pre-Edge Features of Iron Complexes. Journal of 814 American Chemical Society, 119, 6297-6314. 815

33
Wilke, M., Behrens, H., Burkhard, D.J.M., and Rossano, S. (2002) The oxidation state of iron in silicic 816 melt at 500 MPa water pressure. Chemical Geology, 189(1-2), 55-67. 817
Wilke, M., Farges, F., Petit, P.-E., Brown, G.E., Jr., and Martin, F. (2001) Oxidation state and coordination 818 of Fe in minerals: An Fe K-XANES spectroscopic study. American Mineralogist, 86(5-6), 714-819 730. 820
Wilke, M., Jugo, P.J., Klimm, K., Susini, J., Botcharnikov, R., Kohn, S.C., and Janousch, M. (2008) The 821 origin of S4+ detected in silicate glasses by XANES. American Mineralogist, 93(1), 235-240. 822
Wilke, M., Partzsch, G.M., Bernhardt, R., and Lattard, D. (2005) Determination of the iron oxidation state 823 in basaltic glasses using XANES at the K-edge. Chemical Geology, 220(1-2), 143-161. 824
Wilke, M., Schmidt, C., Farges, F., Malavergne, V., Gautron, L., Simionovici, A., Hahn, M., and Petit, P.E. 825 (2006) Structural environment of iron in hydrous aluminosilicate glass and melt-evidence from X-826 ray absorption spectroscopy. Chemical Geology, 229(1-3), 144-161. 827
Zhang, H.L., Cottrell, E., Hirschmann, M.M., and Kelley, K.A. (submitted) Determination of Fe3+/ΣFe of 828 XANES basaltic glass standards by Mössbauer spectroscopy and its application to the oxidation 829 state of iron in MORB. Chemical Geology. 830
Zhang, H.L., Hirschmann, M.M., Cottrell, E., Newville, M., and Lanzirotti, A. (2016) Structural 831 environment of iron and accurate determination of Fe3+/ΣFe ratios in andesitic glasses by XANES 832 and Mössbauer spectroscopy. Chemical Geology, 428, 48-58. 833
Zhang, H.L., Solheid, P.A., Lange, R.A., von der Handt, A., and Hirschmann, M.M. (2015) Accurate 834 determination of Fe3+/∑Fe of andesitic glass by Mössbauer spectroscopy. American Mineralogist, 835 100(8-9), 1967-1977. 836
837 838 839 FIGURE CAPTIONS 840
841
Figure 1. XANES spectra for hydrous B glasses and anhydrous LW and AII glasses 842
under three radiation dose conditions. Left hand panels show full spectra; right hand 843
panels magnify the pre-edge region. Spectra are color-coded by relative Fe3+/Fe ratio as 844
determined by Mössbauer spectroscopy (black are the most reduced glasses, grading 845
through red and orange to yellow, which are the most oxidized glasses). Note the 846
smooth, monotonic, decrease in the intensity in the first pre-edge multiplet and increase 847
in intensity of the second pre-edge multiplet as a function of Fe3+/Fe ratio for the 848
hydrous samples under the bending magnet and low radiation dose conditions, and the 849
anhydrous glasses under all dose conditions. Spectra of hydrous B glasses under the high 850
radiation dose condition do not evolve systematically as a function of Fe3+/Fe ratio. 851
852

34
Figure 2. (A) Fe3+/Fe ratios determined by Mössbauer spectroscopy versus Fe3+/Fe 853
ratios determined by XANES at a flux of 106-7 photons/sec/m2 using the anhydrous 854
basalt calibration curve of Cottrell et al. (2009). Filled circles: anhydrous basalts, Cottrell 855
et al. (2009). Open squares: hydrous basalts, Botcharnikov et al (2005). Filled squares 856
and filled triangles: hydrous basalts, this study. The anhydrous basalts, on which this 857
calibration is based, fall slightly off the 1:1 line because we have used the average 858
centroid of these glasses collected over a 10 year period (n=30-50 per glass) as reported 859
in Zhang et al. (submitted) to highlight the reproducibility of the measurement. (B) The 860
same analysis as in (A), but at a higher flux of 1010 photons/sec/m2. Vertical 1 error 861
bars are smaller than the symbol sizes. Horizontal 1error bars are the errors on the 862
Mössbauer determinations. Dashed lines show the predictive capability of the model 863
using a leave-one-out cross validation method (Arlot and Celisse, 2010). The root mean 864
square uncertainty for the predicted Fe3+/Fe ratios of unknowns determined from the 865
basaltic calibration is <±0.01 (1). 866
867
Figure 3. Time-dependence of the intensity of the second pre-edge multiplet (FeK/IO) 868
during exposure to synchrotron radiation under four beam conditions: high flux density 869
(filled squares) and low flux density (open circles); and at ambient temperature (red) and 870
with the sample cryogenically cooled to -195°C (blue). The intensity of the second pre-871
edge multiplet is higher (i.e. more radiation-induced oxidative beam damage) when the 872
sample is cryogenically cooled under both beam conditions. 873
874
Figure 4. Evolution of spectral features as a function of spectrum number (proxy for 875

35
dose) for spectra acquired in succession in the same position on the sample for hydrous 876
glass B11 and anhydrous glass AII. (A) Evolution of centroids under two beam 877
conditions, high radiation dose condition XANES3 (‘+’ and ‘x’ symbols) and low 878
radiation dose condition XANES4 (circles and triangles). Centroids of successive spots on 879
anhydrous glass AII show no significant changes under either beam condition. 880
Application of a high radiation dose, typical of focused beams at undulator beamlines, 881
does not result in significant changes to the centroids of successive spectra on the same 882
spot of hydrous glass B11; however, centroids acquired using a high radiation dose are 883
higher than centroids collected on the same sample at low radiation dose. Significant 884
increases in the centroids of successive spots on hydrous glass B11 only become apparent 885
using a low radiation dose. Vertical 1 error bars are smaller than the symbol sizes. 886
(B) Evolution of IFe2+ and IFe3+ with successive spectra taken at the same position under 887
low radiation dose condition XANES4. Vertical 1 error bars are smaller than the symbol 888
sizes. 889
890
Figure 5. (A) Evolution the background-subtracted pre-edge, acquired via successive 891
analyses in the same sample position, as a function of radiation dose, using condition 892
XANES4. As the total dose increases, the intensity of the first pre-edge multiplet 893
decreases while the second increases. (B) The main edge moves to progressively higher 894
energy as dose increases. 895
896
Figure 6. The grey-scale image is a peak amplitude map collected at ~7113.2 eV (energy 897
of 2nd pre-edge multiplet) of hydrous glass B11. Image color is scaled to maximum 898

36
intensity, where white is high and black is low. The inset map is a peak amplitude map 899
collected at 7113.2/7111.6eV (peak amplitude of the 2nd pre-edge multiplet divided by 900
the peak amplitude of the 1st pre-edge multiplet). Image color is scaled to maximum peak 901
amplitude, where white is high and red is low. White areas show spots analysed >1 year 902
earlier. 903
904
Figure 7. A “variogram” showing the spectral characteristics of centroid versus 905
integrated pre-edge intensity (area) of Fe in end-member structural environments (large 906
empty circles) from Wilke et al., 2001 and glasses from this study. Anhydrous (black 907
circles) and hydrous glass (red and blue squares) spectral characteristics from this study 908
are consistent with iron in five-fold coordination or a mixture of four-fold and six-fold 909
coordination. Under the same radiation dose conditions, anhydrous glasses display higher 910
pre-edge intensities relative to hydrous glasses at a given centroid energy. Hydrous 911
glasses under high radiation dose conditions display higher pre-edge intensities than 912
under low radiation dose conditions; however, increases in pre-edge intensities are 913
proportional to increases in the centroid (Fe3+/Fe ratio). Vertical 1 error bars are 914
smaller than the symbol sizes. 915
916
Figure 8. We use Φ = Fe3+/FeMöss – Fe3+/FeXANES as a proxy for beam-induced Fe 917
oxidation (where Mössbauer spectra establish the “true” Fe3+/Fe ratio, and the XANES 918
centroid the “apparent” Fe3+/Fe ratio). The molar concentration of (A) dissolved water 919
(single cation basis), XHO1.5, (B) ferric iron (single cation basis), XFeO1.5, and (C) the 920
ratio of dissolved water multipled by the ferrous/ferric ratio, XHO1.5*XFeO/XFeO1.5, 921

37
versus %Fe3+/FeMöss – Fe3+/FeXANES. The correlation in (C) is forced through the 922
origin, because we observe no oxidative beam damage in anhydrous glasses. 1 error 923
bars are smaller than the symbol sizes. 924
925
Figure 9. Pre-edge spectra of one anhydrous and four hydrous glasses, with varying Φ 926
and under two radiation dose conditions. We display merged, successive spectra, 927
acquired under two different beam conditions: high radiation dose condition XANES3 928
(red) and low radiation dose condition XANES4 (blue). The black line shows the 929
difference between the spectra. 930
931
Figure 10. (A) FTIR transmission map of glass B10 surrounding an area purposely 932
exposed with a 2x2m synchrotron radiation beam at a photon flux of ~1x10¹² 933
photons/sec for ~12 minutes. We show the location of the beam at the sample surface, but 934
the beam intersects the sample surface at a 45° angle and travels through the sample from 935
left to right. Color scale shows the intensity of the H2OTotal absorbance band at 3500 cm-1 936
after subtraction of a reference intensity at 2300 cm-1. Each pixel is 20 x 20 µm. FTIR 937
spectra for pixels designated (1) and (2) are discussed in the text. 938
939
38
940
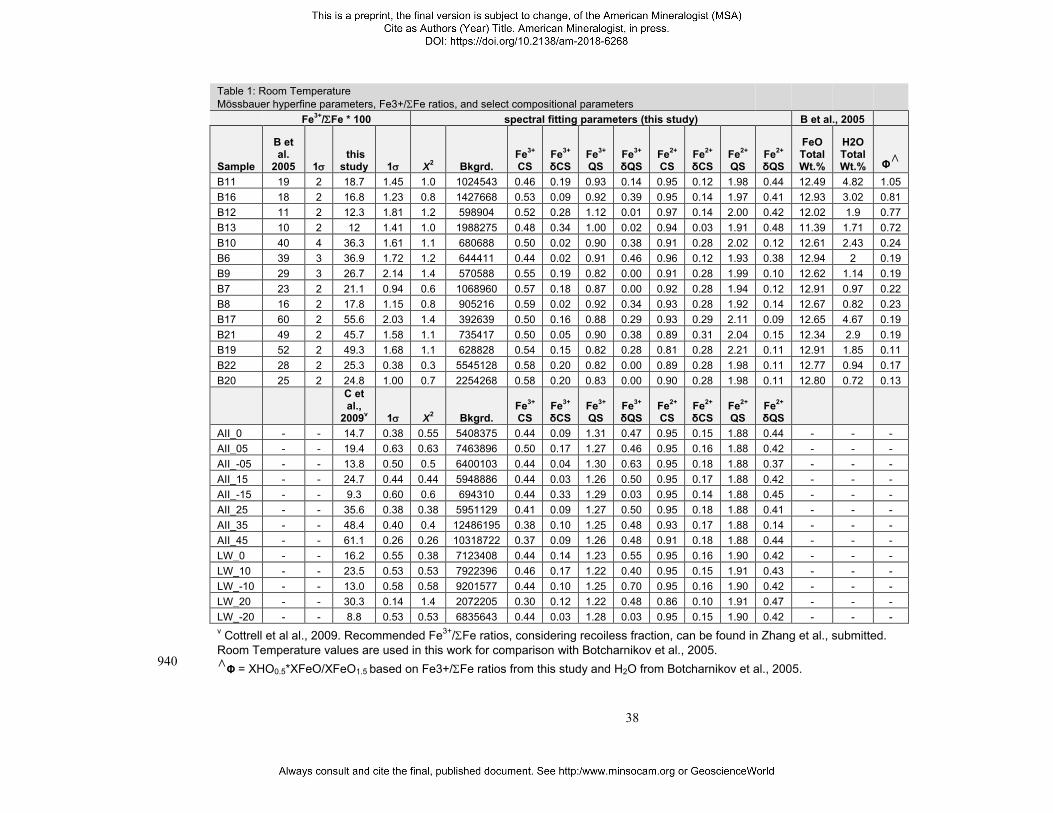
Table 1: Room Temperature Mössbauer hyperfine parameters, Fe3+/Fe ratios, and select compositional parameters Fe3+/Fe * 100 spectral fitting parameters (this study) B et al., 2005
Sample
B et al.
2005 1 this
study 1 X2 Bkgrd.
Fe3+ CS
Fe3+ δCS
Fe3+ QS
Fe3+ δQS
Fe2+ CS
Fe2+ δCS
Fe2+ QS
Fe2+ δQS
FeO Total Wt.%
H2O Total Wt.% Φ∧
B11 19 2 18.7 1.45 1.0 1024543 0.46 0.19 0.93 0.14 0.95 0.12 1.98 0.44 12.49 4.82 1.05 B16 18 2 16.8 1.23 0.8 1427668 0.53 0.09 0.92 0.39 0.95 0.14 1.97 0.41 12.93 3.02 0.81 B12 11 2 12.3 1.81 1.2 598904 0.52 0.28 1.12 0.01 0.97 0.14 2.00 0.42 12.02 1.9 0.77 B13 10 2 12 1.41 1.0 1988275 0.48 0.34 1.00 0.02 0.94 0.03 1.91 0.48 11.39 1.71 0.72 B10 40 4 36.3 1.61 1.1 680688 0.50 0.02 0.90 0.38 0.91 0.28 2.02 0.12 12.61 2.43 0.24 B6 39 3 36.9 1.72 1.2 644411 0.44 0.02 0.91 0.46 0.96 0.12 1.93 0.38 12.94 2 0.19 B9 29 3 26.7 2.14 1.4 570588 0.55 0.19 0.82 0.00 0.91 0.28 1.99 0.10 12.62 1.14 0.19 B7 23 2 21.1 0.94 0.6 1068960 0.57 0.18 0.87 0.00 0.92 0.28 1.94 0.12 12.91 0.97 0.22 B8 16 2 17.8 1.15 0.8 905216 0.59 0.02 0.92 0.34 0.93 0.28 1.92 0.14 12.67 0.82 0.23 B17 60 2 55.6 2.03 1.4 392639 0.50 0.16 0.88 0.29 0.93 0.29 2.11 0.09 12.65 4.67 0.19 B21 49 2 45.7 1.58 1.1 735417 0.50 0.05 0.90 0.38 0.89 0.31 2.04 0.15 12.34 2.9 0.19 B19 52 2 49.3 1.68 1.1 628828 0.54 0.15 0.82 0.28 0.81 0.28 2.21 0.11 12.91 1.85 0.11 B22 28 2 25.3 0.38 0.3 5545128 0.58 0.20 0.82 0.00 0.89 0.28 1.98 0.11 12.77 0.94 0.17 B20 25 2 24.8 1.00 0.7 2254268 0.58 0.20 0.83 0.00 0.90 0.28 1.98 0.11 12.80 0.72 0.13
C et al.,
2009v 1 X2 Bkgrd.
Fe3+ CS
Fe3+ δCS
Fe3+ QS
Fe3+ δQS
Fe2+ CS
Fe2+ δCS
Fe2+ QS
Fe2+ δQS
AII_0 - - 14.7 0.38 0.55 5408375 0.44 0.09 1.31 0.47 0.95 0.15 1.88 0.44 - - - AII_05 - - 19.4 0.63 0.63 7463896 0.50 0.17 1.27 0.46 0.95 0.16 1.88 0.42 - - - AII_-05 - - 13.8 0.50 0.5 6400103 0.44 0.04 1.30 0.63 0.95 0.18 1.88 0.37 - - - AII_15 - - 24.7 0.44 0.44 5948886 0.44 0.03 1.26 0.50 0.95 0.17 1.88 0.42 - - - AII_-15 - - 9.3 0.60 0.6 694310 0.44 0.33 1.29 0.03 0.95 0.14 1.88 0.45 - - - AII_25 - - 35.6 0.38 0.38 5951129 0.41 0.09 1.27 0.50 0.95 0.18 1.88 0.41 - - - AII_35 - - 48.4 0.40 0.4 12486195 0.38 0.10 1.25 0.48 0.93 0.17 1.88 0.14 - - - AII_45 - - 61.1 0.26 0.26 10318722 0.37 0.09 1.26 0.48 0.91 0.18 1.88 0.44 - - - LW_0 - - 16.2 0.55 0.38 7123408 0.44 0.14 1.23 0.55 0.95 0.16 1.90 0.42 - - - LW_10 - - 23.5 0.53 0.53 7922396 0.46 0.17 1.22 0.40 0.95 0.15 1.91 0.43 - - - LW_-10 - - 13.0 0.58 0.58 9201577 0.44 0.10 1.25 0.70 0.95 0.16 1.90 0.42 - - - LW_20 - - 30.3 0.14 1.4 2072205 0.30 0.12 1.22 0.48 0.86 0.10 1.91 0.47 - - - LW_-20 - - 8.8 0.53 0.53 6835643 0.44 0.03 1.28 0.03 0.95 0.15 1.90 0.42 - - - v Cottrell et al al., 2009. Recommended Fe3+/Fe ratios, considering recoiless fraction, can be found in Zhang et al., submitted. Room Temperature values are used in this work for comparison with Botcharnikov et al., 2005.
∧Φ= XHO0.5*XFeO/XFeO1.5 based on Fe3+/Fe ratios from this study and H2O from Botcharnikov et al., 2005.

39
941
Table 2: Synchrotron radiation dose conditions
Flux Condition
spot size (m)
photon flux (photons/sec)
flux density (photons/sec/m2) Gray/sec** notes
XANES1 2x2 5 x 10¹⁰-11 1x10¹⁰-11 9.0x10¹⁰-11 nominal at 13-ID-D
XANES3 2x2 1.5-8.6 x 10⁹ 4 x10⁸ to 2 x10⁹ ~1.3x10⁷
XANES4 50x50 1.5-8.6 x 10⁹ 8 x10⁵ to 3 x10⁶ ~1.3x10⁴
XANES5 25x25 2 x 10⁹ 3x10⁶ 3.8x10⁴
XANESCRYO-HI 38x28 3-4 x 10⁷ 3-4 x 10⁴ monochrometer = 7113.3eV
XANESCRYO-LO 38x28 2-4 x 10⁶ 2-4 x 10³ monochrometer = 7113.3eV
X26A 9x5 3 x10⁹ 6x10⁷ 7.7x10⁵ **Dose in Gray (Joules/kg/sec) is calculated for glass of basaltic composition through 1/e absorption length

40
942
Table 3: XANES centroids and integrated pre-edge intensities
X26A XANES1 XANES5 5x10¹⁰ photons/um2 3x10¹⁵ photons/um2 2x10⁹ photons/um2 sample centroid I1 I2 centroid I1 I2 centroid I1 I2 % B11 7112.402 0.012 0.06 0.037 7112.654 0.015 0.053 0.066 7112.421 0.003 0.058 0.045 71.9 B16 7112.342 0.008 0.063 0.031 7112.578 0.007 0.057 0.057 7112.362 0.01 0.061 0.04 69.2 B12 7112.226 0.007 0.073 0.026 7112.4 0.016 0.07 0.046 7112.228 0.002 0.074 0.032 66.4 B13 7112.177 0.002 0.077 0.024 7112.328 0.011 0.073 0.038 7112.211 0.015 0.076 0.031 46.0 B10 7112.784 0.01 0.047 0.062 7112.86 0.018 0.045 0.082 7112.773 0.004 0.048 0.074 18.4 B6 7112.733 0.012 0.05 0.06 7112.793 0.017 0.049 0.076 7112.735 0.007 0.052 0.07 6.5 B9 7112.585 0.006 0.06 0.05 7112.633 0.006 0.06 0.066 7112.568 0.011 0.06 0.058 16.5 B7 7112.477 0.007 0.064 0.042 7112.505 0.009 0.066 0.054 7112.468 0.009 0.064 0.05 18.7 B8 7112.413 0.007 0.07 0.04 7112.451 0.026 0.066 0.05 7112.418 0.006 0.067 0.047 27.2 B17 7113.083 0.013 0.03 0.088 7113.108 0.016 0.029 0.106 7113.059 0.001 0.032 0.098 3.8 B21 7112.988 0.006 0.039 0.082 7113.029 0.014 0.039 0.104 7112.957 0.008 0.04 0.088 15.5 B19 7113.01 0.008 0.04 0.083 7112.99 0.011 0.042 0.097 7112.969 0.008 0.042 0.094 2.3 B22 7112.587 0.01 0.062 0.051 7112.613 0.008 0.06 0.064 7112.582 0.01 0.06 0.06 19.1 B20 7112.548 0.002 0.064 0.048 7112.551 0.009 0.064 0.058 7112.538 0.009 0.063 0.057 9.5 5x10¹⁰ photons/um2 4x10¹⁵ photons/um2
AII0 7112.275 0.01 0.091 0.03 7112.271 0.009 0.079 0.036
AII05 7112.361 0.011 0.086 0.038 7112.368 0.002 0.08 0.046
AII-05 7112.219 0.01 0.09 0.029 7112.22 0.004 0.084 0.034
AII15 7112.52 0.013 0.078 0.047 7112.529 0.002 0.069 0.058
AII-15 7112.147 0.026 0.093 0.02 7112.134 0.007 0.087 0.025
AII25 7112.742 0.014 0.068 0.07 7112.76 0.009 0.061 0.079
AII35 7112.962 0.027 0.055 0.091 7112.974 0.002 0.052 0.106
AII45 7113.184 0.025 0.046 0.124 7113.186 0.003 0.042 0.14
LW_0 7112.3 0.01 0.085 0.032 7112.302 0.01 0.079 0.04
LW10 7112.434 0.013 0.078 0.042 7112.433 0.009 0.07 0.05
LW-10 7112.154 0.024 0.095 0.023 7112.155 0.004 0.085 0.028 LW20 7112.608 0.02 0.072 0.058 7112.62 0.002 0.069 0.069 LW-20 7112.112 0.01 0.097 0.018 7112.128 0.002 0.092 0.027
centroids are 7-yr avgs (n=30-48) as reported in Zhang et al., submitted **Fe3+/FeMöss – Fe3+/FeXANES
Doses reported in this table are per spectrum (photons/sec/m2*total collection time)

41
943

Energy7110 7112 7114 7116
0
0.05
0.1
0.15
Energy7110 7112 7114 7116
0
0.05
0.1
0.15
Energy7110 7112 7114 7116
0
0.05
0.1
0.15
Energy7110 7112 7114 7116
0
0.05
0.1
0.15
Energy7110 7112 7114 7116
0
0.05
0.1
0.15
Energy7050 7100 7150 7200
Inte
nsity
00.20.40.60.8
11.2
X26A
Energy7050 7100 7150 7200
Inte
nsity
00.20.40.60.8
11.2
XANES1high flux
Energy7050 7100 7150 7200
Inte
nsity
00.20.40.60.8
11.2
XANES5low flux
Energy7050 7100 7150 7200
Inte
nsity
00.20.40.60.8
11.2
X26A
Energy7050 7100 7150 7200
Inte
nsity
00.20.40.60.8
11.2
XANES1high flux
Inte
nsity
Inte
nsity
Inte
nsity
Inte
nsity
Inte
nsity
Hydrous B Glasses
Anhydrous LW and AII Glasses
Figure 1
a
b
c
d
e

0.1
0.2
0.3
0.4
0.5
0.6
0.7
106-7 photons/sec/Κm2
Fe3+/ψFe derived from Mössbauer fits
Fe3+
/ψF
e de
rived
from
anh
ydro
us X
AN
ES
cal
ibra
iton
Hydrous B (MöHydrous B (Mö
Hydrous B (Mö
X26A
13-ID-D, XANES5
calibration glasses
0
0.1
0.2
0.3
0.4
0.5
0.6
0 0.1 0.2 0.3 0.4 0.5 0.6 0.7
1010 photons/sec/Κm2calibration glasses
Hydrous B (MöHydrous B (Mö
13-ID-D, XANES1
B11
B17
a
b
Figure 2
high flux
low flux
B20

-0.2
-0.1
0
0.1
0.2
0.3
0.4
0 500 1000 1500 2000
Inte
nsity
of t
he 2
nd p
re-e
dge
mul
tiple
t ςK
a/I0
Time (sec)
Figure 3
ambient (21°C) cryo (-195°C)high flux low flux
Hydrous glass B11
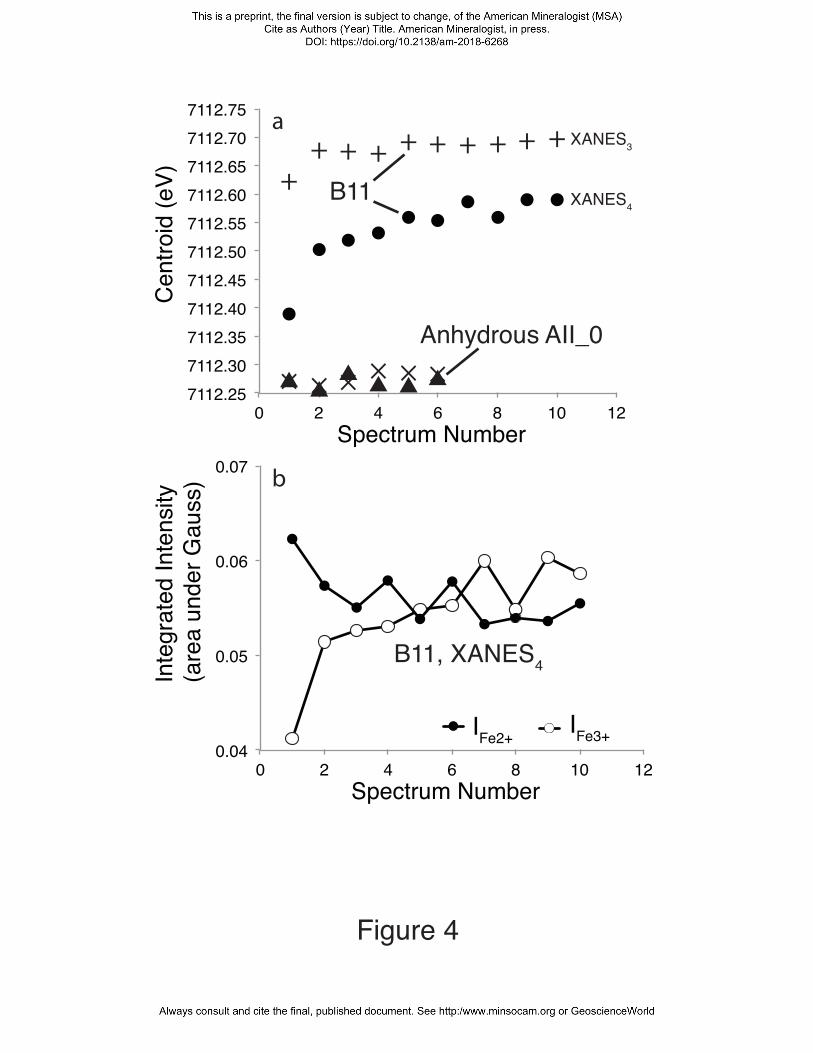
× × × × × ×
++ + + + + + + + +
7112.25
7112.30
7112.35
7112.40
7112.45
7112.50
7112.55
7112.60
7112.65
7112.70
7112.75
0 2 4 6 8 10 12
Cen
troi
d (e
V)
Spectrum Number
0.04
0.05
0.06
0.07
0 2 4 6 8 10 12
Inte
grat
ed In
tens
ity
(are
a un
der
Gau
ss)
Spectrum Number
IFe2+
B11
B11, XANES4
Anhydrous AII_0
XANES4
XANES3
a
b
IFe3+
Figure 4
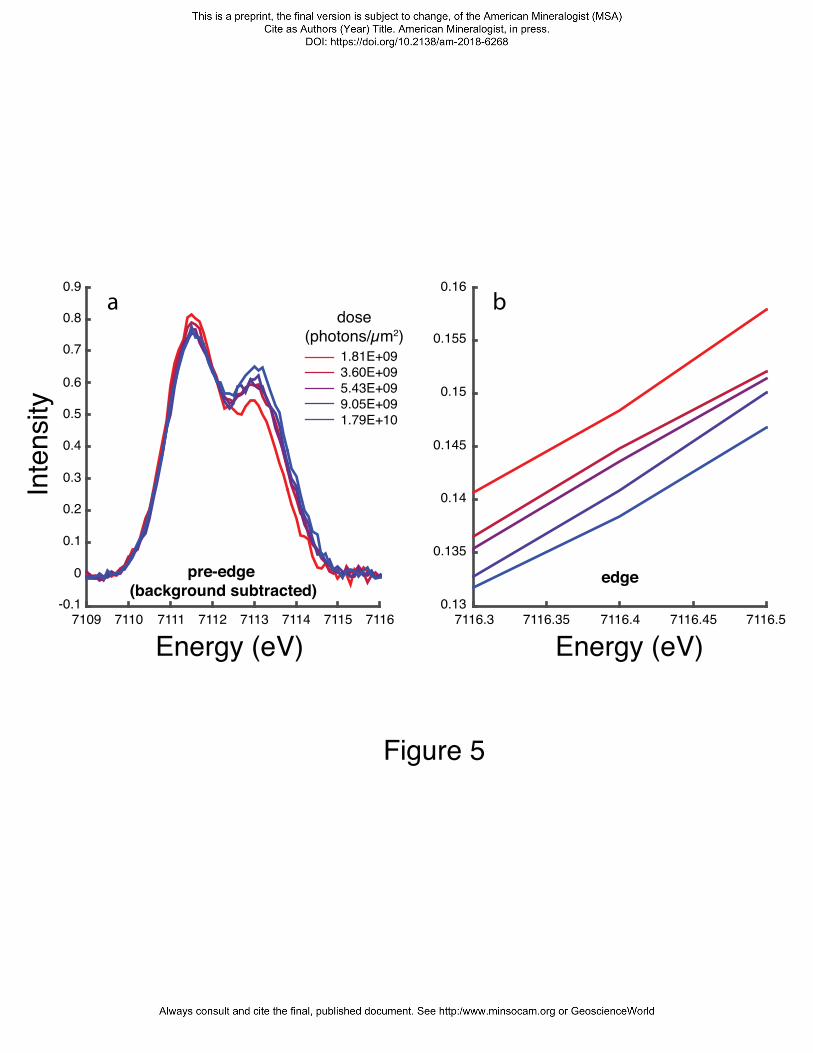
Energy (eV)7109 7110 7111 7112 7113 7114 7115 7116
Inte
nsity
Energy (eV)7116.3 7116.35 7116.4 7116.45 7116.5
0.13
0.135
0.14
0.145
0.15
0.155
0.160.9
0.8
0.7
0.6
0.5
0.4
0.2
0.3
0.1
0
-0.1
Figure 5
pre-edge (background subtracted)
edge
1.81E+09 3.60E+095.43E+09 9.05E+09 1.79E+10
dose(photons/μm2)
a b

Figure 6
400μm
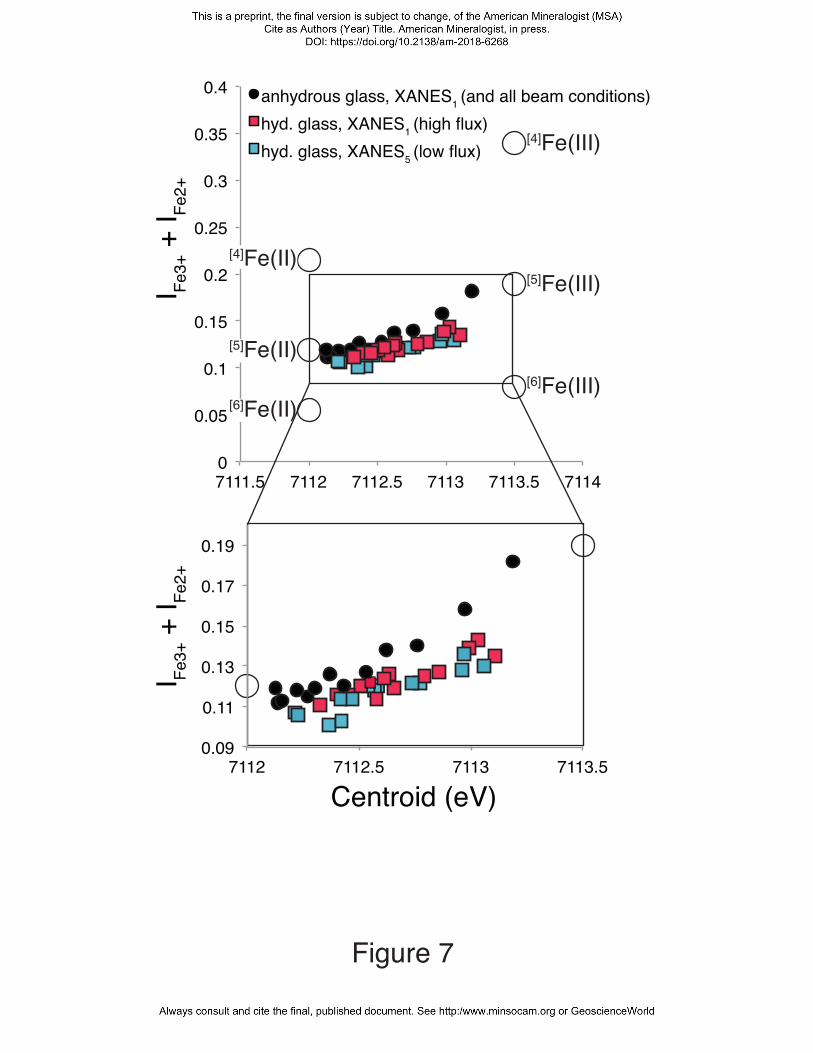
0
0.1
0.15
0.2
0.25
0.3
0.35
0.4
7111.5 7112 7112.5 7113 7113.5 7114
I Fe3
+ +
I Fe2
+
anhydrous glass, XANES1 (and all beam conditions)
hyd. glass, XANES1 (high flux)
hyd. glass, XANES5 (low flux)
0.09
0.11
0.13
0.15
0.17
0.19
7112 7112.5 7113 7113.5
Centroid (eV)
[4]Fe(II)
[6]Fe(II)
[5]Fe(II)
[4]Fe(III)
[5]Fe(III)
[6]Fe(III)0.05
I Fe3
+ +
I Fe2
+
Figure 7

0
20
40
60
80
0 0.1 0.2 0.3XHO0.5
0
20
40
60
80
0 0.01 0.02 0.03 0.04 0.05XFeO1.5
y = 75.2xR = 0.92
0
20
40
60
80
0 0.5 1XHO0.5*XFeO/XFeO1.5
= %
Fe3+
/ψF
e XA
NE
S1
- F
e3+/ψ
Fe M
öss
a
b
c
Figure 8
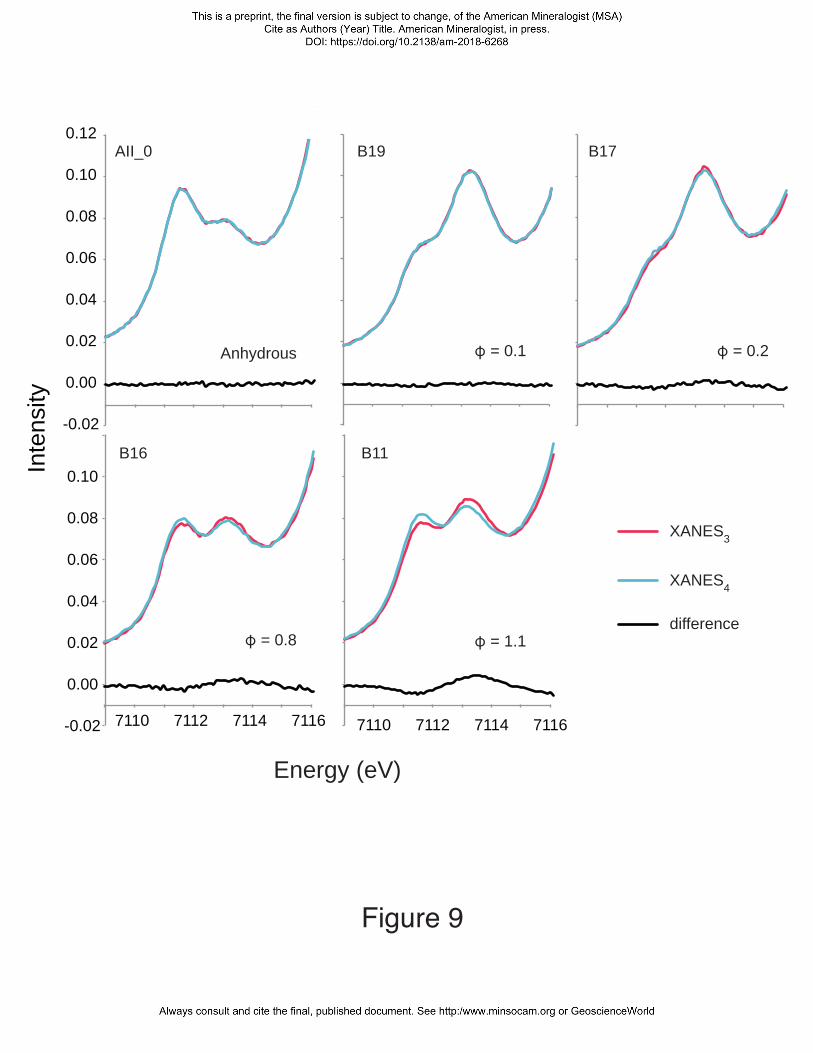
-0.02
0.00
0.02
0.04
0.06
0.08
0.10
0.12
Inte
nsity
7110 7112 7114 7116 7110 7112 7114 7116
Energy (eV)
XANES3
XANES4
difference
Anhydrous
B16 B11
-0.02
0.00
0.02
0.04
0.06
0.08
0.10
= 0.1
AII_0
= 0.2
= 1.1 = 0.8
B17B19
Figure 9

1
2
1.12
1.02
1.03
1.04
1.05
1.06
1.07
1.08
1.09
1.10
1.11
A3500
Figure 10
sample surface footprint of ΚXANES beam
100 μm