a modular approach to the design, fabrication, and...
TRANSCRIPT

©20
17 M
acm
illan
Pu
blis
her
s L
imit
ed, p
art
of
Sp
rin
ger
Nat
ure
. All
rig
hts
res
erve
d.
protocol
nature protocols | VOL.12 NO.3 | 2017 | 519
IntroDuctIonBiological materials have the ability to sense, process, and respond to a range of dynamic environmental signals in real time. This capabil-ity allows biological systems to demonstrate complex behaviors such as self-assembly, self-organization, self-healing, self-replication, and constant adaptation of composition and functionality to best suit their environment. Recent advances in manufacturing tech-nologies, such as 3D printing, combined with progress in the field of biomaterials, have synergistically produced robust approaches for manufacturing complex 3D structures from biological materi-als1–3. This has driven fundamental advances in the fields of tissue engineering and regenerative medicine by providing a method of reverse-engineering native tissues and organs4–6.
Thus far, the use of these technologies has primarily been limited to replicating biological structures found in nature while largely neglecting applications in forward-engineered biological systems capable of non-natural functional behaviors. Bio-integrated robots, or bio-bots, built using a combination of biological and synthetic materials have the potential to develop enhanced func-tional attributes as compared with robots made with traditional synthetic materials alone7,8. The dynamically adaptive nature of biological materials makes them ideal candidates for serving as the building blocks of ‘smart’ responsive machines and systems for a variety of applications.
Nearly all machines require actuators—modules that convert energy into motion—to produce a measurable output in response to varied input stimuli9. Skeletal muscle is a natural actuator capa-ble of generating larger forces from more compact structures than those of actuators made from synthetic materials, and it is designed to be modular and adaptive to changing environmental loads10–12. As locomotion is a powerful and intuitive demonstration of force production, we have developed muscle-powered bio-bots that can walk on 2D surfaces in response to external electrical or optical signals13,14. In this protocol, we describe a repeatable and customizable approach to 3D printing of injection molds for engineered muscle and mechanical bio-bot skeletons. We then
describe how to seed and differentiate muscle actuators within these molds and mechanically couple them to printed skeletons to accomplish functional output behaviors when stimulated with external signals. The convergence of the two disciplines of tissue engineering and 3D printing thus enables the iterative design and rapid fabrication of adaptive forward-engineered biological machines whose functionality can be tuned to suit a variety of applications in health, security, and the environment.
Development of the protocolThe first demonstrations of bio-integrated machines, composed of synthetic skeletons coupled to biological actuators, used the autonomous contraction of engineered cardiac muscle as a source of power15–19. The continuous beating of cardiac muscle did not provide ‘on–off ’ control over such machines, motivating the devel-opment of bio-integrated machines powered by skeletal muscle. Recent advances in approaches to culturing skeletal muscle cells in vitro have provided a baseline methodology for engineering 3D skeletal muscle tissue constructs20–22. Although these studies detailed robust techniques for engineering microscale tissues with applicability in high-throughput drug screening and studies of muscle development, they required substantial modifications to suit applications that required force production at the millimeter to centimeter scale.
In this protocol, we present a modular and stepwise approach to designing, fabricating, and controlling skeletal-muscle-powered locomotive biological machines at the millimeter to centimeter scale (Fig. 1). We show that the enabling technology of stereo-lithographic 3D printing can be used to iteratively design and cus-tom-manufacture soft robotic devices for a variety of purposes. These 3D-printed devices, when coupled to tissue-engineered skeletal muscle actuators, can drive locomotion across 2D surfaces and are designed to suit a variety of applications.
The design of the 3D-printed skeleton that we use was inspired by the architecture of the musculoskeletal system in vivo. In the
A modular approach to the design, fabrication, and characterization of muscle-powered biological machinesRitu Raman1,2, Caroline Cvetkovic2,3 & Rashid Bashir2–4
1Department of Mechanical Science and Engineering, University of Illinois at Urbana-Champaign, Urbana, Illinois, USA. 2Micro and Nanotechnology Laboratory, University of Illinois at Urbana-Champaign, Urbana, Illinois, USA. 3Department of Bioengineering, University of Illinois at Urbana-Champaign, Urbana, Illinois, USA. 4Carle Illinois College of Medicine, University of Illinois at Urbana-Champaign, Urbana, Illinois, USA. Correspondence should be addressed to R.B. ([email protected]).
Published online 9 February 2017; doi:10.1038/nprot.2016.185
Biological machines consisting of cells and biomaterials have the potential to dynamically sense, process, respond, and adapt to environmental signals in real time. as a first step toward the realization of such machines, which will require biological actuators that can generate force and perform mechanical work, we have developed a method of manufacturing modular skeletal muscle actuators that can generate up to 1.7 mn (3.2 kpa) of passive tension force and 300 mn (0.56 kpa) of active tension force in response to external stimulation. such millimeter-scale biological actuators can be coupled to a wide variety of 3D-printed skeletons to power complex output behaviors such as controllable locomotion. this article provides a comprehensive protocol for forward engineering of biological actuators and 3D-printed skeletons for any design application. 3D printing of the injection molds and skeletons requires 3 h, seeding the muscle actuators takes 2 h, and differentiating the muscle takes 7 d.
©20
17 M
acm
illan
Pu
blis
her
s L
imit
ed, p
art
of
Sp
rin
ger
Nat
ure
. All
rig
hts
res
erve
d.
protocol
520 | VOL.12 NO.3 | 2017 | nature protocols
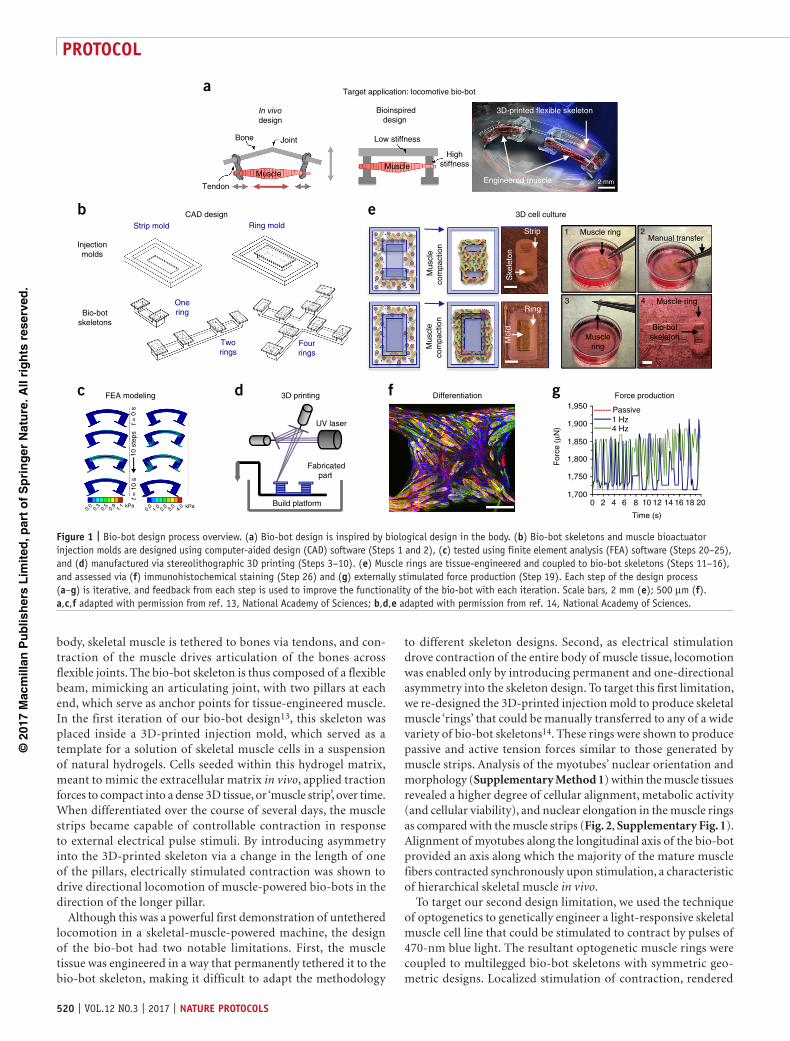
body, skeletal muscle is tethered to bones via tendons, and con-traction of the muscle drives articulation of the bones across flexible joints. The bio-bot skeleton is thus composed of a flexible beam, mimicking an articulating joint, with two pillars at each end, which serve as anchor points for tissue-engineered muscle. In the first iteration of our bio-bot design13, this skeleton was placed inside a 3D-printed injection mold, which served as a template for a solution of skeletal muscle cells in a suspension of natural hydrogels. Cells seeded within this hydrogel matrix, meant to mimic the extracellular matrix in vivo, applied traction forces to compact into a dense 3D tissue, or ‘muscle strip’, over time. When differentiated over the course of several days, the muscle strips became capable of controllable contraction in response to external electrical pulse stimuli. By introducing asymmetry into the 3D-printed skeleton via a change in the length of one of the pillars, electrically stimulated contraction was shown to drive directional locomotion of muscle-powered bio-bots in the direction of the longer pillar.
Although this was a powerful first demonstration of untethered locomotion in a skeletal-muscle-powered machine, the design of the bio-bot had two notable limitations. First, the muscle tissue was engineered in a way that permanently tethered it to the bio-bot skeleton, making it difficult to adapt the methodology
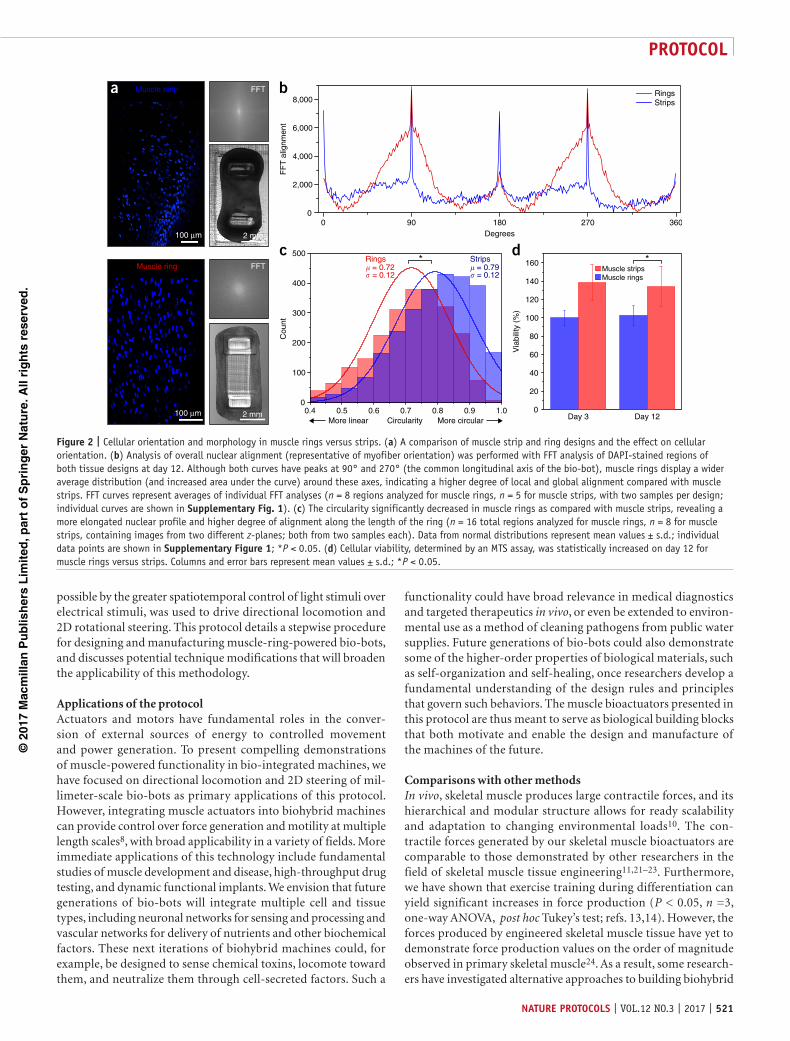
to different skeleton designs. Second, as electrical stimulation drove contraction of the entire body of muscle tissue, locomotion was enabled only by introducing permanent and one-directional asymmetry into the skeleton design. To target this first limitation, we re-designed the 3D-printed injection mold to produce skeletal muscle ‘rings’ that could be manually transferred to any of a wide variety of bio-bot skeletons14. These rings were shown to produce passive and active tension forces similar to those generated by muscle strips. Analysis of the myotubes’ nuclear orientation and morphology (Supplementary Method 1) within the muscle tissues revealed a higher degree of cellular alignment, metabolic activity (and cellular viability), and nuclear elongation in the muscle rings as compared with the muscle strips (Fig. 2, Supplementary Fig. 1). Alignment of myotubes along the longitudinal axis of the bio-bot provided an axis along which the majority of the mature muscle fibers contracted synchronously upon stimulation, a characteristic of hierarchical skeletal muscle in vivo.
To target our second design limitation, we used the technique of optogenetics to genetically engineer a light-responsive skeletal muscle cell line that could be stimulated to contract by pulses of 470-nm blue light. The resultant optogenetic muscle rings were coupled to multilegged bio-bot skeletons with symmetric geo-metric designs. Localized stimulation of contraction, rendered
Target application: locomotive bio-bot aIn vivodesign
Bioinspireddesign
3D-printed flexible skeleton
Engineered muscle 2 mm
Bone
MuscleMuscle
Joint Low stiffness
Highstiffness
Tendon
CAD design
FEA modeling
3D cell culture
Differentiation Force production
Mus
cle
com
pact
ion
Mus
cle
com
pact
ion
Strip
Ring
Ske
leto
nM
old
Injectionmolds
Bio-botskeletons
1 2
3 4 Muscle ring
Musclering
Bio-botskeleton
Muscle ringManual transfer
Strip mold Ring mold
Onering
Tworings
Fourrings
b e
c 3D printing
UV laser
Build platform
Fabricatedpart
d f g1,950
1,900
1,850
1,800For
ce (
µN)
1,750
1,7000 2
Passive1 Hz4 Hz
4 6 8 10
Time (s)
12 14 16 18 200.
00.
30.
5 0.9
1.1 kPa
0.0
1.0 2.
0 3.0
4.0 kPa
t = 1
0 s
10 s
teps
t = 0
s
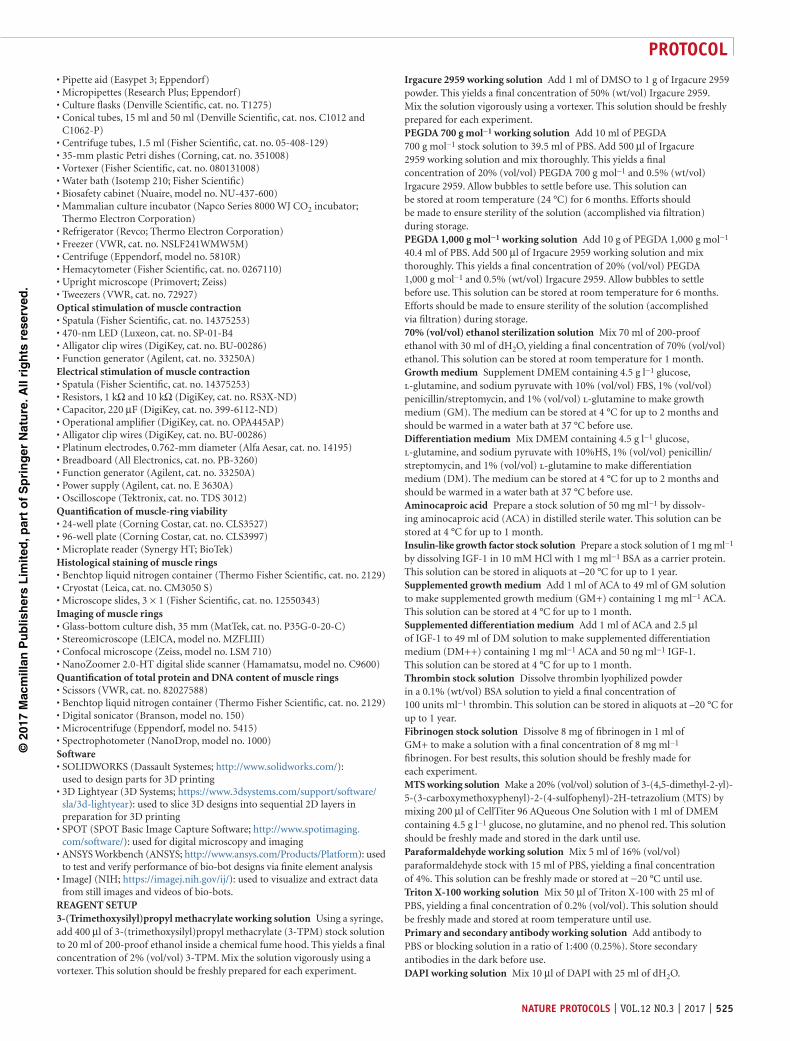
Figure 1 | Bio-bot design process overview. (a) Bio-bot design is inspired by biological design in the body. (b) Bio-bot skeletons and muscle bioactuator injection molds are designed using computer-aided design (CAD) software (Steps 1 and 2), (c) tested using finite element analysis (FEA) software (Steps 20–25), and (d) manufactured via stereolithographic 3D printing (Steps 3–10). (e) Muscle rings are tissue-engineered and coupled to bio-bot skeletons (Steps 11–16), and assessed via (f) immunohistochemical staining (Step 26) and (g) externally stimulated force production (Step 19). Each step of the design process (a–g) is iterative, and feedback from each step is used to improve the functionality of the bio-bot with each iteration. Scale bars, 2 mm (e); 500 µm (f). a,c,f adapted with permission from ref. 13, National Academy of Sciences; b,d,e adapted with permission from ref. 14, National Academy of Sciences.
©20
17 M
acm
illan
Pu
blis
her
s L
imit
ed, p
art
of
Sp
rin
ger
Nat
ure
. All
rig
hts
res
erve
d.
protocol
nature protocols | VOL.12 NO.3 | 2017 | 521
possible by the greater spatiotemporal control of light stimuli over electrical stimuli, was used to drive directional locomotion and 2D rotational steering. This protocol details a stepwise procedure for designing and manufacturing muscle-ring-powered bio-bots, and discusses potential technique modifications that will broaden the applicability of this methodology.
Applications of the protocolActuators and motors have fundamental roles in the conver-sion of external sources of energy to controlled movement and power generation. To present compelling demonstrations of muscle-powered functionality in bio-integrated machines, we have focused on directional locomotion and 2D steering of mil-limeter-scale bio-bots as primary applications of this protocol. However, integrating muscle actuators into biohybrid machines can provide control over force generation and motility at multiple length scales8, with broad applicability in a variety of fields. More immediate applications of this technology include fundamental studies of muscle development and disease, high-throughput drug testing, and dynamic functional implants. We envision that future generations of bio-bots will integrate multiple cell and tissue types, including neuronal networks for sensing and processing and vascular networks for delivery of nutrients and other biochemical factors. These next iterations of biohybrid machines could, for example, be designed to sense chemical toxins, locomote toward them, and neutralize them through cell-secreted factors. Such a
functionality could have broad relevance in medical diagnostics and targeted therapeutics in vivo, or even be extended to environ-mental use as a method of cleaning pathogens from public water supplies. Future generations of bio-bots could also demonstrate some of the higher-order properties of biological materials, such as self-organization and self-healing, once researchers develop a fundamental understanding of the design rules and principles that govern such behaviors. The muscle bioactuators presented in this protocol are thus meant to serve as biological building blocks that both motivate and enable the design and manufacture of the machines of the future.
Comparisons with other methodsIn vivo, skeletal muscle produces large contractile forces, and its hierarchical and modular structure allows for ready scalability and adaptation to changing environmental loads10. The con-tractile forces generated by our skeletal muscle bioactuators are comparable to those demonstrated by other researchers in the field of skeletal muscle tissue engineering11,21–23. Furthermore, we have shown that exercise training during differentiation can yield significant increases in force production (P < 0.05, n =3, one-way ANOVA, post hoc Tukey’s test; refs. 13,14). However, the forces produced by engineered skeletal muscle tissue have yet to demonstrate force production values on the order of magnitude observed in primary skeletal muscle24. As a result, some research-ers have investigated alternative approaches to building biohybrid
Degrees
StripsRings = 0.79 = 0.12
= 0.72 = 0.12
100 µm
100 µm
Muscle ring
Muscle strip FFT8,000
6,000
4,000
2,000
0
500160
140
120
100
80
60
40
20
0
400
300
Cou
nt
Via
bilit
y (%
)
200
100
00.4 0.5 0.6 0.7 0.8 0.9 1.0
CircularityMore linear More circular Day 3 Day 12
0 90
*
180 270 360
RingsStrips
FFT
a
c dMuscle stripsMuscle rings
*
FF
T a
lignm
ent
b
2 mm
2 mm
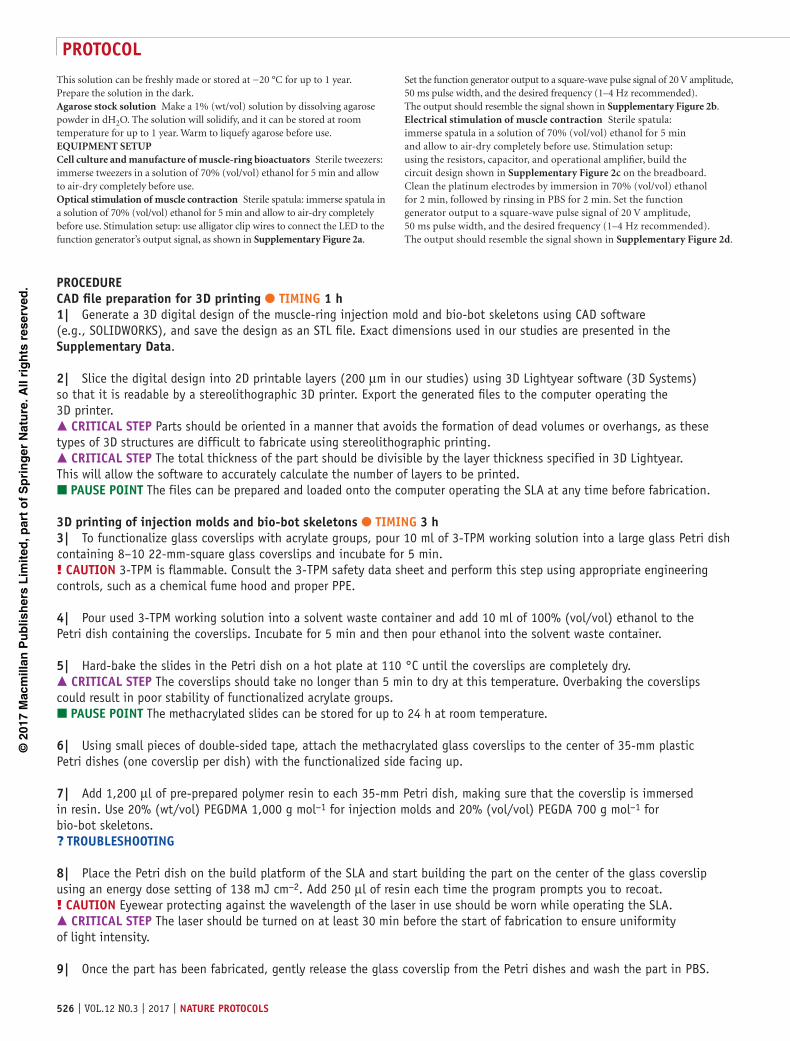
Figure 2 | Cellular orientation and morphology in muscle rings versus strips. (a) A comparison of muscle strip and ring designs and the effect on cellular orientation. (b) Analysis of overall nuclear alignment (representative of myofiber orientation) was performed with FFT analysis of DAPI-stained regions of both tissue designs at day 12. Although both curves have peaks at 90° and 270° (the common longitudinal axis of the bio-bot), muscle rings display a wider average distribution (and increased area under the curve) around these axes, indicating a higher degree of local and global alignment compared with muscle strips. FFT curves represent averages of individual FFT analyses (n = 8 regions analyzed for muscle rings, n = 5 for muscle strips, with two samples per design; individual curves are shown in supplementary Fig. 1). (c) The circularity significantly decreased in muscle rings as compared with muscle strips, revealing a more elongated nuclear profile and higher degree of alignment along the length of the ring (n = 16 total regions analyzed for muscle rings, n = 8 for muscle strips, containing images from two different z-planes; both from two samples each). Data from normal distributions represent mean values ± s.d.; individual data points are shown in supplementary Figure 1; *P < 0.05. (d) Cellular viability, determined by an MTS assay, was statistically increased on day 12 for muscle rings versus strips. Columns and error bars represent mean values ± s.d.; *P < 0.05.
©20
17 M
acm
illan
Pu
blis
her
s L
imit
ed, p
art
of
Sp
rin
ger
Nat
ure
. All
rig
hts
res
erve
d.
protocol
522 | VOL.12 NO.3 | 2017 | nature protocols
machines by coupling excised skeletal muscle tissue to synthetic skeletons25. Although such machines have demonstrated impres-sive functionality, because primary cells typically produce larger forces than those produced by cell lines, primary cells are argu-ably a less sustainable source of material, and their functional performance can vary widely depending on the age and health of the animal source26. As a result, we believe that continuing to investigate the potential of engineered skeletal muscle constructs provides an opportunity for future growth in the field of tissue engineering. Uncovering the design rules and principles that gov-ern skeletal muscle growth and differentiation in vitro may, in the future, lead to engineering of skeletal muscle tissue that replicates force production in vivo.
Recent demonstrations of biohybrid machines powered by car-diac muscle have similarly met with considerable success, with biomimetic designs and primary cells combining to produce complex locomotive behaviors16,18,19. However, in addition to the disadvantages of a platform that relies on primary cells, these demonstrations are also at a disadvantage due to the use of 2D sheets of cardiac muscle as actuators for biohybrid machines. The 3D hierarchical structure of skeletal muscle, which we mimic in our muscle rings, is critical to the modularity of design and the scalability of force production that are required for a range of functional applications. In addition, skeletal muscle is capable of ‘on–off ’ control, unlike cardiac muscle, which spontaneously contracts; this property will allow us to forward-engineer higher-level control when such muscle bioactuators are coupled to neural networks via neuromuscular junctions. Therefore, although the use of primary skeletal or cardiac cells is appealing at present, we believe that skeletal muscle bioactuators engineered from cell lines will provide substantial advantages over other methods in the future.
Limitations of the protocolThe methodology presented in this protocol has been optimized for generating millimeter- to centimeter-scale modular muscle bioactuators with active force generation capabilities up to 300 µN (~0.5 kPa) when matured and stimulated in conditions suited to mammalian cells. Modifications of this protocol to produce bioactuators at different length scales, or 3D tissues made with different cell types, are mentioned in this protocol, but they are not fully developed for functional use. Further optimization of this procedural approach is thus required for any application beyond the scope of those discussed in this protocol.
Experimental designForward-engineering bio-hybrid machines involves designing and optimizing modular skeletal muscle bioactuators and 3D-printed skeletons in parallel before combining them to produce functional behaviors in response to external electrical or optical stimuli. This protocol outlines an approach that uses the externally stimulated contraction of skeletal muscle to drive directional locomotion of synthetic skeletons.
How this protocol is implemented is dependent on the force generation and actuation requirements of a given application. These can be determined using an iterative process of designing and printing new bio-bot skeletons, predicting force production behavior via finite element analysis (FEA), and comparing pre-dicted responses with actual responses observed when skeletons
are coupled to engineered muscle in vitro. Bio-bots can be further customized to incorporate different cell types and different stimu-lation mechanisms as befit the requirements of the application of concern. For example, we have applied this technique to C166 endothelial and NSC-34 neuron-like cell lines, both in the pres-ence and absence of C2C12s, with no modifications to the protocol except exchanging the cell type and culture medium used.
Design and optimization of modular skeletal muscle actua-tors. The injection molds that serve as templates for the muscle actuators are 3D-printed with the biocompatible and bio-inert poly(ethylene glycol) diacrylate (PEGDA) hydrogel polymer using a commercial stereolithographic apparatus (SLA) adapted to print millimeter-scale structures27. The UV laser of the SLA traces 2D cross-sections of 3D designs onto the polymer resin, rendered light-sensitive through the addition of a biocompatible photoinitiator (Irgacure 2959), building the part layer by layer from the bottom up. The shape and dimensions of the injection mold are prescribed by a computer-aided design (CAD) file, and can be readily modified to generate a variety of different muscle architectures. Fabricated mold dimensions will be larger than those prescribed by the CAD file, because of the swelling behavior of the highly absorbent and hydrophilic PEGDA polymer. The swelling ratio of the hydrogel is dictated by the molecular weight and concentration of monomer in the printable resin, with an average value of ~150% for the polymer composition used in this protocol28,29. Although we chose to use a stereolithographic 3D-printing approach, because of the versatility of this technique and the ready availability of biocompatible photosensitive resins1,2, this mold could also be manufactured using other biocompatible polymers and fabrication methodologies. For example, manufac-turing hydrogel skeletons with feature sizes much smaller than 250 µm (the x–y resolution limit of our commercial SLA) will require using a printer that is capable of much higher-resolution capabilities. We have custom-built a projection micro-stereolitho-graphic 3D printer that is capable of printing hydrogel polymers at <5-µm resolution3 that could be used to print smaller bio-bot skeletons or skeletons with microscale features. Many fabrica-tion methodologies and materials are suitable for manufacturing injection molds, as long as ease of sterilization and precise reproducibility of dimensions are maintained.
The cell/gel solution injected into the mold, composed of the C2C12 murine skeletal muscle cell line in a suspension of fibrinogen, thrombin, and Matrigel, cross-links into a stable 3D gel network following the molding process. The final size of the muscle actuators is a function of cell density, cell distribution, hydrogel matrix composition, injection mold dimensions, and cell culture parameters. Higher concentrations of cells or fibrin in the solution, for example, lead to thinner muscle rings until a satura-tion point (1 × 10⁷ cells ml−1 and 4 mg ml−1 fibrin, respectively). Past this point, the finite volume occupied by the added material renders further thinning of muscle rings impossible. In general, cell/gel compositions and volumes that generate muscle-ring actuators thicker than ~500 µm in diameter should be avoided, as this exceeds the diffusive distance of nutrients and biochemical factors from the surrounding medium into the tissue30, as well as the penetration depth of blue light (~500–740 µm) into tissue31,32. Each component of the cell/gel solution can thus be readily tuned and modified to suit the needs of a given application, as elaborated
©20
17 M
acm
illan
Pu
blis
her
s L
imit
ed, p
art
of
Sp
rin
ger
Nat
ure
. All
rig
hts
res
erve
d.
protocol
nature protocols | VOL.12 NO.3 | 2017 | 523
upon in the ‘Experimental design’ section of the protocol. However, all modifications to the cell/gel solution must be sub-jected to an optimization process that studies the effects of the solution parameter change on muscle-ring architecture and func-tional performance.
The passive and active tension forces exerted by muscle actua-tors in response to external stimulation must be suited to the design and application of the mechanical skeletons to which they are tethered. The maximum force produced can be regulated by an exercise training regimen of controlled external stimulation of a specified frequency and duration, as well as by biochemical growth factors present in the medium during muscle differen-tiation23. Others have demonstrated the performance-enhancing effects of electrical stimulation33 and dynamic mechanical stretch stimulation34 on skeletal muscle during differentiation. We have shown that increases in muscle force production can similarly be driven by static mechanical cues13 and dynamic optical stimu-lation14 imposed during muscle maturation, with synergistic increases in force production demonstrated when mechanical and optical stimulation are combined. These increases in functional performance are attributed to greater degrees of cellular hyper-trophy, as assessed by the ratio of total protein to DNA content in the engineered muscle tissue. Exercise protocols for muscle actuators that use regimens of biochemical, mechanical, opti-cal, or electrical stimulation separately or in parallel can be pre-cisely tuned and optimized to suit the force production needs of a bio-bot designed for a specific application.
Design, simulation, and fabrication of bio-bot skeletons. The design of the mechanical skeleton to which a modular muscle-ring actuator is tethered is critical to the ability of the biologi-cal machine to perform the required output function. We have created several designs for producing directional locomotion and 2D steering in millimeter- to centimeter-scale structures via CAD (Supplementary Data) and have optimized them using FEA
software. Skeleton designs for applications beyond locomotion, such as pumping, can similarly be designed with CAD and tested before manufacture by FEA. We fabricated these CAD designs using the same SLA printing approach used to fabricate injection molds, but we modified the polymer composition to enhance the stiffness of the skeletons. This change helped preserve the mechanical integrity of the skeletons during fabrication, muscle transfer and maturation, and bio-bot stimulation.
The process of mechanically coupling the elastic muscle-ring actuators to the 3D-printed bio-bot skeletons is critical to the modularity of this method of fabricating biological machines. Once optimal skeleton dimensions have been prescribed via CAD and FEA analysis, the injection mold must be re-designed to suit the shape and dimensions of the skeleton. Molds must be engineered to generate muscle-ring actuators of the same shape as the site of tethering in the mechanical skeleton, and with inner diameters larger than the outer diameter of the mechanical skeleton, to maintain muscle structural integrity and ensure ease of transfer. Cultured muscle rings can then be manually trans-ferred to printed skeletons before differentiation using sterile tweezers. Proliferation of cells within the rings will drive further compaction until limited by the mechanical constraint of the bio-bot skeleton, leading to secure coupling of the actuator to the skeleton. Rings can then be differentiated until maturation, defined by the point at which the muscle is capable of observable force production.
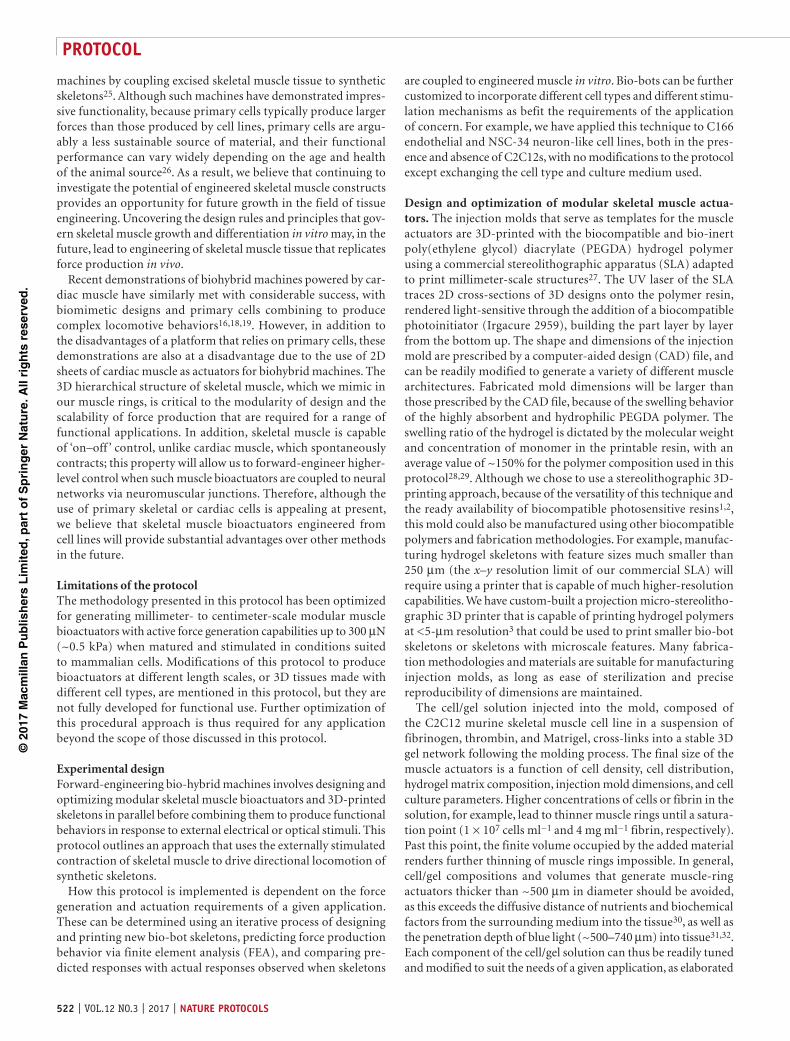
Stimulation and control of muscle-powered bio-bots. The muscle differentiation process (Fig. 3) outlined in this protocol is driven primarily by a change in the formulation of cell culture media used, from media containing FBS to heat-inactivated horse serum (HS). In conjunction with other results reported in earlier literature35, we have also shown that the addition of insulin-like growth fac-tor (IGF-1) can increase the rate of myoblast differentiation into contractile myotubes in engineered muscle tissue13.
0 1 2 3 4 5 6 7 8 9 10 11 12
50 µN
Day
Ringseeding
Dynamic optical exercise stimulation
Ringtransfer
Static mechanical exercise stimulation
Twitchobserved
90 µN
195 µN
Static mechanical exercise stimulation + dynamic optical exercise stimulation 280 µN
Immunohistochemistry SEM
470-nm LED
Opticalstimulation
Tetheredbio-bot
Medium
Growth medium Differentiation medium
50 µm100 µm1 mm
a
b c
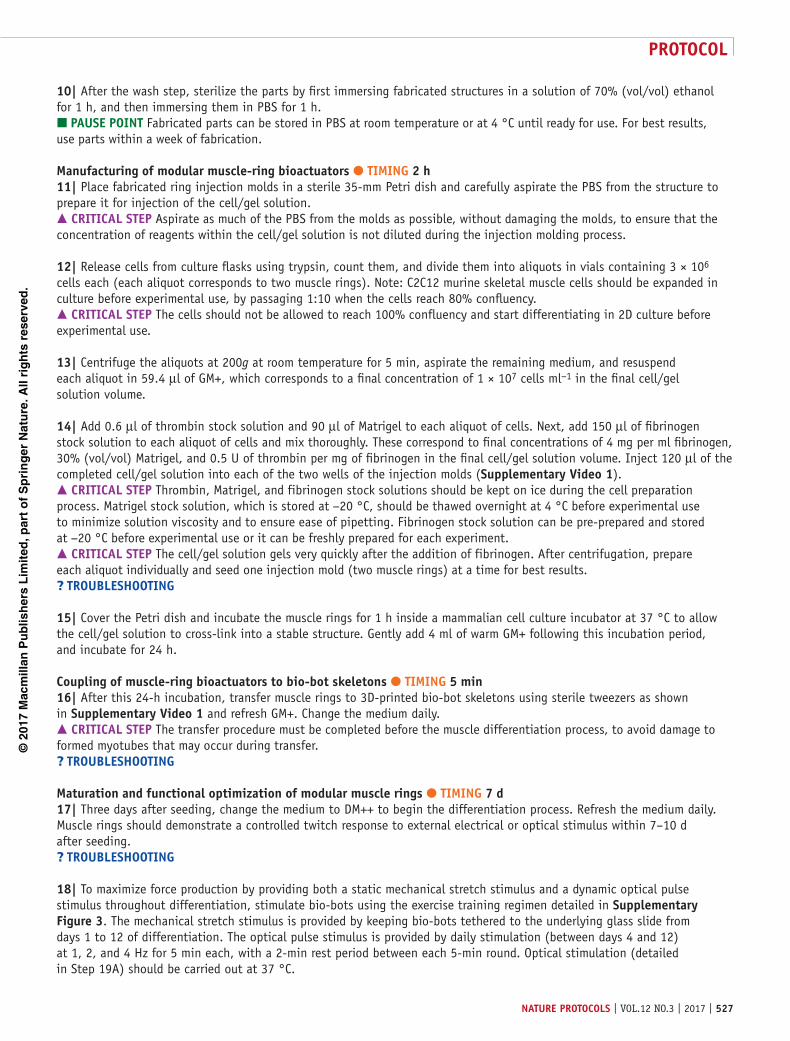
Figure 3 | Muscle differentiation protocol. (a) Time line of muscle maturation, indicating the effect of biochemical and mechanical exercise signals on muscle functionality. Functionality is assessed via comparison of muscle active tension force production in response to optical stimulation at 1 Hz. (b) Bio-bot (left) muscle rings imaged via immunohistochemical (center) and scanning electron microscopy (SEM; right) images of mature myotubes within differentiated muscle rings, showing a dense population of contractile myotubes with a high degree of local alignment. Blue, DAPI (nuclei); green, MF-20 (myosin). (c) Schematic of optimal exercise stimulation protocol, which combines a static mechanical stimulus (imposed by tethering the bio-bot to an underlying glass coverslip) with a dynamic optical pulse stimulus.

©20
17 M
acm
illan
Pu
blis
her
s L
imit
ed, p
art
of
Sp
rin
ger
Nat
ure
. All
rig
hts
res
erve
d.
protocol
524 | VOL.12 NO.3 | 2017 | nature protocols
We have custom-built equipment for delivering electrical and optical pulse train stimuli to differentiated muscle in order to stimulate contraction. Bio-bots stimulated electrically are placed between two parallel platinum electrodes generating bipolar elec-trical pulses. Bio-bots stimulated optically are placed beneath a 470-nm LED emitting pulse trains of defined frequency and pulse width. Both forms of stimulation produce similar force out-puts, until the upper limit for the thickness of the muscle rings (thicker than the penetration depth (500–740 µm) of blue light into the dense engineered tissue) is reached31,32. For a given appli-cation, therefore, it is essential to match the shapes and sizes of the engineered muscle ring and bio-bot skeleton to the intended form of external stimulation.
The functional measures of muscle maturity applicable to bio-actuators are passive tension produced by the muscle in a static resting state and active tension produced by the muscle during
externally stimulated contraction. We have derived formulas for calculating passive and active tension using measurable geometric and material properties of functional bio-bots in conjunction with mechanics equations derived from Euler–Bernoulli beam theory and Kelvin–Voigt viscoelasticity models. This approach for calculating force has demonstrated the ability of these bioactua-tors to produce physiological force-frequency response behavior, with higher-frequency stimulations resulting in smaller dynamic fluctuation in active tension. Furthermore, this methodology has been validated using FEA modeling and has proven to be a robust and repeatable method of testing the effects of different vari-ables, such as exercise training protocols, on muscle functionality. The force generation data can also be used to predict output response behaviors for bio-bots of different sizes and designs, according to the needs of new applications, before manufacture and testing in vitro.
MaterIalsREAGENTS3D printing of injection molds and bio-bot skeletons
3-(Trimethoxysilyl)propyl methacrylate (3-TPM; Sigma-Aldrich, cat. no. 440159) ! cautIon 3-TPM is flammable. Consult the 3-TPM safety data sheet and use appropriate engineering controls, such as a chemical fume hood and proper personal protective equipment (PPE).Ethanol, 200 proof (Decon Laboratories, cat. no. 2716)Poly(ethylene glycol) diacrylate (700 g mol−1; PEGDA; Sigma-Aldrich, cat. no. 455008)PEGDA (1,000 g mol−1; Polysciences, cat. no. 15178)Sterile PBS (Lonza, cat. no. 17-516F)Irgacure 2959 (BASF, cat. no. 55047962) crItIcal We have shown that the concentration of Irgacure 2959 used as a photoinitiator in our PEGDA resins is biocompatible and renders the resin sensitive to the 325-nm UV light produced by our SLA3,27. Use of a different photoinitiator will need to be preceded by tests of biocompatibility and photosensitivity to the wavelength of light produced by the 3D printer in use.DMSO (Fisher Scientific, cat. no. D128-500) ! cautIon DMSO is flammable. Consult the DMSO safety data sheet and use appropriate engineering controls, such as a chemical fume hood and proper PPE.dH2O
Cell culture and manufacture of muscle-ring bioactuatorsC2C12 murine myoblasts (ATCC) infected with pLenti2-EF1α-ChR2[H134R]-tdTomato-WPRE plasmid (Addgene, cat. no. 22799) to ex-press a mutant variant of the 470-nm blue light-sensitive ion channel, Chan-nelrhodopsin (ChR2[H134R])14,36 ! cautIon Cell lines should be regularly checked to ensure that they are authentic and not infected with Mycoplasma.DMEM with 4.5 g l−1 glucose, l-glutamine, and sodium pyruvate (Corning, cat. no. 10-013-cv)FBS (Lonza, cat. no. 14-502F)Penicillin/streptomycin (Cellgro Mediatech, cat. no. 30-002-CI)l-Glutamine (Cellgro Mediatech, cat. no. 25-005-CI)Trypsin (TrypLE, Thermo Fisher Scientific, cat. no. 12605010)Trypan Blue (Thermo Fisher Scientific, cat. no. 15250061)Thrombin (Sigma-Aldrich, cat. no. T4648)Fibrinogen (Sigma-Aldrich, cat. no. F8630)Matrigel (Corning, cat. no. 354248)Horse serum, heat inactivated (Fisher Scientific, cat. no. 26-050-070)Aminocaproic acid (Sigma-Aldrich, cat. no. A2504)LONG R3 human insulin-like growth factor-1 (IGF-1, Sigma-Aldrich, cat. no. I1271)BSA (Sigma-Aldrich, cat. no. A3059)
Quantification of muscle-ring viabilityCellTiter 96 AQueous One Solution MTS Cell Proliferation Assay (Promega, cat. no. G3580)DMEM with 4.5 g l−1 glucose, no glutamine, no phenol red (Thermo Fisher Scientific, cat. no. 31053028)
•
••
•••
•
•
•
•
•••••••••••
•
•
•
Immunohistochemical staining of muscle ringsParaformaldehyde, EM grade, 16% (vol/vol) (Electron Microscopy Sciences, cat. no. 15710)Triton X-100 for molecular biology (Sigma-Aldrich, cat. no. T8787)Image-iT FX Signal Enhancer (Thermo Fisher Scientific, cat. no. I36933)MF 20 Antibody (Developmental Studies Hybridoma Bank at the University of Iowa)Anti-sarcomeric α-actinin antibody (Abcam, cat. no. ab109776)Goat anti-mouse IgG (H+L) secondary antibody, Alexa Fluor 488 conjugate (Thermo Fisher Scientific, cat. no. A-11029)F(ab′)2-goat anti-rabbit IgG (H+L) secondary antibody, Alexa Fluor 568 conjugate (Thermo Fisher Scientific, cat. no. A-21069)4′,6-Diamidino-2-phenylindole dihydrochloride (DAPI; Thermo Fisher Scientific, cat. no. D1306)Agarose (Bio-Rad, cat. no. 162-0100)
Histological staining of muscle ringsTissue-Tek O.C.T. Compound (VWR, cat. no. 25608-930)Hematoxylin stain (Thermo Fisher Scientific/Richard-Allan Scientific, cat. no. 7221)Eosin-Y stain (Fisher Healthcare, cat. no. 22-220-104)
Quantification of total protein and DNA content of muscle ringsDNeasy Blood and Tissue Kit (Qiagen, cat. no. 69504)RIPA Lysis and Extraction Buffer (Thermo Fisher Scientific, cat. no. 89900)Pierce BCA Protein Assay Kit (Thermo Fisher Scientific, cat. no. 23227)
EQUIPMENT3D printing of injection molds and bio-bot skeletons
22 mm × 22 mm glass coverslips (VWR, cat. no. 48366067)Glass Petri dishes (Pyrex; Corning, cat. no. 70165-152)Tweezers (VWR, cat. no. 72927)Conical tubes, 15 ml and 50 ml (Denville Scientific, cat. nos. C1012 and C1062-P)Centrifuge tubes, 1.5 ml (Fisher Scientific, cat. no. 05-408-129)Syringe, 1 ml (BD, cat. no. DGW87703 – 8036000)Needle, 26 gauge × 3/8 inch (BD, cat. no. 305110)Serological pipette tips, 10, 200, and 1,000 µl (Denville Scientific, cat. nos. P1096-FR, P1122, and P1126)Vortexer (Fisher Scientific, cat. no. 080131008)Chemical fume hood (SafeAire; Fisher Hamilton, model no. 70864)Solvent waste container (Ecofunnel, cat. no. 1-415-883-2600)Hot plate (Corning, cat. no. PC-420D)Double-sided tape (3M Scotch, cat. no. 34-8716-0599-3)35-mm plastic Petri dishes (Corning, cat. no. 351008)Stereolithographic 3D printer (3D Systems, model no. SLA 250/50)UV laser safety goggles (Laservision, cat. no. P5E01 KTP)
Cell culture and manufacture of muscle-ring bioactuatorsSerological pipette tips, 10, 200, and 1,000 µl (Denville Scientific, cat. nos. P1096-FR, P1122, and P1126))Serological pipettes, 5, 10, and 25 ml (Denville Scientific, cat. nos. P7133, P7134, P7135)
•
•••
••
•
•
•
••
•
•••
••••••••
••••••••
•
•
©20
17 M
acm
illan
Pu
blis
her
s L
imit
ed, p
art
of
Sp
rin
ger
Nat
ure
. All
rig
hts
res
erve
d.
protocol
nature protocols | VOL.12 NO.3 | 2017 | 525
Pipette aid (Easypet 3; Eppendorf)Micropipettes (Research Plus; Eppendorf)Culture flasks (Denville Scientific, cat. no. T1275)Conical tubes, 15 ml and 50 ml (Denville Scientific, cat. nos. C1012 and C1062-P)Centrifuge tubes, 1.5 ml (Fisher Scientific, cat. no. 05-408-129)35-mm plastic Petri dishes (Corning, cat. no. 351008)Vortexer (Fisher Scientific, cat. no. 080131008)Water bath (Isotemp 210; Fisher Scientific)Biosafety cabinet (Nuaire, model no. NU-437-600)Mammalian culture incubator (Napco Series 8000 WJ CO2 incubator; Thermo Electron Corporation)Refrigerator (Revco; Thermo Electron Corporation)Freezer (VWR, cat. no. NSLF241WMW5M)Centrifuge (Eppendorf, model no. 5810R)Hemacytometer (Fisher Scientific, cat. no. 0267110)Upright microscope (Primovert; Zeiss)Tweezers (VWR, cat. no. 72927)
Optical stimulation of muscle contractionSpatula (Fisher Scientific, cat. no. 14375253)470-nm LED (Luxeon, cat. no. SP-01-B4Alligator clip wires (DigiKey, cat. no. BU-00286)Function generator (Agilent, cat. no. 33250A)
Electrical stimulation of muscle contractionSpatula (Fisher Scientific, cat. no. 14375253)Resistors, 1 kΩ and 10 kΩ (DigiKey, cat. no. RS3X-ND)Capacitor, 220 µF (DigiKey, cat. no. 399-6112-ND)Operational amplifier (DigiKey, cat. no. OPA445AP)Alligator clip wires (DigiKey, cat. no. BU-00286)Platinum electrodes, 0.762-mm diameter (Alfa Aesar, cat. no. 14195)Breadboard (All Electronics, cat. no. PB-3260)Function generator (Agilent, cat. no. 33250A)Power supply (Agilent, cat. no. E 3630A)Oscilloscope (Tektronix, cat. no. TDS 3012)
Quantification of muscle-ring viability24-well plate (Corning Costar, cat. no. CLS3527)96-well plate (Corning Costar, cat. no. CLS3997)Microplate reader (Synergy HT; BioTek)
Histological staining of muscle ringsBenchtop liquid nitrogen container (Thermo Fisher Scientific, cat. no. 2129)Cryostat (Leica, cat. no. CM3050 S)Microscope slides, 3 × 1 (Fisher Scientific, cat. no. 12550343)
Imaging of muscle ringsGlass-bottom culture dish, 35 mm (MatTek, cat. no. P35G-0-20-C)Stereomicroscope (LEICA, model no. MZFLIII)Confocal microscope (Zeiss, model no. LSM 710)NanoZoomer 2.0-HT digital slide scanner (Hamamatsu, model no. C9600)
Quantification of total protein and DNA content of muscle ringsScissors (VWR, cat. no. 82027588)Benchtop liquid nitrogen container (Thermo Fisher Scientific, cat. no. 2129)Digital sonicator (Branson, model no. 150)Microcentrifuge (Eppendorf, model no. 5415)Spectrophotometer (NanoDrop, model no. 1000)
SoftwareSOLIDWORKS (Dassault Systemes; http://www.solidworks.com/): used to design parts for 3D printing3D Lightyear (3D Systems; https://www.3dsystems.com/support/software/ sla/3d-lightyear): used to slice 3D designs into sequential 2D layers in preparation for 3D printingSPOT (SPOT Basic Image Capture Software; http://www.spotimaging.com/software/): used for digital microscopy and imagingANSYS Workbench (ANSYS; http://www.ansys.com/Products/Platform): used to test and verify performance of bio-bot designs via finite element analysisImageJ (NIH; https://imagej.nih.gov/ij/): used to visualize and extract data from still images and videos of bio-bots.
REAGENT SETUP3-(Trimethoxysilyl)propyl methacrylate working solution Using a syringe, add 400 µl of 3-(trimethoxysilyl)propyl methacrylate (3-TPM) stock solution to 20 ml of 200-proof ethanol inside a chemical fume hood. This yields a final concentration of 2% (vol/vol) 3-TPM. Mix the solution vigorously using a vortexer. This solution should be freshly prepared for each experiment.
••••
••••••
••••••
••••
••••••••••
•••
•••
••••
•••••
•
•
•
•
•
Irgacure 2959 working solution Add 1 ml of DMSO to 1 g of Irgacure 2959 powder. This yields a final concentration of 50% (wt/vol) Irgacure 2959. Mix the solution vigorously using a vortexer. This solution should be freshly prepared for each experiment.PEGDA 700 g mol−1 working solution Add 10 ml of PEGDA 700 g mol−1 stock solution to 39.5 ml of PBS. Add 500 µl of Irgacure 2959 working solution and mix thoroughly. This yields a final concentration of 20% (vol/vol) PEGDA 700 g mol−1 and 0.5% (wt/vol) Irgacure 2959. Allow bubbles to settle before use. This solution can be stored at room temperature (24 °C) for 6 months. Efforts should be made to ensure sterility of the solution (accomplished via filtration) during storage.PEGDA 1,000 g mol−1 working solution Add 10 g of PEGDA 1,000 g mol−1 40.4 ml of PBS. Add 500 µl of Irgacure 2959 working solution and mix thoroughly. This yields a final concentration of 20% (vol/vol) PEGDA 1,000 g mol−1 and 0.5% (wt/vol) Irgacure 2959. Allow bubbles to settle before use. This solution can be stored at room temperature for 6 months. Efforts should be made to ensure sterility of the solution (accomplished via filtration) during storage.70% (vol/vol) ethanol sterilization solution Mix 70 ml of 200-proof ethanol with 30 ml of dH2O, yielding a final concentration of 70% (vol/vol) ethanol. This solution can be stored at room temperature for 1 month.Growth medium Supplement DMEM containing 4.5 g l−1 glucose, l-glutamine, and sodium pyruvate with 10% (vol/vol) FBS, 1% (vol/vol) penicillin/streptomycin, and 1% (vol/vol) l-glutamine to make growth medium (GM). The medium can be stored at 4 °C for up to 2 months and should be warmed in a water bath at 37 °C before use.Differentiation medium Mix DMEM containing 4.5 g l−1 glucose, l-glutamine, and sodium pyruvate with 10%HS, 1% (vol/vol) penicillin/streptomycin, and 1% (vol/vol) l-glutamine to make differentiation medium (DM). The medium can be stored at 4 °C for up to 2 months and should be warmed in a water bath at 37 °C before use.Aminocaproic acid Prepare a stock solution of 50 mg ml−1 by dissolv-ing aminocaproic acid (ACA) in distilled sterile water. This solution can be stored at 4 °C for up to 1 month.Insulin-like growth factor stock solution Prepare a stock solution of 1 mg ml−1 by dissolving IGF-1 in 10 mM HCl with 1 mg ml−1 BSA as a carrier protein. This solution can be stored in aliquots at –20 °C for up to 1 year.Supplemented growth medium Add 1 ml of ACA to 49 ml of GM solution to make supplemented growth medium (GM+) containing 1 mg ml−1 ACA. This solution can be stored at 4 °C for up to 1 month.Supplemented differentiation medium Add 1 ml of ACA and 2.5 µl of IGF-1 to 49 ml of DM solution to make supplemented differentiation medium (DM++) containing 1 mg ml−1 ACA and 50 ng ml−1 IGF-1. This solution can be stored at 4 °C for up to 1 month.Thrombin stock solution Dissolve thrombin lyophilized powder in a 0.1% (wt/vol) BSA solution to yield a final concentration of 100 units ml−1 thrombin. This solution can be stored in aliquots at –20 °C for up to 1 year.Fibrinogen stock solution Dissolve 8 mg of fibrinogen in 1 ml of GM+ to make a solution with a final concentration of 8 mg ml−1 fibrinogen. For best results, this solution should be freshly made for each experiment.MTS working solution Make a 20% (vol/vol) solution of 3-(4,5-dimethyl-2-yl)- 5-(3-carboxymethoxyphenyl)-2-(4-sulfophenyl)-2H-tetrazolium (MTS) by mixing 200 µl of CellTiter 96 AQueous One Solution with 1 ml of DMEM containing 4.5 g l−1 glucose, no glutamine, and no phenol red. This solution should be freshly made and stored in the dark until use.Paraformaldehyde working solution Mix 5 ml of 16% (vol/vol) paraformaldehyde stock with 15 ml of PBS, yielding a final concentration of 4%. This solution can be freshly made or stored at −20 °C until use.Triton X-100 working solution Mix 50 µl of Triton X-100 with 25 ml of PBS, yielding a final concentration of 0.2% (vol/vol). This solution should be freshly made and stored at room temperature until use.Primary and secondary antibody working solution Add antibody to PBS or blocking solution in a ratio of 1:400 (0.25%). Store secondary antibodies in the dark before use.DAPI working solution Mix 10 µl of DAPI with 25 ml of dH2O.
©20
17 M
acm
illan
Pu
blis
her
s L
imit
ed, p
art
of
Sp
rin
ger
Nat
ure
. All
rig
hts
res
erve
d.
protocol
526 | VOL.12 NO.3 | 2017 | nature protocols
This solution can be freshly made or stored at −20 °C for up to 1 year. Prepare the solution in the dark.Agarose stock solution Make a 1% (wt/vol) solution by dissolving agarose powder in dH2O. The solution will solidify, and it can be stored at room temperature for up to 1 year. Warm to liquefy agarose before use.EQUIPMENT SETUPCell culture and manufacture of muscle-ring bioactuators Sterile tweezers: immerse tweezers in a solution of 70% (vol/vol) ethanol for 5 min and allow to air-dry completely before use.Optical stimulation of muscle contraction Sterile spatula: immerse spatula in a solution of 70% (vol/vol) ethanol for 5 min and allow to air-dry completely before use. Stimulation setup: use alligator clip wires to connect the LED to the function generator’s output signal, as shown in Supplementary Figure 2a.
Set the function generator output to a square-wave pulse signal of 20 V amplitude, 50 ms pulse width, and the desired frequency (1–4 Hz recommended). The output should resemble the signal shown in Supplementary Figure 2b.Electrical stimulation of muscle contraction Sterile spatula: immerse spatula in a solution of 70% (vol/vol) ethanol for 5 min and allow to air-dry completely before use. Stimulation setup: using the resistors, capacitor, and operational amplifier, build the circuit design shown in Supplementary Figure 2c on the breadboard. Clean the platinum electrodes by immersion in 70% (vol/vol) ethanol for 2 min, followed by rinsing in PBS for 2 min. Set the function generator output to a square-wave pulse signal of 20 V amplitude, 50 ms pulse width, and the desired frequency (1–4 Hz recommended). The output should resemble the signal shown in Supplementary Figure 2d.
proceDurecaD file preparation for 3D printing tIMInG 1 h1| Generate a 3D digital design of the muscle-ring injection mold and bio-bot skeletons using CAD software (e.g., SOLIDWORKS), and save the design as an STL file. Exact dimensions used in our studies are presented in the supplementary Data.
2| Slice the digital design into 2D printable layers (200 µm in our studies) using 3D Lightyear software (3D Systems) so that it is readable by a stereolithographic 3D printer. Export the generated files to the computer operating the 3D printer. crItIcal step Parts should be oriented in a manner that avoids the formation of dead volumes or overhangs, as these types of 3D structures are difficult to fabricate using stereolithographic printing. crItIcal step The total thickness of the part should be divisible by the layer thickness specified in 3D Lightyear. This will allow the software to accurately calculate the number of layers to be printed. pause poInt The files can be prepared and loaded onto the computer operating the SLA at any time before fabrication.
3D printing of injection molds and bio-bot skeletons tIMInG 3 h3| To functionalize glass coverslips with acrylate groups, pour 10 ml of 3-TPM working solution into a large glass Petri dish containing 8–10 22-mm-square glass coverslips and incubate for 5 min.! cautIon 3-TPM is flammable. Consult the 3-TPM safety data sheet and perform this step using appropriate engineering controls, such as a chemical fume hood and proper PPE.
4| Pour used 3-TPM working solution into a solvent waste container and add 10 ml of 100% (vol/vol) ethanol to the Petri dish containing the coverslips. Incubate for 5 min and then pour ethanol into the solvent waste container.
5| Hard-bake the slides in the Petri dish on a hot plate at 110 °C until the coverslips are completely dry. crItIcal step The coverslips should take no longer than 5 min to dry at this temperature. Overbaking the coverslips could result in poor stability of functionalized acrylate groups. pause poInt The methacrylated slides can be stored for up to 24 h at room temperature.
6| Using small pieces of double-sided tape, attach the methacrylated glass coverslips to the center of 35-mm plastic Petri dishes (one coverslip per dish) with the functionalized side facing up.
7| Add 1,200 µl of pre-prepared polymer resin to each 35-mm Petri dish, making sure that the coverslip is immersed in resin. Use 20% (wt/vol) PEGDMA 1,000 g mol−1 for injection molds and 20% (vol/vol) PEGDA 700 g mol−1 for bio-bot skeletons.? trouBlesHootInG
8| Place the Petri dish on the build platform of the SLA and start building the part on the center of the glass coverslip using an energy dose setting of 138 mJ cm−2. Add 250 µl of resin each time the program prompts you to recoat.! cautIon Eyewear protecting against the wavelength of the laser in use should be worn while operating the SLA. crItIcal step The laser should be turned on at least 30 min before the start of fabrication to ensure uniformity of light intensity.
9| Once the part has been fabricated, gently release the glass coverslip from the Petri dishes and wash the part in PBS.
©20
17 M
acm
illan
Pu
blis
her
s L
imit
ed, p
art
of
Sp
rin
ger
Nat
ure
. All
rig
hts
res
erve
d.
protocol
nature protocols | VOL.12 NO.3 | 2017 | 527
10| After the wash step, sterilize the parts by first immersing fabricated structures in a solution of 70% (vol/vol) ethanol for 1 h, and then immersing them in PBS for 1 h. pause poInt Fabricated parts can be stored in PBS at room temperature or at 4 °C until ready for use. For best results, use parts within a week of fabrication.
Manufacturing of modular muscle-ring bioactuators tIMInG 2 h11| Place fabricated ring injection molds in a sterile 35-mm Petri dish and carefully aspirate the PBS from the structure to prepare it for injection of the cell/gel solution. crItIcal step Aspirate as much of the PBS from the molds as possible, without damaging the molds, to ensure that the concentration of reagents within the cell/gel solution is not diluted during the injection molding process.
12| Release cells from culture flasks using trypsin, count them, and divide them into aliquots in vials containing 3 × 10⁶ cells each (each aliquot corresponds to two muscle rings). Note: C2C12 murine skeletal muscle cells should be expanded in culture before experimental use, by passaging 1:10 when the cells reach 80% confluency. crItIcal step The cells should not be allowed to reach 100% confluency and start differentiating in 2D culture before experimental use.
13| Centrifuge the aliquots at 200g at room temperature for 5 min, aspirate the remaining medium, and resuspend each aliquot in 59.4 µl of GM+, which corresponds to a final concentration of 1 × 10⁷ cells ml−1 in the final cell/gel solution volume.
14| Add 0.6 µl of thrombin stock solution and 90 µl of Matrigel to each aliquot of cells. Next, add 150 µl of fibrinogen stock solution to each aliquot of cells and mix thoroughly. These correspond to final concentrations of 4 mg per ml fibrinogen, 30% (vol/vol) Matrigel, and 0.5 U of thrombin per mg of fibrinogen in the final cell/gel solution volume. Inject 120 µl of the completed cell/gel solution into each of the two wells of the injection molds (supplementary Video 1). crItIcal step Thrombin, Matrigel, and fibrinogen stock solutions should be kept on ice during the cell preparation process. Matrigel stock solution, which is stored at −20 °C, should be thawed overnight at 4 °C before experimental use to minimize solution viscosity and to ensure ease of pipetting. Fibrinogen stock solution can be pre-prepared and stored at −20 °C before experimental use or it can be freshly prepared for each experiment. crItIcal step The cell/gel solution gels very quickly after the addition of fibrinogen. After centrifugation, prepare each aliquot individually and seed one injection mold (two muscle rings) at a time for best results.? trouBlesHootInG
15| Cover the Petri dish and incubate the muscle rings for 1 h inside a mammalian cell culture incubator at 37 °C to allow the cell/gel solution to cross-link into a stable structure. Gently add 4 ml of warm GM+ following this incubation period, and incubate for 24 h.
coupling of muscle-ring bioactuators to bio-bot skeletons tIMInG 5 min16| After this 24-h incubation, transfer muscle rings to 3D-printed bio-bot skeletons using sterile tweezers as shown in supplementary Video 1 and refresh GM+. Change the medium daily. crItIcal step The transfer procedure must be completed before the muscle differentiation process, to avoid damage to formed myotubes that may occur during transfer.? trouBlesHootInG
Maturation and functional optimization of modular muscle rings tIMInG 7 d17| Three days after seeding, change the medium to DM++ to begin the differentiation process. Refresh the medium daily. Muscle rings should demonstrate a controlled twitch response to external electrical or optical stimulus within 7–10 d after seeding.? trouBlesHootInG
18| To maximize force production by providing both a static mechanical stretch stimulus and a dynamic optical pulse stimulus throughout differentiation, stimulate bio-bots using the exercise training regimen detailed in supplementary Figure 3. The mechanical stretch stimulus is provided by keeping bio-bots tethered to the underlying glass slide from days 1 to 12 of differentiation. The optical pulse stimulus is provided by daily stimulation (between days 4 and 12) at 1, 2, and 4 Hz for 5 min each, with a 2-min rest period between each 5-min round. Optical stimulation (detailed in Step 19A) should be carried out at 37 °C.

©20
17 M
acm
illan
Pu
blis
her
s L
imit
ed, p
art
of
Sp
rin
ger
Nat
ure
. All
rig
hts
res
erve
d.
protocol
528 | VOL.12 NO.3 | 2017 | nature protocols
external stimulation of muscle contraction 19| At this stage, muscle contraction can be triggered via either optical (option A) or electrical (option B) stimulation. The active tension force produced by the engineered muscle will be the same in both cases, but optical stimulation allows for a higher degree of spatiotemporal control over stimulation; that is, although the electrical stimulation protocol outlined here will stimulate the muscle actuator in its entirety, the optical stimulation protocol allows for isolated stimulation of specific muscle regions.(a) optical stimulation of muscle contraction tIMInG 5 min (i) Using a sterile spatula, gently release the bio-bots from the underlying glass coverslips and place them directly beneath
a 470-nm LED. Connect the LED to a function generator to produce pulses of controlled frequency (1–10 Hz) and pulse width (50 ms) (supplementary Fig. 2a,b). Note that muscle rings should display tetanus behavior above 10 Hz. crItIcal step Use fresh medium at 37 °C to make sure that glucose content has not been depleted. crItIcal step Standard cell culture medium is not optimal for long-term experiments at room temperature and atmosphere, as it requires CO2 gas for pH buffering. Although we have not detected measurable changes in tissue viability or functionality over a relatively short stimulation period (5 min), longer stimulation regimens at room temperature and atmosphere will require modifying the composition of the culture medium. ? trouBlesHootInG
(ii) Image using a microscope objective with a field of view large enough to capture at least one pillar of the bio-bot skeleton (Fig. 4c). Record videos at a frame rate suitable to the frequency of stimulation (10 frames per second in our studies), and return bio-bots to Petri dishes containing fresh DM++ after stimulation.
(B) electrical stimulation of muscle contraction tIMInG 5 min (i) Using a sterile spatula, gently release the bio-bots from the underlying glass coverslips and transfer bio-bots to
a sterile Petri dish containing fresh plain DMEM without serum (to reduce the presence of bubbles, i.e. electrolysis, during electrical pulse stimulation). crItIcal step Use fresh medium at 37 °C to make sure that the glucose content has not been depleted and that the bio-bots are tested at conditions suited to mammalian cell culture. crItIcal step Standard cell culture medium is not optimal for long-term experiments at room temperature and atmosphere, as it requires CO2 gas for pH buffering. Although we have not detected measurable changes in tissue viability or functionality over a relatively short stimulation period (5 min), longer stimulation regimens at room temperature and atmosphere will require modifying the composition of the culture medium.
(ii) Align the bio-bots parallel to the platinum electrodes of the electrical stimulation setup, making sure to avoid physical contact between the muscle actuators and the electrodes (supplementary Fig. 2c,d). Stimulate with pulses of controlled frequency (1–10 Hz) and pulse width (50 ms). Note that muscle rings should display tetanus behavior above 10 Hz.
(iii) Image using a microscope objective with a field of view large enough to capture the movement of at least one pillar of the bio-bot skeleton (Fig. 4c). Record videos at a frame rate suitable to the frequency of stimulation (at least 10 fps) and return the bio-bots to Petri dishes containing fresh DM++ after stimulation.
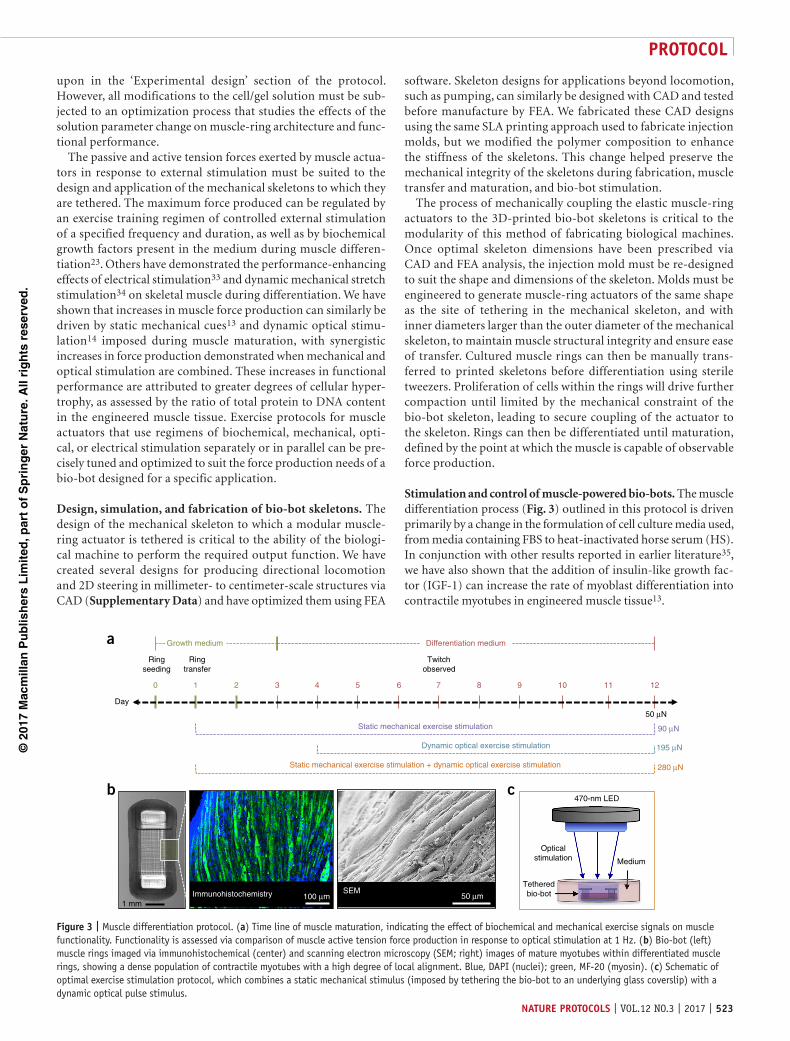
calculation and Fea verification of passive tension force tIMInG 30 min20| Take a side-view image of a bio-bot and use the ImageJ software (NIH) to measure the maximum deflection of the skeleton’s beam and the distance between the muscle and the beam, as depicted in Figure 4a.
21| Use the equation presented below, derived from Euler–Bernoulli beam theory, to calculate the passive tension force produced by the muscle-ring bioactuators:
FEI
lLp =
82
dmax
where Fp is the passive tension force, E is the Young’s modulus of the PEGDA hydrogel skeleton (319.4 kPa for an SLA energy
dose setting of 138 mJ cm−2), I is the moment of inertia of the beam ( 112
3bh = 2.8E-14 m4), δmax is the maximum
deflection of the beam, l is the distance between the muscle and the beam, and L is the length of the beam (6 mm). Note that the Young’s modulus of the hydrogel is dependent on the polymer composition and the SLA energy dose. Values of E for varying energy doses are presented in supplementary Figure 4.
22| To verify that the calculated force produced would generate the measured deflection of the beam, construct a static structural FEA model (using ANSYS software in this study) composed of half a bio-bot skeleton with the given geometric and
©20
17 M
acm
illan
Pu
blis
her
s L
imit
ed, p
art
of
Sp
rin
ger
Nat
ure
. All
rig
hts
res
erve
d.
protocol
nature protocols | VOL.12 NO.3 | 2017 | 529
material properties of 3D-printed PEGDA (Fig. 4b, supplementary Data). Impose a fixed support constraint at the middle of the beam and a passive tension force of the calculated magnitude on the skeleton, and compare the computed deflection with the deflection measured empirically. Note that the model can also output other parameters, such as the equivalent stress in the skeleton after deformation (which shows regions of large stresses and stress concentrations), and this additional information can be used in optimizing the bio-bot skeleton geometry during an iterative design process. Specifically, skeleton dimensions can be changed in the computational model, and the resulting deformation can be predicted before empirical testing. This process is outlined in detail in supplementary Method 2.
calculation and Fea verification of active tension force tIMInG 30 min23| With a manual tracking plug-in in ImageJ37, track the motion of a bio-bot (as shown in Fig. 4c) in a video acquired during externally stimulated contraction. A custom-written software for automated tracking of bio-bot movement during contraction, using normalized 2D cross-correlation of a user-specified feature in each frame, could prove to be useful for the analysis of long videos.
24| Using this motion-tracking data, calculate the average change in length of the bio-bot during each contraction and divide by the original length of the bio-bot to calculate strain. Knowing the acquisition frame rate of the video, calculate the strain rate. Input these values into the equation presented below, derived from a Kelvin–Voigt viscoelasticity model, to calculate active tension force:
FA
E td tdt
Ey
y tα = + = +e h
eh
e( )
( ) ∆ ∆∆0
where Fα is the active tension force, A is the contact area between the muscle ring and the bio-bot skeleton, E is the Young’s modulus of the PEGDA hydrogel skeleton (319.4 kPa for an SLA energy dose setting of 138 mJ cm−2), ∆y is the change in length of the skeleton during a contraction, y0 is the original length of the skeleton in the passive state, η is the viscosity of the PEGDA hydrogel (5.1E−3 mPa s for the polymer composition used to build bio-bot skeletons), ∆ε is the change in calculated strain between two successive frames, and ∆t is the elapsed time between two successive frames. crItIcal step The second term in the active tension equation is negligible at small strain rates but becomes important at high strain rates, corresponding to stimulation frequencies above 4 Hz. Thus, although it is appropriate to treat the bio-bot as a linear elastic structure at low-frequency stimulation, the addition of the viscosity term is required for high-frequency stimulation.
25| To verify that the calculated force produced would generate the measured deflection and displacement of the bio-bot skeleton, construct a static structural FEA model (using ANSYS software in this study) coupled to a rigid dynamics model (Fig. 4d, supplementary Data). Assign the bio-bot skeleton with the given geometric and material properties of 3D-printed PEGDA, and impose a dynamic active tension force of the calculated magnitudes on the skeleton. Compare the computed displacement with the displacement measured empirically. Changing geometric or material properties of the bio-bot skeleton can be used to computationally predict the effects of changing these parameters before verification via empirical testing. This process is outlined in detail in supplementary Method 3.
assessment of engineered muscle rings26| At this stage, there are a number of options to analyze engineered muscle rings. Methods include quantification of muscle-ring viability (option A), immunohistochemical staining and imaging of muscle rings (option B), histological staining and imaging of muscle rings (option C), and quantification of total protein and DNA content of muscle rings (option D).
l
Frame n
a
c d
b
Frame n + 1 ∆y
2 mm
0.55 mm
6 mm
0.002
0 MPa
0.0016
0 MPa
1 mm
max
1 mm
500 µm
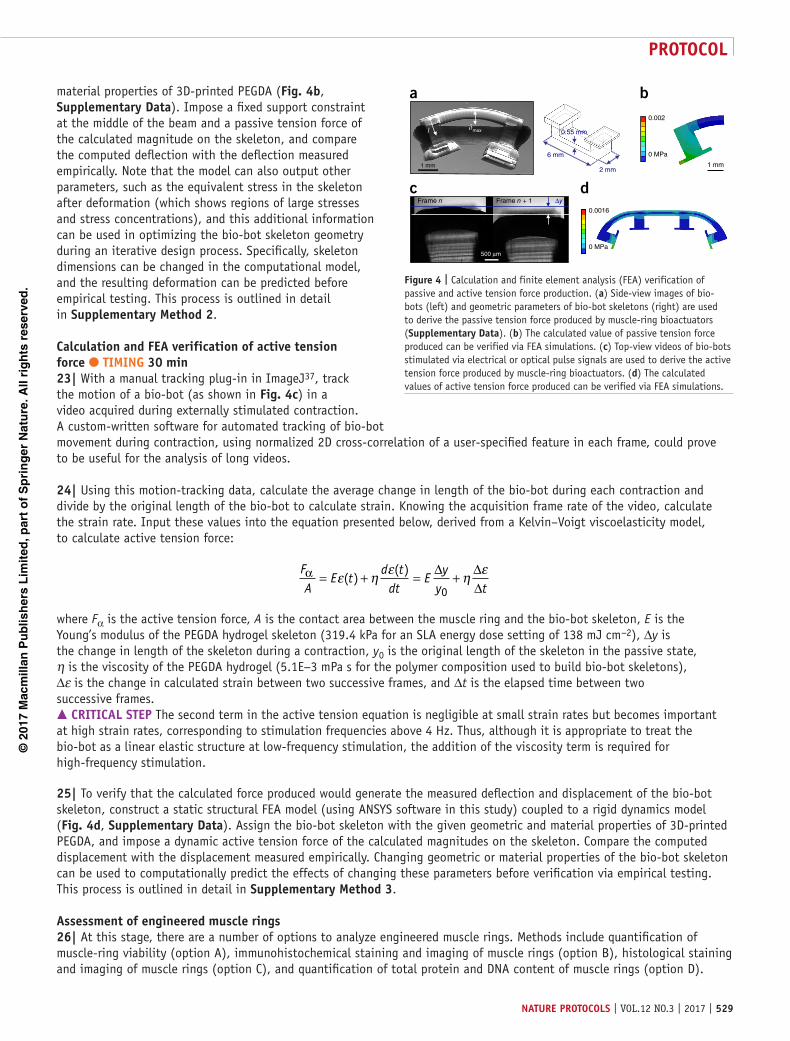
Figure 4 | Calculation and finite element analysis (FEA) verification of passive and active tension force production. (a) Side-view images of bio-bots (left) and geometric parameters of bio-bot skeletons (right) are used to derive the passive tension force produced by muscle-ring bioactuators (supplementary Data). (b) The calculated value of passive tension force produced can be verified via FEA simulations. (c) Top-view videos of bio-bots stimulated via electrical or optical pulse signals are used to derive the active tension force produced by muscle-ring bioactuators. (d) The calculated values of active tension force produced can be verified via FEA simulations.

©20
17 M
acm
illan
Pu
blis
her
s L
imit
ed, p
art
of
Sp
rin
ger
Nat
ure
. All
rig
hts
res
erve
d.
protocol
530 | VOL.12 NO.3 | 2017 | nature protocols
(a) Quantification of muscle-ring viability tIMInG 4 h (i) Immerse muscle rings individually in a 24-well plate in MTS working solution (500 µl per ring) for 4 h in the dark at 37 °C.
Also incubate 500 µl of the working solution in a separate well, without immersed muscle rings, as a negative control. crItIcal step The reagent is sensitive to light and should be kept in the dark during preparation and incubation.
(ii) After the 4-h incubation, remove 100 µl of solution from each of the wells, including the negative control, and pipette each sample into a separate well of a 96-well plate. crItIcal step The use of a multichannel pipette in Step 26A(i,ii) will ensure identical volumes for each sample.
(iii) Read the absorbance of the medium in each well at a 490-nm excitation wavelength using a plate reader. First, compute the difference in absorbance of the solution obtained from sample wells as compared with the negative control. Comparing this normalized absorbance across different experimental groups will provide relative viability data for different muscle treatments, with larger absorbance values corresponding to increased viability.
(B) Immunohistochemical staining and imaging of muscle rings tIMInG 2 d (i) Wash bio-bots in PBS and immerse them in a solution of 4% formaldehyde dissolved in PBS for 30 min to fix the
muscle tissue. Wash with PBS three times for 5 min each. (ii) Immerse bio-bots in a solution of 0.2% (vol/vol) Triton X-100 in PBS for 15 min on a rotator or shaker at 4 °C to
permeabilize the tissue. Wash them with PBS three times for 5 min each. (iii) Immerse bio-bots in Image-iT FX Signal Enhancer blocking solution for at least 30 min.
pause poInt Tissues immersed in blocking solution can be stored at 4 °C for up to 6 months. (iv) Immerse bio-bots in primary antibodies (MF-20, 1:400 dilution in blocking solution; α-actinin, 1:400 dilution
in blocking solution) overnight at 4 °C. Wash with PBS three times for 5 min each. (v) Immerse bio-bots in secondary antibodies (goat anti-mouse IgG (H+L) secondary antibody Alexa Fluor 488 conjugate,
1:400 dilution in blocking solution; F(ab′)2-goat anti-rabbit IgG (H+L) secondary antibody Alexa Fluor 568 conjugate, 1:400 dilution in blocking solution) overnight in the dark at 4 °C. Wash them with PBS three times for 5 min each.
(vi) Immerse bio-bots in a stock solution of DAPI (1:5,000 dilution in deionized water) for 10 min in the dark. Wash them with PBS three times for 5 min each.
(vii) Add a small amount of liquid agarose to a glass-bottom Petri dish, and then immediately place a stained bio-bot onto the agarose and cover it with more liquid agarose. Store it in the dark at 4 °C until ready for imaging.
(viii) Image stained bio-bot muscle rings using a fluorescence microscope with excitation wavelengths specified by the fluorophores conjugated to the secondary antibodies. crItIcal step Muscle rings should be imaged as soon as possible after staining.
(c) Histological staining and imaging of muscle rings tIMInG 2 d (i) Wash bio-bots in PBS and immerse them in a solution of liquid nitrogen for 2 min to snap-freeze the muscle tissue.
Store the muscle tissues immediately at −80 °C to preserve protein content. ! cautIon Handle liquid nitrogen with care, and use proper PPE to avoid injury or asphyxiation. The use of an approved bench-top dewar can facilitate the snap-freezing process. pause poInt Frozen tissues can be stored at −80 °C for up to 6 months.
(ii) Embed the muscle tissue in optimal cutting temperature compound in the orientation desired, and cut 10- to 15-µm sections with a temperature-controlled cryostat.
(iii) Mount the tissue sections on glass slides and stain them with H&E or other desired histological stains to detect cells and extracellular proteins of interest.
(iv) Allow the slides to dry for 24 h, and image them with a digital pathology system (such as a NanoZoomer).(D) Quantification of total protein and Dna content of muscle rings tIMInG 4 h (i) If samples are to be analyzed at a later date, wash the bio-bots in PBS and immerse them in a solution of liquid
nitrogen for 2 min to snap-freeze the muscle tissue. Store the muscle tissues immediately at −80 °C to preserve protein content. ! cautIon Handle liquid nitrogen with care, and use proper PPE to avoid injury or asphyxiation. The use of an approved bench-top dewar can facilitate the snap-freezing process. pause poInt Frozen tissues can be stored at −80 °C for up to 6 months.
(ii) If live tissues are to be analyzed immediately, wash bio-bots in PBS to remove excess medium. (iii) Use sterile scissors or forceps to gently cut the muscle tissue in half. Weigh each half using a balance scale,
and record the mass. (iv) Place each half into a separate microcentrifuge tube in the appropriate lysis buffer and gently cut the tissues
into small pieces. Vortex the sample for 10 s. (v) Use a DNeasy Blood and Tissue Kit (or equivalent) to isolate the genomic DNA from each muscle tissue half,
according to the manufacturer’s instructions. Measure the DNA concentration at 260 nm using a spectrophotometer, and calculate the total content of DNA using the elution volume and the total mass of the muscle ring.

©20
17 M
acm
illan
Pu
blis
her
s L
imit
ed, p
art
of
Sp
rin
ger
Nat
ure
. All
rig
hts
res
erve
d.
protocol
nature protocols | VOL.12 NO.3 | 2017 | 531
(vi) Use a BCA Protein Assay Kit (or equivalent) to determine the total protein content in each muscle tissue half, according to the manufacturer’s instructions. First, add RIPA buffer to the tube to lyse the other half of each muscle tissue on ice for 30 min. Centrifuge the sample at 14,000g at room temperature for 15 min and collect the supernatant. crItIcal step Ensure that the tissue is completely lysed before continuing. Periodic vortexing during the lysing step may assist. If tissue pieces are still visible, sonicate the muscle tissues for 10 s.
(vii) Measure the absorbance of each sample at 562 nm using a spectrophotometer, and compare the value with a standard curve of BSA protein absorbance versus concentration to determine the protein concentration. Calculate the total protein content using the known supernatant volume and the total mass of the muscle tissue. This concentration may be normalized to the number of cells in the sample by dividing by the calculated total DNA content.
? trouBlesHootInGTroubleshooting advice can be found in table 1.
tIMInGSteps 1 and 2, CAD file preparation for 3D printing: 1 hSteps 3–10, 3D printing of injection molds and bio-bot skeletons: 3 hSteps 11–15, manufacturing of modular muscle-ring bioactuators: 2 hStep 16, coupling of muscle-ring bioactuators to bio-bot skeletons: 5 minSteps 17 and 18, maturation and functional optimization of modular muscle rings: 7 dStep 19A, optical stimulation of muscle contraction: 5 minStep 19B, electrical stimulation of muscle contraction: 5 minSteps 20–22, calculation of passive tension force: 30 minSteps 23–25, calculation of active tension force: 30 minStep 26A, quantification of muscle-ring viability: 4 hStep 26B, immunohistochemical staining and imaging of muscle rings: 2 dStep 26C, histological staining and imaging of muscle rings: 2 dStep 26D, quantification of total protein and DNA content of muscle rings: 4 h
taBle 1 | Troubleshooting table.
step problem possible reason possible solution
7 Layers of 3D-printed parts are of inconsistent thicknesses
Resin solution surface was uneven during fabrication
Subject the Petri dish to oxygen plasma treatment to render the inner surface of the dish hydrophilic
14 Cell/gel solution volume contains several bubbles, resulting in inconsistent volumes pipetted into injection mold wells
This solution is viscous, and bubbles can be introduced during quick pipetting and mixing
Make a larger volume of cell/gel solution than that required for two wells of an injection mold. The volumes provided in this protocol generate 25% more cell/gel solution than is required
16 Muscle rings break during transfer from injection molds to skeleton
Muscle rings have limited elasticity and will rupture if overstretched
Modify mold dimensions to manufacture muscle rings with larger inner diameters, rendering transfer to smaller skeletons easier
17 Muscle rings thin and rupture during culture
Myoblasts produce fibrinolytic compounds that break down the natural fibrin hydrogel matrix that composes the muscle ring
Increase the concentration of ACA, the anti-fibrinolytic compound already present in the culture medium, to 2–3 mg ml−1
19A(i) Muscle rings do not generate measurable active tension forces in response to optical stimulation
The optical light stimulus is not penetrating the depth of the muscle tissue and exciting all the myotubes within
Increase light intensity and reduce muscle ring thickness until optical stimulation produces active tension forces similar to those produced by electrical stimulation
Muscle ring force production varies considerably from batch to batch
The concentration of Matrigel can vary from lot to lot, yielding different protein concentrations in each batch of muscle rings
Consult the certificates of analysis provided by the manufacturer for information regarding protein concentration in the lot used, and use the same lot across experiments to attain con-sistent results. In our experiments, the total protein concentration was 9.1 ± 0.4 mg ml−1

©20
17 M
acm
illan
Pu
blis
her
s L
imit
ed, p
art
of
Sp
rin
ger
Nat
ure
. All
rig
hts
res
erve
d.
protocol
532 | VOL.12 NO.3 | 2017 | nature protocols
antIcIpateD resultsUsing the formulations presented in this protocol, muscle rings are expected to contain elongated, aligned, and multinucleated myotubes with sarcomeric striations, visible by a range of immunohistochemical staining and imaging methods (Fig. 5). Functionally, muscle rings should produce passive tension forces on the order of 1,710 ± 230 µN (n = 3; mean ± SD). This corresponds to 3.2 ± 0.4 kPa when divided by the average cross-sectional area of 0.54 ± 0.06 mm2 (n = 3), as measured by confocal microscopy. Muscle rings are anticipated to produce active tension forces of 195 ± 7.3, 114 ± 8.1, and 110 ± 16 µN (n = 3) in response to optical stimulation at 1, 2, and 4 Hz, respectively (Fig. 6a). These correspond to active tension stresses of 0.36 ± 0.01, 0.21 ± 0.02, and 0.20 ± 0.03 kPa.
Stimulation with electrical pulses should produce active tension forces similar to those produced by optical stimulation (Fig. 6b,c). The active tension strain produced by the muscle rings in response to stimulation at 1 Hz is on the order of 1%. Unconstrained muscle rings (uncoupled to bio-bot skeletons) can produce strains on the order of 3% for short periods of time (supplementary Video 2), but myotubes within the muscle rings do not retain their alignment without the mechanical strain provided by the bio-bot skeleton.
An exercise training regimen combining a static mechanical stretch stimulus and a dynamic optical pulse stimulus during differentiation should produce significantly increased active tension forces on the order of 283 ± 32 µN (0.52 ± 0.06 kPa) (P < 0.05, n = 3, one-way ANOVA, post-hoc Tukey’s test) in response to optical stimulation at 1 Hz. Exercised bio-bots are expected to produce directional locomotive speeds on the order of 312 ± 63 µm s−1 (n = 6) and
Merge
a
50
100
150
200
250
150200
250300
350400
1101009080706050403020100y (µ
m)
x (µm)
z (µ
m)
b
c
Figure 5 | Immunohistochemistry of engineered muscle tissues. (a) A confocal z-stack reveals the 3D nature of the muscle tissue, which contains elongated and multinucleated myotubes. Tissues were stained for mature myosin (MF-20; green), the optogenetic ion channel (Channelrhodopsin-2 (ChR2); red), and nuclei (DAPI; blue). (b) Confocal imaging of muscle tissue slices highlights sarcomeric striations characteristic of mature myofibers, visualized with an antibody against α-actinin protein (red), nuclei (DAPI; blue) and mature myosin (MF-20; green). (c) Histological (H&E) staining distinguishes myotubes (pink) and nuclei (blue). Scale bars, 100 µm (a); 20 µm (b); 100 µm (c).
1,950a b cPassiveActive
PassiveActive
PassiveElectricalOptical1,900
For
ce (
µN)
For
ce (
µN)
For
ce (
µN)
1,850
1,800
1,750
1,700
1,950
1,900
1,850
1,800
1,750
1,700
1,950
1,900
1,850
1,800
1,750
1,7000 5 10 15 20 0 5 10 15 20 0 2 4 6 8 10
Time (s) Time (s) Time (s)
Figure 6 | Muscle-ring force production. (a) Passive and active tension forces produced by representative muscle ring in response to optical stimulation at 1 Hz. (b) Passive and active tension forces produced by representative muscle ring in response to optical stimulation at 4 Hz. The passive tension baseline increases at higher-frequency stimulation, as the muscle ring is not allowed to reach a fully relaxed state before the next pulse stimulus. (c) Comparison of active tension forces produced by representative muscle ring in response to optical and electrical stimulation at 1 Hz, showing no difference between force produced using the two methods of external stimulation (P < 0.05, n = 3, one-way ANOVA, post hoc Tukey’s test).
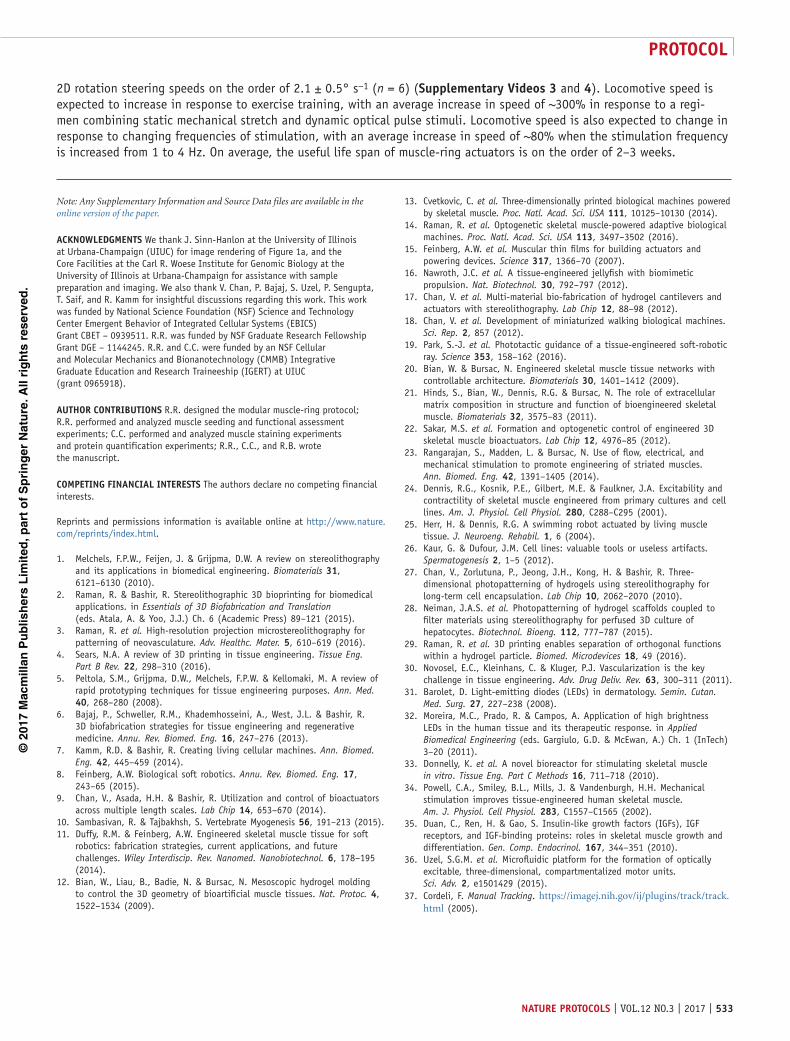
©20
17 M
acm
illan
Pu
blis
her
s L
imit
ed, p
art
of
Sp
rin
ger
Nat
ure
. All
rig
hts
res
erve
d.
protocol
nature protocols | VOL.12 NO.3 | 2017 | 533
2D rotation steering speeds on the order of 2.1 ± 0.5° s−1 (n = 6) (supplementary Videos 3 and 4). Locomotive speed is expected to increase in response to exercise training, with an average increase in speed of ~300% in response to a regi-men combining static mechanical stretch and dynamic optical pulse stimuli. Locomotive speed is also expected to change in response to changing frequencies of stimulation, with an average increase in speed of ~80% when the stimulation frequency is increased from 1 to 4 Hz. On average, the useful life span of muscle-ring actuators is on the order of 2–3 weeks.
Note: Any Supplementary Information and Source Data files are available in the online version of the paper.
acknowleDGMents We thank J. Sinn-Hanlon at the University of Illinois at Urbana-Champaign (UIUC) for image rendering of Figure 1a, and the Core Facilities at the Carl R. Woese Institute for Genomic Biology at the University of Illinois at Urbana-Champaign for assistance with sample preparation and imaging. We also thank V. Chan, P. Bajaj, S. Uzel, P. Sengupta, T. Saif, and R. Kamm for insightful discussions regarding this work. This work was funded by National Science Foundation (NSF) Science and Technology Center Emergent Behavior of Integrated Cellular Systems (EBICS) Grant CBET – 0939511. R.R. was funded by NSF Graduate Research Fellowship Grant DGE – 1144245. R.R. and C.C. were funded by an NSF Cellular and Molecular Mechanics and Bionanotechnology (CMMB) Integrative Graduate Education and Research Traineeship (IGERT) at UIUC (grant 0965918).
autHor contrIButIons R.R. designed the modular muscle-ring protocol; R.R. performed and analyzed muscle seeding and functional assessment experiments; C.C. performed and analyzed muscle staining experiments and protein quantification experiments; R.R., C.C., and R.B. wrote the manuscript.
coMpetInG FInancIal Interests The authors declare no competing financial interests.
Reprints and permissions information is available online at http://www.nature.com/reprints/index.html.
1. Melchels, F.P.W., Feijen, J. & Grijpma, D.W. A review on stereolithography and its applications in biomedical engineering. Biomaterials 31, 6121–6130 (2010).
2. Raman, R. & Bashir, R. Stereolithographic 3D bioprinting for biomedical applications. in Essentials of 3D Biofabrication and Translation (eds. Atala, A. & Yoo, J.J.) Ch. 6 (Academic Press) 89–121 (2015).
3. Raman, R. et al. High-resolution projection microstereolithography for patterning of neovasculature. Adv. Healthc. Mater. 5, 610–619 (2016).
4. Sears, N.A. A review of 3D printing in tissue engineering. Tissue Eng. Part B Rev. 22, 298–310 (2016).
5. Peltola, S.M., Grijpma, D.W., Melchels, F.P.W. & Kellomaki, M. A review of rapid prototyping techniques for tissue engineering purposes. Ann. Med. 40, 268–280 (2008).
6. Bajaj, P., Schweller, R.M., Khademhosseini, A., West, J.L. & Bashir, R. 3D biofabrication strategies for tissue engineering and regenerative medicine. Annu. Rev. Biomed. Eng. 16, 247–276 (2013).
7. Kamm, R.D. & Bashir, R. Creating living cellular machines. Ann. Biomed. Eng. 42, 445–459 (2014).
8. Feinberg, A.W. Biological soft robotics. Annu. Rev. Biomed. Eng. 17, 243–65 (2015).
9. Chan, V., Asada, H.H. & Bashir, R. Utilization and control of bioactuators across multiple length scales. Lab Chip 14, 653–670 (2014).
10. Sambasivan, R. & Tajbakhsh, S. Vertebrate Myogenesis 56, 191–213 (2015).11. Duffy, R.M. & Feinberg, A.W. Engineered skeletal muscle tissue for soft
robotics: fabrication strategies, current applications, and future challenges. Wiley Interdiscip. Rev. Nanomed. Nanobiotechnol. 6, 178–195 (2014).
12. Bian, W., Liau, B., Badie, N. & Bursac, N. Mesoscopic hydrogel molding to control the 3D geometry of bioartificial muscle tissues. Nat. Protoc. 4, 1522–1534 (2009).
13. Cvetkovic, C. et al. Three-dimensionally printed biological machines powered by skeletal muscle. Proc. Natl. Acad. Sci. USA 111, 10125–10130 (2014).
14. Raman, R. et al. Optogenetic skeletal muscle-powered adaptive biological machines. Proc. Natl. Acad. Sci. USA 113, 3497–3502 (2016).
15. Feinberg, A.W. et al. Muscular thin films for building actuators and powering devices. Science 317, 1366–70 (2007).
16. Nawroth, J.C. et al. A tissue-engineered jellyfish with biomimetic propulsion. Nat. Biotechnol. 30, 792–797 (2012).
17. Chan, V. et al. Multi-material bio-fabrication of hydrogel cantilevers and actuators with stereolithography. Lab Chip 12, 88–98 (2012).
18. Chan, V. et al. Development of miniaturized walking biological machines. Sci. Rep. 2, 857 (2012).
19. Park, S.-J. et al. Phototactic guidance of a tissue-engineered soft-robotic ray. Science 353, 158–162 (2016).
20. Bian, W. & Bursac, N. Engineered skeletal muscle tissue networks with controllable architecture. Biomaterials 30, 1401–1412 (2009).
21. Hinds, S., Bian, W., Dennis, R.G. & Bursac, N. The role of extracellular matrix composition in structure and function of bioengineered skeletal muscle. Biomaterials 32, 3575–83 (2011).
22. Sakar, M.S. et al. Formation and optogenetic control of engineered 3D skeletal muscle bioactuators. Lab Chip 12, 4976–85 (2012).
23. Rangarajan, S., Madden, L. & Bursac, N. Use of flow, electrical, and mechanical stimulation to promote engineering of striated muscles. Ann. Biomed. Eng. 42, 1391–1405 (2014).
24. Dennis, R.G., Kosnik, P.E., Gilbert, M.E. & Faulkner, J.A. Excitability and contractility of skeletal muscle engineered from primary cultures and cell lines. Am. J. Physiol. Cell Physiol. 280, C288–C295 (2001).
25. Herr, H. & Dennis, R.G. A swimming robot actuated by living muscle tissue. J. Neuroeng. Rehabil. 1, 6 (2004).
26. Kaur, G. & Dufour, J.M. Cell lines: valuable tools or useless artifacts. Spermatogenesis 2, 1–5 (2012).
27. Chan, V., Zorlutuna, P., Jeong, J.H., Kong, H. & Bashir, R. Three-dimensional photopatterning of hydrogels using stereolithography for long-term cell encapsulation. Lab Chip 10, 2062–2070 (2010).
28. Neiman, J.A.S. et al. Photopatterning of hydrogel scaffolds coupled to filter materials using stereolithography for perfused 3D culture of hepatocytes. Biotechnol. Bioeng. 112, 777–787 (2015).
29. Raman, R. et al. 3D printing enables separation of orthogonal functions within a hydrogel particle. Biomed. Microdevices 18, 49 (2016).
30. Novosel, E.C., Kleinhans, C. & Kluger, P.J. Vascularization is the key challenge in tissue engineering. Adv. Drug Deliv. Rev. 63, 300–311 (2011).
31. Barolet, D. Light-emitting diodes (LEDs) in dermatology. Semin. Cutan. Med. Surg. 27, 227–238 (2008).
32. Moreira, M.C., Prado, R. & Campos, A. Application of high brightness LEDs in the human tissue and its therapeutic response. in Applied Biomedical Engineering (eds. Gargiulo, G.D. & McEwan, A.) Ch. 1 (InTech) 3–20 (2011).
33. Donnelly, K. et al. A novel bioreactor for stimulating skeletal muscle in vitro. Tissue Eng. Part C Methods 16, 711–718 (2010).
34. Powell, C.A., Smiley, B.L., Mills, J. & Vandenburgh, H.H. Mechanical stimulation improves tissue-engineered human skeletal muscle. Am. J. Physiol. Cell Physiol. 283, C1557–C1565 (2002).
35. Duan, C., Ren, H. & Gao, S. Insulin-like growth factors (IGFs), IGF receptors, and IGF-binding proteins: roles in skeletal muscle growth and differentiation. Gen. Comp. Endocrinol. 167, 344–351 (2010).
36. Uzel, S.G.M. et al. Microfluidic platform for the formation of optically excitable, three-dimensional, compartmentalized motor units. Sci. Adv. 2, e1501429 (2015).
37. Cordeli, F. Manual Tracking. https://imagej.nih.gov/ij/plugins/track/track.html (2005).
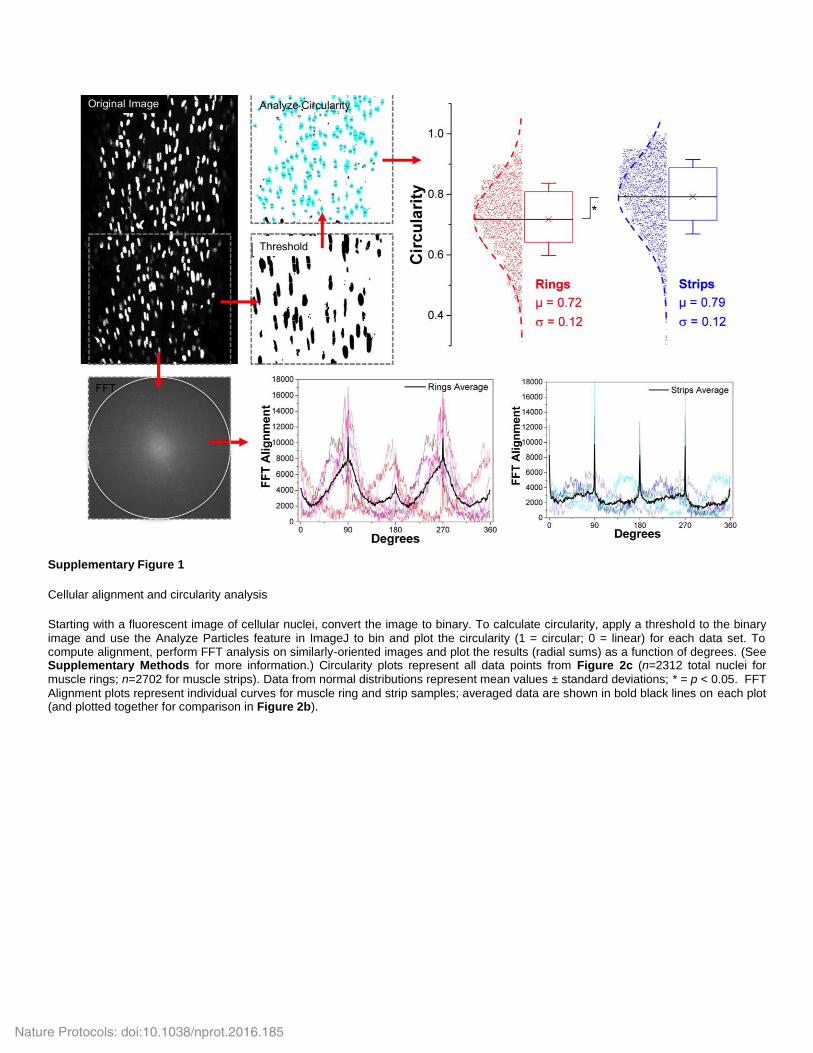
Supplementary Figure 1
Cellular alignment and circularity analysis
Starting with a fluorescent image of cellular nuclei, convert the image to binary. To calculate circularity, apply a threshold to the binary image and use the Analyze Particles feature in ImageJ to bin and plot the circularity (1 = circular; 0 = linear) for each data set. To compute alignment, perform FFT analysis on similarly-oriented images and plot the results (radial sums) as a function of degrees. (See Supplementary Methods for more information.) Circularity plots represent all data points from Figure 2c (n=2312 total nuclei for muscle rings; n=2702 for muscle strips). Data from normal distributions represent mean values ± standard deviations; * = p < 0.05. FFT
Alignment plots represent individual curves for muscle ring and strip samples; averaged data are shown in bold black lines on each plot (and plotted together for comparison in Figure 2b).
Nature Protocols: doi:10.1038/nprot.2016.185
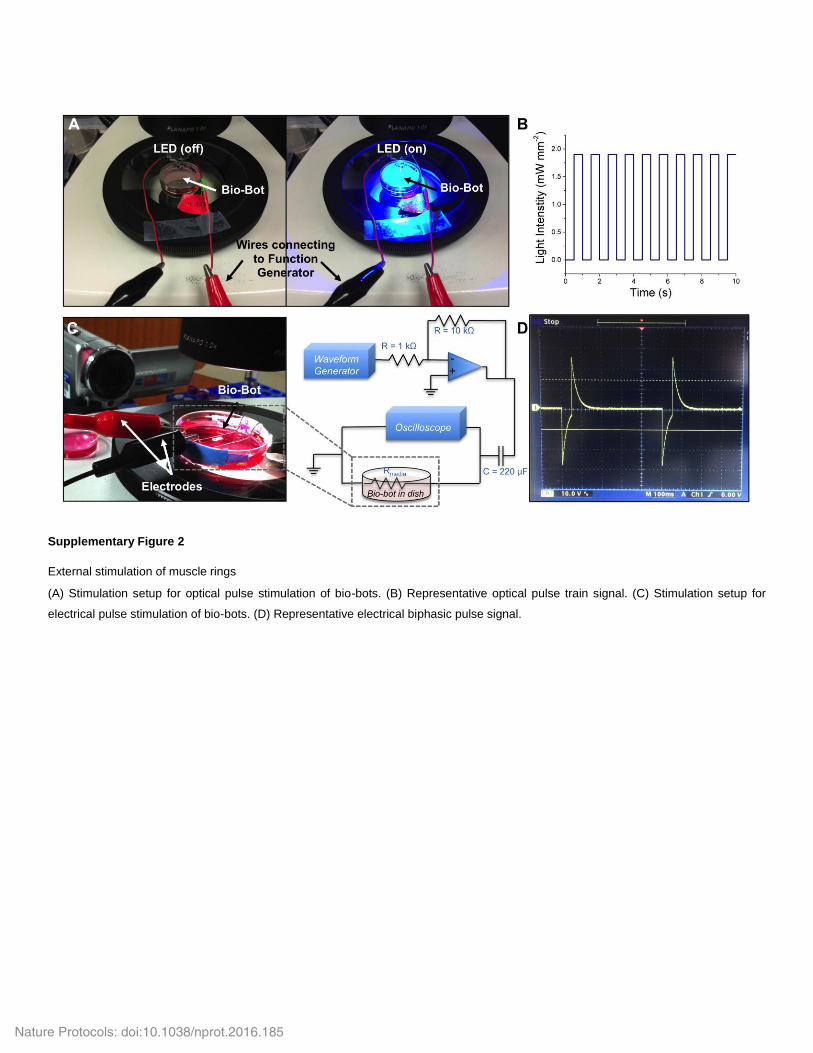
Supplementary Figure 2
External stimulation of muscle rings
(A) Stimulation setup for optical pulse stimulation of bio-bots. (B) Representative optical pulse train signal. (C) Stimulation setup for
electrical pulse stimulation of bio-bots. (D) Representative electrical biphasic pulse signal.
Nature Protocols: doi:10.1038/nprot.2016.185
Supplementary Figure 3
Muscle ring exercise training regimen
Protocol for stimulating bio-bots using a static mechanical stimulus (imposed by tethering the bio-bot to an underlying glass coverslip) starting Day 1, immediately after ring transfer, and a dynamic optical stimulus (imposed by the apparatus shown in Supplementary Figure 1 starting Day 4, after transferring the bio-bots to differentiation medium.
Nature Protocols: doi:10.1038/nprot.2016.185
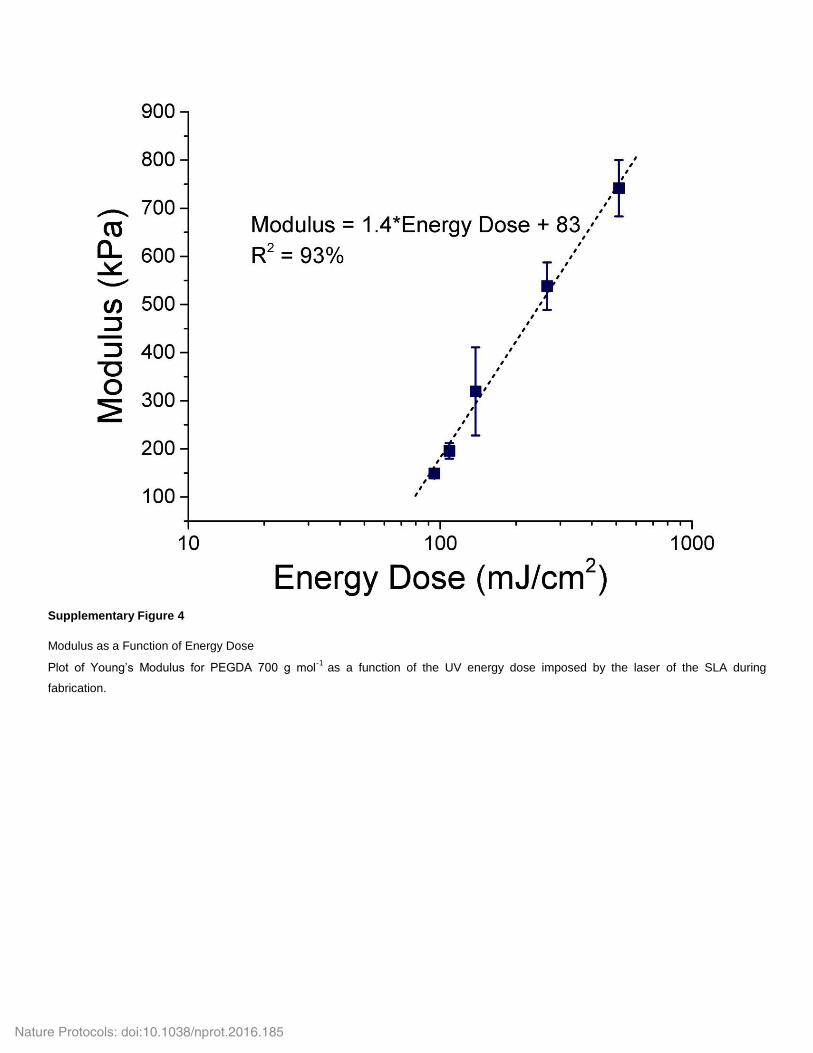
Supplementary Figure 4
Modulus as a Function of Energy Dose
Plot of Young’s Modulus for PEGDA 700 g mol-1
as a function of the UV energy dose imposed by the laser of the SLA during
fabrication.
Nature Protocols: doi:10.1038/nprot.2016.185

SUPPLEMENTARY METHOD 1: Image processing for analysis of cellular
orientation and morphology
1| Using the protocol outlined in step 26B from the main protocol, stain and image the
muscle tissue, including a nuclear stain such as DAPI.
PAUSE POINT Images should be saved after staining and imaging.
2| Open the file containing the fluorescently-labeled nuclei in ImageJ and convert to 8-
bit. By comparison to the original image, adjust the brightness and contrast to ensure that
only (and all of) the nuclei are visible (Supplementary Figure 4).
3| (A) Quantification of cellular alignment in muscle rings
(i) Rotate the image 90º (Image Transform Rotate 90 Degrees Right).
(ii) Perform a Fast Fourier Transform on the binary image (Process FFT
FFT).
(iii) Use the oval tool to draw a circle around the image.
CRITICAL STEP Ensure that the circle is centered on the image.
(iv) Compute the radial sum using the Oval Profile plug-in for ImageJ. Select
“360” for number of points and “Radial Sums” for analysis mode. This
will output a plot of summed intensity around the circle.
(v) Click “List” to view the x-y values.
(vi) Repeat steps 3 (A)(i-v) above for each image. Alternatively, a
fluorescently labeled image of myotubes (as shown in Figure 3b) may be
used for FFT alignment analysis.
4| (A) Quantification of circularity of nuclei
(i) Using the binary image from step 2 above, apply a threshold (Image
Adjust Threshold) to highlight the nuclei (Supplementary Figure 4).
(ii) Apply the Watershed algorithm to segment nuclei that are touching
(Process Binary Watershed). If necessary, further separate touching
particles by applying Erode or Open operations.
(iii) Analyze the selected nuclei (Analyze Analyze Particles). If a range of
sizes or circularity values is desired, input those parameters here. Select
“Overlay Masks” to label the analyzed nuclei. Select “Exclude Egdes”,
“Include Holes,” and “Display Results”.
Nature Protocols: doi:10.1038/nprot.2016.185

CRITICAL STEP Inspect the resultant image to ensure that the particles were
appropriately separated for analysis from step 4 (B)(ii).
CRITICAL STEP Make sure that the “Shape descriptors” option is selected
(Results Set Measurements) to view circularity values.
(iv) Copy the results for further analysis.
SUPPLEMENTARY METHOD 2: Passive tension FEA analysis of bio-bot skeletons
1| Open the Supplementary Data file titled “Passive Tension Template.wbpj” in
ANSYS finite element analysis software. The default screen should display a Static
Structural model on a page titled Project Schematic. The SOLIDWORKS file “Half
Symmetric BioBot.SLDPRT” (corresponding to one half of a symmetric one-leg bio-bot
skeleton) should already be loaded in the “Geometry” tab of the Static Structural model.
If not, right click on “Geometry” and upload the CAD file “Half Symmetric
BioBot.SLDPRT” included in the Supplementary Data.
2| Right click on the “Engineering Data” tab of the Static Structural model and click Edit
to verify that the appropriate values for material properties of PEGDA 700 (Young’s
Modulus = 3.194E+05 Pa, Poisson’s Ratio = 0.45) are listed. If these values do not
appear, type in the correct values before closing the tab and returning to the main Project
Schematic menu.
3| Right click on the “Model” tab of the Static Structural model and click Edit to open the
Model page. Click on “Half Symmetric BioBot” under “Geometry” to verify that the
Material Assignment is PEGDA 700. Click on “Fixed Support” under “Static Structural”
to verify that the support is applied to the middle of the beam.
4| Right click on the “Static Structural” menu and click Insert -> Force. Apply a static
force of the calculated passive tension magnitude on the pillar of the bio-bot skeleton.
Click the “Solve” button at the top of the menu on the Model page.
5| Verify that “Total Deformation” appears under “Solution” menu. If not, right click on
“Solution” and click Insert -> Deformation -> Total. You can also choose to add other
forms of solution, such as equivalent stress, to show regions or large stresses and stress
concentrations. To do so, right click on “Solution” and click Insert -> Stress ->
Equivalent (von Mises).
Nature Protocols: doi:10.1038/nprot.2016.185
6| Click on “Total Deformation” under “Solution” to see the computed deflection of the
model and compare it to the deflection measured empirically. If the computed deflection
varies greatly from experimental values, re-visit your passive tension measurements and
calculations.
7| Once computed deflections match those observed empirically, change geometric and
material properties of the bio-bot skeleton in the FEA model to predict the effects of
changing these parameters in an experiment.
SUPPLEMENTARY METHOD 3: Active tension FEA analysis of bio-bot skeletons
1| Open the Supplementary Data file titled “Active Tension Template.wbpj” in ANSYS
finite element analysis software. The default screen should display a Static Structural
model coupled to a Rigid Dynamics model on a page titled Project Schematic. The
SOLIDWORKS file “2LS.SLDPRT” (corresponding to a two-leg symmetric bio-bot
skeleton) should already be loaded in the Geometry tab of the Static Structural model. If
not, right click on Geometry and upload the CAD file “2LS.SLDPRT” included in the
Supplementary Data.
2| Verify that the “Engineering Data”, “Geometry”, and “Model” tabs of the Static
Structural and Rigid Dynamics model are linked. If not, select the three tabs and move
the mouse to link them.
3| Right click on the “Engineering Data” tab of the Rigid Dynamics model and click Edit
to verify that the appropriate values for material properties of PEGDA 700 (Young’s
Modulus = 3.194E+05 Pa, Poisson’s Ratio = 0.45) are listed. If these values do not
appear, type in the correct values before closing the tab and returning to the main Project
Schematic menu.
4| Right click on the “Model” tab of the Rigid Dynamics model and click Edit to open the
Model page. Click on “2LS” under “Geometry” to verify that the Material Assignment is
PEGDA 700. Click on “Frictionless Support” and “Frictionless Support 2” under “Static
Structural” to verify that the supports are applied to the bottom of the two ends of the bio-
bot skeleton.
Nature Protocols: doi:10.1038/nprot.2016.185
5| Right click on the “Static Structural” menu and click Insert -> Force. Apply a time-
varying force of the calculated active tension magnitude on the pillar of the bio-bot
skeleton. Click the “Solve” button at the top of the menu on the Model page.
6| Verify that “Total Deformation” appears under “Solution” menu. If not, right click on
“Solution” and click Insert -> Deformation -> Total. You can also choose to add other
forms of solution, such as equivalent stress, to show regions or large stresses and stress
concentrations. To do so, right click on “Solution” and click Insert -> Stress ->
Equivalent (von Mises).
7| Click on “Total Deformation” under “Solution” to see the computed deflection of the
model and compare it to the deflection measured empirically. If the computed deflection
varies greatly from experimental values, re-visit your active tension measurements and
calculations.
8| Once computed deflections match those observed empirically, change geometric and
material properties of the bio-bot skeleton in the FEA model to predict the effects of
changing these parameters in an experiment.
Nature Protocols: doi:10.1038/nprot.2016.185