a modified new method for estimating smoking-attributable ... · a modified new method for...
TRANSCRIPT

Demographic Research a free, expedited, online journal
of peer-reviewed research and commentary in the population sciences published by the Max Planck Institute for Demographic Research Konrad-Zuse Str. 1, D-18057 Rostock · GERMANY www.demographic-research.orgDEMOGRAPHIC RESEARCH VOLUME 23, ARTICLE 14, PAGES 399-420 PUBLISHED 17 AUGUST 2010 http://www.demographic-research.org/Volumes/Vol23/14/ DOI: 10.4054/DemRes.2010.23.14 Research Article
A modified new method for estimating smoking-attributable mortality in high-income countries
Brian Rostron
© 2010 Brian Rostron. This open-access work is published under the terms of the Creative Commons Attribution NonCommercial License 2.0 Germany, which permits use, reproduction & distribution in any medium for non-commercial purposes, provided the original author(s) and source are given credit. See http:// creativecommons.org/licenses/by-nc/2.0/de/
Table of Contents
1 Introduction and review of existing methods for estimating smoking-attributable mortality
400
2 The PGW method and an evaluation 402 3 The proposed modified PGW-R method and results 405 4 Evaluation of the proposed PGW-R method 408 5 Summary and conclusion 417 References 418

Demographic Research: Volume 23, Article 14 Research Article
http://www.demographic-research.org 399
A modified new method for estimating smoking-attributable mortality in high-income countries
Brian Rostron1
Abstract
Preston, Glei, and Wilmoth (2010) recently proposed an innovative regression-based method for estimating smoking-attributable mortality in developed countries based on observed lung cancer death rates. Their estimates for females, however, differ appreciably from some published estimates. This article presents a modified version of the Preston, Glei, and Wilmoth method that includes an age-period interaction term in its model. This modified version produces improved estimates of smoking-attributable mortality that are consistent with results from a modified version of the Peto-Lopez indirect method.
1 University of California, Berkeley. E-mail: [email protected].

Rostron: A modified new method for estimating smoking-attributable mortality in high-income countries
400 http://www.demographic-research.org
1. Introduction and review of existing methods for estimating smoking-attributable mortality
Attention has recently been directed to methods that estimate smoking-attributable mortality because of their usefulness in examining the role of smoking in mortality differences among developed countries. Several studies have shown a divergence in mortality trends at older ages among developed countries in recent decades, particularly for females. Meslé and Vallin (2006) observed that life expectancy at age 65 for females increased only slightly from 1984 to 2000 in the U.S. and the Netherlands, even as female e65 increased steadily in France and Japan during this period. Janssen, Kunst, and Mackenbach (2007) found similar differences in mortality declines at ages 80 and over in seven European countries, with declines steadily continuing in France, but stagnating in countries such as Denmark and the Netherlands. They concluded that these differences among countries were largely due to differences in smoking-related mortality. The effect of previous cigarette smoking on these mortality trends deserves particular attention. Decades of medical and epidemiological research have demonstrated that cigarette smoking is the leading cause of preventable mortality in the U.S. and most other developed countries (DHHS 2000; Ezzati et al. 2002). More specifically, Staetsky (2009) recently showed that smoking is a principal cause of observed mortality differences among selected developed countries. Staetsky also used the indirect Peto-Lopez method to estimate mortality in these countries in the absence of smoking-attributable deaths.
Various methods have been proposed and used to measure smoking-attributable mortality in populations. Pérez-Ríos and Montes (2008) provided a useful systematic review of these methods. They found that two general types of methods were most commonly used in the research literature. Both types of methods generally calculate the fraction of deaths in a population that are attributable to smoking (smoking-attributable fraction or SAF). The first group of methods, which Pérez-Ríos and Montes called “prevalence-based analysis,” calculate SAF from data for current and former smoker prevalence, usually obtained from surveys, and relative risks for smoking, usually obtained from prospective cohort studies, such as the American Cancer Society’s Cancer Prevention Study II (CPS II). Pérez-Ríos and Montes cited the method used by the U.S. Centers for Disease Control and Prevention (CDC) to estimate smoking-attributable mortality as an example of a prevalence-based analysis. The CDC method (2008) estimates adult smoking-attributable mortality using current and former smoker prevalence data from the National Health Interview Survey (NHIS), with relative risks for 19 causes obtained from the CPS-II. It estimates infant smoking-attributable mortality using maternal smoking prevalence from birth certificate data and relative risks for four causes for infants of mothers who smoke obtained from a meta-analysis of

Demographic Research: Volume 23, Article 14
http://www.demographic-research.org 401
epidemiologic studies. Separate methods are used by the CDC to estimate smoking-attributable mortality due to secondhand smoke and burns.
Pérez-Ríos and Montes identified the indirect method presented by Peto et al. (1992, 1994) as the other commonly used method for estimating smoking-attributable mortality. The method, commonly called the Peto-Lopez method, estimates smoking-attributable mortality by sex and age group in a national population in two general steps. First, observed lung cancer death rates in the national population are compared to lung cancer death rates among non-smokers in a study population. The Peto-Lopez method uses CPS-II participants for its study population. (Smoking status was identified at baseline in the CPS-II and non-smokers reported that they had never smoked regularly.) All excess lung cancer mortality in the national population is attributed to smoking. Second, estimated smoking exposure and relative risks of smoking are used to calculate the smoking-attributable fractions of mortality from other causes. Smoking exposure in the national population is estimated by calculating the proportion of smokers and non-smokers that would have produced observed lung cancer death rates, based on the assumption that these smokers and non-smokers had the same lung cancer mortality as current and non-smokers in the CPS-II. Relative risks of mortality for selected causes are calculated from mortality for current and non-smokers in the CPS-II. Only half of the excess relative risk for causes other than lung cancer is attributed to smoking to control for potential confounding factors. The smoking-attributable fractions of deaths by cause estimated for persons aged 75-79 are also used for those 80 and over because of concerns about data quality at older ages. No deaths from cirrhosis or external causes, such as accidents, are attributed to smoking.
Pérez-Ríos and Montes also identified two less common classes of methods to estimate smoking-attributable mortality in the literature. One class was “excess mortality methods,” which generally compare the mortality between smokers and non-smokers in a population and calculate the difference. Pérez-Ríos and Montes cited as an example of this class a recent study conducted by Rogers et al. (2005). These researchers calculated relative mortality risks for seven smoker groups (heavy, moderate, and light current smoker; heavy, moderate, and light former smoker; and never smoker) by sex from 1990 NHIS supplement data linked to mortality follow-up, controlling for a variety of demographic characteristics and mortality risk factors. They then applied these risks to the numbers of people in each smoker group in the U.S. in 2000, based on NHIS smoking prevalence data, to estimate the numbers of deaths attributable to smoking. The final class of methods identified by Pérez-Ríos and Montes, “predictive models,” was represented by one research effort, the Prevent simulation model developed in the Netherlands.
Preston, Glei, and Wilmoth (2010) recently proposed an innovative regression-based method to estimate smoking-attributable mortality that is useful in examining the
Rostron: A modified new method for estimating smoking-attributable mortality in high-income countries
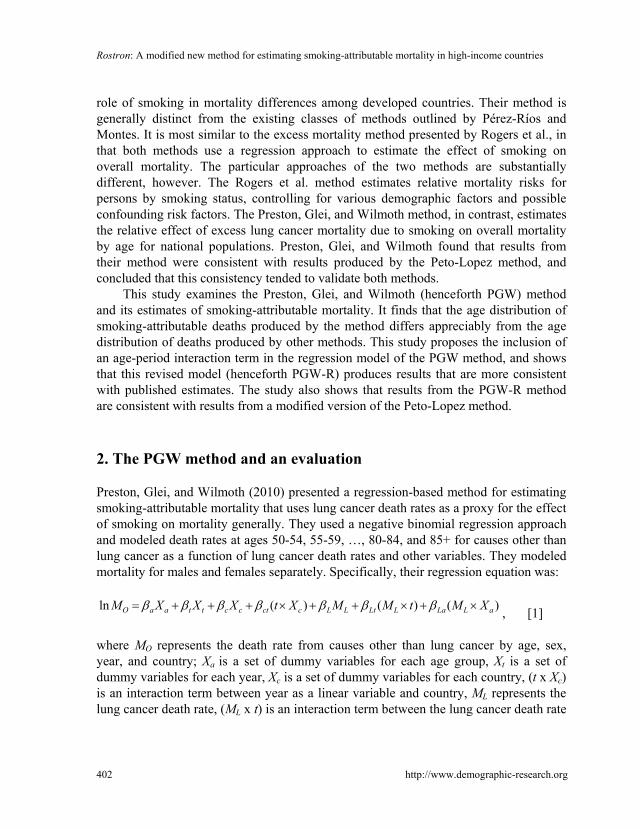
role of smoking in mortality differences among developed countries. Their method is generally distinct from the existing classes of methods outlined by Pérez-Ríos and Montes. It is most similar to the excess mortality method presented by Rogers et al., in that both methods use a regression approach to estimate the effect of smoking on overall mortality. The particular approaches of the two methods are substantially different, however. The Rogers et al. method estimates relative mortality risks for persons by smoking status, controlling for various demographic factors and possible confounding risk factors. The Preston, Glei, and Wilmoth method, in contrast, estimates the relative effect of excess lung cancer mortality due to smoking on overall mortality by age for national populations. Preston, Glei, and Wilmoth found that results from their method were consistent with results produced by the Peto-Lopez method, and concluded that this consistency tended to validate both methods.
This study examines the Preston, Glei, and Wilmoth (henceforth PGW) method and its estimates of smoking-attributable mortality. It finds that the age distribution of smoking-attributable deaths produced by the method differs appreciably from the age distribution of deaths produced by other methods. This study proposes the inclusion of an age-period interaction term in the regression model of the PGW method, and shows that this revised model (henceforth PGW-R) produces results that are more consistent with published estimates. The study also shows that results from the PGW-R method are consistent with results from a modified version of the Peto-Lopez method.
2. The PGW method and an evaluation
Preston, Glei, and Wilmoth (2010) presented a regression-based method for estimating smoking-attributable mortality that uses lung cancer death rates as a proxy for the effect of smoking on mortality generally. They used a negative binomial regression approach and modeled death rates at ages 50-54, 55-59, …, 80-84, and 85+ for causes other than lung cancer as a function of lung cancer death rates and other variables. They modeled mortality for males and females separately. Specifically, their regression equation was:
)()()(ln aLLaLLtLLcctccttaaO XMtMMXtXXXM ×+×++×+++= βββββββ , [1]
where MO represents the death rate from causes other than lung cancer by age, sex, year, and country; Xa is a set of dummy variables for each age group, Xt is a set of dummy variables for each year, Xc is a set of dummy variables for each country, (t x Xc) is an interaction term between year as a linear variable and country, ML represents the lung cancer death rate, (ML x t) is an interaction term between the lung cancer death rate
402 http://www.demographic-research.org
Demographic Research: Volume 23, Article 14
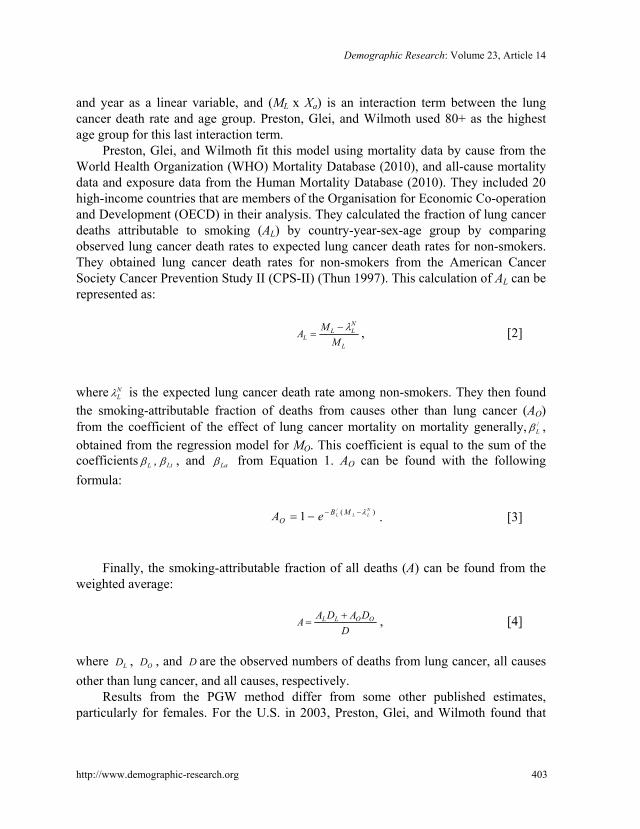
and year as a linear variable, and (ML x Xa) is an interaction term between the lung cancer death rate and age group. Preston, Glei, and Wilmoth used 80+ as the highest age group for this last interaction term.
Preston, Glei, and Wilmoth fit this model using mortality data by cause from the World Health Organization (WHO) Mortality Database (2010), and all-cause mortality data and exposure data from the Human Mortality Database (2010). They included 20 high-income countries that are members of the Organisation for Economic Co-operation and Development (OECD) in their analysis. They calculated the fraction of lung cancer deaths attributable to smoking (AL) by country-year-sex-age group by comparing observed lung cancer death rates to expected lung cancer death rates for non-smokers. They obtained lung cancer death rates for non-smokers from the American Cancer Society Cancer Prevention Study II (CPS-II) (Thun 1997). This calculation of AL can be represented as:
L
NLL
L MMA λ−
= , [2]
where N
Lλ is the expected lung cancer death rate among non-smokers. They then found the smoking-attributable fraction of deaths from causes other than lung cancer (AO) from the coefficient of the effect of lung cancer mortality on mortality generally, /
Lβ , obtained from the regression model for MO. This coefficient is equal to the sum of the coefficients Lβ , Ltβ , and Laβ from Equation 1. AO can be found with the following formula:
)(/
1NLLL MB
O eA λ−−−= . [3]
Finally, the smoking-attributable fraction of all deaths (A) can be found from the
weighted average:
DDADA
A OOLL += , [4]
where LD , OD , and D are the observed numbers of deaths from lung cancer, all causes other than lung cancer, and all causes, respectively.
Results from the PGW method differ from some other published estimates, particularly for females. For the U.S. in 2003, Preston, Glei, and Wilmoth found that
http://www.demographic-research.org 403
Rostron: A modified new method for estimating smoking-attributable mortality in high-income countries
244,000 deaths for males and 271,000 deaths for females aged 50 and over were due to smoking. The Centers for Disease Control and Prevention (CDC) estimated that, during the period from 2000 to 2004, an average of 270,000 deaths for males and 174,000 deaths for females in the U.S. each year were attributable to smoking (2008). Rogers et al. (2005) found that approximately 161,000 deaths for males aged 50 and over, and 115,000 deaths for females aged 50 and over were due to smoking. These estimates are probably somewhat lower than actual values. The estimates from Rogers et al. do not include deaths attributable to passive smoking exposure, and the CDC estimates that approximately 10% of all deaths due to smoking in the U.S. are attributable to this exposure (2008). Rogers et al. also used smoking status as reported at the beginning of a seven-year follow-up period to determine relative mortality risks for various classes of smokers. Taylor et al. (2002) showed that adjustment for change in smoking status during a 14-year follow-up period in the CPS-II study increased estimates of relative mortality risk for smokers by 8% to 28%, compared to continuing use of smoking status as reported at baseline.
Estimates of smoking-attributable mortality by age group from the PGW method also differ from some estimates obtained from other methods. Preston, Glei, and Wilmoth did not report smoking-attributable deaths by age, but their published estimates of /
Lβ by age group and supplementary data can be used to produce these estimates. The PGW method estimates that approximately 244,000 deaths among U.S. females in 2000 were due to smoking. Of these deaths, approximately 57% were among women aged 80 and over. This large proportion results for the most part from the PGW method’s much larger estimate of /
Lβ for the 80+ age group than for other older age groups for females. For example, /
Lβ in 2003 was four times larger for the female 80+ age group than for the female 75-79 age group. The comparable increase in /
Lβ for males from the 75-79 age group to the 80+ age group was only 0.042 to 0.050. As suggested by Equation 3, /
Lβ by sex should generally decrease with age, due to increases with age in lung cancer mortality attributable to smoking, and/or to decreases in the proportion of mortality from other causes attributable to smoking. Preston, Glei, and Wilmoth suggested that the increase in /
Lβ for the open-ended age group might be due to under-classification of lung cancer deaths at these advanced ages. This explanation might account for the slight increase in /
Lβ observed for males, but seems insufficient to account for the quadrupling in /
Lβ for females from ages 75-79 to 80+. The age distribution of smoking-attributable deaths for females estimated by the
PGW method also differs somewhat from the distribution produced by the Peto-Lopez method, which is the method that Preston, Glei, and Wilmoth cited as validation for their results. They presented estimates for older ages for the age group 70+, but their method can be replicated with WHO Mortality Database (2010) data to produce
404 http://www.demographic-research.org

Demographic Research: Volume 23, Article 14
estimates for more specific age groups. This calculation indicates that the Peto-Lopez method estimates that approximately 41% of deaths due to smoking for women in the U.S. in 2000 were among women aged 80 and over. This proportion may actually be an overestimate. The Peto-Lopez method uses the same smoking-attributable fractions that were estimated for the 75-79 age group for those aged 80 and over because of concerns about the accuracy of mortality data at advanced ages. Rostron and Wilmoth (forthcoming) showed that this procedure can significantly increase the estimated number of smoking-attributable deaths for those aged 80 and over when smoking exposure is increasing appreciably for successive cohorts at older ages. Preston and Wang (2006) showed that smoking consistently increased among successive cohorts of U.S. women born in the first half of the 20th century.
3. The proposed modified PGW-R method and results
There is thus evidence that results from the PGW method for females differ from some other published estimates in terms of smoking-attributable mortality overall and by age. This article presents a modified version of the PGW method (the PGW-R method) that produces more plausible estimates. The PGW-R method introduces an age group-year interaction term into the method’s regression approach to better model mortality change from causes other than lung cancer by age group over time. All analyses with the PGW-R method were conducted using an updated version of the dataset that was used by Preston, Glei, and Wilmoth for their article. This updated dataset was provided by the authors and is available as supplementary data on the International Journal of Epidemiology website. Analyses were conducted using R version 2.10.0.
The PGW-R method introduces an age group-year interaction term [ )aX(at t ×β ] into the regression equation shown in Equation 1. Year is treated as a linear variable, and the age groups 50-54 to 85+ are used in the interaction term. Inclusion of such an interaction term is reasonable in modeling mortality. The Lee-Carter method, commonly used to model and predict death rates, includes just two predictor terms – an age term and a term interacting age and period effects – in its model, in addition to an error term (Lee and Carter 1992). Inclusion of an age group-year term in the PGW regression model allows for change in mortality from causes other than lung cancer by age group to be better represented over time. Table 1 compares published estimates of /
Lβ for 2003 from the PGW method with estimates from the PGW-R method. Results for males from both methods are very similar, although use of the interaction term produces estimates of /
Lβ that consistently decrease with increasing age for all age groups. Results for females from the two methods are different for the oldest age
http://www.demographic-research.org 405
Rostron: A modified new method for estimating smoking-attributable mortality in high-income countries
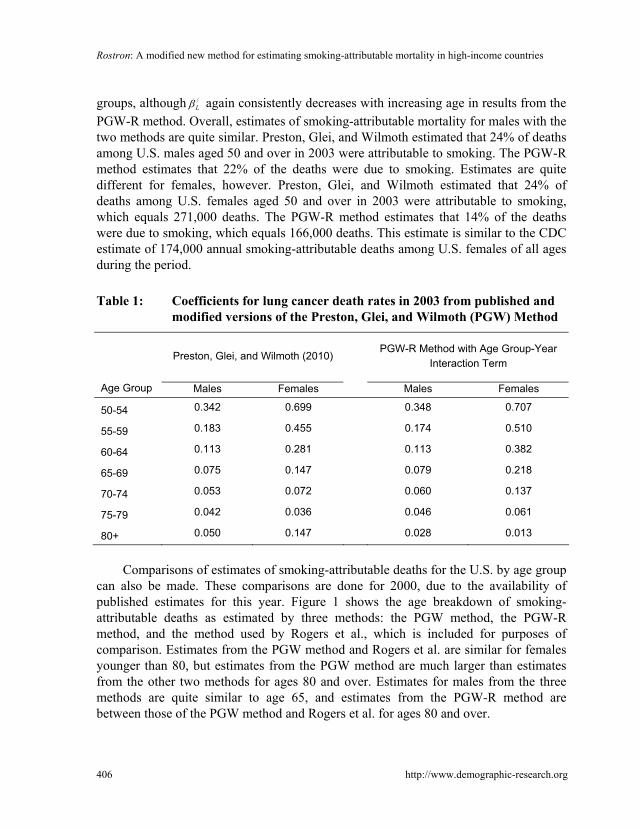
groups, although /Lβ again consistently decreases with increasing age in results from the
PGW-R method. Overall, estimates of smoking-attributable mortality for males with the two methods are quite similar. Preston, Glei, and Wilmoth estimated that 24% of deaths among U.S. males aged 50 and over in 2003 were attributable to smoking. The PGW-R method estimates that 22% of the deaths were due to smoking. Estimates are quite different for females, however. Preston, Glei, and Wilmoth estimated that 24% of deaths among U.S. females aged 50 and over in 2003 were attributable to smoking, which equals 271,000 deaths. The PGW-R method estimates that 14% of the deaths were due to smoking, which equals 166,000 deaths. This estimate is similar to the CDC estimate of 174,000 annual smoking-attributable deaths among U.S. females of all ages during the period.
Table 1: Coefficients for lung cancer death rates in 2003 from published and
modified versions of the Preston, Glei, and Wilmoth (PGW) Method
Preston, Glei, and Wilmoth (2010) PGW-R Method with Age Group-Year
Interaction Term
Age Group Males Females Males Females
50-54 0.342 0.699 0.348 0.707
55-59 0.183 0.455 0.174 0.510
60-64 0.113 0.281 0.113 0.382
65-69 0.075 0.147 0.079 0.218
70-74 0.053 0.072 0.060 0.137
75-79 0.042 0.036 0.046 0.061
80+ 0.050 0.147 0.028 0.013
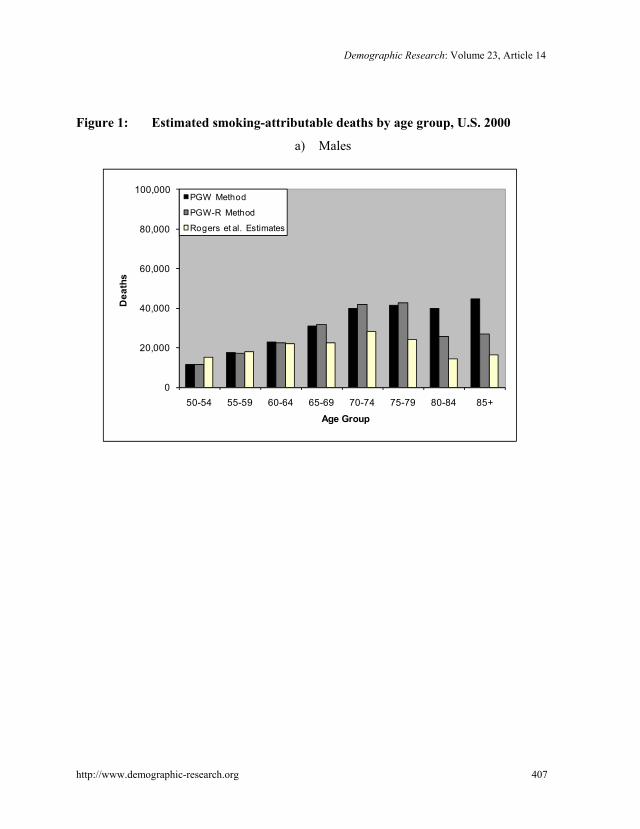
Comparisons of estimates of smoking-attributable deaths for the U.S. by age group
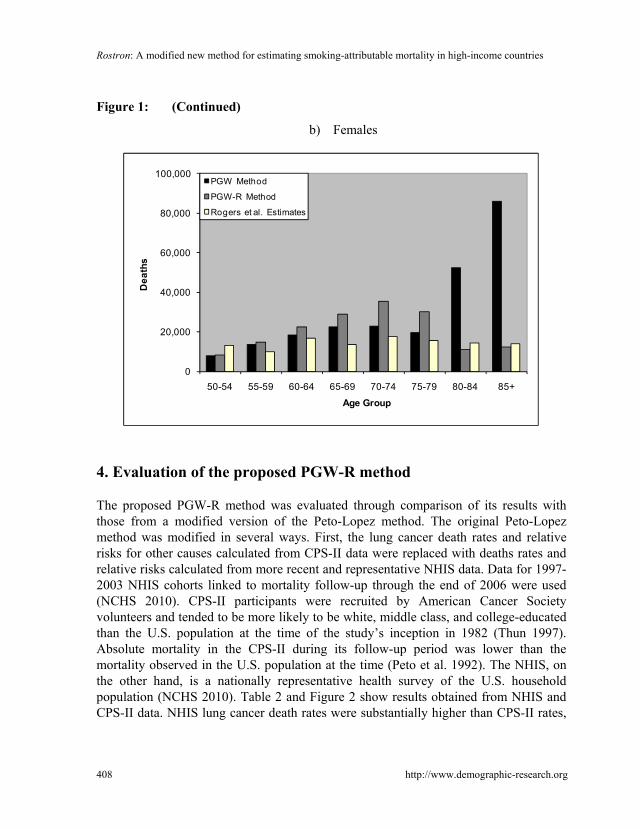
can also be made. These comparisons are done for 2000, due to the availability of published estimates for this year. Figure 1 shows the age breakdown of smoking-attributable deaths as estimated by three methods: the PGW method, the PGW-R method, and the method used by Rogers et al., which is included for purposes of comparison. Estimates from the PGW method and Rogers et al. are similar for females younger than 80, but estimates from the PGW method are much larger than estimates from the other two methods for ages 80 and over. Estimates for males from the three methods are quite similar to age 65, and estimates from the PGW-R method are between those of the PGW method and Rogers et al. for ages 80 and over.
406 http://www.demographic-research.org
Demographic Research: Volume 23, Article 14
Figure 1: Estimated smoking-attributable deaths by age group, U.S. 2000
a) Males
0
20,000
40,000
60,000
80,000
100,000
50-54 55-59 60-64 65-69 70-74 75-79 80-84 85+
Dea
ths
Age Group
PGW Method
PGW-R Method
Rogers et al. Estimates
http://www.demographic-research.org 407
Rostron: A modified new method for estimating smoking-attributable mortality in high-income countries
Figure 1: (Continued)
b) Females
0
20,000
40,000
60,000
80,000
100,000
50-54 55-59 60-64 65-69 70-74 75-79 80-84 85+
Dea
ths
Age Group
PGW Method
PGW-R Method
Rogers et al. Estimates
4. Evaluation of the proposed PGW-R method
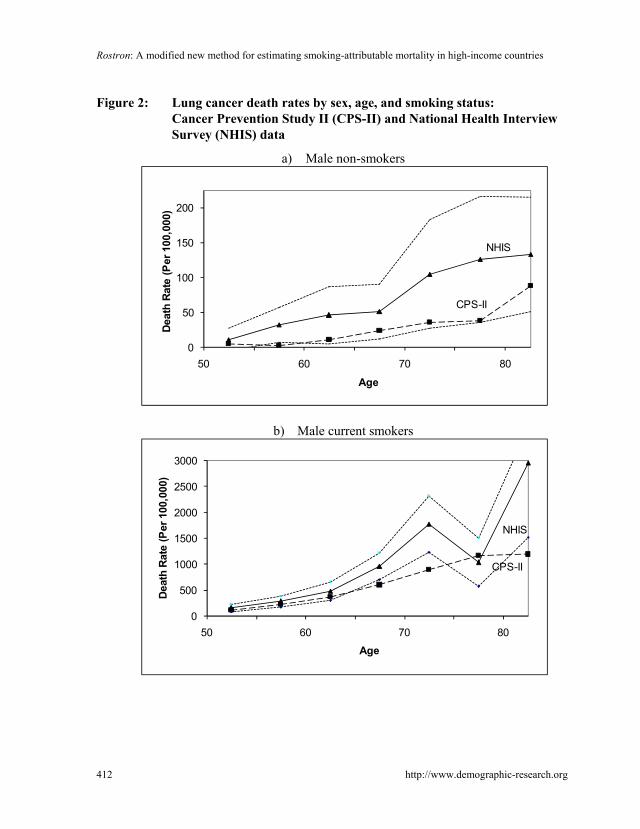
The proposed PGW-R method was evaluated through comparison of its results with those from a modified version of the Peto-Lopez method. The original Peto-Lopez method was modified in several ways. First, the lung cancer death rates and relative risks for other causes calculated from CPS-II data were replaced with deaths rates and relative risks calculated from more recent and representative NHIS data. Data for 1997-2003 NHIS cohorts linked to mortality follow-up through the end of 2006 were used (NCHS 2010). CPS-II participants were recruited by American Cancer Society volunteers and tended to be more likely to be white, middle class, and college-educated than the U.S. population at the time of the study’s inception in 1982 (Thun 1997). Absolute mortality in the CPS-II during its follow-up period was lower than the mortality observed in the U.S. population at the time (Peto et al. 1992). The NHIS, on the other hand, is a nationally representative health survey of the U.S. household population (NCHS 2010). Table 2 and Figure 2 show results obtained from NHIS and CPS-II data. NHIS lung cancer death rates were substantially higher than CPS-II rates,
408 http://www.demographic-research.org
Demographic Research: Volume 23, Article 14
http://www.demographic-research.org 409
particularly for female smokers. This result could be caused by the low mortality observed in the CPS-II study population, as well as by a possible increase in smoking intensity and duration among U.S. female smokers over time. Unadjusted relative risks for other causes from the NHIS and CPS-II were generally similar, with the exception of upper aerodigestive cancers for males. Second, the NHIS relative risks for smokers for causes other than lung cancer were calculated while directly controlling for confounding risk factors, and all of the resulting excess relative risk was attributed to smoking. These relative risks were calculated using a Cox proportional hazards model. Controls for education (less than high school graduate, high school graduate, more than high school graduate), economic status (family income less than 100% of poverty threshold, 100%-149% of poverty threshold, 150%-199% of poverty threshold, 200% or more of poverty threshold), and weight (“underweight” or “normal” – Body Mass Index (BMI) < 25, “overweight” - 25 <= BMI < 30, “obese” – BMI > 30) were included for all causes. Controls for alcohol consumption (no alcohol consumption, “light to moderate alcohol consumption” - 1-2 drinks on average on days consuming alcohol for females and 1-3 drinks on average for males, and “heavy alcohol consumption” – 3+ drinks for females and 4+ drinks for males on average on days consuming alcohol) were included for upper aerodigestive cancers and other cancers. Relative risks for other medical causes for smokers aged 75-79 and 80 and over were calculated for current and former smokers compared to non-smokers, given that most smoking-attributable deaths at these ages occur among former smokers (Rogers et al. 2005). The proportional hazards assumption of the Cox model was evaluated for each covariate using chi-squared tests of non-zero slope of the scaled Schoenfeld residuals as a function of time. The assumption was found to be valid for each covariate. Table 2 shows that controlling for confounding factors generally lowered the NHIS relative risks, although the decreases were usually much less than the conservative halving of excess relative risk employed in the Peto-Lopez method. Finally, smoking-attributable fractions by cause were directly estimated for persons aged 80 and over, instead of the Peto-Lopez method’s use at these ages of the same SAF’s that were estimated for those 75-79.

Rostron: A modified new method for estimating smoking-attributable mortality in high-income countries
410 http://www.demographic-research.org
Table 2: Relative mortality risks for current smokers compared to non-smokers: CPS-II and NHIS data
CPS-II NHIS
Causes of Death (ICD 9; 10) Males, RR Females, RR Males, RR Males, CI Females, RR Females, CI
Upper aerodigestive cancer (ICD 140-150, 161; C00-C15, C32)
7.87 6.95 2.56 1.48, 4.44 7.38 1.64, 33.27
Other cancer (rest of ICD 140-209 except 162; C16-C31, C35-C99)
1.69 1.20 1.87 1.47, 2.38 1.30 1.07, 1.58
Chronic obstructive pulmonary disease (ICD 490-2, 492-6; J40-J47)
13.82 14.21 14.19 5.61, 35.87 15.22 7.35, 31.54
Cirrhosis, accidents, and violence (ICD 571, 800-999; K70, K73-K74, V01-Y99)
— — — — — —
Other medical causes (rest of ICD 000-799 except 162; rest of A01-R99 except C33-C34)
ages 35-59 3.05 2.69 2.10 1.63, 2.70 2.92 2.25, 3.79
60-64 2.31 2.68 2.72 1.86, 3.96 2.25 1.55, 3.25
65-69 2.09 2.52 2.31 1.70, 3.14 2.69 1.96, 3.68
70-74 2.00 2.00 2.54 1.92, 3.35 1.86 1.36, 2.54
75+ 1.54 1.44 1.60 1.33, 1.91 1.63 1.42, 1.87
75-79
80+

Demographic Research: Volume 23, Article 14
http://www.demographic-research.org 411
Table 2: (Continued)
NHIS - Adjusted for Confounding Factorsa
Causes of Death (ICD 9; 10) Males, RR Males, CI Females, RR Females, CI
Upper aerodigestive cancer (ICD 140-150, 161; C00-C15, C32)
1.98 1.08, 3.62 7.38b 1.64, 33.27
Other cancer (rest of ICD 140-209 except 162; C16-C31, C35-C99)
1.79 1.35, 2.38 1.32 1.05, 1.66
Chronic obstructive pulmonary disease (ICD 490-2, 492-6; J40-J47)
14.64 4.53, 47.36 9.60 4.64, 19.88
Cirrhosis, accidents, and violence (ICD 571, 800-999; K70, K73-K74, V01-Y99)
— — — —
Other medical causes (rest of ICD 000-799 except 162; rest of A01-R99 except C33-C34)
ages 35-59 2.10 1.54, 2.85 2.31 1.65, 3.23
60-64 2.17 1.38, 3.40 1.91 1.24, 2.93
65-69 2.09 1.40, 3.10 2.30 1.59, 3.33
70-74 2.57 1.87, 3.52 1.83 1.26, 2.64
75+ 1.51 1.22, 1.86 1.64 1.39, 1.94
75-79 1.48c 1.13, 1.95 1.51 1.23, 1.85
80+ 1.10 0.96, 1.27 1.25 1.12, 1.39
CPS-II = American Cancer Society Cancer Prevention Study II, NHIS = National Health Interview Survey, ICD = International
Classification of Diseases, RR = Relative Risk, CI = Confidence Interval. ‘—‘: No mortality from these causes was attributed to smoking. a Adjusted NHIS relative risks control for educational attainment, family income, body mass index, and alcohol consumption. b Adjusted NHIS relative risk for upper aerodigestive cancer was not calculated for females due to the small number of deaths for this
group. c Adjusted NHIS relative risks for other medical causes for ages 75-79 and 80+ were calculated for current and former smokers
compared to non-smokers.
Rostron: A modified new method for estimating smoking-attributable mortality in high-income countries
Figure 2: Lung cancer death rates by sex, age, and smoking status: Cancer Prevention Study II (CPS-II) and National Health Interview Survey (NHIS) data
a) Male non-smokers
0
50
100
150
200
50 60 70 80
Deat
h Ra
te (P
er 1
00,0
00)
Age
NHIS
CPS-II
b) Male current smokers
0
500
1000
1500
2000
2500
3000
50 60 70 80
Deat
h Ra
te (P
er 1
00,0
00)
Age
NHIS
CPS-II
412 http://www.demographic-research.org

Demographic Research: Volume 23, Article 14
Figure 2: (Continued)
c) Female non-smokers
0
50
100
150
200
50 60 70 80
Deat
h R
ate
(Per
100
,000
)
Age
NHIS
CPS-II
d) Female current mokers
0
500
1000
1500
2000
2500
3000
50 60 70 80
Deat
h R
ate
(Per
100
,000
)
Age
CPS-II
NHIS
Notes: Dashed lines indicate 95% confidence intervals for NHIS rates. CPS-II rates are from Peto et al. (1992).
http://www.demographic-research.org 413

Rostron: A modified new method for estimating smoking-attributable mortality in high-income countries
Results from this modified version of the Peto-Lopez method are similar to some published estimates of smoking-attributable mortality for the U.S. The original Peto-Lopez method estimates 269,000 smoking-attributable deaths for males and 243,000 deaths for females in the U.S. in 2000 (Peto et al. 2006). The modified Peto-Lopez method estimates 254,000 deaths for males and 185,000 deaths for females in the U.S. in 2000, for a decrease of 6% for males and 24% for females compared to the original method. The CDC estimated 259,000 average annual smoking-attributable deaths for males and 178,000 deaths for females in the U.S. during the period from 1997 to 2001 (2005), figures that are similar to those from the modified Peto-Lopez method.
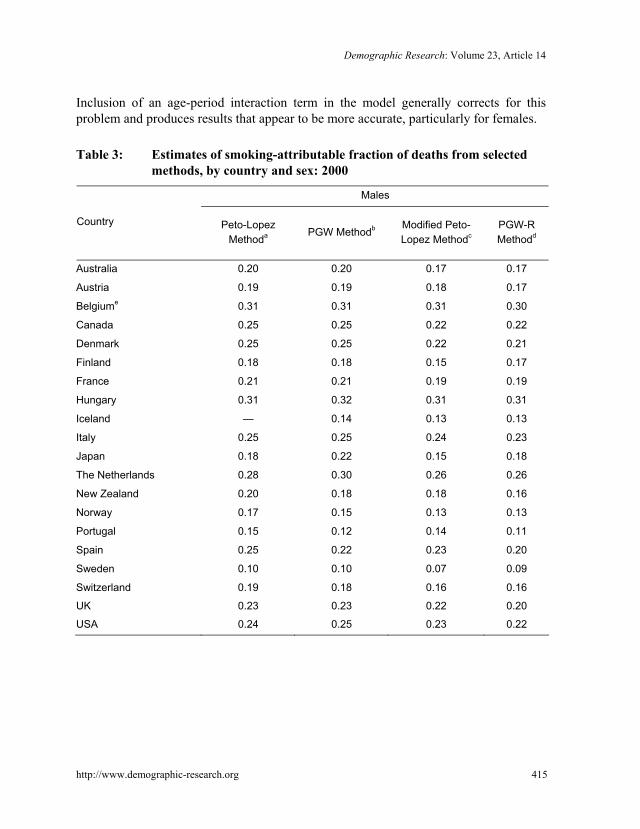
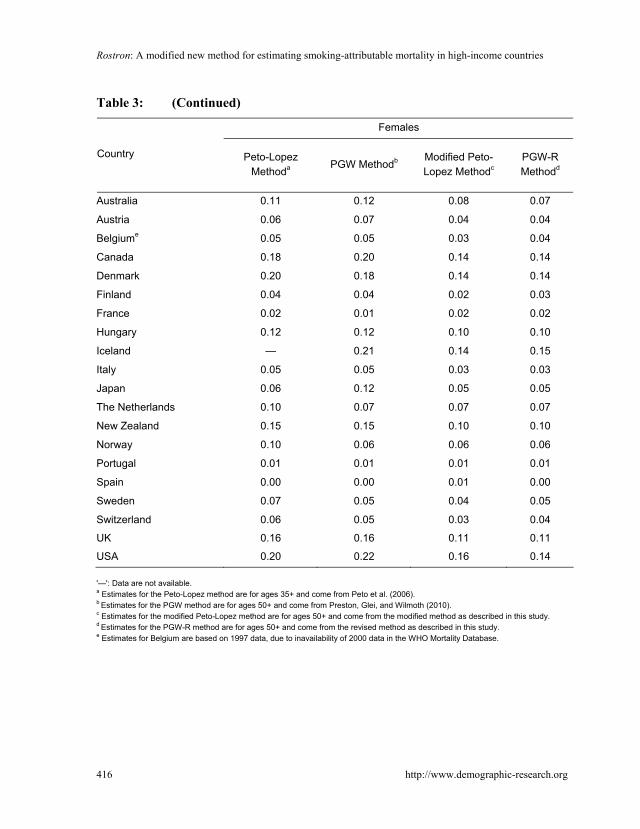
Results from the modified Peto-Lopez method are also very similar to results from the PGW-R method for the 20 high-income countries studied by Preston, Glei, and Wilmoth. Table 3 presents estimates of the smoking-attributable fraction of total deaths for males and females in these countries in 2000 from four methods: the Peto-Lopez method, the PGW method, the modified Peto-Lopez method, and the PGW-R method. Results from all four methods for males are fairly consistent, with the Peto-Lopez and PGW methods producing slightly higher SAF estimates than the modified Peto-Lopez method and PGW-R methods. Results are more divergent for females. SAF estimates from the Peto-Lopez and PGW methods are much higher for females than estimates from the modified Peto-Lopez and PGW-R methods, particularly for countries with high rates of smoking among women, such as Canada, Denmark, the U.K., and the U.S.
Results from the PGW-R and modified Peto-Lopez methods are very consistent, with 99% correlation for females and 97% for males. The methodological improvements implemented in the modified Peto-Lopez method suggest that it is a better benchmark for comparison than the Peto-Lopez method. Comparison with results from the CDC and the modified Peto-Lopez methods indicates that the PGW-R method produces more accurate estimates of smoking-attributable mortality than the PGW method, particularly for females.
414 http://www.demographic-research.org
/Lβ
Results from this and other studies suggest that in this case the Peto-Lopez and PGW methods can produce similar overestimates of female smoking-attributable mortality, although for different reasons. Rostron and Wilmoth (forthcoming) argued that the Peto-Lopez method can overestimate female smoking-attributable mortality in high smoking countries such as the U.S., due to the method’s use of low CPS-II lung cancer death rates to estimate smoking exposure and its use of the same SAF’s estimated for persons aged 75-79 for persons aged 80 and over. Results from the modified Peto-Lopez method presented here generally support this idea. Similarly, elements of the original PGW method such as the lack of an age-period interaction term in its regression model appear to have produced an overestimate of for females aged 80 and over, and thus overestimation of smoking-attributable mortality for this group.
Demographic Research: Volume 23, Article 14
http://www.demographic-research.org 415
Inclusion of an age-period interaction term in the model generally corrects for this problem and produces results that appear to be more accurate, particularly for females.
Table 3: Estimates of smoking-attributable fraction of deaths from selected
methods, by country and sex: 2000
Males
Country Peto-Lopez Methoda PGW Methodb Modified Peto-
Lopez MethodcPGW-R Methodd
Australia 0.20 0.20 0.17 0.17
Austria 0.19 0.19 0.18 0.17
Belgiume 0.31 0.31 0.31 0.30
Canada 0.25 0.25 0.22 0.22
Denmark 0.25 0.25 0.22 0.21
Finland 0.18 0.18 0.15 0.17
France 0.21 0.21 0.19 0.19
Hungary 0.31 0.32 0.31 0.31
Iceland — 0.14 0.13 0.13
Italy 0.25 0.25 0.24 0.23
Japan 0.18 0.22 0.15 0.18
The Netherlands 0.28 0.30 0.26 0.26
New Zealand 0.20 0.18 0.18 0.16
Norway 0.17 0.15 0.13 0.13
Portugal 0.15 0.12 0.14 0.11
Spain 0.25 0.22 0.23 0.20
Sweden 0.10 0.10 0.07 0.09
Switzerland 0.19 0.18 0.16 0.16
UK 0.23 0.23 0.22 0.20
USA 0.24 0.25 0.23 0.22
Rostron: A modified new method for estimating smoking-attributable mortality in high-income countries
416 http://www.demographic-research.org
Table 3: (Continued)
Females
Country Peto-Lopez Methoda PGW Methodb Modified Peto-
Lopez MethodcPGW-R Methodd
Australia 0.11 0.12 0.08 0.07
Austria 0.06 0.07 0.04 0.04
Belgiume 0.05 0.05 0.03 0.04
Canada 0.18 0.20 0.14 0.14
Denmark 0.20 0.18 0.14 0.14
Finland 0.04 0.04 0.02 0.03
France 0.02 0.01 0.02 0.02
Hungary 0.12 0.12 0.10 0.10
Iceland — 0.21 0.14 0.15
Italy 0.05 0.05 0.03 0.03
Japan 0.06 0.12 0.05 0.05
The Netherlands 0.10 0.07 0.07 0.07
New Zealand 0.15 0.15 0.10 0.10
Norway 0.10 0.06 0.06 0.06
Portugal 0.01 0.01 0.01 0.01
Spain 0.00 0.00 0.01 0.00
Sweden 0.07 0.05 0.04 0.05
Switzerland 0.06 0.05 0.03 0.04
UK 0.16 0.16 0.11 0.11
USA 0.20 0.22 0.16 0.14 '—': Data are not available. a Estimates for the Peto-Lopez method are for ages 35+ and come from Peto et al. (2006). b Estimates for the PGW method are for ages 50+ and come from Preston, Glei, and Wilmoth (2010). c Estimates for the modified Peto-Lopez method are for ages 50+ and come from the modified method as described in this study. d Estimates for the PGW-R method are for ages 50+ and come from the revised method as described in this study. e Estimates for Belgium are based on 1997 data, due to inavailability of 2000 data in the WHO Mortality Database.

Demographic Research: Volume 23, Article 14
http://www.demographic-research.org 417
5. Summary and conclusion
This article has examined the recently proposed PGW method to estimate smoking-attributable mortality in high-income countries. This method is innovative and very useful in that it relies only on observed lung cancer and all-cause death rates to estimate smoking-attributable mortality. As a result, the method can be very useful in making comparisons among numerous countries and over a range of years. The method may also be more reliable for comparisons than methods that rely on smoking prevalence data from surveys that may be inconsistent across countries. The PGW method can be consistently used for most developed countries from at least 1950 onwards, and for some developing countries in more recent years using data from the WHO Mortality Database (2010). Results from the method as presented differ, however, from some published estimates, particularly with regard to the age distribution of smoking-attributable deaths for females. This article has presented a modified version of the PGW method, the PGW-R method, which introduces an age-period interaction term into the regression analysis of the PGW method to better model mortality change over time by age for causes other than lung cancer. It has found that results from the PGW-R method are very similar to results from a modified version of the Peto-Lopez method for 20 high-income countries. The degree of consistency observed in the results tends to support the reliability of each method. Estimates of smoking-attributable mortality obtained with the PGW-R method for the U.S. are also similar to published estimates from the CDC, which further supports the reliability of this method.
Additional research is needed to further evaluate and refine these methods and their results. In particular, additional information is needed about the age distribution of smoking-attributable deaths in various countries. The CDC, for example, does not publish such a breakdown in its periodic reports on smoking-attributable mortality in the U.S. (2008). Additional research is also needed to evaluate how well the PGW-R method performs for particular countries in addition to the U.S. Results from the PGW-R method should be compared to results from the methods used to produce national estimates of smoking-attributable mortality in these countries.
Rostron: A modified new method for estimating smoking-attributable mortality in high-income countries
418 http://www.demographic-research.org
References
Centers for Disease Control and Prevention (CDC) (2005). Smoking-attributable mortality, years of potential life lost, and productivity losses - United States, 1997-2001. Morbidity and Mortality Weekly Report 54(25):625–628.
Centers for Disease Control and Prevention (CDC) (2008). Smoking-attributable mortality, years of potential life lost, and productivity losses - United States, 2000-2004. Morbidity and Mortality Weekly Report 57(45):1226–1228.
Department of Health and Human Services (DHHS) (2000). Healthy people 2010. 2nd ed. Washington, DC: U.S. Department of Health and Human Services.
Ezzati, M., Lopez, A.D., Rodgers, A., Vander Hoorn, S., Murray, C.J.L, and the Comparative Risk Assessment Collaboring Group (2002). Selected major risk factors and global and regional burden of disease. Lancet 360(9343):1347–1360. doi: 10.1016/S0140-6736(02)11403-6.
Janssen, F., Kunst, A., and Mackenbach, J. (2007). Variations in the pace of old-age mortality decline in seven European countries, 1950-1999: The role of smoking and other factors earlier in life. European Journal of Population 23(2):171–188. doi:10.1007/s10680-007-9119-5.
Lee, R.D. and Carter, L.R. (1992). Modeling and forecasting U.S. mortality. Journal of the American Statistical Association 87(419):659-671. doi:10.2307/2290201.
Meslé, F. and Vallin, J. (2006). Diverging trends in female old-age mortality: The United States and the Netherlands versus France and Japan. Population and Development Review 32(1):123–145. doi:10.1111/j.1728-4457.2006.00108.x.
National Center for Health Statistics (NCHS) (2010). National Health Interview Survey [electronic resource]. Hyattsville, MD: National Center for Health Statistics. http://www.cdc.gov/nchs/nhis.htm (last accessed June 15, 2010).
Pérez-Ríos, M. and Montes, A. (2008). Methodologies used to estimate tobacco-attributable mortality: A review. BMC Public Health 8(22). doi:10.1186/1471-2458-8-22.
Peto, R., Lopez, A.D., Boreham, J., Thun, M.J., and Heath, C.W. (1992). Mortality from tobacco in developed countries: Indirect estimation from national vital statistics. Lancet 339(8804):1268-1278. doi:10.1016/0140-6736(92)91600-D.
Demographic Research: Volume 23, Article 14
http://www.demographic-research.org 419
Peto, R., Lopez, A.D., Boreham, J., and Thun, M.J. (1994). Mortality from smoking in developed countries, 1950-2000: Indirect estimates from national statistics. New York: Oxford University Press.
Peto, R., Lopez, A.D., Boreham, J., and Thun, M.J. (2006). Mortality from Smoking in Developed Countries, 1950-2000. 2nd ed. [electronic resource]. Oxford: Oxford University. http://www.ctsu.ox.ac.uk/tobacco/
Preston, S.H., Glei, D.A., and Wilmoth, J.R. (2010). A new method for estimating smoking-attributable mortality in high-income countries. International Journal of Epidemiology 39(2):430-438. doi:10.1093/ije/dyp360.
Preston, S. H. and Wang, H. (2006). Sex mortality differences in the United States: The role of cohort smoking patterns. Demography 43(4):631–646. doi:10.1353/dem.2006.0037.
Rogers, R.G., Hummer, R.A., Krueger, P.M., and Pampel, F.C. (2005). Mortality attributable to cigarette smoking in the United States. Population and Development Review 31(2):259–292. doi:10.1111/j.1728-4457.2005.00065.x.
Rostron, B.L. and Wilmoth, J.R. (2011). Estimating the effect of smoking on slowdowns in mortality declines in developed countries. Demography (forthcoming).
Staetsky, L. (2009). Diverging trends in female old-age mortality: A reappraisal. Demographic Research 21(30):885-914. doi:10.4054/DemRes.2009.21.30.
Taylor, D.H., Hassleblad, V., Henley, S.J., Thun, M.J., and Sloan, F.A. (2002). Benefits of smoking cessation for longevity. American Journal of Public Health. 92(6):990-996. doi:10.2105/AJPH.92.6.990.
Thun, M.J., Day-Lally, C., Myers, D.G., Calle E.E., Flanders, W.D., Zhu, B.P., Namboodiri, M.M., and Heath, C.W. (1997). Trends in tobacco smoking mortality from cigarette use in Cancer Prevention Studies I (1959 through 1965) and II (1982 through 1988). In: Changes in cigarette-related disease risks and their implications for prevention and control. Smoking and Tobacco Control Monograph no. 8. Bethesda, MD: National Cancer Institute: pp. 305-382.
University of California, Berkeley and Max Planck Institute for Demographic Research (UCB-MPIDR) (2010). Human Mortality Database [electronic resource]. Berkeley: University of California, Berkeley. http://www.mortality.org/ (last accessed January 5, 2010).

Rostron: A modified new method for estimating smoking-attributable mortality in high-income countries
420 http://www.demographic-research.org
World Health Organization (WHO) (2010). WHO Mortality Database [electronic resource]. Geneva: World Health Organization. http://www.who.int/whosis/ mort/download/en/index.html (last accessed January 5, 2010).