a modern analytical chemistry - semmchem -...
TRANSCRIPT

A MODERN ANALYTICAL CHEMISTRY 1CHEMISTRY FOR THE IB DIPLOMA © CAMBRIDGE UNIVERSITY PRESS 2011
A Modern analytical chemistry
A1 Analytical techniquesAnalytical techniques may be used for:
• qualitative analysis of the composition of pure substances or mixtures
• quantitative analysis of the composition of pure substances or mixtures
• determination of purity
• structure determination.Qualitative analysis of a pure substance results in identi� cation of
the elements present in the substance: for example, using chemical tests to determine that a substance contains calcium ions and chloride ions. Qualitative analysis of a mixture results in identi� cation of the di� erent components of the mixture: for instance, chromatography could be used to determine that a mixture of gases contains ethane and butane.
Quantitative analysis is the determination of the amounts (relative or absolute) of each element or compound present. For instance, quantitative analysis can determine that the atmosphere of Mars contains 95.3% CO2, 2.7% N2 and 1.6% Ar, as well as small amounts of other gases.
In many � elds it is essential to know whether a substance is pure or not. For, instance, in the manufacture of drugs and medicines, chromatography is used to check purity.
The structures of organic molecules may be worked out using a variety of chemical and spectroscopic techniques. Chemical techniques may include, for instance, the use of bromine water to detect the presence of a C=C functional group.
The three main spectroscopic techniques are:
• infrared spectroscopy
• nuclear magnetic resonance spectroscopy (NMR)
• mass spectrometry.Each technique provides a di� erent type of data. The information from any one of these techniques is usually not su� cient to work out the structure of an organic molecule completely, and all three are usually used together.
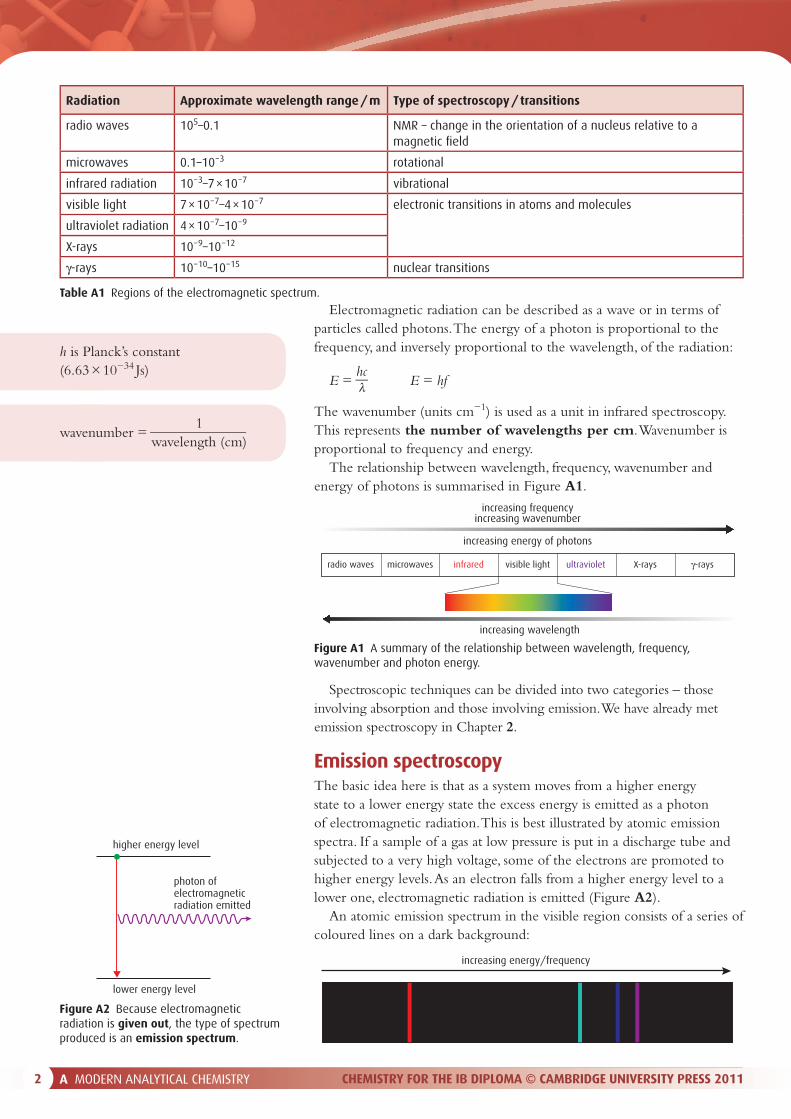
A2 Principles of spectroscopyThe regions of the electromagnetic spectrum are shown in Table A1.
Wavelength (λ) is inversely proportional to the frequency (f ) of the radiation:
cf = λ
Learning objectives
• Describe the reasons for using analytical techniques
Learning objectives
• Describe the regions of the electromagnetic spectrum
• Explain the di� erence between absorption and emission spectra
• Describe the process that allows an atom/molecule to absorb electromagnetic radiationwhere c is the speed of light (3 × 10⁸ ms−1)
Frequency is sometimes given the symbol ν.
A MODERN ANALYTICAL CHEMISTRY 2CHEMISTRY FOR THE IB DIPLOMA © CAMBRIDGE UNIVERSITY PRESS 20112 CHEMISTRY FOR THE IB DIPLOMA © CAMBRIDGE UNIVERSITY PRESS 2011A MODERN ANALYTICAL CHEMISTRY
Electromagnetic radiation can be described as a wave or in terms of particles called photons. The energy of a photon is proportional to the frequency, and inversely proportional to the wavelength, of the radiation:
E = hc
E = hf λ
The wavenumber (units cm−1) is used as a unit in infrared spectroscopy. This represents the number of wavelengths per cm. Wavenumber is proportional to frequency and energy.
The relationship between wavelength, frequency, wavenumber and energy of photons is summarised in Figure A1.
Radiation Approximate wavelength range / m Type of spectroscopy / transitions
radio waves 105–0.1 NMR – change in the orientation of a nucleus relative to a magnetic fi eld
microwaves 0.1–10−3 rotational
infrared radiation 10−3–7 × 10⁻⁷ vibrational
visible light 7 × 10⁻⁷–4 × 10⁻⁷ electronic transitions in atoms and molecules
ultraviolet radiation 4 × 10⁻⁷–10−9
X-rays 10−9–10−12
γ-rays 10−10–10−15 nuclear transitions
Table A1 Regions of the electromagnetic spectrum.
h is Planck’s constant (6.63 × 10⁻³⁴ Js)
1wavenumber =
wavelength (cm)
increasing wavelength
visible lightradio waves microwaves infrared ultraviolet X-rays γ-rays
increasing energy of photons
increasing frequencyincreasing wavenumber
Figure A1 A summary of the relationship between wavelength, frequency, wavenumber and photon energy.
Spectroscopic techniques can be divided into two categories – those involving absorption and those involving emission. We have already met emission spectroscopy in Chapter 2.
Emission spectroscopyThe basic idea here is that as a system moves from a higher energy state to a lower energy state the excess energy is emitted as a photon of electromagnetic radiation. This is best illustrated by atomic emission spectra. If a sample of a gas at low pressure is put in a discharge tube and subjected to a very high voltage, some of the electrons are promoted to higher energy levels. As an electron falls from a higher energy level to a lower one, electromagnetic radiation is emitted (Figure A2).
An atomic emission spectrum in the visible region consists of a series of coloured lines on a dark background:
lower energy level
higher energy level
photon ofelectromagneticradiation emitted
Figure A2 Because electromagnetic radiation is given out, the type of spectrum produced is an emission spectrum.
increasing energy/frequency

A MODERN ANALYTICAL CHEMISTRY 3CHEMISTRY FOR THE IB DIPLOMA © CAMBRIDGE UNIVERSITY PRESS 2011
Absorption spectroscopyIn absorption spectroscopy, energy is absorbed to promote a system from a lower energy state to a higher one. This is carried out by having a source of radiation that produces a range of frequencies, passing the radiation through a sample and analysing the frequencies of radiation that are absorbed:
source of radiation sample detector
wavelength
abso
rptio
n of
rad
iatio
n
Consider the absorption spectra of atoms in the visible region of the spectrum. White light (all frequencies of visible light) is passed through a gaseous sample, and certain frequencies of light are absorbed to promote an electron from a lower energy level to a higher one. The light transmitted has these frequencies missing (Figure A3).
Principles of spectroscopic transitionsThe energy of the electron in a hydrogen atom is quantised, i.e. the electron can have only certain amounts of energy (it exists in discrete energy levels). Quantisation of energy is a general feature of processes involving atoms, molecules and subatomic particles. Thus electronic transitions within atoms and molecules, rotations of molecules and vibrations of molecules are all quantised, i.e. just as there are only certain allowed energy levels available to the electron in a hydrogen atom, there are only certain allowed vibrational energy levels available to a hydrogen chloride molecule.
In most of the forms of spectroscopy that we will now consider, energy is absorbed to promote a system from a lower to a higher energy level, and we analyse the transmitted light to see the amount and frequency of the light absorbed. For instance, in infrared spectroscopy, energy of a certain frequency is absorbed in the infrared region of the spectrum to promote a molecule from a lower to a higher vibrational energy level.
Figure A3 An atomic absorption spectrum, showing certain frequencies missing.

A MODERN ANALYTICAL CHEMISTRY 4CHEMISTRY FOR THE IB DIPLOMA © CAMBRIDGE UNIVERSITY PRESS 20114 CHEMISTRY FOR THE IB DIPLOMA © CAMBRIDGE UNIVERSITY PRESS 2011A MODERN ANALYTICAL CHEMISTRY
A3 Infrared spectroscopy
IntroductionEven at absolute zero, atoms in a molecule are vibrating relative to each other. Just as the electrons in an atom or molecule can exist only in certain energy levels (the energy of an electron is quantised) the vibrational energy of a molecule is quantised. This means that the vibrational energy of a molecule can take only certain allowed values and not any value. Thus a molecule can exist, for instance, in either the level with vibrational energy V1 or that with V2. A molecule can absorb a certain frequency of infrared radiation to move it from a lower vibrational energy level to a higher one. In the higher energy level, the molecule vibrates more violently, i.e. with greater amplitude.
Diatomic moleculesIn order for a molecule to be able to absorb infrared radiation, when it vibrates there must be a change in bond polarity or, more precisely, dipole moment. Polar molecules constitute a dipole – two charges separated from each other (see Chapter 3, page 119 in the Coursebook).
The size of the dipole moment depends on the sizes of the partial charges and on the distance between them. The larger the distance between the charges, the larger the dipole moment. Thus, as an H–Cl molecule vibrates, the dipole moment increases and decreases (Figure A4). This means that an H–Cl molecule is able to absorb infrared (IR) radiation and we say that it is IR active.
Learning objectives
• Explain why certain molecules can absorb infrared radiation
• Work out the bonds present in a molecule from the infrared spectrum
• Describe how a double beam infrared spectrometer works
dipole moment decreases dipole moment increases
bond length decreases bond length increases
Hδ+ δ –
CI Hδ+ δ –
CIHδ+ δ –
CI
Thus, if infrared radiation is passed through a sample of hydrogen chloride, radiation of wavenumber approximately 2900 cm−1 is absorbed.
However, a chlorine molecule, Cl2, cannot absorb infrared radiation to promote it to a higher vibrational energy level, as the Cl2 molecule is non-polar and the vibration of the molecule does not involve any change in dipole moment. Cl2 is said to be IR inactive.
Triatomic moleculesTriatomic molecules are more complicated than diatomic ones, as they are able to vibrate in di� erent ways. There are two main types of vibrational mode: stretching (bond lengths change) and bending (bond angles change). The molecule can stretch in two di� erent ways – either both bond lengths can increase and decrease together (symmetric stretch) or one gets shorter as the other gets longer (asymmetric stretch). The vibrational modes for a bent triatomic molecule are shown in Figure A5.
Figure A4 The vibration of an H–Cl molecule.
The vibrations of a molecule are often thought about by analogy to two masses joined by a spring.
A diatomic molecule can absorb infrared radiation only if it is polar.

A MODERN ANALYTICAL CHEMISTRY 5CHEMISTRY FOR THE IB DIPLOMA © CAMBRIDGE UNIVERSITY PRESS 2011
The vibrational modes may also be shown as illustrated in Figure A6.Only vibrational modes that involve a change in dipole moment are IR active. For molecules such as H2O and SO2, which are polar, all three vibrational modes are IR active, as they all involve a change in dipole moment:
symmetric stretch
asymmetric stretch
bend
Figure A5 Vibrational modes of a bent triatomic molecule. All types of vibration are occurring at the same time.
symmetric stretch
asymmetric stretch
bend
Figure A6 The types of vibrational mode in a bent triatomic molecule.
symmetric stretch
dipole moment smalleras atoms closer together dipole moment larger
as atoms further apart
direction of dipole moment changesas the molecule becomes more polarin one direction or the other
Molecule becomes less polaras it becomes more linear.The dipoles cancel out in thehorizontal direction.The linearmolecule would be non-polar.
asymmetric stretch
bend
H
H
H H H H
H
H H HH H
δ+ δ+
δ+
H H HH Hδ+
Hδ+ δ+
δ+ δ+δ+
δ+ δ+ δ+ δ+
δ+
δ+
δ+ δ+
δ+
δ –
δ –
δ – δ – δ –
δ – δ –
δ – δ –
O
O O O
OO O
O O
These molecules therefore each absorb infrared radiation at three distinct frequencies, corresponding to the energy to excite the molecule to a higher vibrational energy level for each vibrational mode.
A MODERN ANALYTICAL CHEMISTRY 6CHEMISTRY FOR THE IB DIPLOMA © CAMBRIDGE UNIVERSITY PRESS 20116 CHEMISTRY FOR THE IB DIPLOMA © CAMBRIDGE UNIVERSITY PRESS 2011A MODERN ANALYTICAL CHEMISTRY
bond lengths decrease bond lengths increase
dipoles cancel
dipole moment remains zero
δ+δ – δ –O C O
δ+δ – δ –O C O
δ+δ – δ –O C O
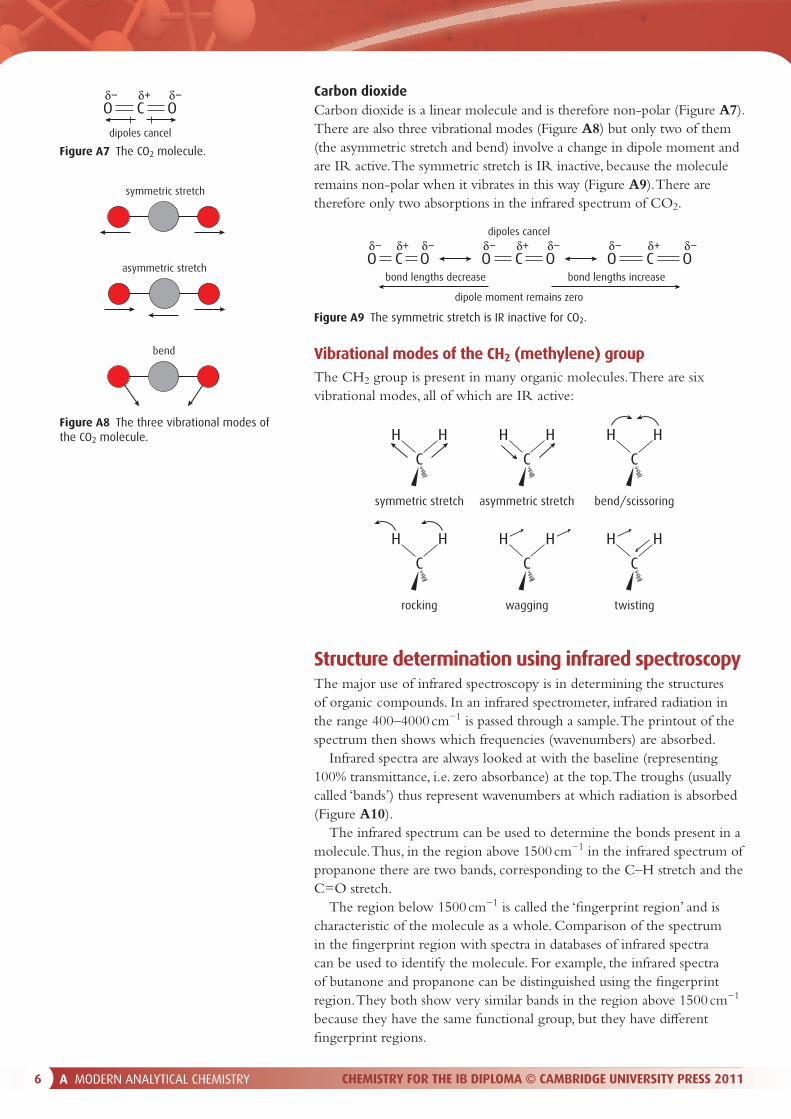
Carbon dioxideCarbon dioxide is a linear molecule and is therefore non-polar (Figure A7). There are also three vibrational modes (Figure A8) but only two of them (the asymmetric stretch and bend) involve a change in dipole moment and are IR active. The symmetric stretch is IR inactive, because the molecule remains non-polar when it vibrates in this way (Figure A9). There are therefore only two absorptions in the infrared spectrum of CO2.
Figure A9 The symmetric stretch is IR inactive for CO2.
C
symmetric stretch
H H
C
asymmetric stretch
H H
C
bend/scissoring
H H
C
rocking
H H
C
wagging
H H
C
twisting
H H
Vibrational modes of the CH2 (methylene) groupThe CH2 group is present in many organic molecules. There are six vibrational modes, all of which are IR active:
asymmetric stretch
bend
symmetric stretch
Figure A8 The three vibrational modes of the CO2 molecule.
dipoles cancel
δ+δ – δ –O C O
Figure A7 The CO2 molecule.
Structure determination using infrared spectroscopyThe major use of infrared spectroscopy is in determining the structures of organic compounds. In an infrared spectrometer, infrared radiation in the range 400–4000 cm−1 is passed through a sample. The printout of the spectrum then shows which frequencies (wavenumbers) are absorbed.
Infrared spectra are always looked at with the baseline (representing 100% transmittance, i.e. zero absorbance) at the top. The troughs (usually called ‘bands’) thus represent wavenumbers at which radiation is absorbed (Figure A10).
The infrared spectrum can be used to determine the bonds present in a molecule. Thus, in the region above 1500 cm−1 in the infrared spectrum of propanone there are two bands, corresponding to the C–H stretch and the C=O stretch.
The region below 1500 cm−1 is called the ‘� ngerprint region’ and is characteristic of the molecule as a whole. Comparison of the spectrum in the � ngerprint region with spectra in databases of infrared spectra can be used to identify the molecule. For example, the infrared spectra of butanone and propanone can be distinguished using the � ngerprint region. They both show very similar bands in the region above 1500 cm−1 because they have the same functional group, but they have di� erent � ngerprint regions.

A MODERN ANALYTICAL CHEMISTRY 7CHEMISTRY FOR THE IB DIPLOMA © CAMBRIDGE UNIVERSITY PRESS 2011
We are usually interested in identifying the bonds/functional groups in an organic molecule. To a good approximation the various bonds in a molecule can be considered to vibrate independently of each other. The wavenumbers at which some bonds vibrate are shown in Table A2.
Bond Functional group Characteristic range of
wavenumber / cm−1
C–Cl chloroalkane 600–800
C–O alcohol, ether, ester, carboxylic acid 1000–1300
C=C alkene 1610–1680
C=O aldehyde, ketone, carboxylic acids, ester 1700–1750
C=−C alkyne 2100–2260
O–H hydrogen bonded in carboxylic acids 2400–3400
C–H alkane, alkene, arene 2840–3100
O–H hydrogen bonded in alcohols, phenols 3200–3600
N–H primary amine 3300–3500
Table A2 The characteristic range of wavenumbers at which some bonds vibrate.
We can use an infrared spectrum to identify the bonds present in a molecule but cannot always distinguish between functional groups. For example, using Table A2, we could identify the presence of C=O in a molecule but would not be able to distinguish between an aldehyde and a ketone.
Consider the infrared spectrum of butanoic acid, shown in Figure A11. In order to identify the bonds present in the molecule we � rst of all look at the region above 1500 cm−1.
We now need to match up the wavenumbers of bands in the spectrum with the wavenumbers given in Table A2. We can identify the C=O stretch, as this absorption band occurs in the 1700–1750 cm−1 region. The very broad absorption band between about 2400 and 3400 cm−1 is due to the O–H stretch in carboxylic acids and is very characteristic of those molecules. The functional group of a carboxylic acid contains a C–O bond, and therefore we should now look in the � ngerprint region to con� rm the presence of an absorption in the region 1000–1300 cm−1,
Examiner’s tipA table of infrared stretching frequencies is given in the IBO Chemistry Data booklet. The values in that table di� er slightly from the ones give here – you should use the ones in the data booklet for the examination.
The precise wavenumber of a vibration for a particular functional group depends on the atoms adjacent to a particular bond. Thus, C=O in a ketone has a slightly di� erent stretching frequency to C=O in an ester.
C
HOH
H
H H
C H
C C
C O
H
% T
rans
mitt
ance
Wavenumber/cm–1
fingerprint region
4000 3000 2000 10001500
100
0
Figure A10 The infrared spectrum of propanone.

A MODERN ANALYTICAL CHEMISTRY 8CHEMISTRY FOR THE IB DIPLOMA © CAMBRIDGE UNIVERSITY PRESS 20118 CHEMISTRY FOR THE IB DIPLOMA © CAMBRIDGE UNIVERSITY PRESS 2011A MODERN ANALYTICAL CHEMISTRY
which is, indeed, the case. If there were no band in this region, we would have to review our hypothesis that the molecule is a carboxylic acid.
The region below 1500 cm−1 contains many absorptions due to C–C bonds and C–H bonds and is di� cult to interpret. We usually look only at the � ngerprint region to con� rm the presence of a particular vibration once we have a good idea of the structure of the molecule. For example, a band in the 1000–1300 cm−1 region does not con� rm the presence of a C–O in a molecule, but the absence of a band in this region means that C–O is not present. For example, in the IR spectrum of propanone (Figure A10 on page 7) there are peaks in the 1000–1300 cm−1 region but no C–O.
The infrared spectrum of propan-1-ol is shown in Figure A12.
% T
rans
mitt
ance
Wavenumber/cm–1
100
1300–1000
03000 2000 10001500
C OC H
O H
CH
H H
H
C C
H
Hpropan-1-ol
H
O
H
Again, by comparison of the bands with the values in Table A2, we can identify O–H (about 3350 cm−1) and C–H (about 2900–3000 cm−1) bonds. A C–O bond should also be present, and we can see that there is a band in the region 1000–1300 cm−1.
Figure A12 The infrared spectrum of propan-1-ol.
C O
% T
rans
mitt
ance
Wavenumber/cm–1
very broad O–H peak
characteristic ofcarboxylic acids
3000 2000 10001500
901750–1700 1300–1000
0
C O
Figure A11 The infrared spectrum of butanoic acid.
The C–H stretch also occurs in the region around 3000 cm−1, but this is usually mostly obscured by the broad O–H absorption.
The broadness of the O–H band is due to hydrogen bonding between molecules. If the infrared spectrum is taken of a carboxylic acid in the gas phase, the O–H band is much narrower.
A MODERN ANALYTICAL CHEMISTRY 9CHEMISTRY FOR THE IB DIPLOMA © CAMBRIDGE UNIVERSITY PRESS 2011
mirror
rotating mirror(beam splitter)
detector
samplesource
monochromator
reference
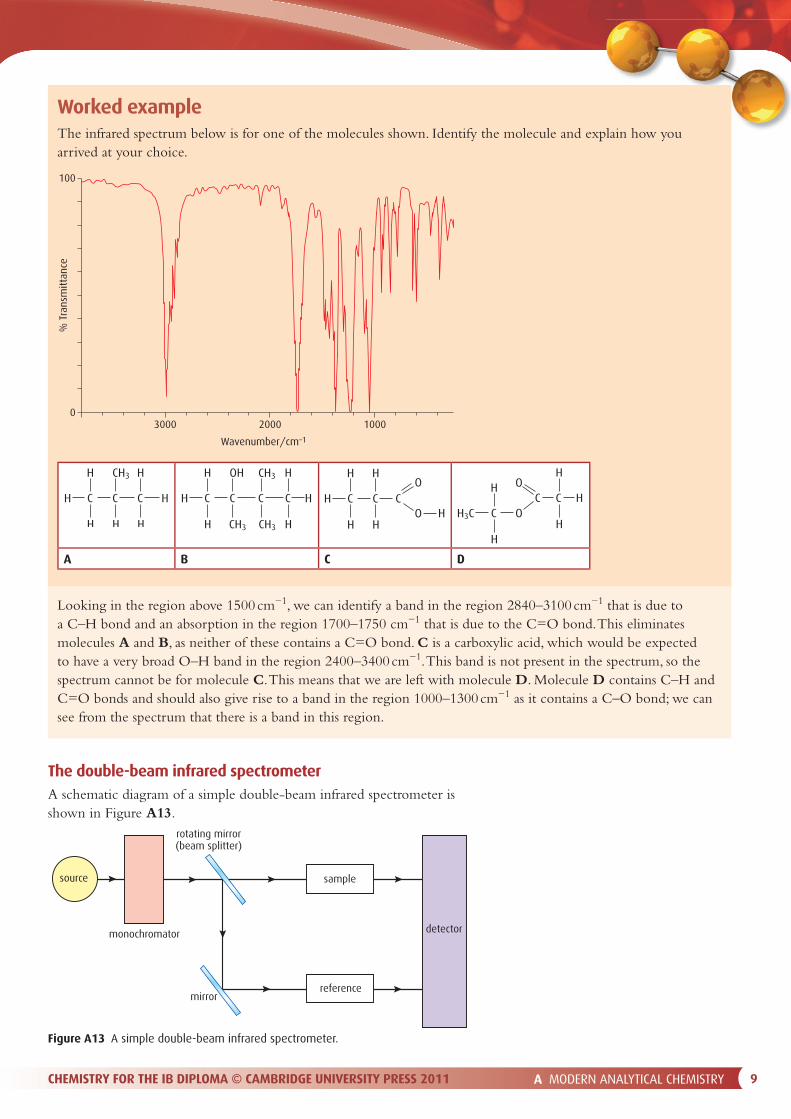
Figure A13 A simple double-beam infrared spectrometer.
Worked exampleThe infrared spectrum below is for one of the molecules shown. Identify the molecule and explain how you arrived at your choice.
A B C D
Looking in the region above 1500 cm−1, we can identify a band in the region 2840–3100 cm−1 that is due to a C–H bond and an absorption in the region 1700–1750 cm−1 that is due to the C=O bond. This eliminates molecules A and B, as neither of these contains a C=O bond. C is a carboxylic acid, which would be expected to have a very broad O–H band in the region 2400–3400 cm−1. This band is not present in the spectrum, so the spectrum cannot be for molecule C. This means that we are left with molecule D. Molecule D contains C–H and C=O bonds and should also give rise to a band in the region 1000–1300 cm−1 as it contains a C–O bond; we can see from the spectrum that there is a band in this region.
The double-beam infrared spectrometerA schematic diagram of a simple double-beam infrared spectrometer is shown in Figure A13.
% T
rans
mitt
ance
Wavenumber/cm–1
3000 2000 1000
100
0
CH H
H
H
C C
CH3
HH
H
C HH
H
H
C C C
H
H
OH
CH3 CH3
CH3
CH
H
H
H
H
C CHO
O
CH3C
H
H
O
OC C H
H
H

A MODERN ANALYTICAL CHEMISTRY 10CHEMISTRY FOR THE IB DIPLOMA © CAMBRIDGE UNIVERSITY PRESS 201110 CHEMISTRY FOR THE IB DIPLOMA © CAMBRIDGE UNIVERSITY PRESS 2011A MODERN ANALYTICAL CHEMISTRY
The source of radiation is a hot coil of nichrome wire or a heated silicon carbide rod, which emit radiation over the whole frequency range of the instrument. The monochromator produces infrared radiation of a particular frequency (narrow range of frequencies) so that each frequency in turn can be passed through the sample. The beam is split into two of equal intensity by the rotating mirror.
One beam passes through the sample (e.g. substance dissolved in solvent) and the other beam passes through the reference cell (e.g. just the solvent). The detector converts infrared radiation to an electrical signal and compares the reference beam with that through the sample (i.e. subtracts the reference signal from that from the sample).
The infrared beam is passed alternately through the reference and sample.
The detector could be a thermocouple or a pyroelectric detector.
Test yourself1 Which of the following molecules will absorb
infrared radiation?a O2 d H2 g H2Sb HCN e CO h N2
c HF f CO2 i CCl42 Suggest the number of IR active bands in the
infrared spectrum of each of the following gaseous molecules: a HCl b BeCl2 c OF2
3 Which of the following molecules will have an infrared band in the 1700–1750 cm−1 region?a but-2-ene e CH3COOCH3
b propanal f CH3CH2CH(OH)CH3
c CH3COCH3 g CH3CH2COOHd CH3CH2CH2CH2Cl
4 Predict the infrared bands and the bonds responsible for them in the region above 1500 cm−1 for the following molecules:a propane c propeneb propan-2-ol d propanoic acid
An advantage of using a double-beam instrument over a single-beam one is that, if the substance we are interested in is dissolved in a solvent, the spectrum of the solvent (in the reference cell) can be subtracted from that of the sample dissolved in the solvent to leave the spectrum of our substance.
A4 Mass spectrometry
Mass spectrometryWe have already discussed the basic principles of mass spectrometry on pages 59–61 in the Coursebook There we were more interested in its use to detect the di� erent isotopes present in a sample of an element. Here we will discuss the mass spectra of molecules.
The sample is injected into a mass spectrometer, where it is bombarded with high-energy electrons to produce positive ions. Thus, when a sample of propane (C3H8) is introduced into a mass spectrometer and bombarded with high-energy electrons, the C3H8
+ ion is produced:
C3H8(g) + e− → C3H8+(g) + 2e−
high-energy electron molecular ion
The ion produced when just a single electron is removed from the molecule is called the molecular ion, M+.
Learning objectives
• Determine the relative molecular mass of a molecule from its mass spectrum
• Analyse fragmentation patterns in a mass spectrum
Mass spectrometry can be used to determine the relative molecular mass of a compound.

A MODERN ANALYTICAL CHEMISTRY 11CHEMISTRY FOR THE IB DIPLOMA © CAMBRIDGE UNIVERSITY PRESS 2011
The peak in the spectrum at the highest mass (m/z value) corresponds to the molecular ion and gives us the relative molecular mass of the molecule (Figure A14).
m/z
20
CH3+
C3H8+
molecular ion
10 40 44 5030
C2H5+100
80
60
40
Rela
tive
abun
danc
e /
%
20
0
Figure A14 The mass spectrum of propane.
We can thus deduce from this mass spectrum that the relative molecular mass of the compound is 44. It is important to note that the molecular ion peak is not necessarily the biggest peak in terms of abundance, but it is at the highest mass.
It can be seen from the mass spectrum of propane in Figure A14 that there are lots of peaks other than the molecular ion peak. These peaks are called the fragmentation pattern and arise because the molecule can break apart into smaller fragments when it is bombarded by high-energy electrons, e.g.:
C3H8+ → C2H5
+ + CH3
A positive ion produced in the fragmentation process will produce a peak in the mass spectrum. There is thus a peak at m/z 29 in the spectrum of propane due to the C2H5
+ ion. Only positive ions can pass through the mass spectrometer, so the CH3 radical produced in this process does not give rise to a peak. There is, however, a peak at m/z 15, which is due to CH3
+, which is produced in a di� erent fragmentation process.
Fragmentation patternsThe fragmentation pattern can provide information about the structure of a molecule.
We can think of fragmentation in two ways: either we can look at the ion formed when the molecular ion breaks apart or we can look at the group lost from the molecular ion. Consider the mass spectrum of propanoic acid shown in Figure A15. The molecular ion peak occurs at m/z = 74, so the relative molecular mass is 74.
There is a peak in the spectrum at m/z = 57, which corresponds to the loss of OH (mass 17) from the molecular ion. The fragment responsible for the peak at m/z = 57 is thus (C2H5COOH+ − OH), that is C2H5CO+.
The peak at 45 corresponds to the loss of 29 from the molecular ion. A group with mass 29 is C2H5, and therefore we can deduce that C2H5 is
The spectrum may also contain a peak with mass one more than the molecular ion (an (M + 1)+ peak). This is due to the presence of an atom of 13C in the molecule. 13C is an isotope of carbon (natural abundance 1.1%).
Molecules can undergo fragmentation in many di� erent ways and also undergo rearrangements as they fragment.
Only positive ions give a peak in the mass spectrum.
Examiner’s tipThe fragmentation pattern in a mass spectrum is usually very complicated and you should not try to identify every single peak.
The mass of an electron is negligible.
The mass spectrometer sorts molecules according to their mass : charge (m/z or m/e) ratio. We will assume here that only 1+ ions are formed so that the mass : charge ratio is the same as the mass.

A MODERN ANALYTICAL CHEMISTRY 12CHEMISTRY FOR THE IB DIPLOMA © CAMBRIDGE UNIVERSITY PRESS 201112 CHEMISTRY FOR THE IB DIPLOMA © CAMBRIDGE UNIVERSITY PRESS 2011A MODERN ANALYTICAL CHEMISTRY
lost from C2H5COOH+ to form this peak. The peak at 45 is thus due to the COOH+ ion.
The peak at 29 is due to the C2H5+ ion, which is formed by loss of
COOH from C2H5COOH+.The formulas of some common fragment ions are shown in Table A3.
Fragment Mass of fragment ion Possible inference
CH3+ 15
OH+ 17 alcohol/carboxylic acid
C2H5+ / CHO+ 29
CH3O+ / CH2OH+ 31 methyl ester / ether / primary alcohol
CH3CO+ 43 ketone with C=O on second C
COOH+ 45 carboxylic acid
C6H5+ 77 arene
Table A3 Formulas of some common fragment ions.
Peaks may also be formed when the fragments are lost from the molecule. In that case the m/z value of the peak in the spectrum will be: relative molecular mass (Mr) − the mass of the fragment.
Fragment lost Mass of fragment
remaining
Possible inference
CH3 Mr − 15
OH Mr − 17 alcohol/carboxylic acid
C2H5 / CHO Mr − 29
CH3O / CH2OH Mr − 31 methyl ester / ether / primary alcohol
COOH Mr − 45 carboxylic acid
The mass spectrum of chloroethane is shown in Figure A16. The relative molecular mass of chloroethane may be calculated as 64.5, but it can be seen that there is no peak at 64.5. The relative atomic mass of Cl as 35.5 arises because Cl has two isotopes: 35Cl and 37Cl (35Cl is three times as abundant). Some of the chloroethane molecules will contain 35Cl and
m/z
1529
loss of C2H5
–29
loss of OHgroup
–17
loss of COOH
–45
CH3+
C2H5CO+
M+
C2H5COOH+
molecular ion
0 604530
C2H5+
COOH+
57 74
due to 13Catom present(M + 1)+ peak
CCO
O HC
H
H
H
H
H
100
80
60
40
Rela
tive
abun
danc
e /
%
20
0
Figure A15 The mass spectrum of propanoic acid.
Examiner’s tipGroups lost from the molecular ion do not need a positive charge, but any species that forms a peak in the mass spectrum must have a positive charge.

A MODERN ANALYTICAL CHEMISTRY 13CHEMISTRY FOR THE IB DIPLOMA © CAMBRIDGE UNIVERSITY PRESS 2011
some will contain 37Cl atoms, and thus we get molecular ion peaks at 64 (C2H5
35Cl+) and 66 (C2H537Cl+).
Worked exampleThe mass spectrum below is for a compound, X, that contains carbon, hydrogen and oxygen. The infrared spectrum of X has a band at 1725 cm−1.
a What is the relative molecular mass of X?b Given that X contains two O atoms, suggest the molecular formula for X.c Identify which group is lost to form the peak marked B.d Suggest the identity of the species responsible for the peak marked A.e Deduce the structural formula of X.
a From the mass spectrum, the peak at highest m/z value is the molecular ion peak. Therefore the relative molecular mass is 136.
b The only possible molecular formula containing two O atoms that adds up to 136 is C8H8O2.
m/z
2029
loss of CH3
–15
loss of CH3
–15
C2H5 Cl+37
C2H5 Cl+35
10 50 604030
C2H5+
6466
ClCC
H
H
H
H
H
100
80
60
40
Rela
tive
abun
danc
e /
%
20
0
Figure A16 The mass spectrum of chloroethane.
m/z400 80
A
B
77 105 136120 160
100
80
60
40
Rela
tive
abun
danc
e /
%
20
0

A MODERN ANALYTICAL CHEMISTRY 14CHEMISTRY FOR THE IB DIPLOMA © CAMBRIDGE UNIVERSITY PRESS 201114 CHEMISTRY FOR THE IB DIPLOMA © CAMBRIDGE UNIVERSITY PRESS 2011A MODERN ANALYTICAL CHEMISTRY
c Peak B occurs at m/z = 105. 136 − 105 = 31. We must then think of combinations of C, H and O that add up to 31. The only possible combination is CH3O, so this group is lost from the molecular ion to produce peak B.
d Peak A occurs at m/z = 77. The fragment that is responsible for this is C6H5+.
e The peak at 77 indicates that the compound contains a benzene ring substituted at one position. The loss of 31 from the group suggests that it contains the –O–CH3 group. The presence of a band at 1725 cm−1 in the infrared spectrum suggests (checking Table A2) that the molecule contains a C=O group. The only possible molecule that contains all these elements is:
C2H7 also adds up to 31, but the maximum number of Hs for 2C atoms is 6!
C C HO
O H
H
Test yourself5 The molecular ion peaks for a series of compounds
containing carbon, hydrogen and oxygen occur only at the values shown below. Suggest possible molecular formulas for the compounds:a 44 b 60 c 72 d 88
6 The following peaks occur in the mass spectra of compounds containing C, H and O. Suggest possible identities for the fragments responsible.a 15 c 29 e 43 g 59b 28 d 31 f 45 h 77
A5 Nuclear magnetic resonance spectroscopyA hydrogen nucleus has a property called spin. A spinning nucleus in a magnetic � eld acts like a tiny bar magnet. This bar magnet can either align itself with (lower energy) or against (higher energy) an applied magnetic � eld. Energy in the radio frequency range of the electromagnetic spectrum can be used to cause the H nucleus to change its orientation relative to the applied magnetic � eld. It is these changes in energy state that occur in nuclear magnetic resonance (NMR) spectra. In NMR spectra, we are thus looking at the absorptions due to 1H nuclei (usually just called protons), and this technique provides information about the environments in which these H nuclei are in molecules.
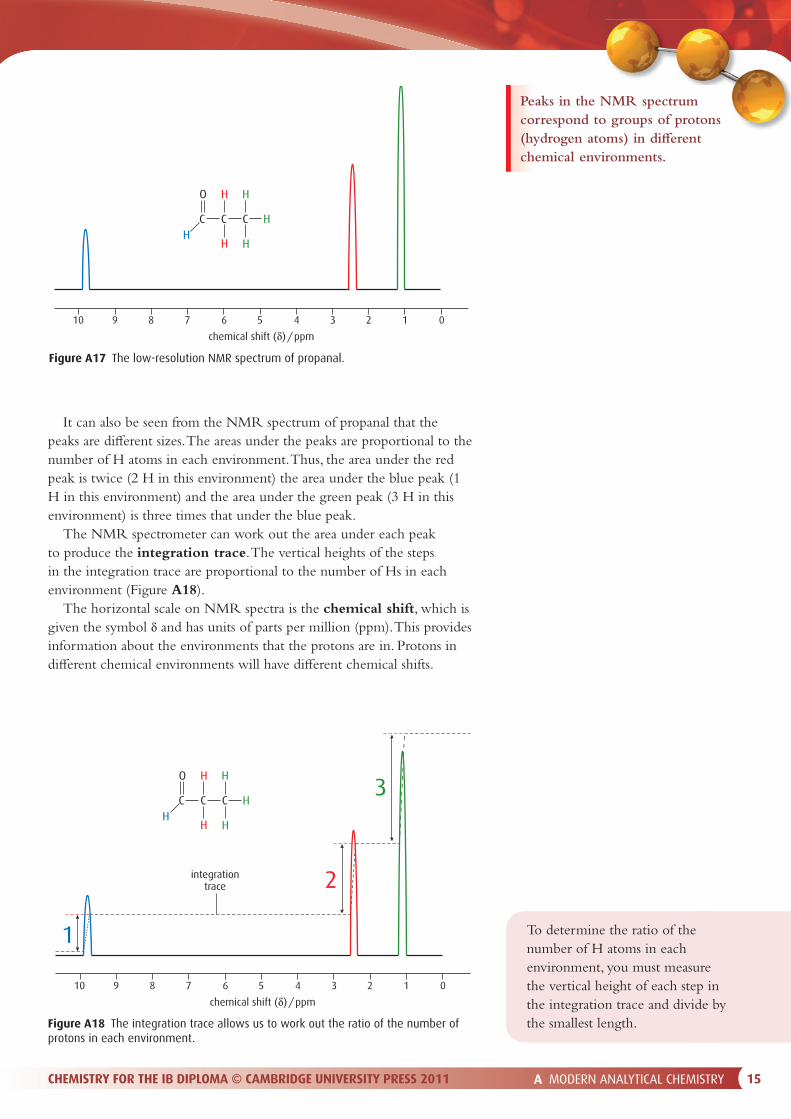
The low-resolution NMR spectrum of propanal is shown in Figure A17. First of all, it can be seen that there are three peaks in the spectrum. These three peaks correspond to three di� erent chemical environments for the protons (1H nuclei) in the molecule. The protons in each environment are coloured di� erently in Figure A17. H atoms joined to the same C atom are said to be chemically equivalent (or just ‘equivalent’).
Learning objectives
• Determine the structure of a compound from its NMR spectrum
• Describe how NMR is used in body scanners
Only nuclei with either an odd value for mass number and/or atomic number have the property of spin.
In all the discussion in this section ‘proton’ refers to the nucleus of a hydrogen (1H) atom.
A MODERN ANALYTICAL CHEMISTRY 15CHEMISTRY FOR THE IB DIPLOMA © CAMBRIDGE UNIVERSITY PRESS 2011
It can also be seen from the NMR spectrum of propanal that the peaks are di� erent sizes. The areas under the peaks are proportional to the number of H atoms in each environment. Thus, the area under the red peak is twice (2 H in this environment) the area under the blue peak (1 H in this environment) and the area under the green peak (3 H in this environment) is three times that under the blue peak.
The NMR spectrometer can work out the area under each peak to produce the integration trace. The vertical heights of the steps in the integration trace are proportional to the number of Hs in each environment (Figure A18).
The horizontal scale on NMR spectra is the chemical shift, which is given the symbol δ and has units of parts per million (ppm). This provides information about the environments that the protons are in. Protons in di� erent chemical environments will have di� erent chemical shifts.
C
HO H
HHC C
HH
10 9 8 7 6 5 4 3 2 1 0
chemical shift (δ) / ppm
Figure A17 The low-resolution NMR spectrum of propanal.
C
HO H
H
1
H3
C C
HH
2
10 9 8 7 6 5 4 3 2 1 0
chemical shift (δ) / ppm
integrationtrace
Figure A18 The integration trace allows us to work out the ratio of the number of protons in each environment.
To determine the ratio of the number of H atoms in each environment, you must measure the vertical height of each step in the integration trace and divide by the smallest length.
Peaks in the NMR spectrum correspond to groups of protons (hydrogen atoms) in di� erent chemical environments.
A MODERN ANALYTICAL CHEMISTRY 16CHEMISTRY FOR THE IB DIPLOMA © CAMBRIDGE UNIVERSITY PRESS 201116 CHEMISTRY FOR THE IB DIPLOMA © CAMBRIDGE UNIVERSITY PRESS 2011A MODERN ANALYTICAL CHEMISTRY
Chemical shift values are measured relative to tetramethylsilane (TMS): HL
C
C
C
SiH H
H
HH
HH
H
H
H
C
H
H
The protons in TMS are assigned a chemical shift of 0.00 ppm, and chemical shifts are measured relative to this.
TMS was chosen as the standard as it has 12 protons all in the same environment (therefore it gives a strong signal when only a small amount is added), and the chemical shift of the protons in TMS is at a lower value than the protons in virtually all organic molecules (therefore TMS � xes the lower end of the scale). The position of the chemical shift is also such that it is well away from the chemical shifts of protons in organic molecules, so the signal due to TMS does not overlap with the signals of protons in which we are interested.
The number of different environments for H and the relative numbers of H atoms in each environmentTo work out the number of environments for H, you must consider whether or not the molecule is symmetrical. If the molecule is not symmetrical, H atoms on each di� erent atom will be in di� erent chemical environments.
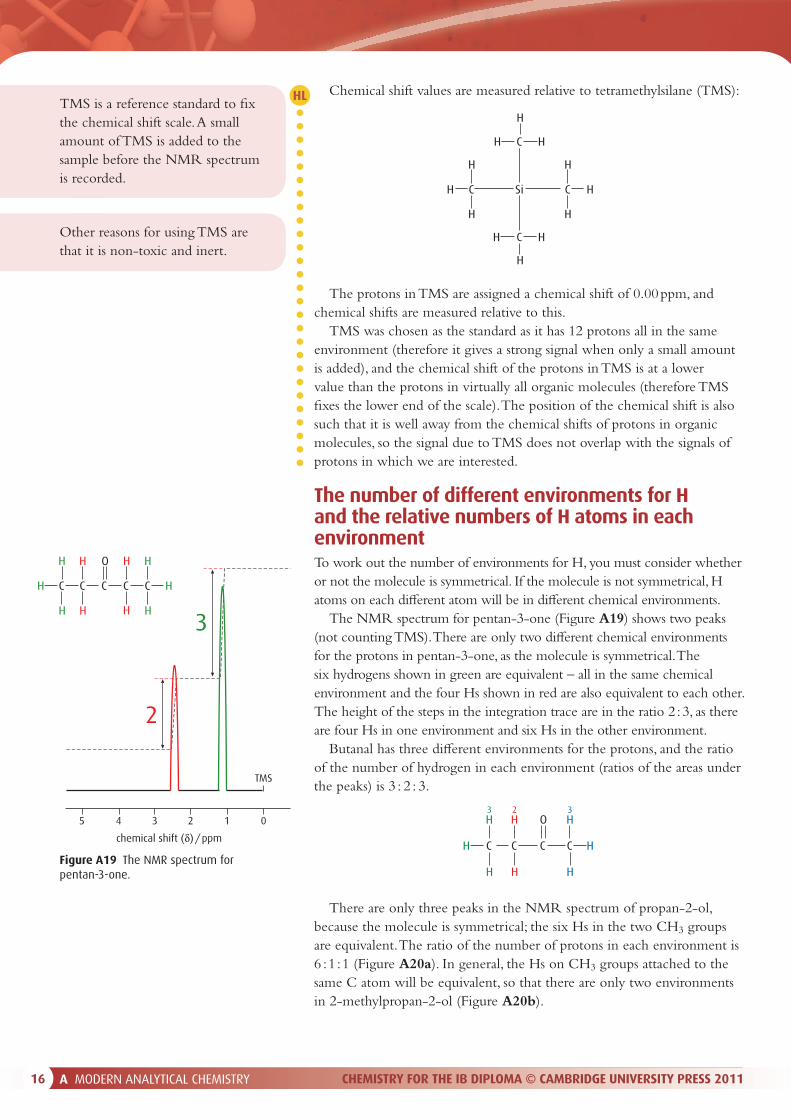
The NMR spectrum for pentan-3-one (Figure A19) shows two peaks (not counting TMS). There are only two di� erent chemical environments for the protons in pentan-3-one, as the molecule is symmetrical. The six hydrogens shown in green are equivalent – all in the same chemical environment and the four Hs shown in red are also equivalent to each other. The height of the steps in the integration trace are in the ratio 2 : 3, as there are four Hs in one environment and six Hs in the other environment.
Butanal has three di� erent environments for the protons, and the ratio of the number of hydrogen in each environment (ratios of the areas under the peaks) is 3 : 2 : 3.
TMS is a reference standard to � x the chemical shift scale. A small amount of TMS is added to the sample before the NMR spectrum is recorded.
Other reasons for using TMS are that it is non-toxic and inert.
C
HO H
H
3
C C
H
C
H
H
C
H
H
H
H
2
5 4 3 2 1 0
TMS
chemical shift (δ) / ppm
Figure A19 The NMR spectrum for pentan-3-one.
C HH
H
H
H O
H
C C C
H3 2 3
H
There are only three peaks in the NMR spectrum of propan-2-ol, because the molecule is symmetrical; the six Hs in the two CH3 groups are equivalent. The ratio of the number of protons in each environment is 6 : 1 : 1 (Figure A20a). In general, the Hs on CH3 groups attached to the same C atom will be equivalent, so that there are only two environments in 2-methylpropan-2-ol (Figure A20b).

A MODERN ANALYTICAL CHEMISTRY 17CHEMISTRY FOR THE IB DIPLOMA © CAMBRIDGE UNIVERSITY PRESS 2011
C
HO
Ha
HH C C
H
H
H H
C
H
HC
Hb
HH O C
H
HH
HH
C
Figure A20 (a) Propan-2-ol; (b) 2-methylpropan-2-ol.
C HH
H
H
CI
H
C C
CI
H
CH
H
H
O
H
C C
H
H
H
H
H
HC
CH
H
H
CI
H
C C
C
H
H
H
HC
H
H
H
Test yourself7 Suggest the number of peaks and the ratio between the areas under the peaks in the
NMR spectrum of each of the following:
a b c
d e f
CCI
CI
H
HH
H
C C
H
H CH
H
H
HH
H
C C
H
H
O CH H
H
H
H
CH3
C C
CH2OH
H
CH C
O HCH3
CO C
HH
H
H
H
H C
O
CC O
H
H
H
C
C
H
H
H
H
H H
CH
H
H
HH
CH3
C C
H
H
H
O
H
C C
Some more examples are given here:
No. of different chemical
environments for H
Ratio of no. of H atoms
in each environment
3 3 : 1 : 2
5 3 : 1 : 1 : 2 : 3
4 3 : 1 : 1 : 6

A MODERN ANALYTICAL CHEMISTRY 18CHEMISTRY FOR THE IB DIPLOMA © CAMBRIDGE UNIVERSITY PRESS 201118 CHEMISTRY FOR THE IB DIPLOMA © CAMBRIDGE UNIVERSITY PRESS 2011A MODERN ANALYTICAL CHEMISTRY
The chemical shiftSome typical values for the chemical shifts of protons in di� erent environments are given in Table A4.
The values in Table A4 are approximate and can vary depending on other groups attached. For instance, it makes a di� erence how many other Hs are attached to the C atom to which the H we are interested in is attached. In most cases we assume that the ranges given in the table include all possibilities, and we just look at the environment of the proton rather than the number of Hs in that environment. Thus we can assume
Type of proton Chemical shift / ppm Comments
0.9–1.7 H on a carbon chain but not next to any other functional groups
2.0–2.5 H on a C next to C=O of an ester
2.1–2.7 H on a C next to C=O of an aldehyde or ketone
2.3–3.0 H on a C attached to a benzene ring
X is a halogen
3.2–4.4 H attached to a C that also has a halogen atom attached
3.3–3.7 H attached to a C that has an O attached
3.7–4.8 H on a C next to C–O of an ester
0.5–5.0 H attached to O in an alcohol
6.7–8.2 H attached to a benzene ring
9.4–10.0 H attached to C=O of an aldehyde
9.0–13.0 H on an O in a carboxylic acid
Table A4 Values for the chemical shifts of protons in different environments.
H
C
R O C
O
C H
O
CCR
H
H
C
X
H
COR
O
COR C
H
OR H
H
O
CR H
O
CR O H
C
H
Examiner’s tipThe representation of the groups and the chemical shifts here are di� erent to the IBO Chemistry Data booklet. You should practise using the ones in the IBO Chemistry Data booklet as well.
Examiner’s tipChemical shift is only on the Higher Level syllabus, but as a question has appeared on it in a Standard Level paper, it would be safer for Standard Level students to read through this section too.
HL
A MODERN ANALYTICAL CHEMISTRY 19CHEMISTRY FOR THE IB DIPLOMA © CAMBRIDGE UNIVERSITY PRESS 2011
that the chemical shift of an H on a C next to the C=O of an aldehyde or ketone comes in the range 2.1–2.7, no matter how many other Hs are attached:
H
O
C
H
H
C
δ = 2.2 ppm δ = 2.1 ppm
δ = 2.4 ppm
H H
H
H
C
H
H
C
O
C
H
H
C Hδ = 2.1 ppm
δ = 2.6 ppm
H
H
H
C
H
H
C
CH H
O
C
H
H
C H
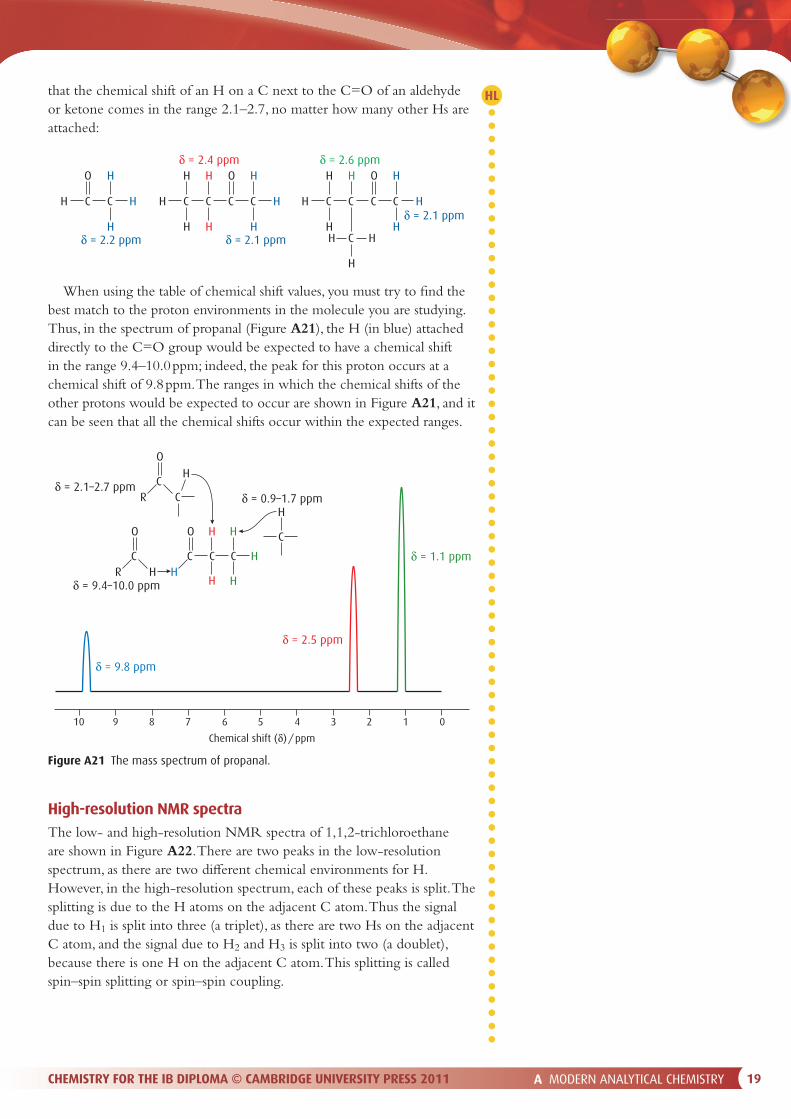
When using the table of chemical shift values, you must try to � nd the best match to the proton environments in the molecule you are studying. Thus, in the spectrum of propanal (Figure A21), the H (in blue) attached directly to the C=O group would be expected to have a chemical shift in the range 9.4–10.0 ppm; indeed, the peak for this proton occurs at a chemical shift of 9.8 ppm. The ranges in which the chemical shifts of the other protons would be expected to occur are shown in Figure A21, and it can be seen that all the chemical shifts occur within the expected ranges.
C
HO H
H
δ = 9.8 ppm
δ = 2.5 ppm
δ = 1.1 ppm
δ = 9.4–10.0 ppm
δ = 0.9–1.7 ppmδ = 2.1–2.7 ppm
HC C
H
C
H
O
R HC
O
R CC
H
H
10 9 8 7 6 5 4 3 2 1 0
Chemical shift (δ) / ppm
High-resolution NMR spectraThe low- and high-resolution NMR spectra of 1,1,2-trichloroethane are shown in Figure A22. There are two peaks in the low-resolution spectrum, as there are two di� erent chemical environments for H. However, in the high-resolution spectrum, each of these peaks is split. The splitting is due to the H atoms on the adjacent C atom. Thus the signal due to H1 is split into three (a triplet), as there are two Hs on the adjacent C atom, and the signal due to H2 and H3 is split into two (a doublet), because there is one H on the adjacent C atom. This splitting is called spin–spin splitting or spin–spin coupling.
Figure A21 The mass spectrum of propanal.
HL

A MODERN ANALYTICAL CHEMISTRY 20CHEMISTRY FOR THE IB DIPLOMA © CAMBRIDGE UNIVERSITY PRESS 201120 CHEMISTRY FOR THE IB DIPLOMA © CAMBRIDGE UNIVERSITY PRESS 2011A MODERN ANALYTICAL CHEMISTRY
In general, if there are n protons on the adjacent atom, the signal for a particular proton will be split into (n + 1) peaks. Another way of saying this is that if the multiplicity of a peak is x, the number of H atoms on the adjacent atom is x − 1.
The NMR spectrum of chloroethane is shown in Figure A23. There are two sets of peaks in this spectrum of chloroethane, as there are two di� erent chemical environments for H. The total area under the peaks at δ = 1.5 ppm is greater than that under the peaks at δ = 3.5 ppm, as there are more protons in this environment. The signal at δ = 3.5 ppm is split into a quartet. A quartet consists of four peaks and therefore has a multiplicity of 4. 4 − 1 = 3, so we can deduce from the presence of a quartet that there are three H atoms on the adjacent C atom. The signal at δ = 1.5 ppm is split into a triplet. A triplet has a multiplicity of 3. 3 − 1 = 2, so there must be two H atoms on the adjacent carbon.
We sometimes talk about the multiplicity of a peak, i.e. the number of smaller peaks it is split into. The multiplicity of a triplet is 3 and that of a doublet is 2.
Splitting of the signal of a particular group of protons is due to the protons on adjacent (carbon) atoms.
C
CI
C
H12
H1
H2
H2
H2
3
4 3 2 1Chemical shift (δ) / ppm
quartet triplet
number of protonsin this environment
signal due to H2 split intoa triplet by H1
signal due to H1 split intoa quartet by H2
number of protonsin this environment
The intensities of the lines in the splitting pattern are given by Pascal’s triangle (Figure A24). Thus we talk about a 1 : 1 doublet (the areas under the peaks are equal) or a 1 : 2 : 1 triplet. A summary of the di� erent types of splitting patterns are shown in Table A5.
‘Rules’ for spin–spin coupling• Protons on the same atom (e.g. CH3, CH2) do not interact with each
other. They are chemically equivalent and behave as a group.
• Splitting generally only occurs with protons on adjacent atoms (for example, see Figure A25).
• Protons attached to O do not show or cause splitting; this is because the protons exchange with each other and with the solvent.
Figure A23 The NMR spectrum of chloroethane.
Examiner’s tipThe signal due to two Hs split into a quartet and that due to three Hs split into a triplet indicates the presence of an ethyl group in a molecule – well worth remembering!
1 3 3 1 quartet
triplet
doublet
singlet
1 2 1
1 1
1
Figure A24 Pascal’s triangle.
HL
Figure A22 The low- and high-resolution NMR spectra of 1,1,2-trichloroethane.
C
CICI
CI C
H1 H2
H3
6 5 4 3Chemical shift (δ) / ppm
low resolution
6 5 4 3Chemical shift (δ) / ppm
high resolution
triplet doublet
A MODERN ANALYTICAL CHEMISTRY 21CHEMISTRY FOR THE IB DIPLOMA © CAMBRIDGE UNIVERSITY PRESS 2011
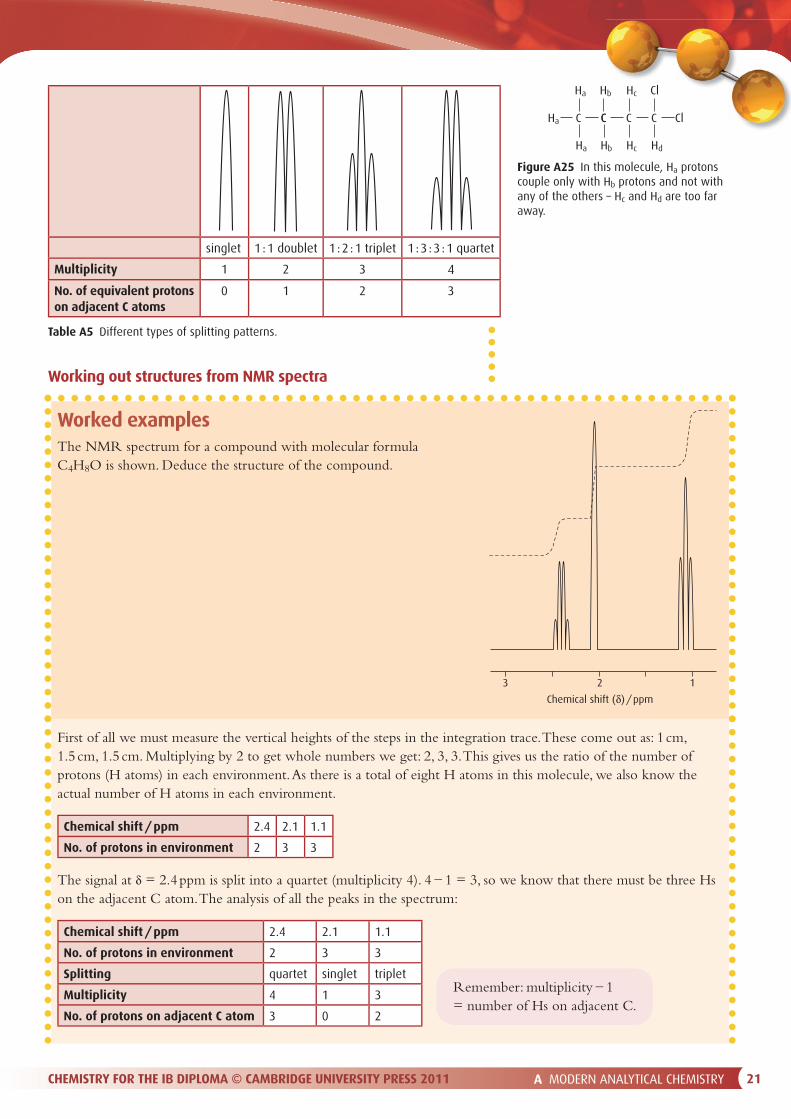
Worked examplesThe NMR spectrum for a compound with molecular formula C4H8O is shown. Deduce the structure of the compound.
First of all we must measure the vertical heights of the steps in the integration trace. These come out as: 1 cm, 1.5 cm, 1.5 cm. Multiplying by 2 to get whole numbers we get: 2, 3, 3. This gives us the ratio of the number of protons (H atoms) in each environment. As there is a total of eight H atoms in this molecule, we also know the actual number of H atoms in each environment.
Chemical shift / ppm 2.4 2.1 1.1
No. of protons in environment 2 3 3
The signal at δ = 2.4 ppm is split into a quartet (multiplicity 4). 4 − 1 = 3, so we know that there must be three Hs on the adjacent C atom. The analysis of all the peaks in the spectrum:
Chemical shift / ppm 2.4 2.1 1.1
No. of protons in environment 2 3 3
Splitting quartet singlet triplet
Multiplicity 4 1 3
No. of protons on adjacent C atom 3 0 2
Working out structures from NMR spectra
singlet 1 : 1 doublet 1 : 2 : 1 triplet 1 : 3 : 3 : 1 quartet
Multiplicity 1 2 3 4
No. of equivalent protons on adjacent C atoms
0 1 2 3
Table A5 Different types of splitting patterns.
3 2 1
Chemical shift (δ) / ppm
Remember: multiplicity − 1 = number of Hs on adjacent C.
CHa C
Ha
Ha
C
Hb
C
Hc
Hc
Cl
Cl
HdHb
C
Figure A25 In this molecule, Ha protons couple only with Hb protons and not with any of the others – Hc and Hd are too far away.

A MODERN ANALYTICAL CHEMISTRY 22CHEMISTRY FOR THE IB DIPLOMA © CAMBRIDGE UNIVERSITY PRESS 201122 CHEMISTRY FOR THE IB DIPLOMA © CAMBRIDGE UNIVERSITY PRESS 2011A MODERN ANALYTICAL CHEMISTRY
The peaks at δ = 2.4 ppm and δ = 1.1 ppm are caused by an ethyl group – signal due to 2Hs split by 3Hs on the adjacent C and signal due to 3Hs split by 2Hs on the adjacent C.
We know that there are four C atoms in the molecule but only three sets of peaks. There are also three Hs that have no Hs on the adjacent C. These two pieces of information together suggest that there is a C atom with no H atoms attached.
The molecular formula is C4H8O, which has two fewer H atoms than the alkane with four C atoms, so there must be a double bond (or a ring) in the molecule.
The only structure that � ts with all the information we have worked out is:
As a � nal check, we should try and match up the chemical shifts of the protons with the values given in Table A4:
All protons therefore have chemical shifts in the expected ranges.
The NMR spectrum for an ester with molecular formula C4H8O2 is shown. Deduce the structure of the compound.
H
H
H
C
H
Hquartet
triplet
singlet
C
O
C
H
H
C H
H
H
H
C
H
H
C
O
C
H
H
C
H
C H
O
CR O
H
O
CR O
H
δ = 2.1–2.7 ppm
δ = 2.1–2.7 ppm
δ = 0.9–1.7 ppmδ = 2.4 ppm
δ = 1.1 ppmδ = 2.1 ppm
1234
Chemical shift (δ) / ppm

A MODERN ANALYTICAL CHEMISTRY 23CHEMISTRY FOR THE IB DIPLOMA © CAMBRIDGE UNIVERSITY PRESS 2011
Following the procedure from the previous example we get:
Chemical shift / ppm 4.1 2.0 1.3
No. protons in environment 2 3 3
Splitting quartet singlet triplet
Multiplicity 4 1 3
No. protons on adjacent C atom 3 0 2
As in the previous example, there is an ethyl group present and a group of three H atoms with no Hs on the adjacent C. The only two possible esters that would have this splitting pattern are:
We can distinguish between these two possibilities using the chemical shift values. If we consider the singlets, we can use the values in Table A4 to predict the chemical shifts for these protons:
The singlet in our spectrum occurs at δ = 2.0 ppm, so our molecule is the � rst one, ethyl ethanoate:
H
H
H
C
H
H
C O
O
C CC
H
H
H H
H
H
C
H
H
C C
O
O C
H
H
H
H
H
H
C
H
H
C O
O
C C
H
H
H H
H
H
C
H
H
C C
O
O C
H
H
H
O
CO
CR
H O
CCR O
H
δ = 2.0–2.5 ppmδ = 3.7–4.8 ppm
H
H
H
C
H
H
C
O
O C
H
H
C
H
C H
O
CR O C
H
O
COR
C
H
δ = 2.0–2.5 ppm
δ = 3.7–4.8 ppm
δ = 4.1 ppm
δ = 0.9–1.7 ppm
δ = 1.3 ppmδ = 2.0 ppm
singlettriplet
quartet

A MODERN ANALYTICAL CHEMISTRY 24CHEMISTRY FOR THE IB DIPLOMA © CAMBRIDGE UNIVERSITY PRESS 201124 CHEMISTRY FOR THE IB DIPLOMA © CAMBRIDGE UNIVERSITY PRESS 2011A MODERN ANALYTICAL CHEMISTRY
The NMR spectra of two more molecules are shown in Table A6.
Molecular formula Spectrum Structural formula
C2H6O no splitting due to H on O
C3H8O signal at 4.0 ppm is a septet – split by six equivalent protons
Table A6 The NMR spectra of two molecules.
4 3
2
1
3
2 1Chemical shift (δ) / ppm
H
H
H
O C
H
H
C H
4 3
11
6
2 1Chemical shift (δ) / ppm
H
O
H
C C
H
H
H
H
H
C H
Notes on NMR spectraWhen a molecule is non-symmetrical and there are non-equivalent protons on both sides of a particular group, the spectrum becomes complex. For instance, in the spectrum of propan-1-ol (Figure A26), Hb are split by Ha and Hc. Depending on the strength of the coupling to each set of protons, the signal for Hb could either be described as a quartet of triplets or a triplet of quartets. This signal is very complicated, and it is di� cult to see the exact nature of the splitting. One way of describing the peak is as a complex multiplet.
For a molecule such as methylbenzene (Figure A27), the protons on the ring are not all equivalent, but because they are in very similar environments, unless a very high-resolution spectrum is generated, they are likely to show up as just one peak in the NMR spectrum.
The presence of very electronegative atoms in a molecule can cause chemical shifts to move to higher values. The closer the protons are to the very electronegative atom, the greater the e� ect:
CHa C
O
Ha
H
C
Hb
Hc
Hc
HcHb
C
Figure A26 Propan-1-ol.
H
H
H
H H
CH3
Figure A27 Methylbenzene.
H
H
CCI
H
H
C C C
H
H
H
H
H
δ = 1.7 ppm
δ = 1.4 ppm
δ = 0.9 ppm
δ = 3.4 ppm
HL

A MODERN ANALYTICAL CHEMISTRY 25CHEMISTRY FOR THE IB DIPLOMA © CAMBRIDGE UNIVERSITY PRESS 2011
Magnetic resonance imagingA magnetic resonance imaging (MRI) body scanner (Figure A28) is an NMR spectrometer in which a patient can be placed. The scanning takes between about 15 and 45 minutes, and the patient is required to lie still for this length of time. MRI detects the protons in water molecules in cells in the body. Water molecules in cells in di� erent organs are in slightly di� erent environments, so the various organs in the body may be di� erentiated.
MRI is a safe, non-invasive technique for scanning the various organs in the body, and when the data are analysed using a computer, it is possible to obtain a three-dimensional scan of the body (Figure A29).
Figure A28 An MRI scanner.
Figure A29 A coloured MRI scan of a whole human body (female).
Test yourself8 Suggest the splitting pattern for each of the
following molecules:a 1,1-dibromo-2,2-dichloroethaneb 1,1,3,3-tetrachloropropanec propanoic acidd
9 The NMR spectrum of each of the following contains a singlet. Suggest the chemical shift range for the singlet.a propan-2-olb
c
H
H
CH
H
H
C O C
H
H
H
H
H
CH
O
C O C
CH3
H
C
H
H
H
H
H
H
O
C O C CH3C
H
H

A MODERN ANALYTICAL CHEMISTRY 26CHEMISTRY FOR THE IB DIPLOMA © CAMBRIDGE UNIVERSITY PRESS 201126 CHEMISTRY FOR THE IB DIPLOMA © CAMBRIDGE UNIVERSITY PRESS 2011A MODERN ANALYTICAL CHEMISTRY
A6 Atomic absorption spectroscopyAtomic absorption spectroscopy (AAS) provides a method for determining the concentration of metal atoms present in a sample.
Learning objectives
• Describe how AAS works
• Describe how an atomic absorption spectrophotometer works
• Determine the concentration of a solution from AAS data
• State the uses of AAS
AAS is usually used to measure the concentration of metal atoms present, but it could also be used to identify which metals are present.
Basic principlesWe have already met the idea of atomic emission spectra, when an electron in an atom falls down to a lower energy level and gives out radiation of a particular frequency. The radiation emitted in this process is characteristic of a particular element, and only this element gives out these particular wavelengths. For instance, only a sodium atom gives out radiation of wavelength 589 nm. Atoms can also absorb energy to promote an electron from a lower energy level to a higher energy level. The energy absorbed in this process is exactly the same as the energy given out in the emission process, since the same energy levels are present (Figure A30).
Electron energy levels are di� erent in di� erent elements.
emission spectrum
absorption spectrum
Figure A30 Absorption and emission spectra are exactly complementary.
Thus, when an atom of a particular element emits radiation, it can be absorbed only by another atom of the same element. Thus, only a sodium atom emits radiation of wavelength 589 nm, and only a sodium atom can absorb radiation of wavelength 589 nm. This can, therefore, be used to determine the number of atoms of that element present in a sample.
The basic idea of an atomic absorption spectrometer is that the emission spectrum of a particular element is generated and passed through the sample, and the amount of light absorbed is measured.
Atomic absorption spectrophotometerA schematic diagram of an atomic absorption spectrophotometer is shown in Figure A31.
flame
fueloxidant
sourceof radiation
sample
atomiser
monochromator detector readout
Figure A31 An atomic absorption spectrophotometer.

A MODERN ANALYTICAL CHEMISTRY 27CHEMISTRY FOR THE IB DIPLOMA © CAMBRIDGE UNIVERSITY PRESS 2011
Source of radiation
The source emits radiation that is characteristic of the atom being tested for.
An atomic absorption spectrophotometer uses di� erent sources to detect di� erent metals. For instance, to detect sodium, a source containing sodium is used to produce the spectral lines that are characteristic of sodium. The source is not monochromatic in the sense that it produces just one frequency, but it is monochromatic in the sense that each line produced is monochromatic – one particular frequency, rather than a spread of frequencies.
The most common source is a hollow cathode lamp (Figure A32) in which the cathode is made of the metal to be analysed. A high voltage between the anode and cathode causes some of the � ller gas (e.g. Ar or Ne) atoms to ionise. These are accelerated to the cathode and collide, ejecting metal atoms. These metals atoms then collide with gas ions, causing electrons in the metal atoms to be excited to higher energy levels. As these electrons return to lower energy levels, electromagnetic radiation is emitted.
tungsten anode+
–
glas
s w
indo
w
hollow cathode
filler gas – e.g. Ar
Figure A32 A hollow cathode lamp.
AtomiserIn order for this technique to work, the sample has to be converted into atoms. The sample is � rst nebulised (converted to a � ne mist). It is then mixed with a fuel and oxidant in a � ame. Fuels such as ethyne or hydrogen are used, and the oxidant is typically air or oxygen. In the � ame the sample is atomised, and light from the source is passed through it.
Monochromator and detectorThe monochromator allows only one particular frequency of radiation to pass through to the detector. The detector is typically a photomultiplier tube, which converts electromagnetic radiation to an electrical signal. The readout appears on the computer screen. The amount of light absorbed by the sample is proportional to the concentration of that metal atom present, and thus the concentration of the metal in the original sample can be deduced.
Determination of concentration from atomic absorption dataAtomic absorption spectroscopy can be used to determine the calcium concentration in a sample of water. First a calibration curve of absorbance against concentration must be constructed using known concentrations (Figure A33). This is done by making up a series of
Examiner’s tipThis is described as a monochromatic detector on the syllabus.
Examiner’s tipThis is described as a monochromatic source in the syllabus.

A MODERN ANALYTICAL CHEMISTRY 28CHEMISTRY FOR THE IB DIPLOMA © CAMBRIDGE UNIVERSITY PRESS 201128 CHEMISTRY FOR THE IB DIPLOMA © CAMBRIDGE UNIVERSITY PRESS 2011A MODERN ANALYTICAL CHEMISTRY
solutions of known concentration and measuring the absorbance of each solution in an atomic absorption spectrophotometer.
The absorbance reading for the unknown sample is then taken under the same conditions and the concentration read o� the graph. For instance, if the absorbance reading for our unknown sample is 0.27, we can read o� the concentration of calcium in the sample as 6.8 mg dm−3.
Uses of atomic absorption spectroscopyAtomic absorption spectroscopy is used to determine the concentration of various metals in, for example, water (e.g. determination of nickel, magnesium or calcium concentrations), blood (e.g. determination of metals such as sodium, potassium and iron), soil (e.g. lead or cadmium concentrations in soil) and food (e.g. lead, cadmium or copper concentrations in food).
0
0.05
0.10
0.15
0.20
0.25
0.30
0.35
0.40
0.45
Abs
orba
nce
0 2 4
Concentration / mg dm–3
6 6.8 8 10 12
Figure A33 Calibration curve for calcium.
Note on units: mg dm−3 and µg cm−3 are equivalent units. 10 mg dm−3 = 10 µg cm−3.
Test yourself 10 A sample of mineral water was analysed for calcium in an atomic
absorption spectrometer. The absorbance reading was 0.37. Use the calibration curve in Figure A33 to determine the concentration of calcium ions in the water in mg dm−3 and mol dm−3.
Learning objectives
• State why chromatography is used
• Explain the principles of separation using chromatography
• Explain how paper chromatography and TLC are used
• Explain how column chromatography is used
• Describe GLC
• Describe HPLC
• Select an appropriate chromatographic technique for a particular separation
A7 Chromatography
Why is chromatography important?Chromatography is a very important analytical technique, because before we can determine the structure of a compound using infrared, mass spectrometry or NMR, for example, the compound must usually be separated from a mixture – and chromatography is usually the best method for doing this.
Samples taken from natural sources are nearly always mixtures. Similarly, most organic syntheses produce mixtures that must be separated.

A MODERN ANALYTICAL CHEMISTRY 29CHEMISTRY FOR THE IB DIPLOMA © CAMBRIDGE UNIVERSITY PRESS 2011
Reasons for using chromatographyThere are several reasons for using chromatography:
• to separate the components of a mixture
• to determine purity
• to determine the identity of the components of a mixture (usually by comparison with known compounds)
• to determine the amounts of the various components present in a mixture (usually by comparison with a standard).
The mechanism of separation of a mixture All chromatographic techniques involve a stationary phase and a mobile phase. The components in a mixture are separated because of their di� erences in a� nity for the stationary and mobile phases. There are two basic phenomena that may be exploited to bring about separation of the components of a mixture: adsorption and partition.
AdsorptionSeparation occurs by adsorption in column chromatography. The column is packed with small particles of a solid (the stationary phase). The mixture is placed on the top of the column and a solvent (the mobile phase) is passed through the column. The components of the mixture separate as they move down the column:
continuous flow of solvent
continuous flowof solvent
continuous flowof solvent
solid adsorbent solid adsorbent
component of mixture
component of mixture
mixture
Note: the process is adsorption and not absorption.
A substance travelling down a column may be either be adsorbed onto the stationary phase or dissolved in the mobile phase. The substance that is most strongly adsorbed will travel most slowly.
The di� erent components of the mixture separate from each other as they have di� erent tendencies to be adsorbed onto the surface of the solid particles in the column.
In Figure A34, the red particles have a greater tendency to be adsorbed on the solid particles and so spend less time dissolved in the solvent � owing through the column. The yellow particles have very

A MODERN ANALYTICAL CHEMISTRY 30CHEMISTRY FOR THE IB DIPLOMA © CAMBRIDGE UNIVERSITY PRESS 201130 CHEMISTRY FOR THE IB DIPLOMA © CAMBRIDGE UNIVERSITY PRESS 2011A MODERN ANALYTICAL CHEMISTRY
little tendency to be adsorbed on the solid particles and so spend more time dissolved in the mobile phase. The yellow particles thus travel more quickly down the column.
solid particlesof adsorbent
solid particlesof adsorbent
molecule adsorbedon surface
flow ofsolvent
flow ofsolvent
PartitionPartition works because a solute will be distributed between two immiscible solvents according to its solubility in each solvent. For instance, if an aqueous solution of bromine is shaken with hexane, most of the bromine moves into the hexane layer, as bromine is more soluble in hexane.
In partition chromatography, the stationary phase is a liquid. Separation occurs because of the di� erent tendencies of the components of the mixture to dissolve in the stationary phase solvent or in the mobile phase solvent. A substance that is more soluble in the stationary phase will travel more slowly through the system.
Paper chromatography (partition)Paper chromatography may be used to separate the various dyes in coloured inks, to separate a mixture of sugars or to separate amino acids, for example. This is the experimental set-up for paper chromatography:
Figure A34 In general, the more polar the solute particles, the greater tendency they will have to be adsorbed on the stationary phase.
solvent
pencilline
spot ofmixture
closed container
chromatographypaper
componentsof mixture
solvent
pencil line
solvent front
closed container
The process of the solvent travelling up the paper to produce a chromatogram is called development. The word ‘development’ is used di� erently in the IB chemistry syllabus – see below.
hexane
bromine water
SHAKE

A MODERN ANALYTICAL CHEMISTRY 31CHEMISTRY FOR THE IB DIPLOMA © CAMBRIDGE UNIVERSITY PRESS 2011
• A line is drawn with a pencil (not a pen, as the inks may move with the solvent) across a piece of chromatography paper about 1 cm from the bottom.
• A sample of the mixture is placed on the pencil line and allowed to dry.
• The paper is suspended in a container with a small amount of solvent at the bottom so that the end of the paper dips into the solvent (the original spot must be above the top of the solvent).
• The solvent is drawn up the paper by capillary action.
• The container is closed, so that the atmosphere becomes saturated with the solvent – this prevents evaporation of the solvent from the surface of the paper.
• The process is stopped when the solvent front is about 1 cm from the top of the paper. A pencil line is drawn to record the position of the solvent front and the paper is dried.The � bres that make up the paper are coated with water, and it is this
water that is the stationary phase in paper chromatography. Separation is due to partition of the various substances between the stationary and mobile phases. Materials more soluble in the water on the � bres will move up the paper more slowly.
Thin-layer chromatography (adsorption)Thin-layer chromatography (TLC) is a very similar technique to paper chromatography, and the experiment is carried out in basically the same way, but instead of a piece of paper, a plate (a piece of plastic, glass or metal) coated in silica gel or alumina is used.
Separation here is due to adsorption – the components of the mixture are either dissolved in the solvent or adsorbed onto the stationary phase. The greater the tendency of a solute molecule to be adsorbed onto the stationary phase, the more slowly it moves along the plate.
TLC may be used for similar separations to those for paper chromatography. TLC has many advantages over paper chromatography, however: for example, it is faster and gives better resolution (better separation of spots).
Location of spots (visualisation)If the substances to be separated are colourless (e.g. amino acids or sugars), then some method must be used to locate the spots on the paper or TLC plate. The spots may be located using a locating agent. Amino acids, which are colourless, may be located by spraying with ninhydrin, which makes them show up as pink or purple spots. Other methods that are useful for organic solutes are exposing the paper or plate to iodine vapour (the spots become brown) or spraying the plate with concentrated sulfuric acid then heating it (the spots appear as brown-black). A speci� c locating agent for sugars is p-anisidine hydrochloride (4-methoxybenzenamine hydrochloride). Spots may also often be located by the use of an ultraviolet lamp, as some substances � uoresce under ultraviolet light (many TLC plates also have � uorescent compounds mixed in with the adsorbent).
Paper chromatography
method of separation
partition
stationary phase
water on the fi bres of the paper
mobile phase the solvent
movement of mobile phase
capillary action
Thin-layer chromatography
method of separation
adsorption
stationary phase
solid particles (silica/silica gel or alumina) coating the plate
mobile phase the solvent
movement of mobile phase
capillary action
Examiner’s tipVisualisation is called development in the IB chemistry syllabus.
TLC plates are also commonly coated with cellulose powder, in which case the method of separation is partition.
Solvent front: distance moved by the solvent up the paper.

A MODERN ANALYTICAL CHEMISTRY 32CHEMISTRY FOR THE IB DIPLOMA © CAMBRIDGE UNIVERSITY PRESS 201132 CHEMISTRY FOR THE IB DIPLOMA © CAMBRIDGE UNIVERSITY PRESS 2011A MODERN ANALYTICAL CHEMISTRY
Retardation factor valueWe can describe the position of spots on a paper chromatogram using the retardation factor (Rf) value:
distance solute movesRf =
distance solvent front moves
These distances can be measured on the paper or TLC plate from the position of the original pencil line (not from the bottom of the paper or plate). In Figure A35:
aRf =
b
4.8Rf =
10.4 = 0.46
solvent front
pencil line
b
a
Figure A35 Measure from the pencil line to the middle of the spot.
The Rf value depends strongly on the solvent used as the mobile phase and may also be a� ected by the type of paper or plate used.
The Rf value has no units.
An Rf value close to 1 indicates that a component has a very high a� nity for the mobile phase, whereas a very low Rf value means that the component hardly moves at all from the base line and has a very high a� nity for the stationary phase.
The Rf value may be useful in identifying the components of a mixture. Consider an experiment in which we wish to determine the dyes present in a mixture: we suspect that the mixture, X, contains some or all of the dyes A, B, C and D. The mixture is spotted onto a piece of chromatography paper or a TLC plate together with pure samples of each of the dyes A–D (Figure A36). The results show that X contains three components, and as the spots of A, B and C have moved the same distance as the individual components of X, we can be reasonably sure that X is a mixture of A, B and C. No component of X moves the same distance as D, so X does not seem to contain D.
solvent
spot ofmixture
closed container
chromatographypaper / TLC plate
X A B C D
solvent
solvent front
closed container
X A B C D
Figure A36 Using chromatography to identify the components of a mixture, X.

A MODERN ANALYTICAL CHEMISTRY 33CHEMISTRY FOR THE IB DIPLOMA © CAMBRIDGE UNIVERSITY PRESS 2011
The experiment could also have been conducted using separate plates /pieces of chromatography paper and comparing the Rf values of the pure dyes with each component of X. If the Rf values were the same using the same solvent and the same type of TLC plate or chromatography paper, it would be likely that the substances were the same.
Column chromatography/liquid chromatography (adsorption)These are the stages in a column chromatography experiment:
continuous flowof solvent
continuous flowof solvent
solid adsorbent
mixture
solid adsorbent
component ofmixture
component ofmixture
• The column is � lled with powdered solid adsorbent as a slurry in the solvent to be used.
• The mixture to be separated is added at the top of the column.
• The tap is opened so that the solvent � ows through the column and further solvent is added continuously.
• As the solvent � ows through the column, the components of the mixture move down the column.
• The di� erent components of the mixture are collected in separate beakers.
The technique relies on adsorption – the various components of the mixture are adsorbed to di� erent extents on the stationary phase (solid particles of silica gel or alumina). The component with the greatest tendency to be adsorbed on the stationary phase travels most slowly through the column. A longer column produces better separation of the mixture but takes longer.
Column chromatography may be used for large-scale separation of a mixture. Each component is collected separately and can then be further processed. For instance, in a multi-stage preparation of a particular organic compound, the reaction mixture produced from the � rst stage is passed through the column to isolate the compound required. This compound
The process of the solvent and the components of the mixture passing through the column is called elution.
The di� erent components have di� erent retention times on the column.
Column chromatography
method of separation
adsorption
stationary phase
solid particles of silica gel or alumina
mobile phase the solvent
movement of mobile phase
gravity

A MODERN ANALYTICAL CHEMISTRY 34CHEMISTRY FOR THE IB DIPLOMA © CAMBRIDGE UNIVERSITY PRESS 201134 CHEMISTRY FOR THE IB DIPLOMA © CAMBRIDGE UNIVERSITY PRESS 2011A MODERN ANALYTICAL CHEMISTRY
can then be used in further reactions to eventually produce the target molecule.
Column chromatography may be used for the separation of the pigments (chlorophylls, xanthophylls and carotenes) in grass and other green plants.
Test yourself 11 A mixture is to be separated using column
chromatography. When the experiment is tried the � rst time, there is some separation of the components, but the bands overlap. Suggest two changes that could give better separation.
12 Calculate Rf values for all the spots in Figure A36 and state which colour substance is most soluble in the mobile phase.
Gas–liquid chromatography (partition)Gas–liquid chromatography (GLC) is used for the separation of mixtures of gases, volatile liquids or volatile solids. This is a schematic diagram of a gas chromatograph:
HL
carrier gas
inject sample
oven
colu
mn
detector
amplifier computer
chromatogram
• The sample is injected into a heated chamber, where it is vaporised.
• An inert gas (e.g. nitrogen or helium), called the carrier gas, carries the sample through the column.
• The column contains a non-volatile liquid (the stationary phase) spread onto the surface of � nely divided solid particles.
• A detector detects each component as it leaves the column. The detector may respond to, for example, changes in the thermal conductivity of the gas emerging (thermal conductivity detector), or a � ame ionisation detector may be used.
Separation is by partition. Separation thus depends on the solubility of the various components in the liquid phase. Those with higher solubility in the liquid stationary phase are slowed down in the column relative to those that are less soluble in the stationary phase.
Substances must vaporise without decomposition to be separated by GLC.
Gas–liquid chromatography
method of separation
partition
stationary phase
high boiling point liquids (e.g. polysiloxanes) on a solid support
mobile phase the carrier gas – He or N2
movement of mobile phase
carrier gas fl ows through the system

A MODERN ANALYTICAL CHEMISTRY 35CHEMISTRY FOR THE IB DIPLOMA © CAMBRIDGE UNIVERSITY PRESS 2011
An example of a gas chromatogram is shown in Figure A37.D
etec
tor
resp
onse
0 1 2Retention time / min
C4H10
C5H12
C3H8
C2H4
CH4
C6H14
sampleinjection
3 4 5 6 7 8 9 10
Figure A37 This gas chromatogram is for a mixture of hydrocarbons.
The retention time (Rt), the time between when the mixture is injected and the time it is detected, is dependent on several factors. The most important of these is the boiling point of the substance. The most volatile substance generally has the greatest tendency to enter the gaseous phase and therefore the shortest retention time. Thus in Figure A37, methane has the lowest relative molecular mass and therefore the lowest boiling point – it travels through the column most quickly. Other factors that a� ect the retention time are:
• the temperature of the column (the lower the temperature, the longer the retention times; however, the lower the temperature, the better the resolution, i.e. the better the separation)
• the length of the column (the longer the column, the longer the retention times; longer columns also give better separations)
• the � ow rate of the carrier gas (the faster the rate the shorter the retention times)
• the polarity of the compound and the stationary phase.
Identifying compounds using GLCIf we wish to establish that a particular compound is present in a mixture, we can do this by adding the pure compound to the mixture. Thus, if we wanted to con� rm that the peak at retention time 5.3 minutes marked C4H10 in our mixture of hydrocarbons (Figure A37) was butane rather than methylpropane, we would run the gas chromatogram again but this time adding some pure butane to our mixture. If the original peak was due to butane no new peaks should appear, and the peak at retention time 5.3 minutes should get larger.
The appearance of a chromatographic peak at a particular retention time suggests, but does not guarantee, the presence of a particular compound in a sample. If we need to be certain, it is better to connect the gas chromatograph to a mass spectrometer. Each band, as it comes out of the chromatography column, is passed directly into a mass spectrometer, where it is analysed. The mass spectrum of a compound is generally characteristic of that compound, and so by comparison with the mass spectra in a database, the compound can be identi� ed.
HL
If the original peak was due to methylpropane a new peak would appear on the chromatogram when we add butane.

A MODERN ANALYTICAL CHEMISTRY 36CHEMISTRY FOR THE IB DIPLOMA © CAMBRIDGE UNIVERSITY PRESS 201136 CHEMISTRY FOR THE IB DIPLOMA © CAMBRIDGE UNIVERSITY PRESS 2011A MODERN ANALYTICAL CHEMISTRY
Determining the amounts of compounds present in a mixture using GLCThe area under a peak is proportional to the concentration, and so the amount of substance present may be determined. In order to do this accurately, a known amount of a substance (internal standard) is added to the mixture under investigation and the areas under the peaks in the mixture can be compared to the area under the internal standard peak.
High-performance liquid chromatography (usually partition)In high-performance liquid chromatography (HPLC), very high pressure is used to drive the liquid mobile phase through a column packed with very small particles. The technique may be used to carry out adsorption or partition chromatography, but the most common form involves partition. This is a schematic diagram of a high-performance liquid chromatograph:
detector
injectionport
pump
solventreservoir
amplifier computer
chromatogram
column
The mobile phase, which is a liquid, is forced through the column under very high pressure. High pressure is required, as the column contains very small particles (as small as 3-10 µm in diameter) – otherwise the solvent would take too long to travel through it. Because of the small size of the particles, the components of the mixture are exposed to a very high surface area of mobile and stationary phase, and good separation is therefore obtained with much shorter columns than with GLC. The most common detectors measure the absorption of ultraviolet radiation or visible light by each component as it emerges from the column.
In the most common form of HPLC, the stationary phase consists of long-chain alkanes bonded to a solid support. Separation depends on the relative solubility of the various components in the mobile phase or the stationary phase.
Di� erent components have di� erent retention times. The retention times depend on the relative polarities of the stationary phase and the mobile phase. If the stationary phase is less polar than the mobile phase, the most polar component of the mixture is eluted � rst as it has greater tendency to dissolve in the mobile phase (the intermolecular forces are more similar).
This is also called high-pressure liquid chromatography.
Length of column, pressure and temperature also a� ect the retention time.
HPLC can also be linked to a mass spectrometer.
High-performance liquid
chromatography
method of separation
partition
stationary phase
long chain alkanes bonded to silica
mobile phase the solvent
movement of mobile phase
pumped through the column at high pressure
HL
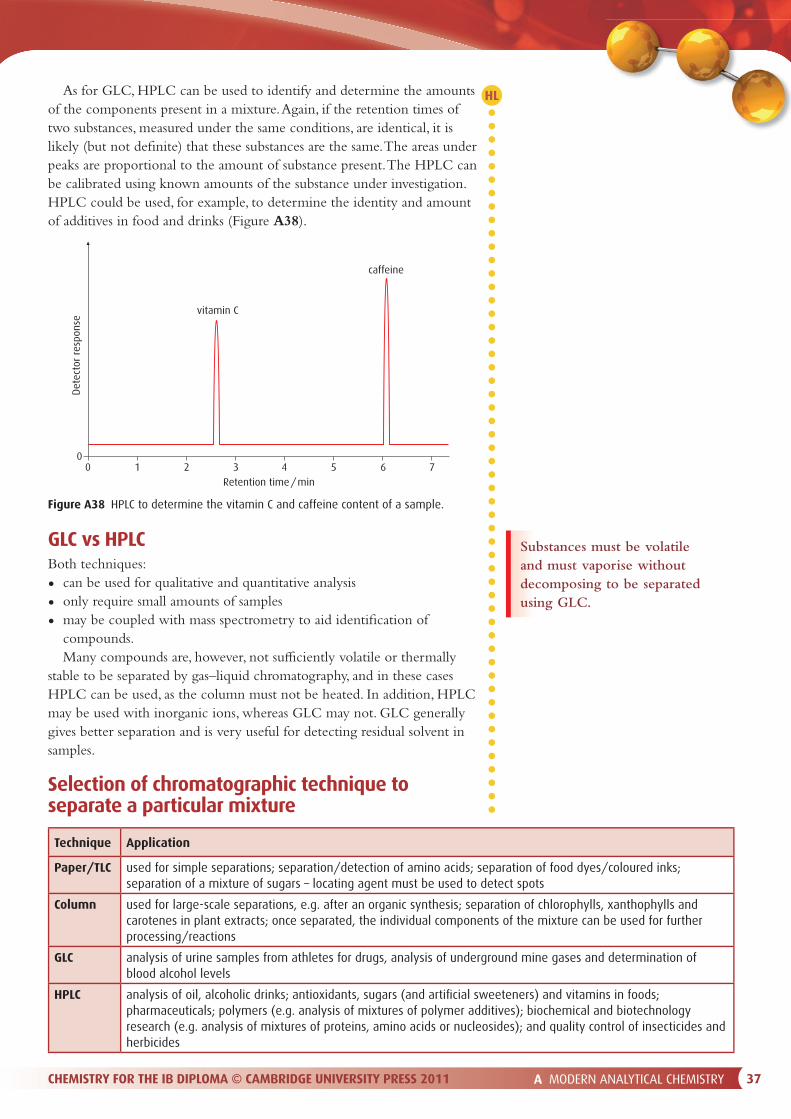
A MODERN ANALYTICAL CHEMISTRY 37CHEMISTRY FOR THE IB DIPLOMA © CAMBRIDGE UNIVERSITY PRESS 2011
As for GLC, HPLC can be used to identify and determine the amounts of the components present in a mixture. Again, if the retention times of two substances, measured under the same conditions, are identical, it is likely (but not de� nite) that these substances are the same. The areas under peaks are proportional to the amount of substance present. The HPLC can be calibrated using known amounts of the substance under investigation. HPLC could be used, for example, to determine the identity and amount of additives in food and drinks (Figure A38).
Det
ecto
r re
spon
se
00
1Retention time / min
vitamin C
caffeine
2 3 4 5 6 7
GLC vs HPLCBoth techniques:
• can be used for qualitative and quantitative analysis
• only require small amounts of samples
• may be coupled with mass spectrometry to aid identi� cation of compounds.Many compounds are, however, not su� ciently volatile or thermally
stable to be separated by gas–liquid chromatography, and in these cases HPLC can be used, as the column must not be heated. In addition, HPLC may be used with inorganic ions, whereas GLC may not. GLC generally gives better separation and is very useful for detecting residual solvent in samples.
Selection of chromatographic technique to separate a particular mixture
Technique Application
Paper/TLC used for simple separations; separation/detection of amino acids; separation of food dyes/coloured inks; separation of a mixture of sugars – locating agent must be used to detect spots
Column used for large-scale separations, e.g. after an organic synthesis; separation of chlorophylls, xanthophylls and carotenes in plant extracts; once separated, the individual components of the mixture can be used for further processing/reactions
GLC analysis of urine samples from athletes for drugs, analysis of underground mine gases and determination of blood alcohol levels
HPLC analysis of oil, alcoholic drinks; antioxidants, sugars (and artifi cial sweeteners) and vitamins in foods; pharmaceuticals; polymers (e.g. analysis of mixtures of polymer additives); biochemical and biotechnology research (e.g. analysis of mixtures of proteins, amino acids or nucleosides); and quality control of insecticides and herbicides
Figure A38 HPLC to determine the vitamin C and caffeine content of a sample.
Substances must be volatile and must vaporise without decomposing to be separated using GLC.
HL

A MODERN ANALYTICAL CHEMISTRY 38CHEMISTRY FOR THE IB DIPLOMA © CAMBRIDGE UNIVERSITY PRESS 201138 CHEMISTRY FOR THE IB DIPLOMA © CAMBRIDGE UNIVERSITY PRESS 2011A MODERN ANALYTICAL CHEMISTRY
A8 Visible and ultraviolet spectroscopy
The colours of transition metal complexesWe have already met the idea that transition metals form complex ions (Chapter 4, page 168 in the Coursebook). These consist of a central transition metal ion surrounded by ligands. The complex ions we will consider in this section have six ligands and are octahedral:
Test yourself 13 In the chromatogram shown in Figure A38, which substance is
present in a greater amount, and how would retention times be a� ected by using a longer column?
Learning objectives
• Describe the factors that a� ect the colours of transition metal complexes
• Explain why certain molecules absorb ultraviolet–visible radiation
• Explain how conjugation a� ects the wavelength of light absorbed
• Determine the concentration of a solution from a calibration curve Fe
HH
H
3+
H
HH
H
HO:
:
O
O
: O
:H
HH
HO:
O:
The set of � ve 3d orbitals in a free, gaseous transition metal ion are degenerate, i.e. all have the same energy, but if the transition metal is surrounded by a set of six ligands in an octahedral array the d orbitals are raised in energy and split into two sets.
The splitting may be regarded as due to the repulsion between the electrons in the metal ion d orbitals and the lone pairs on the ligands. Two of the metal d orbitals point directly at the ligands and are so raised in energy, whereas the other three d orbitals point between the ligands and are lowered in energy.
Transition metal complexes may absorb light in the visible region of the electromagnetic spectrum to cause d electrons to be promoted from the lower set of d orbitals to the upper set. The light transmitted or re� ected is the complementary colour to the light absorbed:
white lightlight energy
When orange light is removedfrom white light it appears blue.
CuSO4(aq)orange light
absorbed
orange light missing
Absorption of lightenergy causes anelectron to bepromoted to thehigher set of dorbitals.
Factors that affect the colour of transition metal complexes
Identity of the metalDi� erent metals in the same oxidation state have di� erent colours. Di� erent metal ions have di� erent electronic con� gurations and, as
Note: copper sulfate actually has a broad absorption at the orange-red end of the spectrum.
HL
Extension
The electrons in dz2 and dx2-y2 orbitals are repelled more by the ligand electrons, because they point directly at the ligands: greater repulsion = higher energy.
This is also discussed on pages 170–171 of the Coursebook.

A MODERN ANALYTICAL CHEMISTRY 39CHEMISTRY FOR THE IB DIPLOMA © CAMBRIDGE UNIVERSITY PRESS 2011
colours are caused by electronic transitions, di� erent arrangements of electrons give rise to di� erent colours.
Note: most aqueous solutions of Fe3+
are actually yellow, but they do not contain [Fe(H2O)6]3+(aq).
[Cu(H2O)6]2+(aq) is blue.[Cu(NH3)4(H2O)2]2+(aq) is dark blue / violet.
[Fe(H2O)6]2+(aq) is pale green.[Fe(H2O)6]3+(aq) is pale violet.
NH3 causes greater splitting of the d orbitals than H2O.
Note: it is sometimes suggested that the splitting of the d orbitals depends on the nuclear charge of the metal. Although the nuclear charge is likely to in� uence the splitting to some extent, it can be seen from the data below that there is no clear correlation between the nuclear charge on the metal and the splitting of the d orbitals:
Ion Nuclear charge Splitting of d orbitals / cm−1
[V(H2O)6]2+ 23+ 12 000
[Cr(H2O)6]2+ 24+ 14 000
[Mn(H2O)6]2+ 25+ 7 500
[Fe(H2O)6]2+ 26+ 10 000
Ligands that cause a greater splitting of the d orbitals are called stronger � eld ligands.
[Cu(NH3)4(H2O)2]2+ thus has a larger energy gap between the two sets of d orbitals than [Cu(H2O)6]2+ and absorbs a higher frequency of light (see � gure on next page).
HL
Extension
The actual theory behind the spectra of transition metal complexes is signi� cantly more complex than described here, and the simple idea of an electron being promoted from the lower set of d orbitals to the upper set is only really applicable to transition metal ions with one d electron (d9 ions also produce relatively simple spectra). This is evident by the fact that transition metal ions will usually absorb more than one
frequency of electromagnetic radiation and not just one as predicted by the simple approach. For transition metals with more than one d electron, the repulsion between d electrons is important in determining the energy of the various energy states. The absorption of electromagnetic radiation by a transition metal ion could be better described as causing rearrangement of electrons within the d orbitals.
Oxidation numberThe same metal in di� erent oxidation states has di� erent colours. This is for two reasons:
• the electronic con� gurations of the ions are di� erent
• a greater charge on the metal ion causes the ligands to be pulled in more closely, so that there is greater repulsion between the ligand electrons and the d electrons of the transition metal ion – and therefore greater splitting of the d orbitals.
Nature of the ligandThe same metal ion can exhibit di� erent colours with di� erent ligands. This is mainly because of the di� erent splitting of the d orbitals caused by the di� erent ligands.
Ligands can be arranged into a spectrochemical series according to how much they cause the d orbitals to split:
Cl− < H2O < NH3
Mn2+(aq) (3d5) is very pale pink /colourless.Fe2+(aq) (3d6) is pale green.

A MODERN ANALYTICAL CHEMISTRY 40CHEMISTRY FOR THE IB DIPLOMA © CAMBRIDGE UNIVERSITY PRESS 201140 CHEMISTRY FOR THE IB DIPLOMA © CAMBRIDGE UNIVERSITY PRESS 2011A MODERN ANALYTICAL CHEMISTRY
Ultraviolet–visible spectroscopyUltraviolet–visible (UV-vis) spectroscopy is a technique used for looking at electronic transitions in molecules. Electromagnetic radiation in the visible/ultraviolet region of the spectrum is absorbed to promote an electron from a lower energy molecular orbital to a higher energy molecular orbital.
Ethene absorbs ultraviolet radiation. The wavelength at which the maximum amount of radiation is absorbed is called λmax. For ethene, this is about 162 nm.
ChromophoresMolecules that absorb in the UV-vis region generally contain a double bond in the form of C=C, C=O or a benzene ring. These groups, which give rise to absorptions in the UV-vis region, are called chromophores.
Table A7 shows some molecules that absorb UV-vis radiation. Alkanes don’t, as they don’t contain double bonds.
[Cu(NH3)
4(H
2O)
2]2+
[Cu(H2O)
6]2+
500 700Wavelength / nm
increasing energy of radiation
UV-vis spectroscopy is a form of absorption spectroscopy.
HL
Extension
An explanation of the spectrochemical series is di� cult at this level. An expanded spectrochemical series is:
Cl− < OH− < H2O < NH3 < CO
From this series it can be seen that the spectrochemical series cannot be explained in terms of the charge density of the ligand, as OH− has a greater charge density than H2O and would be expected to cause greater splitting of the d orbitals (greater repulsion between ligand electrons and d electrons). The spectrochemical series can, however, be explained to a certain extent in terms of π bonding between the ligand and the transition metal ion. π overlap of a lone pair on Cl− with ligand d orbitals causes the splitting of the d orbitals to be reduced. The CO ligand is a π acceptor and causes greater splitting of the d orbitals.
Extension
Alcohols and amines, which have lone pairs on the O or N, can also absorb radiation in this region, because of an n → σ* transition.
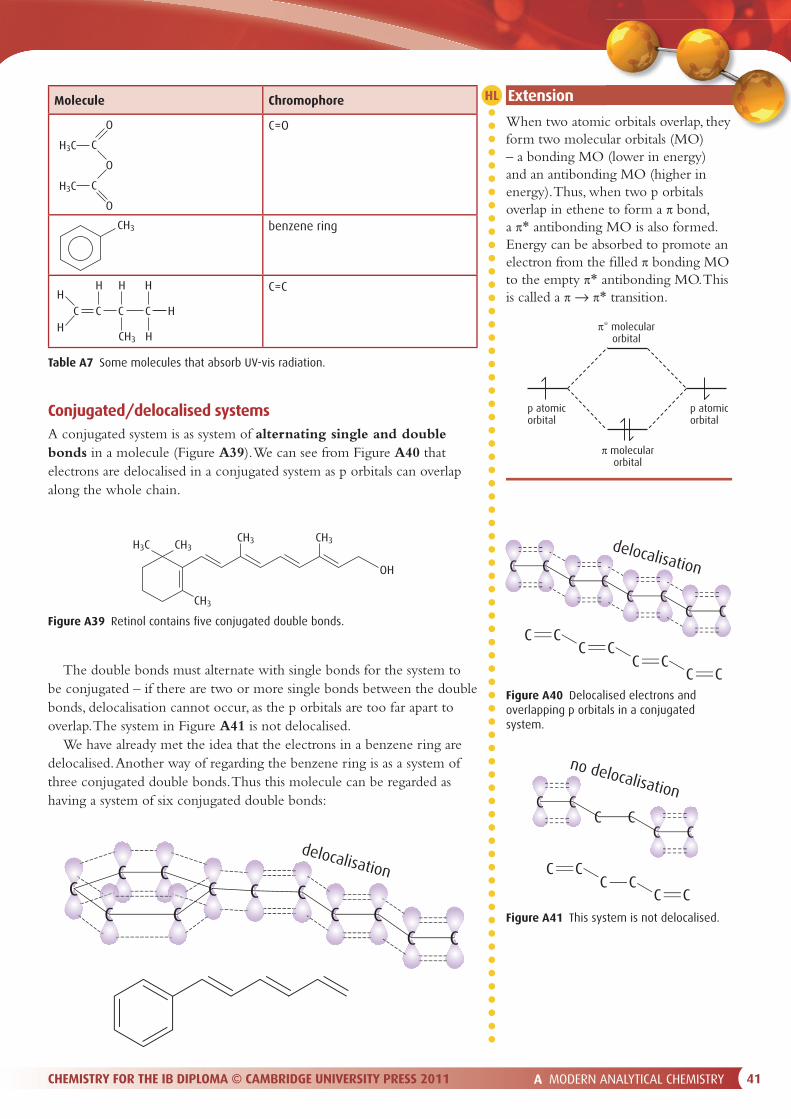
A MODERN ANALYTICAL CHEMISTRY 41CHEMISTRY FOR THE IB DIPLOMA © CAMBRIDGE UNIVERSITY PRESS 2011
Molecule Chromophore
C=O
benzene ring
C=C
Table A7 Some molecules that absorb UV-vis radiation.
Conjugated/delocalised systemsA conjugated system is as system of alternating single and double bonds in a molecule (Figure A39). We can see from Figure A40 that electrons are delocalised in a conjugated system as p orbitals can overlap along the whole chain.
CH3C
O
O
CH3C
O
CH3
HH
HC
H
C
H
CH3
H
H
C C
p atomicorbital
p atomicorbital
π molecularorbital
π* molecularorbital
H3C CH3
CH3
CH3 CH3
OH C CC
CCCC
delocalisation
C CC C
C CC C
C
CCC
CC
no delocalisation
C CC C
C C
C
The double bonds must alternate with single bonds for the system to be conjugated – if there are two or more single bonds between the double bonds, delocalisation cannot occur, as the p orbitals are too far apart to overlap. The system in Figure A41 is not delocalised.
We have already met the idea that the electrons in a benzene ring are delocalised. Another way of regarding the benzene ring is as a system of three conjugated double bonds. Thus this molecule can be regarded as having a system of six conjugated double bonds:
Figure A39 Retinol contains fi ve conjugated double bonds.
Figure A40 Delocalised electrons and overlapping p orbitals in a conjugated system.
Figure A41 This system is not delocalised.
CCdelocalisation
CCCC
CCCCCC
ExtensionHL
When two atomic orbitals overlap, they form two molecular orbitals (MO) – a bonding MO (lower in energy) and an antibonding MO (higher in energy). Thus, when two p orbitals overlap in ethene to form a π bond, a π* antibonding MO is also formed. Energy can be absorbed to promote an electron from the � lled π bonding MO to the empty π* antibonding MO. This is called a π → π* transition.

A MODERN ANALYTICAL CHEMISTRY 42CHEMISTRY FOR THE IB DIPLOMA © CAMBRIDGE UNIVERSITY PRESS 201142 CHEMISTRY FOR THE IB DIPLOMA © CAMBRIDGE UNIVERSITY PRESS 2011A MODERN ANALYTICAL CHEMISTRY
Conjugated/delocalised systems and absorption of electromagnetic radiationThe longer the conjugated chain (delocalised system), the longer the wavelength of radiation absorbed:
Molecule No. of conjugated double bonds λmax / nm
1 162
2 217
3 275
4 310
This basically means that, as the conjugated system gets longer, the energy gap between the lower molecular orbital that the electron is promoted from (π MO), and the higher molecular orbital that it is promoted to (π* MO) is lower:
H
H
H
HC C
C
H
C
H
HH
H
H
C C
C
H
C
H
H
CH3
CH3H
C C C
H
C
H
C
H
C
H
H
CH3
CH3H
C C C
H
C
H
C
H
C
H
shorter wavelengthradiation
longer wavelengthradiation
largerenergygap
smallerenergygap
shorter conjugatedsystem
longer conjugatedsystem
Absorption of electromagnetic radiation and colourIn order for a compound to be coloured, the molecules must absorb visible light. Visible light is electromagnetic radiation with wavelengths between about 400 and 750 nm. Therefore, if a molecule absorbs radiation between these wavelengths, it will be coloured. We have just seen that the longer the conjugated system, the longer the wavelength of the radiation absorbed. All the molecules in the table above are colourless, as they absorb radiation below 400 nm, but if the conjugated system involves more than about eight double bonds, the molecules should absorb in the visible region of the spectrum and be coloured.
Let us consider a few examples. Retinol (see Figure A39), which has a system of � ve conjugated double bonds, has λmax of 325 nm, and therefore absorbs ultraviolet radiation and is colourless. Lycopene, which has a system of 11 conjugated double bonds (Figure A42), has λmax of 472 nm and, as it absorbs visible light, is coloured. Lycopene absorbs light in the blue-green part of the visible spectrum and therefore appears red.
Extension
The reason that the energy gap between the π and π* molecular orbitals gets smaller is that with longer conjugated systems, the highest occupied π MO has less bonding character and the lowest unoccupied π* molecular orbital has less antibonding character.
HL

A MODERN ANALYTICAL CHEMISTRY 43CHEMISTRY FOR THE IB DIPLOMA © CAMBRIDGE UNIVERSITY PRESS 2011
Chlorophyll a and b have long conjugated systems (highlighted in Figure A43). They absorb light in the 400–500 nm region and in the 600–700 nm region. The green light in the middle of the spectrum is not absorbed, and so these molecules are green.
Aromatic rings and long conjugated systemsA benzene ring may be regarded as a system of thee conjugated double bonds and therefore can have a large e� ect on the length of the conjugated chain when present in a molecule. Coloured organic compounds often contain benzene rings. Benzene itself absorbs at wavelengths of 184, 204 and 254 nm.
Phenolphthalein is an indicator and has di� erent structures in acidic and alkaline solution: CHHC Mg
N
OOOO
O
CC
HH
H
N
RCH2
CH2
HC
N N CH3
CH3
CH3
CH2
C20H39
H2C
H3C
H3C
Figure A42 Lycopene has 11 conjugated double bonds. Note that not all the C=C in lycopene are part of the conjugated system.
The colour of a compound is the complementary colour to the light absorbed.
Figure A43 The basic structures of chlorophyll a (R = CH3) and chlorophyll b (R = CHO), showing the conjugated system. Chlorophyll b has an extra double bond that is part of the conjugated system.
O
O
OH
HO
colourless
add alkali
add acid
pink
C
C
O–
O
O
O–
C
C
The acid form has a shorter delocalised (conjugated) system, as there are two single bonds together in the middle of the molecule (Figure A44). This, therefore, absorbs radiation in the ultraviolet region of the spectrum and is colourless. The alkaline form has a delocalised system that extends over the whole ion. This means that it absorbs certain frequencies of visible light and, therefore, appears coloured.
O
O
OH
HO
two single bondstogether
C
C
Figure A44 The structure of the acid form of phenolphthalein.
Excessive exposure to ultraviolet light from the Sun can cause skin cancer, and sun creams contain molecules that can absorb ultraviolet light. Molecules containing conjugated systems, such as benzophenone (shown here), are used in sun creams.
O
CH3
CH3
CH3
CH3
CH3
CH3
H3C
CH3
CH3
CH3
Lycopene is the red pigment in tomatoes.
HL

A MODERN ANALYTICAL CHEMISTRY 44CHEMISTRY FOR THE IB DIPLOMA © CAMBRIDGE UNIVERSITY PRESS 201144 CHEMISTRY FOR THE IB DIPLOMA © CAMBRIDGE UNIVERSITY PRESS 2011A MODERN ANALYTICAL CHEMISTRY
Test yourself
The Beer–Lambert law (Beer’s law)The Beer–Lambert law relates the amount of light absorbed by a solution to its concentration and the path length.
The Beer–Lambert law is:
log10 (I0/I) = A = εcl
where:Io = intensity of the light before it passes through the sampleI = intensity of the light after it has passed through the sampleA = absorbance = log10 (I0/I)ε = molar absorptivity (units: cm−1 mol−1 dm3)c = concentration of the solution in mol dm−3
l = path length, i.e. the thickness of the sample (usually in cm).The Beer–Lambert law is usually used in the form:
A = εcl
It merely tells us that more radiation is absorbed by a more concentrated solution or if the radiation has to pass through a thicker sample. If the light encounters twice as many particles as it passes through the sample, twice as much will be absorbed.
Determining the concentration of a solutionUsing a spectrophotometer or a colorimeter, we can work out the concentrations of metal ions in solution. The following procedure is usually followed to do this:
• λmax is determined by recording a spectrum in a UV-vis spectrophotometer
• a series of solutions of known concentration is made up
• the colorimeter is zeroed with a cuvette containing just the solvent
• the absorbance of each of the solutions of known concentration is measured at λmax
• a calibration curve of absorbance against concentration is plotted
• the absorbance of the unknown solution is measured at λmax using a spectrophotometer/colorimeter
14 Arrange the following molecules in order of the wavelength of ultraviolet/visible radiation that they absorb (shortest � rst):
hexa-1,4-diene
I II III
buta-1,3-diene
IV V VI
CH3 CH3
OO
Io I
monochromaticlight
path length
solu
tion
Absorbance has no units.
ε depends on the wavelength of the light.

A MODERN ANALYTICAL CHEMISTRY 45CHEMISTRY FOR THE IB DIPLOMA © CAMBRIDGE UNIVERSITY PRESS 2011
• the concentration of the unknown solution is read o� the calibration curve.
All measurements must be made at the same wavelength, as ε depends on wavelength.
The calibration curve for an experiment to determine the concentration of a solution of copper sulfate is shown in Figure A45. This experiment was carried out at 635 nm (this was the highest wavelength available on the colorimeter!) – λmax for copper sulfate is in the infrared region of the spectrum. If the absorbance of the copper sulfate solution of unknown concentration was 0.31, the concentration can be read o� the calibration curve as 0.15 mol dm−3.
The graph in Figure A45 shows that absorbance is proportional to concentration for the concentration range used, and so we could also have worked out the concentration of our unknown solution using the Beer–Lambert law. The gradient of the graph is εl, and if we know the path length (usually 1 cm), we can work out ε, and this can be used to work out the concentration if the absorbance is known.
The Beer–Lambert law holds only for dilute solutions, and at higher concentrations absorbance is less than would be predicted from the Beer–Lambert law.
0.35
0.40
0.45
0.30
0.25
0.20
0.15
0.10
0.05
0
Abs
orba
nce
0 0.05 0.10
Concentration / mol dm–3
0.15 0.20 0.25
Figure A45 The calibration curve for copper sulfate at 635 nm.
Test yourself 15 a Calculate the molar absorptivity for copper sulfate at 635 nm,
if the graph in Figure A45 was obtained using a sample of path length of 1 cm.
b A sample of copper sulfate with path length 1 cm had an absorbance of 0.52 at 635 nm. Calculate the concentration of the solution.
HL A cuvette is the container that holds the sample in the spectrophotometer/colorimeter.

A MODERN ANALYTICAL CHEMISTRY 46CHEMISTRY FOR THE IB DIPLOMA © CAMBRIDGE UNIVERSITY PRESS 201146 CHEMISTRY FOR THE IB DIPLOMA © CAMBRIDGE UNIVERSITY PRESS 2011A MODERN ANALYTICAL CHEMISTRY
Exam-style questions
1 State which analytical technique would be most suitable for each of the following procedures:
a Determination of the amount of mercury in a soil sample. [1]
b Separation of a mixture of sugars. [1]
c Distinguishing between samples of pentane and hexane. [1]
2 Certain molecules absorb infrared (IR) radiation.
a Consider the molecules: H2 CO HCl N2 O2
Select the molecule(s) from this list that can absorb IR radiation and explain your choice. [3]
b Explain why there are three absorption bands in the IR spectrum of SO2 but only two in the IR spectrum of CO2. [4]
c IR spectroscopy is one of the techniques that is used to determine the structure of organic molecules. A student recorded the IR spectrum of a compound, X:
% T
rans
mitt
ance
Wavenumber/cm–1
3800 3000 2000 1000
100
0
The student knew that X was one of the following compounds.
I
II
III
IV
Deduce which of the molecules is X and explain your choice by reference to the spectrum. [4]
CCHO
H H
H
H
H
H
H
C C H
CH3
CCH
H H
H
H
H H
C C
O
CH3
CCH
H H
H
H
H
C C
O
O HCH3
CCH
H H
H
H
H
C C O
CH3
H
H
CC
O H H
H
C C H
CH3
H
H

A MODERN ANALYTICAL CHEMISTRY 47CHEMISTRY FOR THE IB DIPLOMA © CAMBRIDGE UNIVERSITY PRESS 2011
d Explain why nuclear magnetic resonance (NMR) is more useful than IR spectroscopy in distinguishing between propanal and propanone. [4]
3 The NMR spectrum of propan-2-ol is shown below.
4 3 2 1Chemical shift (δ) / ppm
a Draw the full structural formula of propan-2-ol. [1]
b Explain why there are three peaks in the NMR spectrum of propan-2-ol. [2]
c The integration trace is shown on the spectrum. Explain what information can be obtained from the integration trace. [2]
d i Draw the full structural formula of butan-2-ol. [1] ii State the number of peaks and the relative areas under the peaks in the NMR spectrum of butan-2-ol. [2]
4 Compounds may be identi� ed using a combination of spectroscopic techniques. The mass spectrum for a compound, Z, is shown below. Elemental analysis showed that Z contains C, H and O.
m/z200 40 50 60 7030
100
80
60
40
Rela
tive
abun
danc
e %
20
0
a Determine the relative molecular mass of Z. [1]
b Work out two possible molecular formulas for Z. [2]
c Deduce the formula of the fragments responsible for the peaks at m/z = 31 and m/z = 29. [2]
d The IR spectrum of Z shows a strong absorption band at about 3350 cm−1 but no absorptions in the range 1600–1800 cm−1. Explain what conclusions about the structure of Z can be drawn from these IR data. [2]
e On the basis of the information above suggest two possible structural formulas for Z. [2]

A MODERN ANALYTICAL CHEMISTRY 48CHEMISTRY FOR THE IB DIPLOMA © CAMBRIDGE UNIVERSITY PRESS 201148 CHEMISTRY FOR THE IB DIPLOMA © CAMBRIDGE UNIVERSITY PRESS 2011A MODERN ANALYTICAL CHEMISTRY
f The low-resolution NMR spectrum of Z is shown below.
4 3 2 1Chemical shift (δ) / ppm
Explain how information from this spectrum can be used to deduce the structural formula of Z and draw the structural formula of Z. [4]
5 An experiment was carried out to determine the amount of nickel present in a sample of shell� sh. 0.200 g of the shell� sh � esh was taken and heated with concentrated nitric acid. The sample was made up to a total volume of 100.0 cm3 with de-ionised water and the absorbance measured in an atomic absorption spectrometer at 232 nm. The absorbance of the sample was 0.320. The calibration curve for nickel at 232 nm is shown below.
0.4
0.5
0.6
0.3
0.2
0.1
0
Abs
orba
nce
0 20 40 60 80 100 120
Concentration / μg dm–3
a Explain how the calibration curve could be obtained. [2]
b Determine the amount of nickel that would be present in 1.00 g of shell� sh � esh. [3]
6 An experiment was carried out to separate and identify the components of a mixture of amino acids. The procedure involved the following steps:• a pencil line was drawn across the plate about 1 cm from the bottom• a sample of the mixture was placed on the pencil line and allowed to dry• the paper was placed in a container with a small amount of solvent at the bottom• the process was stopped when the solvent front was near the top of the plate; a pencil line was drawn to record
the position of the solvent front and the plate was allowed to dry• the plate was sprayed with ninhydrin.

A MODERN ANALYTICAL CHEMISTRY 49CHEMISTRY FOR THE IB DIPLOMA © CAMBRIDGE UNIVERSITY PRESS 2011
The TLC plate from this experiment is shown below.
solvent front
pencil line
X
Y
Z
a What does TLC stand for? [1]
b State the stationary phase and mobile phase in this experiment. [2]
c Explain why the plate was sprayed with ninhydrin. [2]
d Determine the Rf value for the spots on the plate. [2]
e The Rf values for some amino acids, recorded under identical conditions to the above experiment, are shown in the table.
Amino acid Rf
aspartic acid 0.10
serine 0.21
glycine 0.29
arginine 0.45
alanine 0.55
proline 0.64
tyrosine 0.75
valine 0.82
Determine the identity of the amino acids in the original mixture. [2]

A MODERN ANALYTICAL CHEMISTRY 50CHEMISTRY FOR THE IB DIPLOMA © CAMBRIDGE UNIVERSITY PRESS 201150 CHEMISTRY FOR THE IB DIPLOMA © CAMBRIDGE UNIVERSITY PRESS 2011A MODERN ANALYTICAL CHEMISTRY
7 There are several factors that a� ect the splitting of the d orbitals in transition metal complex ions. For each of the following pairs of ions explain which will have the greater energy gap between the two sets of d orbitals.
a [V(H2O)6]3+ and [V(H2O)6]2+ [2]
b [Ni(H2O)6]2+ and [Ni(NH3)6]2+ [2]
8 Some molecules absorb electromagnetic radiation in the UV–visible region of the spectrum.
a Explain what process goes on in a molecule when it absorbs ultraviolet radiation. [2]
b From the list below select the molecules that will absorb light in the ultraviolet region of the spectrum. Explain your choice. [2]
I II III
c i Draw the structures of penta-1,3-diene and penta-1,4-diene. [2] ii Predict and explain which of penta-1,3-diene and penta-1,4-diene will absorb the longer
wavelength of UV radiation. [3]
d One of the molecules shown below is coloured. Identify the coloured compound and explain why it is coloured. [4]
X Y
9 NMR spectroscopy is a very powerful tool in the identi� cation of organic compounds.
a Predict and explain the splitting pattern of the H atom marked in bold in the molecule below. [2]
HL
CH
H H
H
C C O
H
HH
CC
O H
H
CH3 CH H
H H
H
C C C
H
HH
C
H
CH3 H
H
HH
HC C C
H
C
CH3
HH
H
O
O
OH
OH
O H
H N
N
H O
H
C C
CH
H
O
H H
H H
H
H
C
C
H
C
H

A MODERN ANALYTICAL CHEMISTRY 51CHEMISTRY FOR THE IB DIPLOMA © CAMBRIDGE UNIVERSITY PRESS 2011
b A compound with the formula C4H10O has the NMR spectrum shown below. Draw the structural formula of the compound and explain your reasoning. [4]
4 3 2 1
Chemical shift (δ) / ppm
4 3 2 1
Chemical shift (δ) / ppm
c There are two esters that have the molecular formula C3H6O2. Draw the structural formulas of these esters and explain the di� erences between their NMR spectra. [5]
d There are four esters with the molecular formula C4H8O2. Draw the structural formulas of these esters and explain which one will give rise to the NMR spectrum shown below. [6]
10 Both GLC and HPLC may be used to separate complex mixtures using the principle of partition.
a Explain by reference to HPLC what is meant by partition. [3]
b A mixture of propane and pentane is to be separated by GLC. Explain which substance is likely to have the shorter retention time. [2]
c Carbamates are a class of compounds with reasonably high melting points that are used as insecticides. Explain whether GLC or HPLC would be more suitable for analysing the carbamates present in a sample of drinking water. [2]
HL