a model for representing the motivational and …
TRANSCRIPT

A MODEL FOR REPRESENTING THE MOTIVATIONAL AND CULTURAL
FACTORS THAT INFLUENCE MOBILE PHONE USAGE VARIETY
by
JUDITH ARNOLDINE VAN BILJON
Submitted in accordance with the requirements for the degree of
DOCTOR OF PHILOSOPHY
in the subject
COMPUTER SCIENCE
at the
UNIVERSITY OF SOUTH AFRICA
PROMOTOR: PROF P KOTZE
JOINT PROMOTOR: PROF G MARSDEN
NOVEMBER 2006

A model for representing the motivational and cultural factors that influence mobile phone usage variety ii
ABSTRACT Mobile phone usage involves the mobile phone, the telecommunications system, mobile phone users,
and the adoption and use of the system. Mobile communications is a complex and rapidly changing industry consisting of the hardware, software, network and business aspects. Mobile phone users are influenced by demographic, social, cultural and contextual factors that complicate the understanding of mobile phone usage.
Advances in technology and market competition drive the addition of new services and features. In contrast, human cognition and attention are more constrained and many users find it difficult to cope with the cognitive demands of mobile phone technology.
The aim of this study is to develop a model for representing the influence of motivational needs and cultural factors on mobile phone usage variety. The link between motivational needs and mobile phone usage variety, the cultural factors that influence mobile phone usage variety, as well as usage spaces as an approach to representing usage variety, are researched.
The research encompasses a literature study, structured interviews, a pilot study and a survey. The pilot study and survey yielded data about mobile phone usage of university students under the age of 30 in South Africa. The results from the statistical analysis were triangulated with the findings of the literature study and the observations made about mobile phone usage during this two-year period. A final survey was conducted to verify the model.
The contribution of this study is a mobile phone technology usage model (MOPTUM) for representing the motivational and cultural factors that influence mobile phone usage variety in such a way that users can use the model to express their mobile phone usage needs in non-technical terms while marketers and designers can use the model to convert the expressed user needs into the features required.
MOPTUM draws on concepts and models from sociology, computer-supported cooperative work, human-computer interaction and technology adoption models from the field of marketing. MOPTUM verifies some existing findings on mobile phone usage and then integrates and extends these existing models to provide a new model for understanding the motivational and cultural factors that influence mobile phone usage variety.
Key words: cultural factors, motivational needs, usage spaces, mobile phone usage, technology
adoption

A model for representing the motivational and cultural factors that influence mobile phone usage variety iii
ACKNOWLEDGEMENT I would like to express my sincere gratitude to the following people, each of whom made a unique contribution in helping me to complete this research. Professor Paula Kotzé for her unfailing support, supervision and dedication to quality. Professor Gary Marsden for his insight in mobile phone usage, wisdom and help. Arien Strasheim for her help with the statistical analyses and the interpretation of the results. Mélanie Malan for continued support as subject librarian and help with checking the references in the thesis. The Bit2Phid group under the leadership of Professor Alta van der Merwe. Dr Johan van Biljon for his practical support throughout the study and proofreading the thesis. Estelle de Kock as a friend, sounding board for ideas and help with the questionnaires and diagrams. My mother, Cathie Jacobs for always believing in me. My daughter Cathri and my son Henk for their amazing support, understanding and the way they make the world a better place. Pieter van der Westhuizen as friend and companion for his quiet wisdom and unfailing loyalty.

A model for representing the motivational and cultural factors that influence mobile phone usage variety iv
TABLE OF CONTENTS
ABSTRACT ................................................................................................................................................... ii ACKNOWLEDGEMENT............................................................................................................................. iii TABLE OF CONTENTS .............................................................................................................................. iv CHAPTER 1: INTRODUCTION................................................................................................................... 1 1.1 Introduction .............................................................................................................................................. 1 1.2 Background............................................................................................................................................... 2
1.2.1 Context and facets of context............................................................................................................ 4 1.2.2 Context of the mobile user ................................................................................................................ 5
1.2.2.1 Physical context ......................................................................................................................... 6 1.2.2.2 Social context............................................................................................................................. 6 1.2.2.3 Mental context ........................................................................................................................... 7 1.2.2.4 Technological context................................................................................................................ 7
1.3 Problem statement and purpose of study.................................................................................................. 8 1.4 Research question..................................................................................................................................... 8 1.5 Rationale behind the study ....................................................................................................................... 9
1.5.1 Personal rationale .............................................................................................................................. 9 1.5.2 Commercial rationale ........................................................................................................................ 9 1.5.3 Scientific rationale .......................................................................................................................... 10
1.6 Research design ...................................................................................................................................... 11 1.7 Research method .................................................................................................................................... 11 1.8 Scope and context of the study ............................................................................................................... 12 1.9 The significance and potential contribution of the study........................................................................ 13 1.10 Outline of the thesis.............................................................................................................................. 14 CHAPTER 2: MOBILE PHONE INFRASTRUCTURE............................................................................. 17 2.1 Introduction ............................................................................................................................................ 17 2.2 Evolution of cellular technology ............................................................................................................ 18
2.2.1 Developments up to now................................................................................................................. 18 2.2.2 Future developments ....................................................................................................................... 20
2.3 Mobile devices and services................................................................................................................... 21 2.3.1 Classification of mobile devices ..................................................................................................... 22 2.3.2 Design of the mobile phone handset ............................................................................................... 23
2.3.2.1 Industrial and mechanical design............................................................................................. 23 2.3.2.2 Hardware component ............................................................................................................... 24 2.3.2.3 Software component ................................................................................................................ 24
2.3.3 Mobile services ............................................................................................................................... 25 2.4 Mobile business practices....................................................................................................................... 26 2.5 Implications for mobile phone usage...................................................................................................... 27 2.6 Summary ................................................................................................................................................ 29

Table of Contents
A model for representing the motivational and cultural factors that influence mobile phone usage variety v
CHAPTER 3: THE MOBILE PHONE USER ............................................................................................. 31 3.1 Introduction ............................................................................................................................................ 31 3.2 Demographic factors .............................................................................................................................. 32 3.3 Motivational factors................................................................................................................................ 33 3.4 Social factors .......................................................................................................................................... 40 3.5 Cultural factors ....................................................................................................................................... 43
3.5.1 Cross-cultural diversity: Metamodels of culture............................................................................. 44 3.5.1.1 The Iceberg model ................................................................................................................... 44 3.5.1.2 The Onion model ..................................................................................................................... 44 3.5.1.3 The Pyramid model.................................................................................................................. 44 3.5.1.4 The Objective–subjective model.............................................................................................. 45
3.5.2. Cultural diversity: models of culture.............................................................................................. 45 3.5.2.1 Hall’s model of culture ............................................................................................................ 45 3.5.2.2 Victor’s model of culture ......................................................................................................... 46 3.5.2.3 Hofstede’s model of culture..................................................................................................... 47 3.5.2.4 Trompenaars’ model of culture................................................................................................ 48 3.5.2.5 Other contributions to researching culture............................................................................... 49
3.5.3 Organisational culture ..................................................................................................................... 49 3.5.4 Acculturation of artefacts ................................................................................................................ 50
3.5.4.1 Studies on culture and interactive systems .............................................................................. 53 3.5.4.2 Culture and mobile interaction ................................................................................................ 55
3.6 Summary ................................................................................................................................................ 57 CHAPTER 4: MOBILE PHONE ADOPTION AND USE.......................................................................... 58 4.1 Introduction ............................................................................................................................................ 58 4.2 Technology adoption .............................................................................................................................. 59
4.2.1 Technology Acceptance Model....................................................................................................... 59 4.2.2 Domestication ................................................................................................................................. 64 4.2.3 Innovation diffusion model ............................................................................................................. 65
4.3 Factors that influence mobile phone adoption and usage....................................................................... 68 4.3.1 Usability of mobile phones ............................................................................................................. 70 4.3.2 Cognitive load of mobile phone usage............................................................................................ 71 4.3.3 Selecting mobile phone features ..................................................................................................... 72 4.3.4 Consumer Segmentation ................................................................................................................. 75
4.4 Usage variety .......................................................................................................................................... 77 4.5 Summary ................................................................................................................................................ 81

Table of Contents
A model for representing the motivational and cultural factors that influence mobile phone usage variety vi
CHAPTER 5: RESEARCH CONTEXT ...................................................................................................... 84 5.1 Introduction ............................................................................................................................................ 84 5.2 Review of literature study ...................................................................................................................... 84
5.2.1 Findings from Chapter 2 ................................................................................................................. 84 5.2.2 Findings from Chapter 3 ................................................................................................................. 85 5.2.3 Findings from Chapter 4 ................................................................................................................. 86
5.3 Research focus for this study.................................................................................................................. 88 5.4 Summary ................................................................................................................................................ 89 CHAPTER 6: RESEARCH DESIGN AND METHODOLOGIES.............................................................. 91 6.1 Introduction ............................................................................................................................................ 91 6.2 Research philosophy............................................................................................................................... 91
6.2.1 The core goal of the research .......................................................................................................... 93 6.2.2 What does truth mean?.................................................................................................................... 93 6.2.3 What types of research instruments are appropriate?...................................................................... 94 6.2.4 How does and should the researcher affect the process of discovery? ........................................... 94
6.3 Research methods for HCI ..................................................................................................................... 95 6.4 Research methods for mobile technology .............................................................................................. 96
6.4.1 Physical context .............................................................................................................................. 97 6.4.2 Social and cultural context .............................................................................................................. 98 6.4.3 Marketing context ........................................................................................................................... 98
6.5 Research methods used in this study ...................................................................................................... 99 6.5.1 Literature review ............................................................................................................................. 99 6.5.2 Interviews...................................................................................................................................... 100 6.5.3 Survey ........................................................................................................................................... 100 6.5.4 Ethnography .................................................................................................................................. 101 6.5.5 Statistical analyses ........................................................................................................................ 102
6.6 Research design .................................................................................................................................... 102 6.7 Phase 2: Data gathering ........................................................................................................................ 104
6.7.1 Phase 2.1: Initial requirements gathering...................................................................................... 104 6.7.1.1 The goal of the interviews ..................................................................................................... 105 6.7.1.2 Developing the questionnaire ................................................................................................ 105 6.7.1.3 Selecting the test participants................................................................................................. 105 6.7.1.4 Conducting the interviews .................................................................................................... 106 6.7.1.5 Mini-survey............................................................................................................................ 107
6.7.2 Phase 2.2: Pilot study .................................................................................................................... 107 6.7.2.1 The goal of the pilot study ..................................................................................................... 107 6.7.2.2 Updating the questionnaire .................................................................................................... 107 6.7.2.3 Selecting the test participants ................................................................................................ 108 6.7.2.4 Conducting the pilot study..................................................................................................... 108

Table of Contents
A model for representing the motivational and cultural factors that influence mobile phone usage variety vii
6.7.2.5 Analysis of the pilot study data ........................................................................................ 108 6.7.3 Phase 2.3: Survey...................................................................................................................... 109
6.7.3.1 The goal of the survey ........................................................................................................... 109 6.7.3.2 Identifying information needed to answer the research question........................................... 109 6.7.3.3 Updating the questionnaire .................................................................................................... 109 6.7.3.4 Selecting the test participants................................................................................................. 110 6.7.3.5 Conducting the survey ........................................................................................................... 110
6.8 Phase 3: Propose model........................................................................................................................ 110 6.9 Phase 4: Evaluate model....................................................................................................................... 112 6.10 Summary ............................................................................................................................................ 112 CHAPTER 7: RESULTS AND ANALYSES ............................................................................................ 113 7.1 Introduction .......................................................................................................................................... 113 7.2 the initial requirements gathering ......................................................................................................... 113
7.2.1 Results from the interviews........................................................................................................... 113 7.2.2 Results from mini-survey.............................................................................................................. 115 7.2.3 Implications for the pilot study ..................................................................................................... 116
7.3 The pilot study...................................................................................................................................... 117 7.3.1 Results and analysis from the pilot study...................................................................................... 117 7.3.2 The implications of the pilot study for the survey......................................................................... 120
7.4 Profile of the survey participants.......................................................................................................... 121 7.4.1 Demographic profile ..................................................................................................................... 121 7.4.2 Infrastructure measures of mobile phone usage ............................................................................ 125
7.5 Cultural dimensions.............................................................................................................................. 126 7.5.1 Reliability analysis ........................................................................................................................ 126 7.5.2 Optimal scaling on responses concerning cultural dimensions..................................................... 130
7.6 Priorities on buying .............................................................................................................................. 146 7.7 Features ................................................................................................................................................ 147
7.7.1 Exploratory factor analysis for features ........................................................................................ 149 7.7.2 Optimal scaling for feature clusters .............................................................................................. 151
7.8 Correlation matrices ............................................................................................................................. 154 7.9 Discussion of the findings .................................................................................................................... 156
7.9.1 Is there a link between mobile phone usage variety and motivational needs? .............................. 157 7.9.2 What are the cultural factors that influence mobile usage variety?............................................... 157 7.9.3 Does mobile phone culture conform to the cultural context of the user?...................................... 157 7.9.4 Can usage spaces represent usage variety in a way that is usable and useful to mobile phone users, designers and marketers? ....................................................................................................................... 158 7.9.5 Can Marcus’s usage spaces model be supported by empirical evidence?..................................... 158
7.10 Summary ............................................................................................................................................ 158

Table of Contents
A model for representing the motivational and cultural factors that influence mobile phone usage variety viii
CHAPTER 8: PROPOSED MODEL ......................................................................................................... 159 8.1 Introduction .......................................................................................................................................... 159 8.2 Reviewing the findings......................................................................................................................... 160
8.2.1 Is there a link between mobile phone usage variety and motivational needs?.............................. 160 8.2.2 What are the cultural factors that influence mobile usage variety?............................................... 161 8.2.3 Does mobile phone usage conform to the cultural context of the user?........................................ 162 8.2.4 Can usage spaces represent usage variety in a way that is usable and useful to mobile phone users, designers and marketers? ....................................................................................................................... 163 8.2.5 Can Marcus and Chen’s usage spaces model be supported by empirical evidence? .................... 164
8.3 Proposed Model.................................................................................................................................... 164 8.3.1 Determining Factors...................................................................................................................... 167 8.3.2 Mediating Factors.......................................................................................................................... 168 8.3.3 Actual System Use ........................................................................................................................ 169 8.3.4 Usage Spaces................................................................................................................................. 170 8.3.5 Relationships between the components of MOPTUM.................................................................. 173
8.4 Comparing MOPTUM with other models related to mobile phone usage ........................................... 174 8.4.1 MOPTUM and TAM..................................................................................................................... 174 8.4.2 MOPTUM and the Kwon and Chidambaram model..................................................................... 175 8.4.3 MOPTUM and UTAUT................................................................................................................ 176 8.4.4 MOPTUM and usage space models .............................................................................................. 176
8.5 Summary .............................................................................................................................................. 177 CHAPTER 9: EVALUATION OF THE MODEL..................................................................................... 179 9.1 Introduction .......................................................................................................................................... 179 9.2 Verification........................................................................................................................................... 179
9.2.1 Demographic profile of the participants........................................................................................ 182 9.2.2 The influence of infrastructure and cost........................................................................................ 184 9.2.3 Relating the findings to the model ................................................................................................ 185
9.2.3.1 Correlations between needs and usage spaces ....................................................................... 185 9.2.3.2 Correlations between the components of the model .............................................................. 190 9.2.3.2 Relative importance of usage spaces ..................................................................................... 195 9.2.3.3 Usage intensity and usage breadth......................................................................................... 197
9.3 Validation ............................................................................................................................................. 198 9.3.1 Response: age group from 20 to 30 .......................................................................................... 199 9.3.2 Response: age group from 30 to 40 .......................................................................................... 199 9.3.3 Response: age group above 40.................................................................................................. 200 9.3.3 Combined responses on usage spaces....................................................................................... 200
9.4 Model Evaluation ................................................................................................................................. 201 9.4.1 Verifying MOPTUM against established criteria ......................................................................... 201
9.4.2 Verifying the overall structure of MOPTUM................................................................................ 202

Table of Contents
A model for representing the motivational and cultural factors that influence mobile phone usage variety ix
9.5 The Usefulness of MOPTUM............................................................................................................... 204 9.5.1 Application of MOPTUM within the same age group .................................................................. 204
9.5.1.1 Participant 1: Female ............................................................................................................. 204 9.5.1.2 Participant 2: Male................................................................................................................. 205
9.5.2 Application of MOPTUM to other age groups ............................................................................. 205 9.5.2.1 Users between the age of 15 and 20....................................................................................... 206 9.5.2.2 Users between the age of 60 and 70....................................................................................... 206
9.6 Summary and conclusion ..................................................................................................................... 206 CHAPTER 10: CONTRIBUTION............................................................................................................. 208 10.1 Introduction ........................................................................................................................................ 208 10.2 Overview ............................................................................................................................................ 208 10.3 Scientific contribution ........................................................................................................................ 208
10.3.1 Testing a theory........................................................................................................................... 209 10.3.2 Replicating a theory..................................................................................................................... 209 10.3.3 Extending findings....................................................................................................................... 210 10.3.4 Synthesizing theories from different fields.................................................................................. 210 10.4 Product contribution ........................................................................................................................... 212
10.4.1 Users............................................................................................................................................ 212 10.4.2 Marketers .................................................................................................................................... 213 10.4.3 Designers..................................................................................................................................... 213 10.4.4 Questionnaires............................................................................................................................. 213
10.5 Summary ............................................................................................................................................ 214 CHAPTER 11: REFLECTION AND CONCLUSION .............................................................................. 215 11.1 Introduction ........................................................................................................................................ 215 11.2 Summary of the research .................................................................................................................... 215
11.2.1 Research questions ...................................................................................................................... 215 11.2.2 Response to the research sub-questions ...................................................................................... 215 11.2.3 The MOPTUM model ................................................................................................................. 217
11.3 Reflection ........................................................................................................................................... 217 11.3.1 Methodological reflection ......................................................................................................... 2188
11.3.1.1 The qualitative versus the quantitative approach................................................................. 218 11.3.1.2 Questionnaire design............................................................................................................ 219 11.3.1.3 Questionnaire administration ............................................................................................... 219 11.3.1.4 Analyses............................................................................................................................... 220 11.3.1.5 Notation for representing the model .................................................................................... 220 11.3.1.6 Evaluation ............................................................................................................................ 220
11.3.2 Scientific reflection ..................................................................................................................... 221 11.3.3 Substantitative reflection............................................................................................................. 221

Table of Contents
A model for representing the motivational and cultural factors that influence mobile phone usage variety x
11.4 Conclusion.......................................................................................................................................... 222 11.5 Recommendations for further research............................................................................................... 222 11.6 Final reflection.................................................................................................................................... 223 LIST OF FIGURES.................................................................................................................................... 224 LIST OF TABLES ..................................................................................................................................... 225 REFERENCES........................................................................................................................................... 227 LIST OF ABBREVIATIONS .................................................................................................................... 244 Appendix 1 - Additional information on questionnaire design……………………………………………246 Appendix 2 - Questionnaire used for interviews ………………………………………………………253 Appendix 3 - Questionnaire used for pilot study …………………………………………………………263 Appendix 4 - Questionnaire used for survey …………………………………………………………….276 Appendix 5 - Questionnaire used for MOPTUM verification survey..………………………………...…284 Appendix 6 – Additional explanation of the statistical analyses used …………………………………... 293

A model for representing the motivational and cultural factors that influence mobile phone usage variety 1
CHAPTER 1: INTRODUCTION
1.1 INTRODUCTION This thesis concerns the motivational needs and cultural factors that influence mobile phone usage
variety. Usage variety is defined as the different applications for which, or the different situations in which, a product is used.
In order to consider mobile phone usage variety it is necessary to consider mobile phone usage. Mobile phone usage involves the mobile phone, the mobile telecommunications system, the mobile phone users, the adoption and use of the system [Pedersen, 2003].
Mobile communications is a complex and rapidly changing industry consisting of the hardware, software, netware (network aspects) and the bizware (business aspects) [Palen et al., 2000; Coen et al., 2002]. Mobile phone usage is influenced by infrastructure [Kleijnen et al., 2004; Meso et al., 2005] and various technical, legal and business factors [Tobin and Bidoli, 2006].
Mobile phone users are influenced by demographic, social, cultural, psychological and contextual factors, which complicate the understanding of mobile phone use [Kwon and Chidambaram, 2000; Ling and Yttri, 2002; Bina and Giaglis, 2005]. These factors interact with mobile phone and service design to influence the adoption and use of the mobile phone products [Buchanan et al., 2001; Salzman et al., 2001; Urbaczewski et al., 2002].
Advances in technology and market competition drive the addition of new services and capabilities. In contrast, human cognition and attention have limitations and many users find it difficult to cope with the information overload and the cognitive demands of mobile phone technology [Palen et al., 2000; Donner, 2004; Ziefle and Bay, 2005]. The result is that many mobile phone features are never used (for the purpose of this study, features signify any component, capability, service or function that a mobile phone offers to the user). This gap between the features available on mobile phones and the features actually used is the problem researched in this study.
The hypothesis is that a model for understanding the factors that influence mobile phone usage variety can be developed. This research focuses primarily on the role and influence of motivational and cultural factors in such a model.
• A motivational factor in the context of this research is defined as something that moves a person to use their phone.
• Cultural factors in the context of this research are defined as a culturally based influence on mobile phone usage behaviour.
The aim of the model is represent the motivational and cultural factors that influence mobile phone usage variety in such a way that users can use the model to express their mobile phone usage needs in non-technical terms, while marketers and designers can use the model to convert the expressed user needs into the features required.

Chapter 1 Introduction
A model for representing the motivational and cultural factors that influence mobile phone usage variety 2
Dix [1998] defines human-computer interaction (HCI) as ‘the study of people, computer technology, and the ways these influence each other’. Computer technology is defined as including a range of systems from desktop/laptop computers to large-scale computer systems, process control systems, as well as computing components embedded in smaller interactive electronic devices, such as mobile phones. HCI involves ‘the design, implementation and evaluation of interactive systems in the context of the user’s task and work’ [Dix et al., 2004:4] This finds an echo in the definition of interaction design by Preece et al. [2002] as ‘designing interactive products to support people in their everyday working lives’. Jones and Marsden [2005a] highlight the word ‘product’ in this definition to make the point that there is an incentive to market the device and also the word ‘everyday’ to acknowledge that the device will be used in various, often unforeseen activities. This study therefore falls within the field of HCI.
Although this study resides in the discipline of HCI primarily within the field of computer science and information systems, it is essentially multidisciplinary in nature, stretching beyond the boundaries of these disciplines to include issues from psychology, sociology and marketing.
The background to the research problem is given in section 1.2. The problem statement and purpose of the study are given in section 1.3. The main research question and sub-questions are defined in section 1.4, followed by the rationale from a personal, commercial and scientific perspective in section 1.5. A summary of the research design is given in section 1.6, while section 1.7 provides an overview of the research method. The scope and limitations of the study are discussed in section 1.8, the potential contribution in section 1.9 and the chapter is concluded by a discussion on the thesis layout in section 1.10.
1.2 BACKGROUND The first cellular phone call was made in April 1973 [Cooper, 2001; Coen et al., 2002] and since then
mobile telephony has seen astonishing technological advances from 1G (analogue voice) to 2G (digital voice, short messaging) up to 3G (digital voice and data), with rapid data transfer rates that open up possibilities like MMS and video streaming [Winters et al., 2004]. The technological development and advancement in network technology have been paralleled by the development in mobile handsets [Coen et al., 2002].
Mobile telephone evolution began with car-mounted devices and developed through the phases of transportable, hand-portable and pocket phones to the phase of palm phones where a mobile phone now fits into a person’s palm [Williams, 1995]. Since 1980, the mobile phone has undergone a transition from a technology-focused professional tool to a mass-market, consumer product that is an integral part of the daily life of hundreds of millions of people [Kiljander, 2004; Vlok, 2006]. The mobile technology market has widened to a global scale and consequently mobile devices are distributed throughout the world. According to the International Telecommunication Union (ITU), the global number of mobile service subscribers surpassed the number of landline telephone service subscribers in 2002 [ITU, 2003].
The mobile phone market is likely to grow even more due to shrinking hardware and service cost, the marketing model and constantly improving form factors of the cellular phone [Coen et al., 2002; Keshav,

Chapter 1 Introduction
A model for representing the motivational and cultural factors that influence mobile phone usage variety 3
2005]. The increased growth rate from 2000, along with an explosion of mobile service adoption in Africa, South America, and Asia is indicative of this [Jones and Marsden, 2005b; Lee et al., 2005a].
Mobile phone usage has been researched in different fields, for example, physical network infrastructure, computing capability, HCI, sociology, economics and marketing. Much research into mobile phone use has been technology-driven, departing from an assertion that the main problems are infrastructure-driven, i.e. the small keyboards, low-resolution, limited-size screen and unreliable mobile communication networks [Kristoffersen and Ljungberg, 1999; Dunlop and Brewster, 2002; Kankainen and Oulasvirta, 2003; Ruuska-Kalliokulju et al., 2001].
Economic factors also play a role. The rapid spread of mobile phone adoption and the fast-paced, dynamic nature of the mobile telephony industry has attracted the attention of the market researchers of the various network, handset and service providers [Kiljander, 2004; Winters et al., 2004; Keshav, 2005]. The research models in marketing, however, focus on adoption rather than use of the mobile phones, since mobile phone users are viewed as economic entities [Davis, 1989; Malhotra and Galletta, 1999; Kwon and Chidambaram, 2000; Urbaczewski et al., 2002; Teo and Pok, 2003a; Meso et al., 2005].
Research studies on mobile phones from the field of sociology consider users as social entities and study trends in using mobile phones also looking at post-adoption use [Pedersen, 2003; Ling, 2005]. They study how mobile phone use is affected by variables like age, gender, education, etc. [Nurvitadhi, 2002; Roth, 2002; Campbell and Russo, 2003; Lähteenmäki and Kaikkonen, 2005; Ling, 2005]. Economic, social and ergonomic factors compete to determine the features and functionality included in mobile phone design [Kleijnen et al., 2004]. As the mobile phone market reaches saturation point, economic forces stimulate the demand for new phones by adding features and services [Winters et al., 2004]. With time and increasing market saturation, features are added with increasing frequency, often leading to ‛feature creep’ [Norman, 1988] or ‘featuritis’ [Palen et al., 2000]. This phenomenon is driven by the need to increase the demand and desirability of the product, but in reality it often has the effect of reducing usability and tends to be counter-productive.
Designers are caught in a conflict between satisfying market requirements for adding features and discerning the right approach to boost phone value [Rondeau, 2005; Ziefle and Bay, 2005]. Mobile phones are marketed in terms of features or services (e.g. Phonescoop [2006]) and therefore users are left to match their anticipated and unarticulated uses of the phone to the lists of features available.
Furthermore, human attention is becoming a more precious resource than computing power since human attention is more constrained [Donner, 2004]. Mobile phone interaction requires a high level of cognition since the technology, interaction and business models all converge on the mobile interface [Vlok, 2006]. The situation is exacerbated by the fact that the mobile context of use is constrained in terms of physical resources (e.g. screen size and computing power), support (the mobile phone is often the only resource) and cognition (the user is often performing another task simultaneously) [Kiljander, 2004; Jones and Marsden, 2005a].
Looking at mobile phone design and the phenomenon of almost uncontrolled feature explosion, it is clear that the tension between human cognition and attention on the one hand, and increased mobile phone

Chapter 1 Introduction
A model for representing the motivational and cultural factors that influence mobile phone usage variety 4
services and functions on the other, needs to be managed. In order to address this tension, research into an understanding of what influences mobile phone usage variety is required.
Furthermore, as wireless communications and information management applications proliferate, an empirical understanding of practice and social impacts becomes relevant for researchers of mobile telephony, designers of mobile phones, marketers and end-users [Kankainen and Oulasvirta, 2003; Hagen et al., 2005]. Palen et al. [2000] state that although mobile telephony is rapidly becoming a feature of our culture, we do not understand its effects on communicative practice and behaviour, especially the interaction and co-evolution of technology and human activity.
Mobile phone usage means coping with multiple cultures and multiple contexts [Blom et al., 2005]. The concept of context, facets of context and the context of the mobile user necessitate a unique and comprehensive contemplation of user context as a prerequisite for understanding mobile phone usage. As noted above, the mobile context of use includes the physical, social, mental and technological contexts [Kiljander, 2004; Jones and Marsden, 2005a]. This multifaceted nature complicates mobile usage. In order to gain a better understanding of how context can and does influence mobile phone usage, the remainder of this section is devoted to a brief introduction of the concept of context in section 1.2.1 and highlights the facets of the context of the mobile user in section 1.2.2.
1.2.1 Context and facets of context
Context is ‘that which surrounds, and gives meaning to something else’ [Schilt et al., 2002]. The term focuses attention on the not necessarily visible yet determining forces that constitute and regulate the activity. In the field of HCI, Dey [2001] defines context as ‘any information that can be used to characterise the situation of an entity, where an entity is a person, place or object that is considered relevant to the interaction between a user and an application, including the user and the application themselves’.
Chen and Kotz [2000] provide a finer-grained definition by stating that context is ‘the set of environmental states and settings that either determines an application’s behaviour or in which an application event occurs and is interesting to the user’.
Lieberman and Selker [2000] consider context as everything that affects the computation, except the explicit input and output. They distinguish between a user model, a system model and a task model.
Context is a concept with many facets, including the interactional, temporal, organisational, social, spatial, physical, technological, informational and intentional aspects of context [Fitzpatrick and Bruza, 2000; Dourish, 2001]. The intentional and temporal aspects relate to the task attributes, while the technological aspect relates to the system model, can potentially change continuously and hence is dynamic. The organisational, social, spatial and physical aspects relate to the user model and are static [Fitzpatrick and Bruza, 2000]. The informational aspect relates to all of the models. The interactional context corresponds to the context defined by the intersection between changing user, task and system models, and is therefore essentially dynamic [Lieberman and Selker, 2000].

Chapter 1 Introduction
A model for representing the motivational and cultural factors that influence mobile phone usage variety 5
Although all interaction takes place in a particular context, facets of context will vary according to the application and its use. Mobile phone interaction therefore also takes place in a particular context, influenced by the various facets identified above. The context of the mobile phone user is briefly elaborated on in the next section.
1.2.2 Context of the mobile user
In a traditional computing environment both the user and the computing equipment are stationary, the use of the equipment often takes place in the same, familiar location and the social context remains constant. In a mobile context, the user and the equipment can be mobile and the surroundings may change constantly. It is not possible to foresee where, when and by whom the product will be used within the mobile context. This opens up fundamental differences in the context of use between the traditional computing environments and information appliances such as mobile telephones [Iacucci, 2001]. Mobile devices are often thought of as tiny versions of personal computers, but they have many unique properties that make interacting with them quite different from building interfaces for desktop PCs. Ruuska-Kalliokulju et al. [2001] distinguish mobile devices from stationary office-based systems in the following ways:
• The physical, social, and cultural contexts of a device influence the way in which the device is operated via its user interface.
• The ability to use the device anywhere and anytime is one of the major factors that distinguish mobile personal devices from stationary office-based devices.
• Applications and services are the main thrust from the end-user perspective.
• Communication and personal computing devices get more task-specific, increasing the need for inter-device communication as the only way to simplify the task of the user in the most transparent way possible.
• Personalization of mobile devices is a central design issue, though they note that it has not been thoroughly explored.
Given the complexity of making telephone technology context aware, Brown and Randell [2004] warn about the likelihood that context sensitive technology will fail sometimes and therefore they recommend that it should be used defensively, i.e. only where mistakes are tolerable. Jones and Marsden [2005a] distinguish physical context, the social context and the technological context of the mobile user from an HCI perspective. Kiljander [2004] adds the mental context of the mobile user to these three. These four aspects of the mobile phone context are briefly discussed below and the ‘context’ of this study is delineated.

Chapter 1 Introduction
A model for representing the motivational and cultural factors that influence mobile phone usage variety 6
1.2.2.1 Physical context
The physical context denotes the physical constraints of the usage environment [Kiljander, 2004; Jones and Marsden, 2005a]. We need to consider both the physical limitations of the device as well as the limitations of the surrounding physical context. Screen size, memory, storage space, input and output facilities are more limited in handheld computers [Kristoffersen and Ljungberg, 1999; Brewster, 2002; Young, 2003] while sound output quality is often very poor with restricted voice recognition on input [Dunlop and Brewster, 2002], [Brewster, 2002]. While screen sizes will improve in resolution and colour support, they will remain small due to the need for portability [Dunlop and Brewster, 2002].
The mobile scenario includes deployment in a wide range of physical environments to support users in diverse tasks [Coen et al., 2002; Kaasinen, 2003]. The physical context may vary in terms of location, illumination, background noise, temperature and weather and even vary continuously. Users may be mobile during the task, which means that they may not be able to look at the screen continuously. They may have to operate the device with only one hand and possibly no hands as with mp3 players or hands-free phone sets [Young, 2003]. The working environment of the mobile user is often far from ideal and they are not guaranteed access to other sources for supporting the task (e.g. reference manuals) as the mobile device may be their only resource at that moment [Dunlop and Brewster, 2002; Blom et al., 2005]. Physical context is not researched in this study.
1.2.2.2 Social context
Social context concerns the social interaction involved and enabled by using the mobile device [Kiljander, 2004; Jones and Marsden, 2005a]. Mobile phones can be used anytime and almost anywhere, allowing people to converse according to choice rather than according to location [Geser, 2004]. When using a mobile phone a person is simultaneously in two spaces - the physical space they occupy and the virtual space of the conversation [Palen et al., 2000]. This introduces new issues of privacy and discretion as interaction can take place in public surroundings or other places where it may be inappropriate to communicate [Nickerson and Isaac, 2006]. For example, services such as SMS enable people to interact socially in previously unknown ways, i.e. a person may be sending and receiving text messages while attending a meeting or be tempted to take a call during such a meeting.
Mobile users need other people to communicate with and therefore mobile phone usefulness is based on the social network [Urbaczewski et al., 2002]. Mobile communication can utilize only a narrow bandwidth of the total human communication spectrum [Kiljander, 2004], but these limitations are steadily being overcome by innovations, e.g. adding visual images of the conversationalist and the development of sensory fabrics that make tactile feedback possible [Swallow and Thompson, 2001; Schiphorst, 2006].
Social context, which encompasses the cultural context, is the focus of this study.

Chapter 1 Introduction
A model for representing the motivational and cultural factors that influence mobile phone usage variety 7
1.2.2.3 Mental context
The mental context relates to aspects of the user’s understanding of the mobile handset usage model [Kiljander, 2004]. Mobile phones are acquired by a widespread population of users who will not normally have any formal training in operating them and consider them as devices to be used rather than computers to be maintained [Dunlop and Brewster, 2002; Vlok, 2006]. Furthermore, device vendors consolidate multiple functions into a single device. For example, mobile phone manufacturers have added features such as instant messaging services, MP3 playback, web browsing and e-mail, all of which add mental complexity to the activity of using the phone [Palen and Salzman, 2001; Young, 2003; Ziefle and Bay, 2005].
The mobile user has to handle interleaving of multiple activities and multiple public faces previously unknown when only a landline or a stationary computer was used [Preece et al., 2002]. Operating a mobile phone while multitasking requires a high level of cognition and meta-cognition. For example, the user may be expected to handle an incoming call while driving and being engaged in a conversation, which means their cognitive capacity and attention is reduced.
Cognitive demands are exacerbated due to physical constraints on size, bandwidth and processing power, which restricts the communication bandwidth and places extra demands on the user’s attention [Hyyppä et al., 2000]. The same social, physical and artefactual goals and resources that motivate and enable mobility, cause cognitive resource depletion which restricts interaction with the mobile device [Qualasvirta et al., 2005]. For example, performing a familiar task such as web browsing in a mobile context is seriously constrained by resource competition [Qualasvirta et al., 2005]. The competing task may demand a high level of visual and cognitive attention, meaning that the users' task is mainly conducted in the world not on the device [Følstad and Rahlff, 2005].
In the world of mobile User Interface (UI) design there is no single de facto style as there is for personal computers; designers develop and maintain brand-specific UI styles [Ketola, 2002]. Changing from one UI style to another can be difficult for the user as they have to learn new ways to perform familiar tasks, i.e. adapt to a new style [Kiljander, 2004].
1.2.2.4 Technological context
The technological context refers to the mobile infrastructure including the networks available, services provided and features of the mobile device [Jones and Marsden, 2005a]. For example, a cellular phone with Internet access and broadband allows the user more comprehensive access when travelling, thus providing a totally different technological context.
The development and implementation of cellular communication infrastructure varies across countries, which means the technological context is determined by the network as well [Nurvitadhi, 2002; ITU, 2006]. Network coverage and communication bandwidth is variable across national boundaries, can make communication or network service access inconveniently slow and unreliable, or completely impossible

Chapter 1 Introduction
A model for representing the motivational and cultural factors that influence mobile phone usage variety 8
[Tobin and Bidoli, 2006]. Infrastructural barriers to communications access are especially prevalent in developing countries [Adomi, 2006; Uzoke et al., 2006].
Technological context as such is not considered, although the effect of technological context on mobile phone usage variety is controlled by selecting participants from within the same technological context.
1.3 PROBLEM STATEMENT AND PURPOSE OF STUDY The research problem is best encapsulated by providing a scenario. Consider the scenario of a person
selecting a mobile phone for purchasing. The person is confronted with a multitude of mobile devices to choose from, while each device offers a variety of services and features. In order to make an optimal decision, the consumer has to prioritize and weigh up different technological, economic, social and personal factors. Tension arises between the ever-expanding selection of features and services, and the human cognitive capacity to gather and process information.
Once the person starts using the phone, the tension between what is available and what is selected for use continues. There are various functions and services the person can use but they may be inhibited by cost, system capability, usability, usefulness and their knowledge. There is an immense and sustained effort to increase the number of features and functions on the mobile phone [Coen et al., 2002; Ziefle and Bay, 2005] and yet most people do not use more than 20% of all the features and functions they currently have on their mobile phones [Kiljander, 2004; Vlok, 2006].
If the factors that influence mobile phone usage can be identified, this knowledge could support bridging the gap between user expectations, marketing aspirations and design considerations, which currently seem to be feature and functions-driven. Against this background the research problem is formulated into one main research question and four subquestions in order to disentangle the issues and differentiate between the questions.
1.4 RESEARCH QUESTION The aim of this thesis is to address the following research question: What are the components of a
model to represent the influence of motivational needs and cultural factors on mobile phone usage variety? When considering motivational needs it is necessary to define the concept of a need. For the purpose of
this study, a need is defined as something that moves a person to action. This means that motive or desire can be substituted for need without losing meaning. While this approach may be too coarse for psychologists in general [Lindgren, 1969; Steverink and Lindenberg, 2006], it is suitable for this study in the context of mobile phone usage variety.
Culture encompasses more than ethnic culture and includes organisational, work and social culture [Boyancigiller and Adler, 1995]. For the purpose of this study, Hofstede’s [Hofstede, 1995] five cultural dimensions were used as point of departure, after the pilot study only uncertainty avoidance and

Chapter 1 Introduction
A model for representing the motivational and cultural factors that influence mobile phone usage variety 9
individualism/collectivism were retained for further investigation while technological advancement was added. These three dimensions, listed in Baumgartner’s [2003] ranked set of 29 cultural dimensions, were selected for further investigations because they were the top ranked dimensions which seemed measurable and relevant to mobile phone usage. Motivational needs and cultural factors are discussed in Chapter 3.
As stated in section 1, mobile phone usage is influenced by various technical, legal, commercial, infrastructural, psychological, social and cultural factors [Kwon and Chidambaram, 2000; Tobin and Bidoli, 2006]. This study concerns only the motivational and cultural factors that influence mobile phone usage and therefore the technical, legal, commercial and psychological factors will not be discussed. Technical factors and infrastructure are discussed in Chapter 2 since they directly influence usage variety.
This study focuses on user needs and from that perspective the main research question can be decomposed into the following sub-questions:
• Does infrastructure influence mobile phone usage?
• Do cultural factors influence mobile phone usage?
• How can motivational user needs be related to mobile phone use?
• How can usage variety, i.e. the different applications for which a product is used or the different situations in which a product is used, be described?
1.5 RATIONALE BEHIND THE STUDY The rationale for doing this study is now discussed by considering it from a personal, commercial and
scientific perspective.
1.5.1 Personal rationale
Knowing what is possible, what is probable, what is essential and what is advisable epitomises the tension between technological development and human cognitive management of the advances in mobile technology. The difference between what people are potentially able to do with their mobile phones and what they actually do, fascinated me as a computer scientist. New features and functions are continually added and therefore this gap between what people have and what they use will widen unless a way can be found to design more appropriate phones and guide people in selecting them.
1.5.2 Commercial rationale
Mobile telephony is commercially important: ‘It is likely that the reliance of users on computing services will soon rival, if not surpass, their reliance on public utilities.’ [Rappa, 2004:40]. Helping people to use their mobile phones optimally and supporting designers in designing mobile phones according to

Chapter 1 Introduction
A model for representing the motivational and cultural factors that influence mobile phone usage variety 10
user needs has commercial value for both users and designers. This study acknowledges adoption as a prerequisite for use but focuses on mobile phone usage.
The goal of helping people to find the most appropriate phone can be in conflict with the commercial goals of handset providers who provide incentives to salespeople to sell a specific phone rather than find the optimal phone for the client. The goal of research is to seek the truth and present it fully and unambiguously. As this research document focuses on human-computer interaction, one does not wish to enter into political and commercial debates, but acknowledges that there may be a conflict of interest between the user’s needs and the marketing campaigns of the vendors.
1.5.3 Scientific rationale
‘Mobility, immediacy and instrumentality are key reasons for the use of mobile phones and supported by secondary factors of sociability and affection’ [Han Sze Tjong et al., 2003]. This statement supports the fact that mobile phone usage is a complicated, multifaceted phenomenon at the intersection of technology and humanity.
The social-technical gap is described as the divide between the social requirements of computer- supported co-operative work and what is supported technically [Ackerman, 2000]. Industry corporations have used traditionally quantitative market research methods like surveys to investigate people’s needs and preferences [Pedersen, 2003; Hagen et al., 2005]. These quantitative methods are effective in quantifying customers’ preferences among existing solution options, but they cannot really assist in the discovery of needs that have not been articulated. In reaction to this limitation of quantitative methods, qualitative methods like ethnography have been adopted from sociology and anthropology [Millen, 2000]. These methods provide contextualised information on behaviour, interactions and environmental conditions from the perspective of the user.
Unfortunately this does not necessarily expose opportunities for design either, since the qualitative methods used in mobile phone usage tend to be more descriptive than prescriptive [Kankainen and Oulasvirta, 2003; Pedersen, 2003]. Kankainen and Oulasvirta [2003] believe that studying needs related to information technology can provide value beyond the development of a single product. Studying current social interaction theories and HCI is useful but in order to understand what influences mobile use, we have to understand how mobile phone usage deviates from current models of social interactions [Humphreys, 2005]. To study mobile phone usage we need to go back and consider what the psychological, social and cultural factors are that could influence the mobile user [Buchanan et al., 2001].
Though it is impossible to investigate all the factors involved in mobile phone usage within the confines of this thesis, the scientific rationale behind the study is the need for a model to bridge the gap between the rigid, technical information that describes mobile phones and the flexible, nuanced context of human activity.

Chapter 1 Introduction
A model for representing the motivational and cultural factors that influence mobile phone usage variety 11
1.6 RESEARCH DESIGN This research problem falls within the specialization of HCI. This research is correlational and
observational; observing what is naturally happening without interfering with it [Field and Hoyle, 2005]. Having identified the mobile phone, the user and then the phenomenon of human-computer interaction as the main entities in this study, the mobile phone is investigated by looking at the evolution of mobile phones and services, the components of mobile phones and the limitations of mobile phones that could affect mobile usage. The research paradigm is based on the interpretivist methodology as I view truth as constructed in the context of mobile phone usage and I acknowledge the influence of the situation and the researcher. Nevertheless, this does not exclude the use of positivist methods for addressing specific questions.
Fraser [2003] argues for using both interpretivist and positivist methods in the same study and notes that if genuine causal relationships exist, they should be expressed and studied. For example, concepts such as age, gender, mobile phone usage frequency, etc., can be measured and analysed quantitatively and this adds value to the model without detracting from the epistemology. However, gathering information on people’s needs regarding mobile phones had to be approached qualitatively in order to obtain new input.
1.7 RESEARCH METHOD The study started with a literature study to find the issues relevant to using mobile phones. In order to
achieve a holistic view of mobile phone usage, a comprehensive set of factors was considered, including demographic factors, cultural dimensions of the user and the features and services of the mobile phone.
The cultural perspective was considered by starting with Hofstede’s dimension [Hofstede, 1995], which was later adapted according to Baumgartner’s [2003] set of cultural dimensions.
The technology adoption model (TAM) developed by Davis [1989] and a model for the adoption of mobile phones developed by Kwon and Chidambaram [2000] are used as references for the factors that could influence mobile phone usage, while bearing in mind that this study is about usage, not adoption.
The variety of uses is based on the usage spaces proposed by Marcus and Chen [Marcus and Chen, 2002a] and Ling and Yttri [1999], and refined and extended by the findings of the survey. The usage spaces are then incorporated into the model to explain mobile phone use according to user needs.
Existing literature on mobile phone usage, questionnaires, information on mobile devices, mobile users and mobile interaction were used as the basis for the initial questionnaire. The aim of this study was to capture data on mobile phone adoption, priorities on selecting a phone, attitudes about products, features and services, and feature frequency use.
The initial questionnaire was tested in structured interviews involving nine participants. Based on the observations and participants’ feedback, the questionnaire was adapted and the second version was used in a pilot test conducted with 40 students at a university in South Africa during October 2005. Using the

Chapter 1 Introduction
A model for representing the motivational and cultural factors that influence mobile phone usage variety 12
qualitative and quantitative results from the pilot test, the questionnaire was updated for the survey that was conducted with 138 participants during February 2006. The data captured there was analysed using reliability analyses, exploratory factor analyses, optimal scaling and correlation matrices.
Based on a triangulation between the qualitative and the quantitative findings up to that point and the continued literature study, a model for understanding the factors that influence mobile phone usage was proposed. This study combines models of ICT (Information and Computer Technology) adoption, namely TAM [1989] and the model for mobile phone adoption [2000], with research from behavioural studies (specifically domestication research) and models from psychology on motivational needs. Based on the integration of these models and the findings from this study, a model aimed at a better understanding of the factors that influence mobile phone usage is proposed - the Mobile Phone Technology Usage Model (MOPTUM). This approach is supported by Pedersen [2003], who advocates ‘combining theories and models of traditional ICT adoption research with findings from behavioural studies of mobile service adoption’.
The model was verified qualitatively during July 2006 with the participants in the original interviews and quantitatively during a survey with 59 participants from Monash University (the same university where the pilot study was done). The model was also evaluated by those who participated in the original interviews. Ethnography was not part of the research design but being immersed in a society where mobile phone use is prevalent, facilitated automatic naturalistic observations that aided the qualitative interpretation of the quantitative findings.
The participants in both the qualitative and the quantitative evaluations verified the factors represented in the model and found the model useful and usable in expressing their specific needs as regards mobile phone use. This model for representing the motivational and cultural factors that influence mobile phone usage variety is my contribution to the body of scientific knowledge.
Based on the evaluation of the model conducted with the original participants from age groups older than 30, the model has the potential for generalisation to other age groups. It may be more useful to older age groups, who were found to have more problems in selecting and using mobile phones.
1.8 SCOPE AND CONTEXT OF THE STUDY The scope of this study was delimited within the concept of context in section 1.2. The scope and
context of the study are elaborated upon in this section. This study considers the human perspective, which includes the cultural perspective, the usability perspective where the focus is on ease of use and usefulness, and the variety of uses as represented by mobile usage spaces. The study does not focus on the system perspective but acknowledges the complexity of the mobile telephony system and considers how this influences the context of use.
Within the domain of investigating the motivational needs and cultural factors that influence mobile phone usage variety, the following factors were not dealt with as major concerns in this study:

Chapter 1 Introduction
A model for representing the motivational and cultural factors that influence mobile phone usage variety 13
The discussion about where the borders lie between culture and personality and culture and human nature is continuing among social scientists [Duchatelet, 2001]. While acknowledging the relationship between cultural dimensions and personality factors, the latter are not considered.
Rather than look at group behaviour in using mobile phones, this work focuses on individual user interaction with a mobile phone.
The study reported in this thesis was done in South Africa from February 2005 until November 2006. The pilot study and the survey were based on self-reporting questionnaires, a method that has limitations since various factors can influence the validity of the information given. However, the observations and structured interviews in the first phase, and continued naturalistic observations of the way people use mobile phones, throughout the two years of the study, served to balance some of the problems associated with self-reporting.
Youth and education are factors that have been found to increase mobile phone usage [Rice and Katz, 2003; Tamaru et al., 2005]. A study conducted in 2000 among Norwegian teenagers found that almost 90% of 20-year-olds had a mobile phone while the percentage was lower for younger age groups [Ling, 2001]. Therefore it was decided to target young students above the age of 20 since they were likely to have a mobile phone. Based on the findings of the interviews discussed in Chapter 6, people under the age of 30 were more interested in exploring their mobile phone capability and using services on the phone.
This makes the model applicable to modelling to the use of university students below the age of thirty in South Africa. However, the qualitative observations throughout and the qualitative evaluation of the model included groups from 20 to 50 years of age and therefore the model can be generalised to other age groups to some extent. The model represents mobile phone usage spaces but it is dependent on user input to determine which spaces are appropriate for the specific user, thereby supporting customisation and generalisability.
1.9 THE SIGNIFICANCE AND POTENTIAL CONTRIBUTION OF THE STUDY
The contribution made by this study is the mobile phone technology usage model (MOPTUM), which helps explain the motivational needs and social factors that influence mobile phone usage variety. The complex, fast-paced, continually evolving nature of mobile telephony leads to information overload and makes it difficult to comprehend the mobile scenario, and therefore a generic model to explain mobile phone use is required. The MOPTUM model contributes towards identifying and verifying factors that influence mobile phone use. It draws on research from HCI (usage spaces and usability), sociology (domestication theory), psychology (basic human needs) and marketing (technology adoption) to make the following specific contributions:

Chapter 1 Introduction
A model for representing the motivational and cultural factors that influence mobile phone usage variety 14
• MOPTUM links mobile phone usage to motivational human needs as described by Maslow [1954], Herzberg [1968] and the Institute for Management Excellence [1997], amongst others, as discussed in Chapter 3.
• The study integrates usage space models from sociology as proposed by Ling and Yttri [Campbell and Russo, 2003] with those proposed by Marcus [Marcus and Chen, 2002a] in the domain of HCI. The MOPTUM model also refines and extends the integrated model of usage spaces.
• No empirical evidence to support Marcus’s model could be found to support the spaces proposed by Marcus [Marcus and Chen, 2002a] and therefore this study contributes by verifying the existence of the spaces empirically.
• In order to model the bigger picture of the factors that influence mobile phone usage, the usage space model is integrated into a model based on TAM [Davis, 1989] and the model for mobile phone adoption [Kwon and Chidambaram, 2000].
• MOPTUM provides a basis for bridging the gap between the fields of psychology, sociology, marketing and HCI in mobile phone research as it incorporates models from these fields.
• MOPTUM provides research opportunities in verifying the model and testing its generalisability to other age groups and/or other countries. Furthermore, the fact that these usage spaces are related to motivational human needs, provides an improved understanding of user needs. Focusing on user needs gives mobile phone designers a motivational needs-based alternative to the current feature-driven approach. Further research is needed to verify the usefulness of the approach based on motivational needs.
• MOPTUM proposes new usage spaces and features related to these spaces. The usage spaces and correlation of these features with the usage spaces warrants further research.
1.10 OUTLINE OF THE THESIS The outline of the thesis is depicted in Figure 1.1. The literature studied in investigating mobile phone
usage is discussed in Chapters 2, 3 and 4. Chapter 5 provides an overview of the findings from Chapters 2, 3 and 4 and the reformulation of the research questions.
The research design and execution are described in Chapter 6. The results and the findings of the requirements gathering, as well as the pilot study, are presented in Chapter 6 as these findings determined the design of the survey. The analyses of the survey results are discussed in Chapter 7.
The proposed model is discussed in Chapter 8. The verifications of the model are discussed in Chapter 9 where the study is also summarised. The contribution of the study, the conclusions and reflection on the study are described in Chapter 10. A reader who is not interested in the background literature study, the research execution and analyses of the data may follow the path from Chapter 1 to Chapter 5 and then skip to Chapters 8, 9 and 10. The chapters contribute the following:

Chapter 1 Introduction
A model for representing the motivational and cultural factors that influence mobile phone usage variety 15
• Chapter 1 provides an overview of the thesis and the contributions of the other chapters.
• Chapter 2 provides an overview of mobile phone infrastructure, which involves the system component, the service component and the marketing component. The pace of the technology push associated with mobile telephony, along with customer pull for new products, continues to push new technologies into the market [Winters et al., 2004]. Cut-throat competition and fast-paced innovation spawn innovative marketing models that push novel offerings of services and features [Coen et al., 2002; Vlok, 2006]. The current scenario in mobile telephony is summarised from a system perspective in Chapter 2, followed by a reflection on how the complex, rapidly evolving nature of this industry influences mobile phone use.
• Chapter 3 contains a brief consideration of the mobile user as a person with psychological, social and cultural attributes that could influence mobile phone usage. The influence of demographic variables such as age, gender and education on mobile phone usage is considered and then I look at motivational needs and how they are influenced by social and cultural factors.
• Chapter 4 deals with factors that influence the adoption and use of mobile phones. Models of mobile phone adoption are discussed, followed by factors that influence mobile phone adoption and use.
• Chapter 5 gives an overview of the mobile phone usage scenario including shortcomings, opportunities and challenges identified in Chapter 2, Chapter 3 and Chapter 4 and the influence of the mobile context on mobile phone usage.
• Chapter 6 provides an overview of research methodologies, after which the research design and data gathering done for this study are discussed. Information on questionnaire design and the actual questionnaires are available as follows:
o Appendix 1 covers questionnaire design in more depth.
o Appendix 2 contains the questionnaire for the interviews.
o Appendix 3 contains the questionnaire for the pilot study.
o Appendix 4 contains the questionnaire for the survey.
o Appendix 5 contains the questionnaire for the verification survey.
o Appendix 6 provides more details on the statistical methods.
• Chapter 7 deals with the results and analyses of the results.
• The mobile phone technology usage model (MOPTUM) proposed for explaining mobile phone use is discussed in Chapter 8.
• Chapter 9 deals with the verification and validation of the model and also discusses the usefulness of the model in converting user requirements to required mobile phone features.
• A summary of this study and its contribution from a product and scientific viewpoint is provided in Chapter 10.

Chapter 1 Introduction
A model for representing the motivational and cultural factors that influence mobile phone usage variety 16
• Chapter 11 contains the conclusion and reflection on the research as well as the future research opportunities identified.
Figure 1.1: Thesis map
Chapter 9:
Evaluation of the model
Chapter 7 :
Results and analyses
Chapter 6:
Research design and methodologies
Chapter 5:
Research context
Chapter 3:
The mobile phone user
Chapter 4:
Mobile phone adoption and use
Chapter 2:
Mobile phone infrastructure
Chapter 8:
Proposed model
Chapter 10:
Contribution
Chapter 1:
Introduction
Chapter 11:
Reflection and conclusion

Chapter 2 Mobile phone infrastructure
A model for representing the motivational and cultural factors that influence mobile phone usage variety 17
CHAPTER 2: MOBILE PHONE INFRASTRUCTURE
2.1 INTRODUCTION The aim of this thesis is to address the following research question: What are the components of a
model to represent the influence of motivational needs and cultural factors on mobile phone usage variety? The first sub-question addresses the issue of mobile phone infrastructure: Does infrastructure influence mobile phone usage? This chapter provides the theoretical foundation for this sub-question by addressing the issue of mobile phone infrastructure.
The basic premise of mobile communication is that one can take the communication device with you. To meet this requirement, mobile telephony infrastructure consists of an integrated system of technologically and socially derived components, namely hardware, software, netware and bizware [Palen et al., 2000; Coen et al., 2002; Jones and Marsden, 2005a]:
• Hardware refers to the physical device, also called the ‘mobile phone’ or ‘handset’.
• Software refers to all the system and applications programs that enable the device to function.
• Netware comprises of the network-related services provided by the network operators.
• Bizware refers to the business practices of the service provider including the call plan choices, etc.
All these components converge on the mobile phone interface where the user has to deal with continually evolving technical specifications for the handset, transmission specification standards and the interaction models of network [Jones and Marsden, 2005a] and marketing service providers [Ketola and Röykee, 2001; Jarvenpaa et al., 2003; Vlok, 2006].
In studying the motivational and social factors that influence mobile phone usage variety it is necessary to consider the components of mobile phone infrastructure since they may influence mobile phone usage variety. Mobile phone infrastructure and services encompass many technologies and protocols that are beyond the scope of this study and consequently only a high-level overview of the components most relevant to mobile phone usage from the user perspective will be given.
Looking at mobile communication technology, Yen & Chou [2000] distinguish between transmission technology (part of netware) and platform technology (hardware and software), where the latter refers to the handset, battery and charger. Cellular technology is the transmission technology most frequently used in mobile phones [Williams, 1995; Walters and Kritzinger, 2000; Coen et al., 2002] and therefore section 2.2 looks at the evolution of mobile telephony from the first cellular phones in 1970 [Williams, 1995; Agrawal and Famolari, 1999; Kiljander, 2004; Vlok, 2006] up to the 3G standard and beyond.
This is done to demonstrate the rapidity with which mobile telephony developed. The continuous evolution of mobile telecommunication capabilities facilitates innovations in platform technology relating to the mobile handset and mobile services, and influences the business models used [Coen et al., 2002; Winters et al., 2004], all exacerbating the complexity the user has to deal with.

Chapter 2 Mobile phone infrastructure
A model for representing the motivational and cultural factors that influence mobile phone usage variety 18
The platform component is examined in section 2.3 by looking at the classification of mobile devices, the design of mobile phones and mobile services. In section 2.6 we consider the concept of the marketing model (bizware) as applicable to mobile phone usage. The implications of all of these issues on mobile phone usage are discussed in section 2.7. The chapter is concluded in section 2.8 by a summary of the main lessons learnt and the implications of these for the research reported on in this thesis.
2.2 EVOLUTION OF CELLULAR TECHNOLOGY In order to gain an appreciation of the rapid developments in cellular technology, a brief overview is
given in section 2.2.1 of the main developments in the cellular phone industry to date. Section 2.2.2 makes the point that the current fast-paced development is likely to continue by considering some predictions regarding future mobile phone usage.
2.2.1 Developments up to now
The telecommunications industry in general started 125 years ago when Alexander Graham Bell made his first call while the wireless industry started 105 years ago when Marconi made his first transatlantic call [Cooper, 2001]. The first radiotelephone service was introduced in the United States at the end of the 1940s [Williams, 1995; ITU, 2006]. In 1956 the Swedish Company LM Ericsson introduced the first automatic mobile phone system in Sweden. The phone weighed 40 kilos and cost as much as the car in which it was mounted [Adner, 2003].
The provision of wireless communications was born when Bell Systems developed the cellular concept in the late 1960s and early 1970s [Yen and Chou, 2000]. The cellular mobile telephone dates back to the late 1970s and early 1980s [Agrawal and Famolari, 1999; Kiljander, 2004]. The first call on a portable cellular device was made in April 1973 by Martin Cooper, General Manager of Motorola to his rival, Joel Engel, Head of Research at Bell Laboratories at the time [Cooper, 2001; Coen et al., 2002].
Over the past 20 years the performance, functionality and capability of mobile phones have increased, while the size has decreased by 94% and the weight by 93% [Winters et al., 2004]. ‘In the late 70s and early 80s a cellular phone was contained in a handbag the size of a large women’s purse, had limited range, connectivity to an almost nonexistent wireless network, sold for $1000 and was owned by a select few whose income was well beyond the dream of most average American families’ [Winters et al., 2004]. Since 2004, the average cellular phone has been smaller than a deck of cards, capable of connecting to a well-established wireless network in most parts of the world and often comes ‘free’ with a service contract [Winters et al., 2004].
The mobile telephone evolution may have started from the car-mounted devices but currently mobile wireless communication devices also include notebook computers, personal digital assistants, pen-based computers, palm-top computers, and portable data collection and processing devices, apart from hand-held phones, [Cooper, 2001; Jones and Marsden, 2005a].

Chapter 2 Mobile phone infrastructure
A model for representing the motivational and cultural factors that influence mobile phone usage variety 19
Mobile communication technology is often described or classified according to the generation it belongs to. The first (1G), second (2G) and third (3G) generations are compared in Table 2.1 to show the rapid development of mobile phone services since the late 1970s [Agrawal and Famolari, 1999; Nakajima, 2001; Coen et al., 2002; Nurvitadhi, 2002; Leung et al., 2003; Rappa, 2004; ITU, 2006].
First generation (1G) Second generation (2G) Third generation (3G)
Started Late 1970s 1980s 2001 Access technology
Frequency Division Multiple Access (FDMA). The spectrum is divided up into frequencies and then assigned to users.
Time Division Multiple Access (TDMA). Each frequency is split into time slots.
Code Division Multiple Access (CDMA). Uses ‘spread spectrum’ technology also called ‘frequency hopping’.
Standards Advanced Mobile Phone System (AMPS)
Global System for Mobile communications (GSM)
International Mobile Technology (IMT-2000)
Characteristics Low capacity, insecure communications. Ability to send digital data so limited that they were considered to be analog only.
Increased capacity, better speech quality and enhanced security. Digital cellular services for sending and receiving data gained limited popularity. The terminals were designed to resemble cordless phones with limited memory, processing power and graphics capability.
Large capacity, the ability to transfer large amounts of data at high speed. This enables applications like video calling, video downloads, web browsing, e-mail, etc. Aims to provide seamless global roaming, enabling users to move across borders while using the same number and handset.
Table 2.1: A comparison of 1G, 2G and 3G mobile communication technology
The current infrastructure is based on 2.5G to 3G technology. Since many areas in South Africa do not
yet have 3G infrastructure, 2.5G technologies have been developed. The increased speed of 2.5G over 2G allows additional applications, e.g. web browsing and sending or receiving e-mails with large attachments. GPRS, CSD, HSCSD and EDGE (technologies are part of a series of 2.5G technologies that are designed to move 2G networks closer to the performance of 3G networks. These technologies can briefly be distinguished as follows [GPRSReview2006, 2006]:
• CSD (Circuit Switched Data) technology requires the phone to make a special connection to the network before it can transfer data (like making a voice call).
• HSCSD (High Speed Circuit Switched Data) enables faster data transfer than the standard CSD system to take place by using multiple channels.

Chapter 2 Mobile phone infrastructure
A model for representing the motivational and cultural factors that influence mobile phone usage variety 20
• GPRS (General Packet Radio Service) provides a connection that is ‘always on’. Data can be transferred immediately and at higher speeds
• EDGE (Enhanced Data rates for GSM Evolution) is an extended and enhanced version of GPRS that provides data transfer rates significantly faster than GPRS or HSCSD. Where an EDGE network is not available, GPRS will automatically be used instead.
• HSCSD is more expensive to use than GPRS, because it uses channels instead of transmitting data in packets. Due to the cost factor, HSCSD is not as popular as GPRS and is currently being replaced by EDGE.
2.2.2 Future developments
Nakajima [Nakajima, 2001] noted that 1G started commercially in 1979, 2G started in 1983 and 3G in 2001. He concludes that a system that provides new services emerges every ten years and therefore forecasts that the next generation may be expected in 2010 [Nakajima, 2001]. Voice and text messages still dominate current mobile consumption, but there are predictions that web-enabled capability will dominate future decision making on mobile infrastructure [Roberts, 2004; Winters et al., 2004].
Research and development for the fourth generation (4G) is in progress [Tachikawa, 2003; ITU, 2006]. The service, scope and mobility of 4G systems will have to be compatible with 3G systems, yet 4G systems should be able to increase system capacity by 10 times while decreasing cost by 1/10 to 1/100 of 3G [Tachikawa, 2003]. The following three aims have been mentioned for 4G systems [Nakajima, 2001; Tachikawa, 2003]:
• Giving wireless communication functions to all moving objects. This could include communication terminals or modules attached to various kinds of entities, such as cars, bicycles and even pets.
• Providing wireless communications functionality where fixed lines are difficult to install.
• Giving wireless communications functions to objects that can take orders, do confirmations and execute control functions. This could include remote monitoring/control services like managing stock in vending machines or monitoring health conditions in medical care.
The following laws regarding the pace of future development in mobile communications technology should be noted:
• Moore: The prediction that the cost of computing power will be cut in half every 18 months, where computing power refers to network bandwidth, processor speed, storage capacity, etc. [Moore, 1965]. In more technical terms this means that the semiconductor performance, i.e. the number of transistors that can be packed per unit area of silicon, doubles [Rutten et al., 2001].
• A corollary to Moore’s law states that the speed of microprocessors doubles every 18 to 24 months at a constant cost. As the transistors become smaller and speed goes up, power consumption comes down, and system reliability improves while the cost drops [Rutten et al., 2001]. This trend

Chapter 2 Mobile phone infrastructure
A model for representing the motivational and cultural factors that influence mobile phone usage variety 21
towards increased functionality and complexity provides opportunities for innovations as well as adding more features and functions to existing products [Ziefle and Bay, 2004].
• Gilder: Bandwidth increases three times faster than Moore’s prediction for computing power [Gilder, 2002]. Bandwidth is communications power and increased bandwidth will lead to a decrease in cost that will create new opportunities for development [Gilder, 2002].
• Cooper: The number of voice conversations or equivalent data transactions that can theoretically be conducted in all of the useful radio spectrum over a given area has doubled every 30 months for the past 105 years [Cooper, 2001]. Cooper’s Law is about getting more value out of the radio frequency spectrum. This is done by using modulation methods, a broader range of frequencies and by the spatial reuse of the spectrum. The increased capacity of available radio spectrum leads to a decrease in cost [Coen et al., 2002].
• Metcalfe: The ‘value’ of a network increases as the square of the number of nodes or users in an interest group or community [Gilder, 2002]. The network effect is an important factor in mobile service adoption due to the strong social nature of group communication [Ali-Vehmas and Luukkainen, 2005]
• Kurzweil: Progress in technologies is increasing double exponentially, i.e. the rate of progress is increasing over time [Kurzweil, 2003].
All these laws support the argument that the evolution of technology and the changes experienced by the user are bound to increase. This benefits the consumer in terms of cost and the range of services and features available, but it also increases the cognitive overheads of understanding the mobile phone usage scenario. People can only reap the full benefit of these developments if they understand what is useful and beneficial to their own situation, otherwise their confusion about the mobile phone industry may well be exploited by unscrupulous marketers.
Having considered the rapid evolution of netware standards, it is now necessary to have a look at the mobile device and the services offered on the device in order to see the full picture of what the mobile phone user has to deal with from a cognitive point of view.
2.3 MOBILE DEVICES AND SERVICES Hansen et al. [Hansen et al., 2005] name three key factors influencing the use of mobile devices:
• Characteristics of the applications and physical limitation of the equipment.
• Needs and characteristics of the mobile user.
• Usage context of the mobile device.
These three key factors are fundamental to understanding what influences people in selecting and using mobile phones. In this section we consider the characteristics of the application, starting with a

Chapter 2 Mobile phone infrastructure
A model for representing the motivational and cultural factors that influence mobile phone usage variety 22
classification of mobile devices in section 2.3.1 and then a discussion of the components of mobile devices in section 2.3.2. In section 2.3.2 the typical services available on mobile devices are addressed. The mobile usage context was dealt with in Chapter 1 while the needs and characteristics of mobile users will be considered in Chapters 3 and 4.
2.3.1 Classification of Mobile Devices
Mobile devices are categorized as small computing devices that have the following properties [Young, 2003]:. They are
• smaller than a desktop or laptop.,
• bigger than a microchip, and
• provide a visible software user interface (UI).
While the first two properties seem obvious, the item to note is that all the devices have a software interface with which a user interacts. Examples of devices that comply with this definition are: mobile phones, personal digital assistants (PDAs), pagers, digital cameras, portable game consoles, digital audio players, global positioning system (GPS) devices, digital watches and calculators, to name but a few.
Mobile device classifications have been based on their main objective, defining features, main capabilities, primary input mechanism or price. Each of these classification approaches is briefly discussed below:
• Main objective: Mohageg and Bergman [2000] list the following three domains of use: entertainment, information access and communication, and assistant devices. While these domains are not mutually exclusive, they differ in user interaction and user expectations. For example, in the entertainment domain the user experience is characterised by long periods of interaction, tasks are less structured and user attention and concentration may vary. Considering information access and communication devices, interaction periods are typically shorter, tasks are structured and users are more goal-oriented and focused. Assistant devices have a more specific user population and task set.
• Defining features: The Mobile Review [2006] notes that manufacturers have different classifications and proposes the following eight distinctions to conditionally contain the different classifications: Low-end phones (also called ‘budgetary’), middle-range phones, outdoor phones that provide protection from external influences, business phones, fashion phones, communicators and 3G phones.
• Ketola [2002] defines the various kinds of phone according to their main capabilities. He distinguishes between basic phones, enhanced or smart phones and wireless information devices (WIDs).
o Basic phones are voice-centric devices designed to provide only voice functions and limited contact management.

Chapter 2 Mobile phone infrastructure
A model for representing the motivational and cultural factors that influence mobile phone usage variety 23
o Enhanced or smart phone are voice-centric devices designed to provide voice functions and data content via the Wireless Application Protocol (WAP). WAP is a transmission standard that connects wireless networks to the Internet [Tsalgatidou et al., 2000]. Yen and Chou [2000] list wireless e-mail, Internet, web browsing and personal information management as features of a smart phone.
o WID’s are generic digital mobile phones with the capability to browse the Internet, and receive and send faxes, SMS and e-mail. While the basic phones and the smart phones are all voice- centric, the WID’s evolved from the coalescence of personal digital assistants and smart phones.
• Primary input mechanisms: Devices can also be categorized according to their ergonomic use and form factor [Ketola and Röykee, 2001] where the primary input mechanism is essential in determining the ergonomic usage of a device. Devices such as phones are designed to be used with one hand only, whereas other devices like PDAs require the user to hold the device in one hand while using the other hand to provide input through typing or a stylus. Bluetooth headsets enable the user to make a phone call using voice commands to control the phone without physically touching it.
• Price: Price is influenced by factors that have little to do with usefulness or usability. For example, business devices are more prestigious and therefore more expensive than other phones with similar functionality [MobileReview, 2006].
2.3.2 Design of the mobile phone handset
The user interacts with the mobile phone via the user interface that is implemented through software and hardware elements. Mobile handset providers are driven towards constantly designing new products, new interaction styles and implementing advanced features, functions and styling to attract and retain customers. According to Winters [2004], the key focus of the wireless industry is cost, power and feature capability. To gain a better understanding of the mobile handset, the design, hardware and software components are now considered.
2.3.2.1 Industrial and mechanical design
The design of the platform component (handset) consists of the industrial design and the mechanical design, which together constitute the physical interface between user and phone [Ketola, 2002]. Industrial design defines the main factors for mechanical design and describes the overall dimensions of the product [Ketola and Röykee, 2001; Ketola, 2002]. A mobile phone is identified and distinguished by its industrial design, which is used to create globally identifiable icons. Mechanical design is a detailed implementation of industrial design defining the physical product implementation in terms of materials, dimensions and positions for product components [Ketola and Röykee, 2001; Ketola, 2002].

Chapter 2 Mobile phone infrastructure
A model for representing the motivational and cultural factors that influence mobile phone usage variety 24
Industrial and mechanical designers have a challenging task in fitting the display, keys and other UI components in an appealing, ergonomic and durable package that is also of the right size, and still usable single-handedly [Ketola and Röykee, 2001; Coen et al., 2002]. Moreover, as the technology develops, digital content on mobile phones is increasing.
Industrial design is constantly seeking innovation. New UI design leads to new ideas for use interaction, new navigation concepts, special display size or shape. However, in hardware and software design there is an incentive to standardise and support cross-platform and cross-manufacturer services and technologies. For example, mobile technologies and services such as Bluetooth and MMS require strict adherence to industry standards [Kiljander, 2004].
2.3.2.2 Hardware component
A mobile phone has been described as a battery-powered microprocessor on a circuit board with an antenna, liquid crystal display (LCD), keyboard, microphone, speaker and one or more wireless transmitters and receivers optimized for voice input/output (I/O) [Coen et al., 2002; Keshav, 2005]. This study is concerned mainly with the user interface components.
UI components can be classified as those that facilitate user input, i.e. the way in which users enter data or commands and those that provide output, i.e. convey information to the user [Kiljander, 2004]. The UI hardware includes the output devices such as displays and vibration motors, as well as the input devices such as keypads [Ketola, 2002]. The fundamental UI hardware components can be incorporated in different industrial designs to deliver products with different shapes, materials and colours. The UI hardware is therefore sometimes considered part of the industrial design dimension, or vice versa [Kiljander, 2004].
Basic mobile phone models provide a keyboard and an LCD screen, while more sophisticated models provide peripherals like display devices, including a full-colour screen, a QWERTY keypad, cameras and GPS. Some mobile phones offer local communication to external services via USB and multiple wireless interfaces and memory cards [Keshav, 2005].
2.3.2.3 Software component
Mobile phones have software on different levels, e.g. digital signal processing software, operating systems, UI software and application software. Mobile software can be embedded in hardware components or exist separately. For example, the software for manipulating UI hardware components can consist of software libraries for manipulating UI features and the graphical and audible UI elements.
Software is classified into manufacturer-specific platform software, developed and optimised for the specific needs of the hardware, and open-platform software that can be accessed by other software developers [Ketola, 2002]. Most models provide a general-purpose computing platform, typically supporting Symbian, Java2 Mobile Edition (J2ME), Binary Runtime Environment of Wireless [Coulton et al., 2005] or .NET Compact APIs [Keshav, 2005].

Chapter 2 Mobile phone infrastructure
A model for representing the motivational and cultural factors that influence mobile phone usage variety 25
Software functions in mobile phones typically include the following [Winters et al., 2004; Coulton et al., 2005; Keshav, 2005]:
• Voice calls, as in the traditional service offered by phones.
• Internet Access: browsers for Compact HTML, WAP (WML1.x and XHTML).
• Messaging: Apart from e-mail, mobile phone networks provide three types of messaging.
o Short Message Service (SMS) allows up to 160-character messages to be sent to a mobile phone with little delay.
o The Enhanced Message Service (EMS) is a capability developed by 3GPP to provide limited enriched content to mobile terminals using existing SMS transport mechanisms. The enhancements provide support for sounds (melodies), pictures (icons), animations and styled text.
o Multimedia Message Service (MMS) messages are unlimited in length, thereby transforming a mobile phone into standard Internet e-mail endpoint. MMS allows text, images, graphics, sound and ultimately video to be combined in a single message.
• Multimedia software for the display of still image files, playback of animation, movie and audio files.
• User applications like personal information management, games, electronic commerce, novel applications to utilise the peripherals.
• Program execution engines such as the Java runtime environment and WMLScript.
Hardware defines main performance issues such as display capabilities, battery consumption, memory capacity, and processor efficiency. This makes software performance is dependent on hardware [Ketola, 2002].
2.3.3 Mobile Services
The user expects the device to provide mobile communication, speedy connections and anytime, anywhere accessibility [Cooper 2002] and this is made possible by the service provider who provides a specific service for the user [Ketola and Röykee, 2001]. The hardware and software components and the netware together make the provision of mobile services possible. Mobile services can be divided into three categories, namely private communication, content services and mobile data services [Alahatuha et al., 2005]:
• Private communication consists of private text-based messaging, for example Short Message Service (SMS)), multimedia messaging (MMS messaging between private persons), e-mail messaging, instant messaging (e.g. push to talk (PTT)) and other forms of private messaging. Traditional PTT has been available for decades but Internet-based specifications for PTT over Cellular (POC) have been introduced recently [Ali-Vehmas and Luukkainen, 2005]. POC initiates

Chapter 2 Mobile phone infrastructure
A model for representing the motivational and cultural factors that influence mobile phone usage variety 26
the next wave of technology for group communication by introducing peer-to-peer technologies for group and point-to-point Internet voice and multimedia-oriented communication technologies such as Skype [Ali-Vehmas and Luukkainen, 2005].
• Content services refer to text-based content services (usually implemented using SMS-technology), 2.5G content services (e.g. WAP, MMS services and downloadable applications).
• Data service refers to an electronic service that utilizes wireless communication technologies for data transfer [Alahatuha et al., 2005]. In 2000 only two per cent of the cellular traffic was data and the most popular mobile units were cellular telephones without data capabilities, but this is likely to change as new technologies are introduced which make higher data rates possible [Coen et al., 2002].
2.4 MOBILE BUSINESS PRACTICES Apart from hardware and software, the mobile phone industry has the added issue of mobile phone
service providers who have specific marketing models. A marketing model is defined as a business model in combination with a marketing strategy [Tsalgatidou et al., 2000], while a business model is described as ‘the method by which a firm builds and uses its resources to offer its customers better value than its competitors, and in so doing make money’ [Yuan and Zhang, 2003].
Mobile phones have complicated, continually evolving business and marketing models due to the interdependency with user needs, wireless technology and legislation [Tsalgatidou et al., 2000; Macinnes et al., 2002; Balaji et al., 2005; Rondeau, 2005]. The ‘bizware’ component contains details of the service agreement, including marketing-generated promotional deals. It reflects the business practices of the service provider and service plans which vary within and across providers [Palen et al., 2000].
The business model has to accommodate the physical, technological, ethical and legal constraints imposed by the various key players, namely users, law, Internet, handsets, and the mobile network infrastructure providers [Tsalgatidou et al., 2000].
Players in the field of mobile phone infrastructure include the device manufacturers, the equipment and infrastructure vendors, the network infrastructure providers, the application developers, the wireless application service providers (WASPs), the system integrators and other service providers, the content aggregators and providers, and finally the financial service providers [Yuan and Zhang, 2003; Rondeau, 2005] as illustrated in Figure 2.1.

Chapter 2 Mobile phone infrastructure
A model for representing the motivational and cultural factors that influence mobile phone usage variety 27
Figure 2.1: Key players in mobile infrastructure provision (based on [Rondeau, 2005]) The WASPs ‘own’ the connection and relationship to the customer, thereby providing a one-stop
billing model for downloaded applications and subscription services [Balaji et al., 2005]. The fact that bandwidth is limited will ensure that a limited number of WASPs will continue to operate [Coen et al., 2002; Macinnes et al., 2002]. Each of the other players is also geared towards the unique features of mobile phone usage, namely mobility, portability and personalisation [Yuan and Zhang, 2003].
Many business and marketing models are proposed for mobile telephony and specifically mobile commerce [Macinnes et al., 2002; Gilbert and Kendall, 2003; Rappa, 2004]. However, the aim of this chapter is not to identify the optimal marketing or business model or the exhaustive set of key role players. The point is that there are various role players and factors that complicate the marketing and business model the mobile phone user has to deal with.
2.5 IMPLICATIONS FOR MOBILE PHONE USAGE The previous sections considered the hardware, software, netware and bizware aspects of the mobile
phone infrastructure. This section analyses the implications of these infrastructure components for mobile phone usage.
The pace of technology push associated with mobile telephony along with customer pull for new products will continue to push new technologies into the market [Winters et al., 2004]. Cut-throat competition and fast-paced innovation spawns innovative marketing models which push novel offerings of services and features [Vlok, 2006].
The complex, competitive and dynamically changing nature of mobile telephony may overwhelm even the more technically oriented user [Palen et al., 2000; Tsalgatidou et al., 2000; Coen et al., 2002;
Key players in mobile usage
Device Manufacturer
Application Developers
Equipment and Infrastructure Vendors
Financial Service Providers
Network Infrastructure providers
Content Aggregators and Content Providers
Wireless Application Service Providers
Other Service providers, System Integrators

Chapter 2 Mobile phone infrastructure
A model for representing the motivational and cultural factors that influence mobile phone usage variety 28
Qualasvirta, 2005]. This would escalate for the vast population of mobile phone users who are not technically inclined and who might misinterpret their own mobile phone needs, or have difficulty in understanding the mobile phone scenario well enough to articulate those needs. For example, they might think that the more technical terms that exist in the specification list, the better the mobile phone will suit their needs [Coen et al., 2002]. There is evidence that education improves people’s frequency of use and attitude towards mobile phone use [Adomi, 2006], but that does not exclude use for less educated people.
To illustrate our argument we provide an example. Phonescoop [2006] distinguishes between general issues, specifications and features. The category called ‘specifications’ distinguishes the items below:
• Technology, e.g. AMPS, CDMA, TDMA, GSM, etc.
• Form factor, e.g. bar, flip, clamshell, slide, etc.
• Platform / operating system, e.g. Symbian, Windows Mobile for Smartphones, Palm OS, etc.
• Weight, battery, display resolution, antenna and phone book capacity.
This is followed by more than 15 categories of ‘features’ including:
• Roaming, accessibility (e.g. hearing aids).
• Alerts such as external alerts, ring tones and vibration.
• Connectivity such as Bluetooth, infrared, USB, PC Sync, Wi-Fi, etc.
• Customisation such as changeable faceplates, custom graphics and custom ring tones.
• Input such as predictive text entry, text keyboard, and touch screen.
• Messaging such as e-mail client, EMS, MMS and text messaging (SMS).
• Music such as FM radio, music player, speakers, etc.
• Photo and video such as camera resolution, streaming video, video capture, etc.
• Productivity including alarm, calculator and calendar,
• Software such as BREW and J2ME.
• Voice such as call screening, push-to-talk, and speaker-phone.
In these specifications technology standards, netware, hardware, software and mobile services are mixed in a way that makes it difficult to discern the difference between these categories and the implications of a selection without prior knowledge of mobile phone telephony.
The effect of this scenario on mobile phone users and mobile phone adoption and usage can be summarised as follows: [Williams, 1995; Hyyppä et al., 2000; Dunlop and Brewster, 2002; Jarvenpaa et al., 2003; Ziefle and Bay, 2004; Følstad and Rahlff, 2005; Qualasvirta et al., 2005]
• Many mobile phone users are overwhelmed by the variety of service providers, contracts, services and features to choose from, when selecting a mobile phone and a service model.
• New users often have a poor understanding of how their phone, and mobile telephony in general, works. For example, many people are confused about functions on the phone and services to be set up by the service provider. When they encounter a problem they do not know whether the problem

Chapter 2 Mobile phone infrastructure
A model for representing the motivational and cultural factors that influence mobile phone usage variety 29
is with the handset or the service provider or with them using the phone incorrectly, i.e. they do not know where to start solving the problem.
• Users do not know what they do not know, i.e. the unknown unknowns, and they may be missing out on many useful features and services because they are oblivious of their existence.
• No formal, standardised training is provided on mobile phone adoption or use.
• The recommendation on sales and usage is generally given by a marketer with a market incentive for selling a specific product. Consequently, there is often little time or intention to ascertain user needs or new users’ comprehension of a concept.
• Marketing and after-sales service departments are often organizationally distinct, which aggravates the problem.
•
2.6 SUMMARY In this chapter the following research sub-question was addressed: Does infrastructure influence
mobile phone usage? In this context the evolution of cellular technology and the evolution of services from 1G to 3G and beyond was reviewed to make the argument that mobile phone technology has experienced rapid development since the first mobile phone call was made in 1973 [Cooper, 2001]. The dynamic, fact-paced, evolutionary nature of the mobile technology industry, driven by market forces and competitionas a result of continual change and diversification of products and services [Cooper, 2001; Coen et al., 2002], makes it difficult for the average consumer to keep up with the available services and capabilities. Furthermore, complicated business models integrate and manage the subsystems of producing, marketing and servicing the mobile industry [Tsalgatidou et al., 2000; Macinnes et al., 2002; Balaji et al., 2005]. This complicates the scenario further since the hardware, software, netware and bizware are integrated to an extent that makes it difficult to distinguish between them.
Given the prediction of future developments based on the laws of Moore, Gilder, Cooper, Metcalde and Kurzweil, as discussed in section 2.2.2, the pace of change seems likely to increase exponentially. The implications of the complex, integrated, fast-changing nature of mobile phone infrastructure for mobile phone usage is that many users are not coping with the increasing complexity of mobile phone usage. The result is that they feel confused and overwhelmed and do not use their mobile phones optimally. Cooper [Cooper, 1999] introduces the term ‘cognitive friction’ to describe ‘the resistance encountered by a human intellect when it engages with a complex system of rules that change as the problem permutes’. A way to bridge the gap between this complexity and what the users actually need ought therefore to be found. This justified the goal of developing a model for representing the motivational and cultural factors that influence mobile phone usage.
The model is aimed at representing the infrastructure factors in non-technical terms in order to bridge the gap between user’ motivational and cultural needs on the one hand and the technical specification of features on the other. Marketers and designers can then use the model to translate user needs into technical

Chapter 2 Mobile phone infrastructure
A model for representing the motivational and cultural factors that influence mobile phone usage variety 30
specifications. User needs will be discussed in Chapter 3. Usage spaces are seen as the potential construct for modelling usage variety and relating user needs to mobile phone features. Usage spaces are discussed in Chapter 4.

Chapter 3 The mobile phone user
A model for representing the motivational and cultural factors that influence mobile phone usage variety 31
CHAPTER 3: THE MOBILE PHONE USER
3.1 INTRODUCTION The aim of this thesis is to address the following research question: What are the components of a model to represent the influence of motivational needs and cultural
factors on mobile phone usage variety? The second and third sub-questions address the issue of the mobile phone user:
• Do cultural and social factors influence mobile phone usage?
• How can motivational user needs be related to mobile phone use?
In this chapter the theoretical foundation for these sub-questions is provided by addressing the issue of the mobile phone user in the context of social, cultural and motivational issues.
As stated in Chapter 1, mobile phone users are influenced by demographic, social, cultural, psychological, economic and contextual factors that complicate the understanding of mobile phone use. These factors interact with mobile phone infrastructure to influence the adoption and use of the mobile phone products. Values, lifestyle and norms have been positively associated with mobile phone adoption intention, thereby linking mobile phones to social behaviour and culture [Teo and Pok, 2003a; Rogers, 2003]. This supports the argument that the influence of motivational and cultural factors on mobile phone usage variety should be investigated. Although all the factors listed above are important, the research reported on in this thesis deals primarily with the motivational and cultural factors that influence mobile phone usage variety. The motivational factors are limited to the user’s motivational needs. The social context encompasses the cultural factors, and although the importance of the wider social context is acknowledged, this thesis focuses primarily on the cultural factors.
There is evidence that user demographic factors influence mobile phone usage variety [Kwon and Chidambaram, 2000; Pedersen, 2003; Kleijnen et al., 2004; Ziefle and Bay, 2004] and therefore section 3.2 briefly deals with user demographic variables that have an influence on mobile phone usage. Theories on motivational human needs and their implications for mobile phone use are discussed in section 3.3. In section 3.4 we take a brief look at the social influence on mobile phone use where some of the issues concerning the mobile phones and social behaviour are highlighted. In section 3.5 user culture is considered by looking at models of ethnic culture, organisational culture and studies conducted on the acculturation of products. Section 3.6 concludes with a summary of the findings and the implications for this study.

Chapter 3 The mobile phone user
A model for representing the motivational and cultural factors that influence mobile phone usage variety 32
3.2 DEMOGRAPHIC FACTORS Demographic factors refer to measurable characteristics of a population [Yuan and Zhang, 2003]. In
the mobile phone arena, there is no uniform, stereotypical model of the consumer. User populations comprise huge ranges of age, education, socio-economic status, technological experience, language and culture. All these factors might play a role in mobile phone usage, but they are not the primary focus of this thesis.
This section deals briefly with some of the demographic factors that have been found to influence mobile phone usage. Age has been the most widely applied demographic variable characterising differences in the adoption of mobile end-user services [Kwon and Chidambaram, 2000; Pedersen, 2003; Kleijnen et al., 2004]. The needs of people vary according to their age group [Coen et al., 2002]. Teenagers use mobile phones for accessibility, display and entertainment [Ling, 2001; Gilbert and Kendall, 2003], and socialisation [Ling, 2001]. Parents use mobile phones to coordinate family activities and to check on their children’s safety [Campbell and Russo, 2003], while older people use them mainly for safety and security purposes [Ling and Haddon, 2001; Coen et al., 2002].
Mobile phone ease of use is hampered by aging through the decline in memory capacity, decrease in processing speed and diminished spatial visualization abilities which are necessary for proper use of the menu where functions are organized at various levels Ziefle and Bay [2004]. Another problem is that most elderly people have not had prior exposure to menu-driven technology (e.g. video games), and therefore they do not have a well-developed mental model of the functioning of menus like the tree-like structure [2004]. Lähteenmäki and Kaikkonen [2005] provide evidence that nearly fifty per cent of respondents over the age of 50 feel that communication technology manufacturers do not consider the interests of older people when designing technology. They argue for the need to group the older population in different ways, including generation and education, rather than by age only.
After studying the adoption of mobile Internet services, Pedersen [2003] found that service adoption and usage varies in segments of teenagers in such a way that treating the teenager group as a homogeneous segment is not advisable. This supports the idea that age is not the only demographic variable to be considered.
Wilska [2003] also found gender-related differences in mobile phone use. For example, ‘addictive’ use of the phone with heavy spending and a ‘trendy’ consumption style, are connected to the female gender, while technology enthusiasm and trend-consciousness is linked to ‘hard’ values, a ‘trendy’ consumption style and the male gender. Gender difference is also supported by a study by Wei et al. [2006] who found that women rely on mobile phones to show affection to their families while men tend to use them predominantly for information-seeking purposes.
The significant gender differences are interesting when one considers the general perception that the borders of technology use are blurring [Wilska, 2003]. Selian [2004] found that apart from superficial differences like the colour of accessories and the melody of ring tones, both genders were fundamentally using their phones for the same purposes and in similar ways. The findings of a study by Nickerson and

Chapter 3 The mobile phone user
A model for representing the motivational and cultural factors that influence mobile phone usage variety 33
Isaac [Nickerson and Isaac, 2006], concerning the influence of gender on mobile phone use was inconclusive and therefore it seems as though the issue of gender influence has not been resolved.
Mobile phone usage is also influenced by education and income levels [Ho and Kwok, 2003; Bina and Giaglis, 2005], and national culture has also been identified as a moderating factor that may influence mobile phone use [Nickerson and Isaac, 2006]. Better-educated people were found to use mobile phones more frequently and have a more positive attitude towards using a mobile phone [Bina and Giaglis, 2005; Adomi, 2006]. Kleijnen, Wetzels et al. [2004] investigated the effect of computer skills, mobile technology readiness and social influence on technology adoption and found them all to be relevant in mobile phone usage.
These findings indicate that demographic variables like age, gender, technology readiness, social and national culture have to be taken into account when researching mobile phone usage variety. Any model developed for representing the factors that influence mobile phone usage variety will apply only to a specified group of people, defined by a set of demographic variables, and generalisability to other groups will have to be evaluated.
3.3 MOTIVATIONAL FACTORS When investigating the factors that influence mobile phone usage, the user’s motivation for using the
phone deserves consideration. According to Geser [2004], psychological factors are important in shaping the more private uses of mobile phones, while social and cultural factors affect the interactional and social institutional uses of mobile phones.
Qualasvirta [2005] states that need-finding, i.e. the discovery of user’s motivational needs, is a fundamental technology adoption requirement. Since human needs last longer than any specific solution, it is better to use needs as a roadmap for design rather than to focus new design on solving perceived problems.
Human needs are the links between the provisions and demands of the social world and people’s tendencies to realize or refute these needs [Deci and Ryan, 2000]. Lindgren [1969] states that in the field of clinical psychology and personality theory a need is defined as a deficit, the lack of something vital and important to the organism. Psychological needs are then an extension of this idea, except that psychological needs are generally not considered crucial [Lindgren, 1969]. Deci and Ryand [2000] maintain that psychologists see needs either as a set of innate physiological drivers which must be satisfied for the organism to remain healthy, or as psychological and acquired.
At this point there is little agreement on the definition of basic human needs [Huitt, 2004]. For the purpose of this study the concept of a need is defined as something that moves a person to action. This means that motive or desire can be substituted for need without losing meaning. While this approach may be too coarse for psychologists in general [Lindgren, 1969; Steverink and Lindenberg, 2006], it is suitable for this study in the context of mobile phone use.

Chapter 3 The mobile phone user
A model for representing the motivational and cultural factors that influence mobile phone usage variety 34
Steverink & Lindenberg [2006] state that goals and resources have a lower place in the hierarchy than needs since they are the tools through which needs are fulfilled. According to Deci & Ryan [2000], the interest in goals has taken precedence over needs in empirical psychology. Nevertheless, they maintain that ‘a consideration of basic psychological needs provides a basis for predicting when the efficient pursuit and attainment of goals will lead to positive performance and well-being outcomes’ [Deci and Ryan, 2000]. Therefore it is useful to consider motivational needs as a point of departure in trying to understand the factors that influence mobile phone usage.
Various theories are used to model human needs in the context of motivation. One of the first was a system of motivational needs proposed in 1954 by Maslow [1954], which was later expanded [Maslow, 1971; Maslow and Lowery, 1998] to a total of eight levels of human needs. In this model needs build on each other with higher-level needs emerging as lower-level needs are mostly or entirely satisfied. The hierarchy of needs, as depicted in Figure 3.1, includes the following [Maslow, 1971; Simons et al., 1987; Verma, 1995; Maslow and Lowery, 1998; Huitt, 2004]:
• Physiological: including biological needs such as hunger and thirst, bodily comfort such as clothes, shelter, etc., i.e. requiring coping information.
• Safety and security: including security for one’s own person and possessions, avoiding risk, harm and pain, keeping out of danger, i.e. requiring helping information.
• A sense of belonging, affection and love: including social and affiliation needs, companionship, acceptance, group membership, i.e. requiring enlightening information.
• Esteem (both self-esteem and esteem the person gets from others): including self-respect, responsibility, recognition, sense of accomplishment, competence and equity, i.e. requiring empowering information.
• Cognitive: including the need to know and understand, and to explore, i.e. requiring edifying information.
• Aesthetic: including the need for beauty, symmetry and order, i.e. also requiring edifying information.
• Self-realization: including the need to find self-fulfilment and realize one's potential, doing what one was ‘born to do’, i.e. also requiring edifying information.
• Self-transcendence: including the need to connect to something beyond the ego or to help others find self-fulfilment and realize their potential.
The holistic, dynamic view of motivational needs contained in Maslow’s theory thus represents needs as interdependent subsets in a process leading to self-actualisation and transcendence [Chung, 1969]. This theory is useful in presenting the fact that needs are related and that one type of behaviour may satisfy a set of needs. Over the years Maslow’s model of a hierarchy of needs has been criticised for different reasons, among which are the following [Chung, 1969; Yang, 2003; Huitt, 2004; Maslow, 2006]:
• A number of studies conducted to support the hierarchical arrangement of needs have failed.

Chapter 3 The mobile phone user
A model for representing the motivational and cultural factors that influence mobile phone usage variety 35
• The order of needs in the hierarchy varies from individual to individual and especially across cultures.
• The movement of needs from one level to another is a tendency, not a certainty, and a modification in a person’s goals could affect the need structure.
• The concept of self-actualization is considered vague by some behavioural psychologists and assumes that people have an optimum role or purpose.
• It is difficult to put the construct of self-actualisation into operation and this makes it difficult to test Maslow's theory. However, this criticism is not considered to be valid by people who regard experimentation as inappropriate to the study of human behaviour.
Figure 3.1: Maslow’s hierarchy of motivational needs
•
Despite the criticism, Maslow’s theory on motivational needs enjoys wide acceptance and has become one of the most popular and often cited theories of human motivation [AllExperts, 2006]. The following
Transcendence
Self-actualisationPersonal growth and fulfillment
Aesthetic
Cognitive
EsteemAchievement, status, responsibility, reputation
BelongingnessFamily, affection, relationships, work group, etc.
Safety and securityProtection, security, order, law, limits, stability, etc.
PsychologicalBasic life needs – air, food, drink, shelter, warmth, sex, sleep, etc.

Chapter 3 The mobile phone user
A model for representing the motivational and cultural factors that influence mobile phone usage variety 36
are recent examples of studies referring to Maslow’s model, two of which include references to mobile phones:
• Yang [2003] who addresses the problems of a one-dimensional, linear hierarchy and cross-cultural validity in Maslow’s model by proposing a revised Y-shaped model, structured as follows:
o The needs on the stem of the Y are Maslow's physiological needs (excluding sexual needs) and the safety needs and satisfaction of these needs are Yang’s contribution.
o The needs on the left arm of the Y are the interpersonal and sense of belonging needs, esteem needs, and the self-realization need, leading to genetic expression when fulfilled.
o The needs on the right arm of the Y are sexual needs, childbearing needs and parenting needs, resulting in genetic transmission when satisfied.
The framework therefore integrates biological and cultural determinants on basic motivational states and propensities.
• Katz & Sugiyama [2005] who note the similarity between the desire for power and security as embodied by mobile phones and the need for safety and security in Maslow’s model.
• Schiphorst [2006] who links the drive towards incorporating tactile feedback and the notion of affection in mobile phone design with Maslow’s needs.
Various other models of human needs have been suggested. Ryan & Deci [2000] suggest three needs, namely the need for autonomy, the need for competence and the need for relatedness, but do not suggest any hierarchy.
The Institute for Management Excellence [1997] proposes another set of needs and highlights both positive and negative ways in which people can work to meet these needs. They claim that each person has three primary needs, followed by six secondary needs, but this hierarchy depends on the individual. The needs are as follows:
• Security: the need to feel safe and to feel secure about the future.
• Adventure: the need for new experiences and to experience a sense of anticipation.
• Freedom: the need for independence and spontaneity, to have choices and the control over such choices.
• Exchange: the need to trade information and knowledge with others. This is about value exchange and not about socializing.
• Power: the need to organize and lead.
• Expansion: the need to expand one’s horizons.
• Acceptance: the need to accept yourself and be accepted by others.
• Community: the need to socialize and have people around.
• Expression: the need to be seen, heard and felt.

Chapter 3 The mobile phone user
A model for representing the motivational and cultural factors that influence mobile phone usage variety 37
Kankainen and Titta [2003] distinguish between two types of human needs, namely motivational needs and action needs. Motivational needs are subdivided into basic needs encompassing physiological, psychological and social needs, while action needs refer to more ephemeral, contextually induced needs [Kankainen and Titta, 2003].
This corresponds to Herzberg’s [1968] classification in the field of industrial psychology. He distinguishes between factors that are referred to as motivational and those called ‘hygiene factors’. In an organisational context, hygiene factors are necessary to meet physiological, safety and social needs in the workplace (as identified by Maslow [1954; 1971; 1998]) while motivational needs will encourage job satisfaction and appeal to the human needs of growth and self-advancement [Verma, 1995]. Verma [Verma, 1995] mapped Herzberg’s factors with Maslow’s hierarchy of needs and the result of this mapping is illustrated in Figure 3.2. The hygiene factors map to the lower-level needs, while the motivators map to the higher-level needs of esteem and self-realization.
Figure 3.2 Mapping Herberg’s needs to Maslow’s adapted from Verma [Verma, 1995]
Inspired by Herzberg’s motivator-hygiene theory, Noriaki Kano (a Japanese researcher) and his co-workers developed the Kano analysis [Löfgren and Witell, 2005]. The Kano analysis is based on the theory of attractive quality which is used to classify and prioritize customer requirements based on the way they affect customer satisfaction [Jokela, 2004].
Self
Actualization Needs
Social /Affiliation needs
Safety / Security needs
Physiological needs.
Esteem needs
Self Actualization
Needs
Social /Affiliation needs
Safety / Security needs
Physiological needs.
Self Actualization
Needs
Social /Affiliation needs
Safety / Security needs
Physiological needs.
Esteem needs
Involvement in planning your workOpportunity for developmentCreative work
Freedom to make decisionsStatus symbolsRecognition, awardsChallenging workOpportunity for advancementSharing decision making
Opportunity to interactTeam-based workFriendly co-workers
Fringe benefitsJob securitySound policies and practicesProper supervisionSafe working conditions
Adequate compensationRest periodsLabor-saving devicesEfficient work methods

Chapter 3 The mobile phone user
A model for representing the motivational and cultural factors that influence mobile phone usage variety 38
Kano[1984; 1996] identified three types of needs that all customers have, consciously or unconsciously, as illustrated in Figure 3.2:
• Basic needs: The basic functions or features that customers generally expect of a product or service. When absent there is customer dissatisfaction, which can result in complaints or lost business. When fulfilled, these attributes play a role in customer neutrality, i.e. customer satisfaction above the neutral level cannot be achieved by fulfilling only these needs.
• Performance needs: The characteristics directly correlated to customer satisfaction. The better these functions or features perform, the greater the level of customer satisfaction, while decreased functionality results in greater dissatisfaction. Product price is often related to these attributes.
• Excitement needs: The features or functions that delight and excite customers. This involves the unspoken or unexpected needs of the customer, and if satisfied will contribute to high levels of satisfaction. Satisfaction will, however, not drop below neutral if the product lacks the feature.
Kano suggested that there are five types of product characteristics or attributes which he classified as follows [Löfgren and Witell, 2005; Parker, 2006]:
• Attractive: 'Surprise and delight' factors – the characteristics that make your product exceptional and have a dramatic impact on customer satisfaction. For example, going beyond the button paradigm of interaction and using haptic (tactile) means of feedback towards affectionate computing [Schiphorst, 2006]. Due to advances in technology and user expectations, a specific feature may progress from ‘surprise and delight’ to ‘must be’ over a period of time. For example, SMS started as an attractive feature and now it is accepted as a ‘must be’ feature.
• One-dimensional: ‘More is better' – the characteristics that improve customer satisfaction with a linear impact upon it. Bina & Giaglis [2005] found mobile data services to be a ‘nice-to- have’ feature where ‘nice-to-have’ has the same value level as ‘more is better’. The satisfaction increases linearly with the availability of the attribute
• 'Must have' or ‘must be’- the minimum characteristics that every product should have. They result in satisfaction when fulfilled and without these characteristics customers will be dissatisfied. For example, a mobile phone is currently expected to have SMS capability.
• Reverse quality: 'Dissatisfiers’ are characteristics that may make your product unpopular if not fulfilled, e.g. the omission of basic expected functionality such as SMS on a mobile phone. However, ‘dissatisfiers’ also refer to attributes where a high degree of achievement may result in dissatisfaction while for another customer the same high degree will result in satisfaction. An example is the technology orientation of a product. Some users prefer high technology, while others do not.
• Indifferent quality refers to aspects that do not result in either satisfaction or dissatisfaction since they are neither good nor bad. For example, the inclusion of e-services is currently an indifferent quality to many users but it may progress to a ‘must be’ as technology, services and user expectations change.

Chapter 3 The mobile phone user
A model for representing the motivational and cultural factors that influence mobile phone usage variety 39
Figure 3.3: Quality factors based on the model of the Institute for Manufacturing [2006]
The effect of an increase in the attractive quality, more-is-better and must-be features can be presented graphically as depicted in Figure 3.3. For more-is-better features there is a linear relationship but for attractive quality and must-be factors, the relationship is not linear.
Human needs have also been studied from a technology, and specifically a mobile phone, perspective. The studies by Katz & Sugiyama [2005] and Schiphorst [2006] have already been mentioned. In the context of technology adoption and use, hygiene factors make the technology functional and serviceable in the sense that their absence will cause dissatisfaction [Zhang and von Dran, 2000]. Motivational factors add value to a product and contribute to user satisfaction [Zhang and von Dran, 2000].
People use products such as mobile phones to fulfil perceived needs and the usability of the product is measured by the extent to which it fulfils these needs [Jenson, 2004; Jokela, 2004]. ‘Mobility, immediacy and instrumentality are key reasons for the use of mobile phones and supported by secondary factors of
Dissatisfaction
Delight
Absent Quality or Performance not achieved
Exitement needs (Delighters)Perf
orman
ce nee
ds
(more
is bett
er)(Neutral)
Basic needs (M
ust haves)

Chapter 3 The mobile phone user
A model for representing the motivational and cultural factors that influence mobile phone usage variety 40
sociability and affection’ [Han Sze Tjong et al., 2003]. Tamminen et al. [2004] identify three kinds of motivational needs relating to mobile telephony:
• Personal needs, which include privacy and security.
• Navigation or way-finding needs born of a need to know or optimise.
• Social needs, which reflect an awareness of changes in schedule and social activities.
Ling and Yttri [1999] identified three ‘purposes’ for using mobile phones, namely:
• Safety and security, e.g. calling for help in emergencies.
• Micro-coordination refers to the use of mobile phones for logistical purposes.
• Hyper-coordination refers to the use of a mobile phone for self-presentation and personal expression.
The difference between needs and purposes will not be debated here but it is worth noting that safety and security purposes map directly to a level in Maslow’s needs hierarchy, micro-coordination is used to support social needs, while hyper-coordination maps to esteem and self-actualisation needs.
According to Katz & Sugiyama [2005], mobile phones are strongly connected with human perceptions of power, status and identity. Power and security are also important attributes on a psychological and interpersonal level, as argued by Maslow, among other psychologists [Katz and Sugiyama, 2005].
This suggests that some of the basic psychological and social needs identified in motivational needs literature also emerge in mobile phone usage. If mobile phone usage needs can be related to basic human needs, the latter can provide guidance in the design and selection of mobile phones.
This literature overview on motivational human needs leads one to the conclusion that motivational needs influence the way people perceive and use mobile phones. The link between mobile phones and Maslow’s hierarchy has been noted [Katz and Sugiyama, 2005; Schiphorst, 2006] but since no attempt has been made to explore it or substantiate it, this study will investigate the link between motivational human needs and mobile phone usage variety.
3.4 SOCIAL FACTORS Social needs are studied from different perspectives in different fields such as psychology [Lindgren,
1969], sociology [Geser, 2004; Rogers, 2003], ethnography [Dray &Siegel 2004] and marketing [Rogers, 2003]. Social scientists and cognitive scientists have studied user needs and constraints from the multitasking and multi-user contexts [Qualasvirta et al., 2005]. The remainder of this section briefly overviews social factors in technology in general and also more specifically mobile phone usage.
People use technology to satisfy social needs. Social interactions are the focus of human existence and therefore, in order to be successful, technology must eventually support socialisation [Ark and Selker, 1999]. Stephanidis and Savidis [2003] maintain that the ongoing shift towards a knowledge-intensive information society has radically changed the way people interact with each other and with information. The field of computer-supported co-operative work (CSCW) aims to bridge the social-technical gap, the

Chapter 3 The mobile phone user
A model for representing the motivational and cultural factors that influence mobile phone usage variety 41
great divide between what we know we should support socially and what we can support technically [Brome, 2005].
In the context of social factors, Campbell & Russo [Campbell and Russo, 2003] distinguish between technological determinism and social constructivism as two perspectives in viewing technology, and describe them as follows:
• Technological determinism maintains that macro-level changes in the social order are primarily caused by new technologies, which then exert micro-level influences on how people perceive and use technology.
• Social constructivism maintains that humans shape technology and not the other way round.
Campbell and Russo [Campbell and Russo, 2003] reject technological determinism in favour of social constructivism but acknowledge a reciprocal relationship between people and technology by saying: ‘Just as new technologies influence the ways people live their lives, the ways people live their lives influence how they think about and use technologies’. People use new technologies in attempts to solve old problems and soon the new technology is surrounded by social rules and dilemmas [Humphreys, 2005].
Using mobile phones is a societal decision since the device is more or less worthless without someone else with a compatible device, also attached to the network and available to communicate with. The fact that communications technologies are entirely dependent on a network effect to be useful, means that the diffusion of these technologies should be studied within a particular culture [Urbaczewski et al., 2002].
The location-free nature and huge growth of mobile phone usage have established a new social order that can be described as a shift from place-to-place communication to person-to-person communication[Khalil and Connelly, 2005a]. According to Humphreys [2005] ‘Much research has examined how communication technologies reflect the social and cultural world in which they are situated’. The early use of mobile phones was mostly associated with the workplace and professional networks. Therefore the mobile phone in the work context and the use of phones in work organisation have been studied more intensively than personal usage [Licoppe and Heurtin, 2001; Tamaru et al., 2005]. Studies from CSCW have investigated the ‘anytime, anywhere’ phenomenon that mobile phones have introduced in order to improve the understanding of the role of technology and appropriate technological solutions in supporting mobile workers [Perry et al., 2001].
Sociology frameworks have been used to describe users by demographic and social characteristics or by their mobile phone usage patterns in public or private spaces [Pedersen et al., 2002]. However, personal use has been intensively researched since, notably the domestication studies by Ling, Yttri and Haddon [Ling and Yttri, 1999; Ling, 2001; Ling and Haddon, 2001; Ling, 2005], the personalisation of mobile phones [Lee and Lu, 2003] and user preferences and experiences
When using a mobile phone, the user occupies multiple social spaces simultaneously, e.g. the physical space of the mobile phone user and the virtual space of the conversation [Palen et al., 2000]. A social juxtaposition arises between the mobile phone conversation space and public spaces as the norms of these spaces may conflict [Page, 2005]. For example, a person may feel obliged to take a call while being with

Chapter 3 The mobile phone user
A model for representing the motivational and cultural factors that influence mobile phone usage variety 42
other people to whom it may be offensive to be blocked out of the conversation. Mobile phones privatize public spaces as mobile phone users block out others nearby, but at the same time they may publicize private information during a conversation [Humphreys, 2005]. Privatisation of public spaces was also reported on by Ling [2001] who adds that in hands-free use of mobile phones, the absence of visual clues may have further social implications such as unintended interruption and misinterpretation of the situation.
Some studies have dealt with the issues of space–time coordination [Geser, 2004] and specific issues caused by the use of mobile phones, such as negotiation of access [Licoppe and Heurtin, 2001], a sense of freedom, control and independence [Jarvenpaa et al., 2003], individualisation and personalization [Katz and Sugiyama, 2005; Ling, 2005]. Mobile phones are often seen as fashion items [Green et al., 2001] where fashion is a form of communication as well as an indicator of status and power [Katz and Sugiyama, 2005]. Some user groups even create their own language as a playful, creative expression of personal style [Page, 2005].
The use of mobile phones for creating and publishing online personal diaries (blogging) is evidence of using mobile phones in creative and reflective activities [Jones and Marsden, 2005a]. ‘Traditionally, technological devices are small, cold, hard, heavy, and smooth.’ [Swallow and Thompson, 2001]. However, the development of electrically conductive textiles containing switches and sensors renders possible the construction of sensory fabrics that are low-profile, low in mass and volume, tactile and flexible. Based on these developments, researchers have explored haptic (tactile) feedback in areas such as affectionate computing, sensual interfaces, models for intention and smart materials where the human body is used as data input [Schiphorst, 2006].
Geser [2004] presents a sociological theory of the mobile phone, looking at the implications for individuals, interpersonal interaction and groups, organizations and markets. He states that no causal model for explaining the sociology of mobile phones can be developed, but asserts that mobile phones tend to ‘lessen the degree to which social relationships and social systems are anchored in space, and they increase the degree to which they are anchored in particular persons’ [Geser, 2004].
The availability of mobile phones has introduced many unexpected social trends. Selian [2004] notes that bullying has changed from face-to-face bullying to bullying through technology and even that mobile phone addiction is occurring.
Given the universal diffusion of mobile phones, the question arises as to whether mobile phones are causing worldwide convergences and homogenization in social behaviour. Geser [2004] does not think so, stating that ‘by supporting rather traditional and particularistic social settings, mobile phones are more likely to accentuate differences rather than communalities between various population segments, social institutions or ethnic cultures’. Ling [2005] predicts that as mobile phones become normalised they will merge into the background of everyday things and become less notable. Mobile phone use is therefore rapidly becoming a feature of a culture [Palen et al., 2000; Kim and Lee, 2005].
Cultural studies focus on the relationship between social relations and meanings or the way in which social boundaries are made meaningful [O'Sullivan et al., 1994]. As culture is one of the main issues researched in this thesis, the issue of culture is addressed in more detail in the next section.

Chapter 3 The mobile phone user
A model for representing the motivational and cultural factors that influence mobile phone usage variety 43
3.5 CULTURAL FACTORS The context of the mobile user includes user culture and the influence of culture on mobile phone use
[Urbaczewski et al., 2002; Teo and Pok, 2003a; Jones and Marsden, 2005a]. This necessitates a review of culture as an essential part of understanding users and the factors that influence mobile phone usage.
The word ‘culture’ originally stems from an agricultural root: ‘culture as cultivation of the soil and plants’ [Hartley 2002]. Applying this to people offers a metaphor for the cultivation of products, minds and social relations. Culture can be seen as the social production of sense, meaning and awareness [O'Sullivan et al., 1994].
There are various definitions of the term ‘culture’. For example, the definition of culture as learned behaviour consisting of thoughts, feelings and actions [Del Gado, 1996], while Hall [1990] describes culture as communication through words, material things and behaviour.
Honold [2000] notes that it is more meaningful to find a definition of culture that suits the specific area of research than to produce a general definition. Ford [2005] defines culture in the context of HCI as ‘the patterns of thinking, feeling, and acting that influence the way in which people communicate among themselves and with computers’. This definition is also applicable to mobile interaction and I consequently adapted it for the purpose of this study to consider culture as ‘the patterns of thinking, feeling, and acting that influence the way in which people communicate among themselves and use mobile devices’.
The mobile device market has widened to a global scale and consequently mobile devices are distributed throughout the world [Kim and Lee, 2005]. As the use of mobile phones pervades the world, the globalization of mobile device user interfaces design is becoming more crucial to business success and building a loyal customer base. Communications technologies are entirely dependent on a social network for adoption and use, and therefore the diffusion of these technologies within a culture should be studied [Urbaczewski et al., 2002].
According to Palen et al. [2000] deployment of mobile telephony varies dramatically internationally and even among western countries. In general, usability studies aim to make technology more useful. Cultural usability goes further and aims to make technology fit in with the user’s lifestyle [Sun, 2004]. In order to be effective, designers therefore have to understand and be aware of the cultural priorities and the value system of users, i.e. they must identify factors that are relevant and sensitive to cultural differences. This necessitates a closer look at the concepts of cross-cultural diversity and organisational culture, and examples of acculturation. The remainder of this section focuses on these issues.

Chapter 3 The mobile phone user
A model for representing the motivational and cultural factors that influence mobile phone usage variety 44
3.5.1 Cross-cultural diversity: Metamodels of culture
Cross-cultural analysis is popular with researchers interested in the relative bases of norms, values, rules and roles within societies [O'Sullivan et al., 1994]. Researchers in different fields of study have approached the challenge of modelling cross-cultural diversity [Hartley, 2002]. The focal points of these studies are different and therefore a need arises to identify the core of concepts and layers that have to be considered. Existing definitions are inadequate to express the concepts and relationships that compose the different dimensions of culture, and therefore cultural models and metamodels are proposed to study culture in a more structured way.
A cultural model compares the similarities and differences of two or more cultures by using international variables, and metamodels define different aspects or layers of culture to be considered in cultural models [Gould, 2005]. The following are examples of cultural metamodels. 3.5.1.1 The Iceberg model
Defined by Hoft [1996]), the Iceberg Model comprises of three layers:
• The surface layer hosts the visible and obvious characteristics like number, currency and time formats.
• The second layer contains the unspoken rules, where the specific context of a situation determines the rules, for example protocol or business etiquette.
• The third layer consists of the unconscious rules that one is not consciously aware of and that are therefore difficult to reason with. Examples mentioned are the sense of time and physical distance, the rate and intensity of speech and nonverbal communication.
3.5.1.2 The Onion model
The Onion Model defined by Trompenaars and Hampden-Turner [1997] comprises three layers:
• The outer layer refers to explicit products and artefacts of culture. Examples include language, food, buildings and art.
• The middle layer consists of norms and values. Norms are principles shared among a group of people for the purpose of distinguishing between right and wrong.
• The core layers consist of people’s basic assumptions about human existence. This layer is implicit and determines how people adapt to their environment.
3.5.1.3 The Pyramid model
Defined by Hofstede [1995], the Pyramid Model comprises of three levels and attempts to show the origin of culture and how it affects human mental programming:
• Personality is attributed to an individual and is both learned and inherited.

Chapter 3 The mobile phone user
A model for representing the motivational and cultural factors that influence mobile phone usage variety 45
• Culture is specific to a group of people and is learned, not inherited.
• Human nature is common to all human beings. It is inherited and not learned.
•
3.5.1.4 The Objective–subjective model
This model was defined by Stewart and Bennett [1991] and distinguishes two levels:
• Objective culture is social and material. It manifests in concrete things that are visible, tangible and easy to examine [Limaye and Victor, 1995]. Examples of artefacts of objective culture are: language, date and time formats, currency, infrastructure and technology. The economic system, social customs, political structures, arts, crafts and literature are more examples [Gould, 2005].
• Subjective culture is evident in the psychological assumptions, beliefs, values and patterns of thinking. Limaye & Victor [1995] itemises values, behavioural norms, attitudes and religion as examples of subjective culture. Subjective culture operates outside of conscious awareness and this makes it difficult to examine.
3.5.2. Cultural diversity: models of culture
Various models have been developed to further the understanding of culture. Four of these models, namely Victor’s models, Hall’s model, Hofstede’s model and Trompenaars’ model will now be discussed. 3.5.2.1 Hall’s model of culture
Hall’s work was influenced by his background in preparing diplomats at a foreign service institute [Gould, 2005]. Apart from training diplomats in language, history, government and customs, he realised that they also needed to be trained in the language of behaviour. Hall’s model focused on two nonverbal features of intercultural communication theory, namely time (chronomics) and space (proxemics) [Hall, 1965].
Hall introduced the concepts of monochronic time (performing one task at a time) versus polychronic time (performing more than one task at a time) and also noted different time orientations i.e. past, present and future orientations [Hall, 1965; Hall and Hall, 1990].
• Time: Hall identifies polychronic and monochronic time [Hall and Hall, 1990]
o Monochronic time perception is characterized by schedules, promptness and compartmentalization of activities.
o The other end of the scale represents polychronic time perception, which is characterised by people doing several things at a time. Schedules may be changed and time commitments are desirable rather than absolute.
• Space: Hall identified four different senses of space, namely territoriality, personal space, multisensory space and unconscious reactions to spatial differences.

Chapter 3 The mobile phone user
A model for representing the motivational and cultural factors that influence mobile phone usage variety 46
o Territoriality includes ‘ownership’ and communicates power and authority. For example, allocating the biggest offices to the most important people in an organisation.
o Personal space refers to the unspoken rules about how close one is allowed to get to another person.
o Multisensory space refers to the invisible boundaries placed on the five senses and relates to the unconscious rules about what is too loud and considered to be an infringement of another person’s personal space.
o Unconscious reactions to spatial differences refer to the response that is evoked as a result of the distance that a person keeps while having a conversation.
Hall [Hall, 1976] later identified context as another factor that governs people’s responses to verbal discourse. Context refers to the amount and specificity of information that is given in a specific situation [Hall, 1976; Hall and Hall, 1990]. Hall distinguished cultures on the basis of a way of communicating along a dimension and scaling from ‘high-context’ communication, which has most of the meaning in the context, to ‘low context’ where the complete meaning is in the message. A high-context communication is one in which most of the information is either in the physical environment or within the person, while very little is in the coded, explicit part of the message.
Hall [Hall, 1976; Hall and Hall, 1990] also identified information flow and the speed of messages as factors that influence intercultural communication as follows:
• Information flow: refers to how long it takes for a message to travel to, and release the required response from, the intended recipient. This relates to context since information flow in low-context cultures tends to be fast and free. In contrast, information flow in high-context cultures tends to be hampered by bureaucracy and rigid procedures.
• Speed of messages: refers to the speed with which people decode and act on messages. Some cultures are known to prefer fast messages, such as cartoons, television commercials and newspaper headlines, whilst other cultures prefer slow messages, such as profound books, poetry and television documentaries.
•
3.5.2.2 Victor’s model of culture
Victor’s model focuses on specific elements of the communications context that are most likely to affect business communications [Victor, 1992]. Victor’s approach to intercultural communication is captured in the mnemonic LESCANT described as follows [Victor, 1992; Gould, 2005]:
• Language: describes the importance of accents and regional dialects and how they affect business communications.
• Environment and technology: concerns the larger issues of how geography, population, physical space and perceptions of technology influence business communication.

Chapter 3 The mobile phone user
A model for representing the motivational and cultural factors that influence mobile phone usage variety 47
• Social organisation: deals with educational, economic, social, political and religious systems that affect business communication.
• Context: Victor expands on Hall’s model of context as described in section 3.5.2.1.
• Authority conception: considers differences and similarities in power, authority and leadership.
• Non-verbal behaviour: a broad category for many types of non-verbal behaviour, including active behaviour such as movement, sound, eye and touching, and passive behaviour such as the use of colours, symbols and smells.
• Temporal conception: an extension of Hall’s [Hall, 1965] dimension of time described in 3.5.2.1 includes polychronic and monochronic time.
Victor’s model includes both subjective and objective cultural dimensions. Language environment and technology and social organization relate to objective cultural aspects, while context, nonverbal behaviour, authority conception and temporal conception are considered subjective culture [Ford, 2005]. 3.5.2.3 Hofstede’s model of culture
Hofstede conceptualized culture as ‘programming of the mind’ and focuses his model on determining the patterns of thinking, feeling and acting that form a culture’s mental programming.
Many anthropologists have done research in the field of cultural dimensions and one of the best known and most cited studies was done by Geert Hofstede [Hofstede, 1995; Marcus and Gould, 2000; Baumgartner, 2003]. In the 1970s and 80s, Hofstede did a survey at IBM that dealt with ‘the employee’s personal values related to the work situation’ and investigated cultural variations within five different parameters [Hofstede, 1995].
All five of Hofstede's dimensions relate to subjective culture. Each of these dimensions is a dichotomy, in that there are two opposing sides to each dimension. Many of the dimensions in his model also appear in the other three models discussed. Hoft [Hoft, 1996] prefers the term ‘international variable’ but in this study the term ‘cultural dimensions’ are used. An overview of the cultural dimensions is presented here [Hofstede, 1995; Hoft, 1996; Hofstede, 2001]:
• Power distance, denoting the extent to which less powerful members expect and accept unequal power distribution within a culture, and scaling from high-power-distant to low-power-distant.
• Masculinity vs. femininity, referring to gender roles, not physical characteristics, as commonly characterized by the levels of assertiveness or tenderness in the user, and scaling from masculine to feminine.
• Individualism vs. collectivism, referring to the role of the individual and the group, and is characterized by the level of ties between an individual in a society, and scaling from individualistic to collectivistic.
• Uncertainty avoidance, referring to the way in which people cope with uncertainty and risk, and scaling from high-uncertainty-avoidant to low-uncertainty-avoidant.

Chapter 3 The mobile phone user
A model for representing the motivational and cultural factors that influence mobile phone usage variety 48
• Time orientation, referring to people’s concerns with the past, present and future and the importance they attach to each, and scaling from short-term orientation to long-term orientation.
3.5.2.4 Trompenaars’ Model of Culture
Fons Trompenaars [Trompenaars and Hampden-Turner, 1997] studied under Hofstede and developed a model for corporate culture that includes artefacts from Hofstede’s model. Trompenaars identifies seven dimensions of culture that characterise the way in which people solve problems. These dimensions are grouped into three major categories according to the way in which people solve problems [Hoft, 1996]:
• Problems caused by relationships with others:
o Universalism vs. particularism: universalists are rules-based and tend to apply rules of morality and ethics and what is good and right regardless of their relationship with the other person. In contrast, particularists base their solution to the problem on the relationship that they have with the other person, and are prepared to break the rules if necessary.
o Individualism vs. collectivism: refers to the balance that is perceived to be appropriate between the needs of individuals and groups
o Neutral or emotional: this is a measure of the range of emotions that people express when dealing with others in a business environment.
o Specific vs. diffuse: a specific value orientation is one where public and private life and personal space is compartmentalized. In specific-oriented cultures, there is a clear division between business relationships and personal friendships. In diffuse cultures, business communications require the development of strong personal relationships such as liking and trust, before co-operation can begin.
o Achievement vs. ascription: refers to how status is accorded to other people. Achievement-oriented cultures achieve status through individual achievements. In contrast, ascribed status comes from ‘being’ or having a certain role, and is often based on gender, age, social connections and education.
• Problems arising from time
o Attitude to time: Includes Hall’s definition of polychronic and monochronic time, as well as a culture’s orientation towards the past, the present and the future and the relationship of the three to each other.
• Problems arising from the environment
o Attitude to the environment: Measures people’s attitude towards their ability to control the environment. Trompenaar’s model incorporates only subjective culture since all the noted factors relate to values, beliefs and expectations rather than artefacts, systems and institutions [Ford, 2005].

Chapter 3 The mobile phone user
A model for representing the motivational and cultural factors that influence mobile phone usage variety 49
3.5.2.5 Other contributions to researching culture
Other important contributions include that of Harry C. Triandis who researched the effect of culture on social psychology and examined the interplay between norms, attitudes and behaviours [Gould, 2005].
Baumgartner [2003] sent questionnaires to experts in the field of user-interface design, They were requested to rank the dimensions according to importance. Based on the analysis of the data from over 50 questionnaires, a ranked compilation of 29 cultural dimensions (which include those of Hofstede’s dimensions) is presented. The following five dimensions were rated most important [Baumgartner, 2003].
• Context, as described by Hall [Hall, 1976] (see section 3.5.2.1).
• Technological development, referring to the rate of technological development, and scaling from advanced to backward.
• Uncertainty avoidance as described by Hofstede (see section 3.5.2.3).
• Time perception as described by Hall (see section 3.5.2.1).
• Authority conception or power distance according to Hofstede (see section 3.5.2.3).
3.5.3 Organisational culture
The basic models of culture are mostly based on some form of ethnic culture even though they may apply to the business environment. The term ‘ethnic’ is defined as ‘relating to a group of people having a common national or cultural tradition’ [Oxford, 1999]. Nevertheless, business and other organizations also have cultures that have an impact on a range of micro and macro-organisational phenomena [Boyancigiller and Adler, 1995]. Hofstede [1995] uses the word ‘culture’ in the sense of ‘collective programming of the mind’ when referring to organisational culture.
Organisational culture is based on the organisation’s sense of identity, its goals, core values, primary ways of working and shared assumptions [Scott and Gable, 1997]. Membership of organisations and social groups is usually partial and voluntary, while the association with a nation is permanent and involuntary. National cultures differ at the level of basic values while organisational and group/peer cultures are composed of practices (like symbols, heroes and rituals) rather than values [Scott and Gable, 1997].
The purpose of organisational structure is the co-ordination of activities and therefore common practices, not common values, keep the members together [Hofstede, 1995]. Therefore employees tend to adapt their values to organisational needs to some extent but cannot change the personal values acquired over a lifetime. Hofstede [1995] also notes that confusion arises because literature does not distinguish between the values of the founders of organisations, the people who create the symbols, heroes and rituals and the ordinary employees.
The distinction between subjective culture and objective culture is important for understanding a group of people because both objective and subjective cultures distinguished it from other identifiable groups, [Hofstede, 1995; Limaye and Victor, 1995]. For example, two groups may seem the same on objective culture but be distinguishable on subjective culture.

Chapter 3 The mobile phone user
A model for representing the motivational and cultural factors that influence mobile phone usage variety 50
Boyancigiller and Adler [1995] state that organisational theorists underestimate the extent to which individual characteristics and motivations are influenced by the external cultural environment. Values lead to behaviour and as the behaviour begins to solve the problem that prompted it, the value is transformed into an underlying assumption about how things really are. As the assumption is accepted, it drops out of awareness and becomes difficult to detect and consequently very difficult to manage.
Hofstede [1995] supports this argument by saying that despite the superficial nature of organisational cultures, they are hard to change because they have developed into collective habits. In contrast, Scott and Gable [1997] note that the metaphorical view of culture as a glue binding the organization together, overstates the integrating forces and understates the disintegrating forces such as differentiation and fragmentation.
Hofstede [1995] presents the following dimensions for organisational culture: process-oriented versus product oriented; job-oriented versus employee-oriented; professional versus parochial; open system versus closed system; tightly versus loosely controlled and pragmatic versus normative cultures. Since the primary focus is not on organisational culture, a detailed discussion of these dimensions fall outside the scope of this study.
3.5.4 Acculturation of artefacts
We are interested in whether cultural factors influence mobile phone usage and therefore we have to look at the issue of acculturation, especially in the context of interactive systems. Mahernoff and Johnston [1999] define acculturation of computer software as the overall process of producing software that fits the needs of particular cultures. Internationalisation and globalisation are terms used to describe the process of developing software products that are free of language, cultural and local custom dependencies [Stathisa and Sergot, 1998]. In the context of this thesis we distinguish the following terms in the context of technological artefacts or products:
• Globalizatio: The general process of worldwide economic, political, technological and social integration that addresses the issues connected with making a product available globally [Aykin, 2005].
• Internationalization: The process of ensuring that a product can be easily localised at the technical/design level. This means the culturally specific elements of a product, e.g. market-specific features, the platforms and systems to support language specific requirements, currencies, character sets, date and time formats are isolated and converted into international standards [Sun, 2001]. In other words, internationalization provides the framework in which localization takes place easily and more efficiently. Internationalization concerns objective culture while localization deals with subjective culture.
• Localization: Adapting a product to the specific needs and cultural preferences of a specific cultural group. Locale is the part of the user’s environment that depends on language, country/region and cultural conventions [Aykin, 2005]. This means adjusting the aesthetic appeal,

Chapter 3 The mobile phone user
A model for representing the motivational and cultural factors that influence mobile phone usage variety 51
images, colours, logic, functionality and communication patterns to conform to the target audience on the cultural level.
The preparation of a product for a different culture involves two steps: first internationalisation, then localization [Russo and Boor, 1993; Mahernoff and Johnston, 1999]. Globalization of UI design can be achieved by identifying universal components and to-be-customized (to-be-localised) components of user interfaces [Lee et al., 2005; Marcus, 2005a].
Research into objective culture has resulted in comprehensive standards for the internationalization of software systems such as LISA [LISA, 2004]. This provides standards for translation and language-specific requirements as well as for international currencies, character sets, date, time and market-specific features. Consequently designers and users have some metrics that can be used for selecting and evaluating internationalisation services. However, localization goals have not been achieved to the same extent [Limaye and Victor, 1995; Ford and Kotze, 2005a].
Fitzgerald [2004] presents four models used for managing cross-cultural software on the subjective level:
• Cultural dimensions: Measures different cultures according to a number of cultural variables or factors [Marcus and Gould, 2000].
• Cultural markers: Measures interface design elements that are prevalent and possibly preferred within a particular cultural group [Badre, 2002].
• Cultural behaviours: Measures on-line behaviour of web site users in terms of a four-factor model [Fitzgerald, 2004].
• Activity theory: ‘people’s activities are viewed as an object-oriented and tool-mediated process in which actions are mediated through the use of artefacts (including tools and languages) to achieve a transformative objective.’ [Sun, 2004].
Considering these models, Fitzgerald [2004] notes that the cultural dimension models are aimed at a description of culture rather than a prescription for cross-cultural design. Therefore he argues that cultural dimension models are not adequate for designing for cultural awareness.
Strom [2005a] argues that Hofstede’s parameters describe how people interact with each other, not how they interact with interfaces or physical objects. This makes it difficult to use Hofstede’s dimensions to predict how users will interact with an interface. Jones and Marsden [2005a] believe that computer scientists find the use of Hofstede’s cultural dimensions appealing as this implies that culture can be quantified. Besides the ethical issues involved in classifying people, there is the difficulty of assigning a single target culture to a country [Jones and Marsden, 2005a].
Ford and Kotzé [2005a] found that interface design characteristics that favour certain dimensions, i.e. high power distance, high uncertainty avoidance, masculinity and short-term orientation, would provide a more usable interface than one designed to accommodate the opposing sides of these dimensions. This supports the view that cultural dimensions should not be the only approach to endowing HCI with culture.

Chapter 3 The mobile phone user
A model for representing the motivational and cultural factors that influence mobile phone usage variety 52
Cultural markers were identified by performing a systematic usability inspection of several hundred web sites originating in different countries and languages, in order to identify localization elements like national symbols, colours, spatial organizations, etc., and generalize them to cultural markers [Badre, 2002]. These interface elements can directly affect user performance, hence merging culture and usability. Fitzgerald [2004] recommends cultural markers as the most promising of the models presented. Nevertheless, Sun [2001] warns that if cultural markers are not applied selectively and one uses them for localization, one might fall into the trap of stereotyping cultures.
The cultural behaviour model is based on factors of on-line behaviour of users, namely [Fitzgerald, 2004]:
• social communications (meeting new people, chat, joining a group);
• e-commerce (buying, selling, advertising);
• hobby (entertainment, playing games, listening to music); and
• information search (product, educational and employment information).
This model is not based on ethnic cultural dimensions and the categories could be useful in building a profile for organisational culture or peer group culture that could apply to mobile phone usage. According to Fitzgerald [2004], it is still too early to predict how useful the cultural behaviour approach will be.
‘Activity theory is a general conceptual approach, rather than a highly predictive theory’. [Kaptelinin et al., 1999]. Kaenampornpan et al. [2004] see activity theory as a philosophical framework used to conceptualise human activities. It provides a standard form for describing human activity which takes the concepts of tool mediation and social environment into account when modelling the relationships amongst elements [Kaenampornpan and O'Neill, 2004; Sun, 2004]. According to Kaptelinin et al. [1999], the unit of analysis is the activity which consists of an object or motive, a subject (an individual or group), artefacts and socio-cultural rules.
The theory is elaborated into a set of five principles [Kaptelinin et al., 1999; Jones and Marsden, 2005a]:
• Hierarchical structure of activity: Motives are the top-level objectives driven by needs and desires. Actions (tasks) are conscious, goal-directed processes which are carried out to fulfil motives. Goals can repeatedly be broken down into lower level goals with associated actions. Moving down the hierarchy of actions we cross the border between conscious and automatic processes. Operations are functional sub-units of actions, which are carried out automatically. Actions transform into operations when they become routine and unconscious with practice.
• Internalization and externalization: Activity theory emphasizes that behaviour needs to be understood in terms of the user’s internal world of activities such as thinking and the external world of knowledge, resources and actions. The constant transformation between external and internal is seen as the basis of human cognition and activity. Internalization is the transformation of external activities into internal ones and vice versa.
Chapter 3 The mobile phone user
A model for representing the motivational and cultural factors that influence mobile phone usage variety 53
• Object-orientedness: Every activity is directed towards an object that exists in the world. Objects can be described in terms of diverse sets of properties including physical and cultural attributes.
• Mediation: Tools shape the way human beings interact with reality and tools usually reflect the experience of other people who have tried to solve similar problems before and invented or modified the tool to make it more efficient and useful. The concept of a tool embraces both technical tools (which are intended to manipulate physical objects) and psychological tools.
• Development: According to activity theory, human interaction with reality should be analyzed in the context of development since practice is reformed and shaped by historical development.
Activity theory has been recommended for HCI as it takes social and cultural interactions into account in the organizational, developmental and learning aspects of human activity and information technology tool adaptation [Fitzgerald, 2004]. Sun [2004] contends that activity theory is good at showing the complexities and fluidity of activities in context but it does not tell us how the activities are structured by contextual factors. Activity theory should be useful in studying mobile phone usage behaviour but no documented studies could be found.
The remainder of this section presents examples of acculturation studies or studies focusing on the affect of cultural dimension on interactive systems in general and mobile interaction in particular.
3.5.4.1 Studies on culture and interactive systems
Two sets of examples are presented: international and African studies. We first highlight the international studies, representative of such studies worldwide:
• Straub et al.[Straub et al., 1997] investigated the possible effects of Hofstede’s cultural dimensions on the user-acceptance of e-mail systems by studying users from the USA, Switzerland and Japan. They found that users’ subjective cultural profile would influence their acceptance of certain technologies to perform particular tasks. They found that high-power-distant, high-uncertainty- avoidant, masculine and collectivist individuals would reject communication media that are not information-rich or do not support social presence. On the other hand, low-power-distant, low-uncertainty-avoidant, feminine and individualist individuals would accept such media. They did not consider the time-orientation dimension.
• Sheppard & Scholtz [Sheppard and Scholtz, 1999] conducted a study based on Hofstede’s cultural dimensions with two user groups in the USA, one with 5 users born in the USA and another with 5 users born in the Middle East. They found no user preference rating differences in culturally aware web sites, but indicated some user performance differences.
• Anandarajen et al. [Anandarajen et al., 2002] in studying the effect of Hofstede’s cultural dimensions on user acceptance of a collectivist society, found that such users would use computers not because of their perceived usefulness or the enjoyment derived from such use, but because of the perceived social pressures from their peers.

Chapter 3 The mobile phone user
A model for representing the motivational and cultural factors that influence mobile phone usage variety 54
• Smith and Chang [Smith and Chang, 2003] studied the influence of Hofstede’s dimension on Chinese users’ acceptance of website interfaces. They found that only some dimensions have a significant impact on usability, with power distance the largest influence and uncertainty avoidance the least. Like Straub et al. [Straub et al., 1997] , they did not study the effect of time-orientation.
The following examples highlight the typical African studies on culture and interactive systems:
• Onibere et al. [2001b] conducted a nationwide survey among computer end-users in Botswana. They found a desire for a localised interface, but little need for localised icons and no agreement as to which language should be used.
• Walton et al. [2002; 2003] studied a group of 20 students in a basic computer literacy course. The findings of their research suggested possible cultural dimensions of the interpretation of common visual navigational convention used on web pages. The problem was not attributed to the use of icons (such as tabbed files, folders or mailboxes), but rather to the meaning of hierarchical information structures in their ‘home cultures’. They also found differences in ‘source literacy’ and ‘awareness’. Their overall finding was that students from a disadvantaged background had difficulty in making the transition to web use, but that this was not due to the stereotyped notion of ethnic and national cultures.
• De Wet et al. [2002] performed an empirical study on the usability of localised web sites in South Africa. Their findings indicate that African users prefer to search for information in English and perform better than when they have to do so in their mother language (Sesotho in this case). One reason provided was that some technical English terms could not be translated since the corresponding term did not exist in Sesotho. These terms were then replaced by an explanation of the term, which made the text lengthy and time-consuming to read.
• Ford and Kotzé [2005a] studied web interfaces designed for Hofstede’s different cultural dimensions. They state that interface design characteristics favour certain subjective culture dimensions, i.e. that high power distance; high uncertainty avoidance, masculinity and short-term orientation would provide a more usable interface than one designed to accommodate the opposing sides of these dimensions. Their test subjects were multi-cultural users from Southern Africa.
• Heukelman [2006] did a study on user interfaces for rural communities. The participants were divided on the question of whether the Zulu interface promoted or inhibited understanding. They also found that the Zulu text was lengthier and some participants complained that they already knew the English terms and did not like relearning the terms in Zulu.
It is interesting to note that the international studies were all across national boundaries, while the African studies were all done inside their own countries. The international studies were all based on the premise put forward by Hofstede that certain cultural dimensions can be attributed to people from a particular country, i.e. they all focused on subjective culture. The African studies were all in sub-Saharan Africa, notably in Botswana and South Africa, both multi-cultural societies, though the latter more extensively so, and these studies focused more on individual cultural attributes than on cultural profiles for

Chapter 3 The mobile phone user
A model for representing the motivational and cultural factors that influence mobile phone usage variety 55
a larger population. Apart from the Ford and Kotzé study, the main focus of all these studies was on objective culture, although subjective issues were included.
Based on the findings of these studies, it can be concluded that there is a definite interest and drive towards the acculturation of user interfaces. The findings did, however, show that the acculturated product is not always more usable, more acceptable, or the preferred use choice. However, it is difficult to generalise the findings as the problems are often unique to a community and cannot be oversimplified. Some of these studies might also have fallen into the trap of not using appropriate test interfaces or unrepresentative test subjects [Ford and Kotze, 2005b].
3.5.4.2 Culture and mobile interaction
The problem of understanding consumer preference in mobile interaction has also been considered from a cultural perspective, trying to determine whether a relationship exists between critical design attributes and users’ cultural characteristics [Han et al., 2004]. Existing research has been aimed at the culture-based preferences for specific design attributes [Choi, Lee, and Kim, 2005; Kim and Lee, 2005] and the distinction between universal and to-be-localised components [Lee et al., 2005]. The following studies represent the general trends:
• Choi et al. [2005] looked at cultural influences on functionality design of mobile data services by comparing 24 Korean, Japanese and Finnish users. They found 52 attributes considered important by mobile data service users and identified 11 critical attributes related to the user interfaces of mobile data services devices. The critical attributes such as minimal keystrokes, iconic menu style, logical ordering of menu items, variety of fonts and font colours, etc., all showed a clear correlation with characteristics of the culture of the user’s country (as identified by Hofstede).
• Kim & Lee [2005] investigated cultural influence and mobile interface design to clarify the relationship between cultural traits and mobile phone interfaces. Their subjects came from the USA and Korea. The results suggest a possibility of cultural impact on icon recognition. They found that Korean subjects performed better using concrete representations, while American users preferred the abstract icon representations. This study was again based on the Hofstede premise.
• Lee et al. [Lee et al., 2005] studied multi-cultural usability in mobile phone navigation in a laboratory-based usability experiment with participants from the USA, West Africa, Eastern Europe and South America. They collected cross-cultural usability information in the product development process to determine universal and to-be-localized components, detect mistakes that lead to critical miscommunication, and assess the usability of cross-cultural user interfaces. Their study was again based on Hofstede’s premise, but combined with the work of Jordan [Jordan, 1998] on pleasurable products. They found no real differences between the various cultures for the issue of supportiveness, but found evidence that the perception of the same icons differs across cultures.

Chapter 3 The mobile phone user
A model for representing the motivational and cultural factors that influence mobile phone usage variety 56
The studies quoted are either focused on objective culture, i.e. comparing language, colours and surface elements, or they are considered subjective culture, such as the cultural dimensions of Hofstede. According to Ford and Kotzé [2005], designing for objective culture in HCI has largely been mastered and global standards exist (although the studies by Onibere et al. [2001a], De Wet et al. [De Wet et al., 2002] and Heukelman [De Wet et al., 2002; Heukelman, 2006] all showed that the issue of language is not as clear cut as it is made out to be). Subjective culture, on the other hand, has not been explored and mastered to the same degree.
These studies provide evidence that acculturation is being investigated and could be an important issue for mobile phone design. However, these studies were all fairly small and performed on individual elements of the mobile device interfaces and not the interface as a whole. The following reservations regarding localisation have also been expressed.
• All of these studies were again based on the Hofstede’s model, i.e. on the premise that there is a country-specific cultural profile. Jones and Marsden [2005a] warn against the notion that culture can be quantified as implied by cultural dimensions. Furthermore, a person may be bi-cultural or multi-cultural.
• We have learnt from research in other areas of HCI than interfaces for mobile devices that users may prefer some aspects of acculturation but still want the original interface [De Wet et al., 2002; Heukelman, 2006]. The reasons given are that the English version allows them to improve their English language skills, which in turn could improve their employability [Jones and Marsden, 2005a], or that the English version is easier to use, the English terms were shorter which made the menus easier [De Wet et al., 2002; Heukelman, 2006] and lastly that they knew the English terms for the working environment better than the terms in their native language [Heukelman, 2006] .
• The cost of localization is a problem since adaptations have to be done with the limited input and output capabilities of the small device [Kiljander, 2004]. The final improvement is therefore the difference between the value added and the trade-offs caused by localization.
• Ford [Ford, G., 2005a] pointed out the interaction of culture with concepts of human computer interaction, human information processing and decision-making.
• Individual user differences such as personality also have to be taken into account when considering culture-awareness [Duchatelet, 2001].
Mobile interaction has its own context and dynamics, and mobile phones and the Internet were designed to fit and encourage small power distance, individualism and self-expression. ‘However, because of the advantages they offer, they are without modifications accepted in cultures with large power distance, collectivism and survival-oriented values’ [Strom, 2005a]. This leads to a question for further consideration, namely: Does mobile phone usage conform to the cultural context of the user?

Chapter 3 The mobile phone user
A model for representing the motivational and cultural factors that influence mobile phone usage variety 57
3.6 SUMMARY In this chapter we looked at mobile phone users from the perspective that they are social and cultural
entities. In section 3.2 some of the demographic user characteristics that could influence mobile phone use were discussed and age, gender, technology readiness, social and national culture were noted as variables that influence mobile phone usage. This means that demographic factors will have to be considered in any study on mobile phone usage.
In section 3.3 motivational human needs were considered. Maslow’s theory of motivational human needs [Maslow, 1954] and how this can be related to some other theories such as those of Herzberg [Herzberg, 1968] was also considered. The set of needs proposed by the Institute of Mangement [1997], together with other classifications of needs, were also considered.
Research on mobile phone adoption and usage contains references to motivational [Katz and Sugiyama, 2005; Schiphorst, 2006] needs but motivational needs are not the focus of their studies. Since no research could be found that focuses on investigating the link between basic motivational needs and mobile phone uses, this is identified as an objective of this study.
This was followed by a brief look at the social influence on mobile phone use where some of the issues concerning the mobile phones and social behaviour are highlighted. The emphasis seems to be on finding new ways to use mobile phones in enhancing socialisation [Jones and Marsden, 2005a; Schiphorst, 2006] and the use of mobile phones to eliminate physical location as a determinant of communication [Geser, 2004]. Section 3.5 dealt with user culture. Starting with models and meta-models of ethnic culture, organisational culture and studies conducted on the acculturation of products, it provides a basis for investigating mobile phone culture.
The review of motivational needs led to the conclusion that a possible link between motivational needs and mobile phone usage variety should be investigated. The review of culture, which included ethnic and organisational culture, led to the conclusion that when the influence of cultural factors on mobile phone usage variety is researched, a broad definition of culture, which includes organisational and social culture, should be used. The fact that mobile phones, which encourage small power distance, individualism and self-expression, are accepted in cultures with large power distance, and collectivist values suggests that mobile phone culture takes preference over ethnic cultural values and social behaviour. This is an important notion for further investigation.

Chapter 4 Mobile phone adoption and use
A model for representing the motivational and cultural factors that influence mobile phone usage variety 58
CHAPTER 4: MOBILE PHONE ADOPTION AND USE
4.1 INTRODUCTION The aim of this thesis is to address the following research question: What are the components of a
model to represent the influence of motivational needs and cultural factors on mobile phone usage variety? Mobile phone communications has inherent properties, potential and limitations to be taken into
consideration when considering mobile phone usage variety, some of which were discussed in Chapter 2. The mobile user is a being with abilities, limitations and motivational needs, some of which were discussed in Chapter 3.
Mobile phone adoption and usage lies at the intersection of these two complex concerns. In this chapter the combination of these two concerns is addressed, thus addressing the cross-section of the first three sub-questions of this research:
• Does infrastructure influence mobile phone usage?
• Do cultural and social factors influence mobile phone usage?
• How can motivational user needs be related to mobile phone use?
It also provides the theoretical foundation for the fourth sub-question: How can usage variety be described? by reviewing research on usage variety.
Mobile phones are currently the most ubiquitous communication device worldwide [Khalil and Connelly, 2005b; Nickerson and Isaac, 2006] and therefore mobile phone adoption and use is of interest to both industry and research communities from computer science, the social sciences and marketing. Depending on the primary focus of the community, the view of the user differs for the various fields. Computer science studies would, for example, focus on the design of interaction objects. Studies of mobile phone adoption from a social science point of view treat users as social entities characterised by demographics or usage patterns [Geser, 2004]. Industry and marketing studies treat users as economic entities which are identified and monitored on the basis of rational economic choices [Pedersen, 2003].
When researching the motivational and cultural factors that influence mobile phone usage variety we need to consider mobile phone adoption, since adoption is a prerequisite for use. In this context general models for technology adoption are scrutinized in section 4.2, while section 4.3 deals with specific actors that could influence the adoption of mobile phones. Since mobile phone features have been the major focus in research on mobile phone adoption up to now, the issue of mobile phone features is put under the spotlight in section 4.4. Section 4.5 deals with mobile phone adoption and use from a marketing perspective by addressing consumer segmentation on mobile phone adoption. Existing work on usage variety in using mobile phones is discussed in section 4.6, while section 4.7 end with a reflection on the implications for this study.

Chapter 4 Mobile phone adoption and use
A model for representing the motivational and cultural factors that influence mobile phone usage variety 59
4.2 TECHNOLOGY ADOPTION Technology adoption involves the user, the technology and the context [Humphreys, 2005]. Various
models for understanding technology adoption have been proposed. Pedersen [2003] lists Roger’s innovation diffusion model, the domestication model and the technology acceptance model (TAM) as the three most commonly applied.
• Roger’s innovation diffusion model is founded in sociology but has also been applied to the world of marketing where users are seen as economic entities, the model provides an approach to understanding how innovations are adopted by a particular population [Rogers, 2003].
• Silverstone and Haddon [1996] proposed the domestication model where users are seen as social entities and the model aims to provide a framework for understanding how technology innovations change and are changed by their social contexts.
• The technology acceptance model was developed by Davis [1989] to explain the determinants of computer acceptance and usage behaviour.
While Rogers’ innovation diffusion model focuses on marketing and sales processes, the domestication approach deals with a more global analysis of adoptions ex post facto and the TAM focuses on information technology adoption in organisations [Ling, 2001].
This research focuses on understanding the motivational and cultural factors that influence mobile phone usage variety but since the adoption of the mobile phone is a prerequisite for use, the three adoption models mentioned will now be considered in more detail.
4.2.1 Technology Acceptance Model
The Technology Acceptance Model (TAM) proposes that beliefs about usefulness and ease of use are essential elements in determining user attitude towards using a new technology [Davis, 1989; Malhotra and Galletta, 1999; Kleijnen et al., 2004]. The theoretical foundation for TAM is based on Fishbein and Ajzen’s theory of reasoned action (TRA) model [Fishbein and Ajzen, 1975].
TRA is a widely studied model in social psychology [Malhotra and Galletta, 1999; Kwon and Chidambaram, 2000; Pedersen, 2003]. It attempts to explain why people behave as they do in situations of ‘reasoned action’ by identifying causal relations between beliefs, attitudes, intentions and behaviour [Kwon and Chidambaram, 2000; Barnes and Huff, 2003; Pedersen, 2003]. Attitude is defined as the individual’s positive or negative feelings about enacting a target behaviour [Uzoke et al., 2006]. TRA is illustrated in Figure 4.1.
The TRA has the following components [Fishbein and Ajzen, 1975; Malhotra and Galletta, 1999].: 1. Actual behaviour: According to TRA a person’s performance in a specified behaviour is
determined by the behavioural intention (BI) to enact the behaviour.

Chapter 4 Mobile phone adoption and use
A model for representing the motivational and cultural factors that influence mobile phone usage variety 60
2. Behavioural intention (BI): BI is jointly determined by the person’s attitude (A) and the subjective norm (SN) concerning the behaviour in question, with relative weights estimated by regression [Davis et al., 1989]:
SNABI += 3. Attitude towards behaviour (A): A person’s attitude towards behaviour is determined by their
salient beliefs (bi) about the consequences of performing the behaviour multiplied by the evaluation (ei) of those consequences.
∑=
=n
iiiebA
1where Nn ∈
4. Subjective norm (SN): Subjective norm refers to the social pressure exercised on the person to either enact or not enact the behaviour [Kwon and Chidambaram, 2000] and is expressed as the sum of all the person’s normative beliefs (nbi), which consists of the perceived expectations of specific significant individuals or groups’ reaction, multiplied by the person’s motivation to comply (mci).with these expectations:
∑=
=n
iiimcnbSN
1where Nn ∈
Figure 4.1: Diagrammatic representation of the TRA adapted from [Davis et al., 1989] TRA is a general model and it does not specify the active beliefs for a specific behaviour. Therefore a
researcher using TRA has to identify the beliefs that are relevant for subjects regarding the behaviour under investigation. For example, if TRA is applied to mobile phone use, people’s beliefs regarding the benefits or liabilities of mobile phone use have to be identified by the researcher.
Beliefs and
Evaluations
Normative Beliefs
and Motivation to Comply
Attitude
towards
Behaviour (A)
Subjective
Norm (SN)
Behavioural Intention
(BI)
Actual
Behaviour

Chapter 4 Mobile phone adoption and use
A model for representing the motivational and cultural factors that influence mobile phone usage variety 61
The Technology Acceptance Model (TAM) is a special case of TRA for modelling technology adoption in organisations [Pedersen, 2003]. TAM, as illustrated in Figure 4.2, includes six concepts [Davis et al., 1989; Malhotra and Galletta, 1999; Urbaczewski et al., 2002]:
1. External variables (EV): External variables influence perceived usefulness (PU) and perceived ease of use (PEOU or PEU), for example demographic variables (as discussed in Chapter 3).
2. Perceived usefulness (PU): Perceived usefulness is defined as ‘the extent to which a person believes that using the system will enhance his or her job performance’ [Venkatesh and Davis, 2000].
3. Perceived ease of use (PEU): perceived ease of use is ‘the extent to which a person believes that using the system will be free of effort’ [Venkatesh and Davis, 2000].
4. Attitudes towards use (A): Attitude towards use is defined as ‘the user’s desirability of his or her using the system [Malhotra and Galletta, 1999]. Perceived usefulness (PU) and perceived ease of use (PEU) are the sole determinants of attitude (A) towards the technology system. Perceived usefulness and perceived ease of use is determined by external variables (EV) and attitudes toward use (A) can therefore be defined as:
A = PU + PEU + EV 5. Behavioural intention (BI): Attitude (A) combined with perceived usefulness (PU) predict
behavioural intention (BI):
BI = A + PU 6. Actual use: Behavioural intention (BI) in turn predicts actual use. The attitude towards adopting a technology is believed to be the result of personal and social
influences and the fact that TAM does not account for social influence is a limitation [Davis et al., 1989; Malhotra and Galletta, 1999].
Figure 4.2 : Technology Adoption Model (TAM) [[Davis et al., 1989]
External
Variables
(EV)
Perceived usefulness
(PU)
Perceived Ease of Use (PEU)
Attitude toward
use (A)
Behavioural Intention to use
(BI)
Actual system Use

Chapter 4 Mobile phone adoption and use
A model for representing the motivational and cultural factors that influence mobile phone usage variety 62
TAM is noted as one of the most influential models in technology adoption research and represents an important theoretical contribution towards understanding information system usage and information system acceptance behaviour [Malhotra and Galletta, 1999]. While the TAM model is mainly applied to explaining the adoption of technology within organizations, the constructs of the model are meant to be fairly general and universal to different types of computer systems and user populations [Malhotra and Galletta, 1999]. However, it has also been criticised for its shortcomings. For example, the attitude towards adopting a technology is believed to be the result of personal and social influences and the fact that TAM does not account for social influence is a limitation [Malhotra and Galletta, 1999].
Over the years several researchers have used the TAM model to explain the attitudes and behaviours of information system users. The following studies are noted for applying and extending the TAM:
• As mentioned before, TAM does not account for social influence in the adoption and utilization of new information systems. Perceived ease of use and perceived usefulness are the only determinants of attitude towards using the technology and behavioural intention to use the technology. In addressing this problem, Malhotra and Galetta [1999] established a theoretical and empirical base for the introduction of social influence through the processes of internalization, identification and compliance with the TAM model. According to their findings, users’ attitudes are directly affected by social influence, while behavioural intentions are indirectly affected.
• Urbaczewski et al. [2002] did research on finding the predictors of use and ease of use in new system acceptance. They propose the addition of culture as a variable that might determine the success or failure of an innovation.
• Meso et al. [2005] applied TAM to study mobile information and communication technology (mobile ICT) in the least developed countries, specifically sub-Saharan Africa. In addition to the traditional TAM factors of usefulness and ease of use, they found that easier access and greater reliability of the technology contribute significantly towards greater confidence and hence greater use of mobile ICTs.
• Uzoke et al. [2006] used the TAM model to investigate infrastructural, management and behavioural factors that impact on e-commerce development. They found that infrastructural and management factors exerted considerable influence over the organizational decision to adopt e-commerce while behavioural aspects had a minimal impact.
Considering the studies mentioned, it can be deduced that social and cultural factors influence technology adoption [Malhotra and Galletta, 1999; 2002] though these factors are not modelled by the TAM. Furthermore, the TAM model is based on the assumption of the availability of basic infrastructure and organisational context for the adoption of new technology. If this is not the case then conditions facilitating infrastructure become important in technology adoption.
Venkatesh [2003] developed the Unified Theory of Acceptance and Use of Technology (UTAUT) model to explain user intentions to use an information system and subsequent usage behaviour. The UTAUT was developed through a review and consolidation of the constructs of the following models

Chapter 4 Mobile phone adoption and use
A model for representing the motivational and cultural factors that influence mobile phone usage variety 63
(theory of reasoned action, technology acceptance model, motivational model, theory of planned behaviour, a combined theory of planned behaviour/technology acceptance model, model of PC utilization, innovation diffusion theory and social cognitive theory).
According to UTAUT [Venkatesh, 2005], performance expectancy, effort expectancy, social influence and facilitating conditions are the four key constructs that determine usage intention and behaviour. Gender, age, experience, and voluntariness (i.e. the degree to which use of the innovation is perceived as being of free will) are mediating factors in the impact of the key constructs on usage intention and behaviour. An important contribution of UTAUT is to distinguish between mediating factors and determining factors.
The following studies applied the TAM to mobile phones or mobile phone features:
• Kwon and Chidambaram [2000] applied the TAM model to mobile phone adoption. They found that perceived ease of use significantly affected users' extrinsic and intrinsic motivation, while apprehensiveness about cellular technology had a negative effect on intrinsic motivation.
• Lee et al. [2002] studied user acceptance of the mobile internet and found that social influence and self-efficacy variables significantly affect perceived usefulness and perceived ease of use respectively, while perceived ease of use and perceived usefulness influence actual usage frequency.
• Pedersen [2003] studied the adoption behaviour of early adopters of mobile commerce services. According to his findings, the TAM model should be extended to include both subjective norm and behavioural control norm in order to improve model fit and add explanatory power. Behavioural control includes two components: resources, e.g. time, and financial resources, and self-efficacy. The latter refers to the users’ confidence in their own ability to enact behaviours or use a service. Behavioural control relates to both intention to use and actual use. It reflects the internal and external constraints on behaviour.
• Teo and Pok [2003b] studied the adoption of WAP-enabled mobile phones among Internet users and found that attitudinal and social factors like perceptions of relative advantage (usefulness), risk and image play a significant role in influencing intentions to adopt a WAP-enabled mobile phone.
• Kleijnen et al. [2004] investigated consumer acceptance of wireless finance and found that the variables of perceived cost, system quality and social influence correlated significantly with attitude towards use. The variables of age, computer skills, mobile technology readiness and social influence proved to have moderating effects in the mobile phone usage context.
• Roberts [Roberts, 2004] studied factors in corporate adoption of mobile phones and found security, reliability, digital standards and web connectivity to be the most important technology adoption factors, with customer service the most important non-technology factor.
Two of the findings regarding mobile phone adoption have special significance for this research:

Chapter 4 Mobile phone adoption and use
A model for representing the motivational and cultural factors that influence mobile phone usage variety 64
• Given that cultural factors are encompassed in the social factors, the finding that social factors influence mobile phone adoption [Peterson, 1994; Teo and Pok, 2003b] provides justification for investigating cultural factors as an influence in mobile phone usage variety
• The importance of infrastructural factors in mobile phone adoption [Kleijnen et al., 2004] means that infrastructural factors will have to be taken into account during the design of this research, e.g. selection of participants with access to similar infrastructure, etc.
TAM therefore provides a useful reference point for the issues to investigate when considering the factors that influence mobile phone usage, although it must be borne in mind that TAM models technology adoption, while this research seeks to model mobile phone usage. Considering the components of the TAM as depicted in Figure 4.2, external variables encompass demographic variables as was discussed in Chapter 3. Social and cultural influences (as discussed in Chapter 3) are not a component of the TAM, though they are a component of the TRA on which the TAM is based and were found relevant to technology adoption by several researchers. This supports the aim of this study, namely to investigate cultural factors in mobile phone usage.
4.2.2 Domestication
The domestication theory was founded by Silverstone and Haddon [1996] who view technologies as social, cultural, political and economic products which play a symbolic and aesthetic as well as material and functional role. Pedersen et al. [2002] distinguish between the first purchase decision, which refers to adoption, and post-decision buying behaviour. They recommend that usage be seen as a transition between stages of increasing consumer sophistication in the consumer life cycle rather than a specific event. Brown and Randell [2004] uses the term ‘dwelling’ with technology to describe the study of technology use over a long period of time where the context in which technology is used may change.
The concept of domestication is derived from the British studies on consumption [Sun, 2004]. It refers to the taming of innovation by the individual and focuses on the process that integrates technology into everyday domestic life [Pedersen, 2003; Sun, 2004]. The domestication approach considers the following phases in the adoption process [Silverstone and Haddon, 1996; Ling, 2001; Habib, 2003]:
• Commodification: the way a technology is designed to give it an image with a number of functional, aesthetic and symbolic claims.
• Imagination: the way in which an innovation enters our consciousness.
• Appropriation: the actual purchase of the technology.
• Objectification: the phase in which the technology is made acceptable and familiar in the daily life of the consumer.
• Incorporation: integrating the technology with daily use.

Chapter 4 Mobile phone adoption and use
A model for representing the motivational and cultural factors that influence mobile phone usage variety 65
• Conversion: the technology becomes fitted into routines and is seen by others as part of the individual’s identity.
The domestication approach considers consumption rather than mere use, and views adoption as a process rather than a specific event [Ling, 2001; Haddon, 2003]. The domestication approach aims to discern the interaction between the innovation and the context in which it is being placed. Therefore contexts are often contrasted, for example work versus leisure, private versus public, and contrasts between users in different demographic groups [Ling, 2001].
Domestication studies do ex post facto examination of technology adoption to understand why a technology has been adopted and why not [Pedersen, 2003]. It is intended as a tool for observing adoption rather that a tool for the prognosis of an adoption [Ling, 2001].
This research views users as social entities, which is in accordance with the domestication approach. The acknowledgement of the importance of context and the post-adoption focus make the domestication approach relevant to understanding the factors that influence mobile phone usage variety. Given the widespread adoption of mobile phones, they are already in the appropriation phase and beyond. Therefore this study will not consider specific phases in the adoption process, but rather the factors relating to post-adoption usage variety.
4.2.3 Innovation diffusion model
Rogers developed the innovation diffusion model to explain how an innovation diffuses through a society [Geoghegan, 1994; Walton and Vukovic, 2003; Kiljander, 2004; Rogers, 2003]. The innovation diffusion model has been used extensively to explain the acceptance or rejection of IT innovations in an organisation or society [Urbaczewski et al., 2002].
According to Rogers [2003:36]. ‘An innovation is an idea, a practice, or object that is perceived as new by an individual or another unit of adoption’. ‘Diffusion is the process by which an innovation is communicated through certain channels over time among the members of a social system’ [Rogers, 2003:35]. The rate of adoption is determined by the characteristics of an innovation, which are as follows: [Rogers, 2003]:
• Relative advantage described as ‘the degree to which an innovation is perceived as better than the idea it supersedes’ [Rogers, 2003:15].
• Compatibility refers to the ‘degree to which an innovation is perceived as being consistent with the existing values, past experiences, and needs of potential adopters’ [Rogers, 2003:15].
• Complexity is ‘the degree to which an innovation is perceived as difficult to understand and use’ [Rogers, 2003:16].
• Trialability refers to ‘the degree to which an innovation may be experimented with on a limited basis’ [Rogers, 2003:16].

Chapter 4 Mobile phone adoption and use
A model for representing the motivational and cultural factors that influence mobile phone usage variety 66
• Observability refers to ‘the degree to which the results of an innovation are visible to others’ [Rogers, 2003:16].
Rogers’ adoption/innovation curve divides adopters of innovations into five categories [Rogers, 2003], as depicted in Figure 4.3.
Innovation distribution
Innovators 2.5
Laggards 16Early
Adopters 13.5
Late Majority 34
Early Majority 34
0
5
10
15
20
25
30
35
40
Innovators EarlyAdopters
Early Majority Late Majority Laggards
Figure 4.3: Expressing Rogers’ adopter groups as a percentage of the population Each adopter group in the model represents a unique psychographic profile based on the idea that some
individuals are more open to adoption than others are. The categories can be described as follows [Geoghegan, 1994; Walton and Vukovic, 2003; Kiljander, 2004; Rogers, 2003]:
• Innovators: These are the ‘techies’, the experimenters who have technology as a central interest in their lives and pursue new technology as soon as it appears, no matter what its function is. They get acquainted with the details of all the new hardware and software, finding pleasure in mastering the intricacies of the technology. Their interest lies more with the technology itself than with its application to problems. Innovators make up approximately 2.5 per cent of the population.
• Early adopters: They are the ‘visionaries’ who blend an interest in technology with a concern for significant professional problems and tasks. They are mostly not technologists but exploit the new capability. They find it easy to imagine, understand and appreciate new technologies for their potential to bring about major improvements and achieve a competitive advantage. They provide seed funding for entrepreneurs since they are risk-takers, not averse to occasional failure, who often favour a tightly focused project orientation in their work. Early adopters make up approximately 13.5 per cent of the adopter population.

Chapter 4 Mobile phone adoption and use
A model for representing the motivational and cultural factors that influence mobile phone usage variety 67
• Early majority: They are the ‘pragmatists’. Although fairly comfortable with technology in general, their focus is on concrete professional problems rather than on the tools (technological or otherwise) that might be used to address them. They are driven by a strong sense of practicality and thus adopt a ‘wait-and-see’ attitude toward new applications of technology, i.e. they like to wait and see how other people are doing before they buy in themselves. They require concrete references and examples of success before adopting. They avoid abrupt change, being more attuned to evolutionary modification of existing processes and methods. The early majority want to see compelling value in an innovation before adopting it. They make up approximately 34%, which is the first half of the mainstream.
• Late majority: They are the conservatives or ‘sceptics’. They share the attitude of the early majority, though being less comfortable with technology. They will wait until something has become an established standard, and they prefer buying from large, well-established companies. By definition, they accept innovation only when the change has already become well established among the majority. The late majority make up approximately 34%, which is the latter half of the mainstream.
• Laggards: They are the most likely never to adopt at all. They are not interested in new technology and they generally buy technology products only when these are buried inside other products. Laggards make up the last approximately 16 per cent of the potential adopter population.
A successful innovation will be adopted in this order, beginning with the innovators, followed by the early adopters, the early and late majority, and perchance the laggards. A new technology is best focused on innovative adopters since they do not insist that the technology should have a track record, as they value a product on the basis of the latest technology built into it [Leung et al., 2003].
The mainstream of pragmatists and sceptics makeup the bulk of all technology infrastructure purchasers and represent about 68 per cent of the total population [Geoghegan, 1994; Rogers, 2003]. They adopt innovations only after a proven track record of useful productivity improvement [Leung et al., 2003].
The laggards are price-sensitive conservatives who are pessimistic about their ability to gain any value from technology investments. Although they are demanding consumers who delight in challenging the hype of high-tech marketing, they are still potential customers [Geoghegan, 1994]. The early and late markets (innovators, early adopters and laggards) each make up about 16 per cent of the market [Geoghegan, 1994; Rogers, 2003].
Ling [2001] notes the following problems with Rogers’s model:
• The model assumes that users behave in a rational way by weighing positive and negative factors. This does not acknowledge the influence of broader social processes.
• The model assumes the ideal Gaussian adoption curve, which is rarely achieved in reality.
• The model stops with the adoption of the innovation and does not consider ex post facto analyses of adoptions. This may not be a problem from the marketing and sales perspective, but in HCI and sociology research, both the adoption and rejection of innovations are of interest.

Chapter 4 Mobile phone adoption and use
A model for representing the motivational and cultural factors that influence mobile phone usage variety 68
Other models that deal with technology diffusions are the Bass diffusion model [Ali-Vehmas and Luukkainen, 2005], the product life cycle by Levitt and the Positioning model by Trout and Reis [[12Manage Rigor and Relevance, 2006]. According to all these models, the number of success factors are limited [Ali-Vehmas and Luukkainen, 2005]. The fact that there are a limited number of factors determining the success of technology adoption makes it more feasible to model technology adoption.
The Rogers Innovation Diffusion Model focuses only on adoption and therefore it cannot be used to represent usage directly. However, the innovation diffusion model has implications for mobile phone usage since it describes customer segmentation. Furthermore, mobile phone adoption is becoming more widespread having implications for usage variety (as will be discussed in section 4.4).
4.3 FACTORS THAT INFLUENCE MOBILE PHONE ADOPTION AND USAGE
There is a difference between users’ immediate preferences exercised when purchasing goods, which determine the decision to select (adopt) a phone, and their performance and actual behaviour over time, which is referred to as usage [Buchanan et al., 2001]. Although this research is primarily about usage, both facets are integrated, the reason being that in the case of mobile phones, usage is widespread and adoption decisions are often based on current usage behaviour. For example, a person may not require a camera in a new phone because they do not use the camera in the phone they currently use.
Various factors that influence technology usage have been identified over time [Davis, 1989; Venkatesh et al., 2003; Rogers, 2003]. The following determinants of mobile phone adoption and usage have been identified:
• Usefulness and ease of use [Kwon and Chidambaram, 2000].
• The wireless industry focuses on cost, power and feature capability, in this order of importance [Winters et al., 2004].
• Mobile phone adoption is influenced by technological, business strategic and behavioural factors [Pedersen, 2003; Kleijnen et al., 2004; Rogers, 2003].
• Teo and Pok [2003] list personalisation and convenience as the two basic criteria driving a very successful mobile application.
• Balaji et al. [2005] itemise four components of a successful mobile product: business model (billing) that fits the service’s natural usage pattern; mobile phones that deliver new features aimed at customer needs; device-level applications that leverage the new features; and mobile content designed for utilization within mobile usage scenarios.
• According to Ali-Vehmas and Luukkainen [2005], the most influential factors determining service adoption include: complexity of the product and the service (including usability and configurability), compatibility with other relevant services and relative advantage of the new service compared to the original ways of doing similar tasks.

Chapter 4 Mobile phone adoption and use
A model for representing the motivational and cultural factors that influence mobile phone usage variety 69
Applying the UTAUT model’s [Venkatesh et al., 2003] distinction between determining factors and mediating factors to the studies mentioned here, as well as those discussed under technology adoption in section 4.2.1, a set of key constructs emerge which form the basis of technology adoption and usage models accompanied by a set of moderating factors. The basic constructs for explaining mobile phone technology adoption and usage include:
• Perceived usefulness [Kwon and Chidambaram, 2000; Lee et al., 2002; Teo and Pok, 2003b] or performance expectancy [Venkatesh et al., 2003].
• Perceived ease of use [Kwon and Chidambaram, 2000; Lee et al., 2002; Ali-Vehmas and Luukkainen, 2005] or effort expectancy [Venkatesh et al., 2003].
• Subjective norm [Pedersen, 2003] or social influence [Malhotra and Galletta, 1999; Lee et al., 2002; Kleijnen et al., 2004], which includes cultural influence [Urbaczewski et al., 2002]
• Facilitating conditions: cost (business model) and infrastructure i.e. system quality, mobile phone features [Winters et al., 2004; Balaji et al., 2005] and system security [Pedersen, 2003; Kleijnen et al., 2004; Roberts, 2004; Winters et al., 2004].
• Attitude towards adoption or usage [Kwon and Chidambaram, 2000; Kleijnen et al., 2004].
• Behavioural intention to use [Kwon and Chidambaram, 2000; Venkatesh et al., 2003; Kleijnen et al., 2004].
• Use behaviour, i.e. number of calls, length of calls, type of calls (personal or work-related) [Kwon and Chidambaram, 2000] .
The relations between the determining factors are influenced by mediating factors, which are the following:
• Demographic factors: Age [Kwon and Chidambaram, 2000; Pedersen, 2003; Kleijnen et al., 2004], gender [Nickerson and Isaac, 2006; Wei and Lo, 2006; Wilska, 2003], education [Ho and Kwok, 2003; Bina and Giaglis, 2005], computer skills and technology readiness [Kleijnen et al., 2004]
• Socio-economic factors: income and job status [Ho and Kwok, 2003; Bina and Giaglis, 2005]
• Personal factors: Self-efficacy [Pedersen, 2003], risk [Teo and Pok, 2003b], image [Teo and Pok, 2003b] and experience [Venkatesh et al., 2003].
Considering the constructs noted here usability including usefulness and ease of use will be discussed in section 4.3.1. Usability is affected by the fact that users have limited cognition and attention capacity. The issue of cognitive load is thus discussed in section 4.3.2.
Usefulness is dependent on the mobile user’s needs and the mobile phone’s features and functions available to satisfy the needs and therefore mobile phone features are discussed in section 4.3.3 as a facilitating condition. Usefulness is determined by the user segment and consumer segmentation is therefore discussed in section 4.3.4.
Social influence was discussed in Chapter 3, section 3.3. The remaining determining factors have been described in section 4.2.1 under technology adoption. As far as possible, mediating factors will be

Chapter 4 Mobile phone adoption and use
A model for representing the motivational and cultural factors that influence mobile phone usage variety 70
controlled in the research design. This means that participants will have to be purposively selected to fit a demographic or socio-economic group and the findings on mobile phone usage behaviour will only pertain to that group. Data will have to be captured to monitor demographic and socio-economic factors. Demographic variables were discussed in section 3.2. Socio-economic factors will not be discussed although income and job status will be taken into account in the research design as discussed in Chapter 5. Personal factors will be noted and measured as far as possible, but as yet, data on technological orientation is the only personal variable identified for this study.
4.3.1 Usability of mobile phones
Nielsen [Nielsen, 1993] defines usability and utility as attributes of usefulness. According to the ISO 9241-11 [1998], usability is defined as ‘the extent to which a product can be used by specified users to achieve specified goals with effectiveness, efficiency and satisfaction in a specified context of use’. Preece et al. [Preece et al., 2002] list the following as usability goals: efficient to use, effective to use, safe to use, easy to remember how to use, easy to learn, have good utility (usefulness).
Jones and Marsden [2005a] argue that ‘A mobile’s usability is affected by two factors: its intrinsic ease-of-use - the way it presents its functionality, the feedback given to users and more; and how well it fits in with other resources at the user’s disposal.’. The importance of compatibility with other relevant resources and services is supported by Balaij [Balaji et al., 2005].
Davis et al. [1989] found that usefulness is more important than ease of use since users are willing to tolerate difficult interfaces in order to access functionality. If a product is considered useful then problems with usability are overlooked but if a product is useless, then usability is irrelevant [Thimbleby, 2001]. Pedersen [2003] supports the significance of usefulness at the expense of ease of use by noting that the latter is an important determinant in the early stages of an adoption process but becomes less important at later stages.
On the other hand, usefulness may override negative experience for a time, especially when user expectations are low, but as time progresses and expectations rise, usability could become an issue that affects customer satisfaction and, consequently, product reputation [Jokela, 2004; Rondeau, 2005].
Designing for ease of use is more complicated in the world of mobile UI design, where there is no single de facto style as there is for personal computers where designers develop and maintain brand-specific UI styles [Ketola, 2002]. Therefore progress in usability has been counterbalanced by rapid technological innovation that has kept design standards in flux [Rappa, 2004].
Three key factors can be defined that influence the usability of mobile devices [Kristoffersen and Ljungberg, 1999; Han et al., 2004; Hansen et al., 2005; Holtzblatt, 2005; Humphreys, 2005]:
• The characteristics of the applications and physical limitation of the equipment: The UI design has to consider the physical characteristics including the parameters of the interaction devices (e.g. screen size, buttons’ appearance and functionality, sound capturing, etc.), computational facilities (e.g. memory and processing power) as well as the communicational facilities (e.g. bandwidth of

Chapter 4 Mobile phone adoption and use
A model for representing the motivational and cultural factors that influence mobile phone usage variety 71
the communication channels.). Ji et al. [2006] proposed a checklist to support usability evaluation of mobile phone interfaces.
• Usage context of the mobile device: Mobile phone interaction design also presents a challenge in dealing with the tension between the appropriate user interface design for the device and the social context of the device’s use [Holzinger and Errath, 2004]. In designing for mobile phone interaction, the designer has to address context explicitly. The context of the mobile user was discussed in section 1.2.2.
• Needs and characteristics of the mobile user: Mobile phone usage spans age, education and other demographic segments as few, if any technologies have done before. User needs and demographic influence are discussed in Chapter 3. Identifying user segmentation and the study of usage variety are approaches to the challenge of matching a user with the optimal mobile phone. User segmentation is discussed in section 4.3.4 and usage variety in section 4.4.
A complicating factor in mobile phone interaction is that the user has to deal with a system that includes the device (handset), the network and the services as well [Ketola and Röykee, 2001]. The responsibility for improving usability therefore does not rest only with the handset manufacturers. Service providers also have an opportunity to improve usability through streamlining and simplifying business plans and policies. Mobile phone users have to consider and cognitively process all these contributing factors. The effect of this cognitive overhead is discussed in the next section.
4.3.2 Cognitive load of mobile phone usage
Mobile phones provide anytime, anywhere services and enable people to be always connected or reachable through services such as roaming and the capacity to send messages. These services make cell phones the prime example of mobile devices that demand constant cognitive attention from the user. They also serve as a frequent source of interruption and distraction. There is evidence that users are suffering disorders like anxiety due to the fact that they are always connected and therefore technically always available [Jarvenpaa et al., 2003]. Considering the increasing number of mobile devices that request users’ attention, it is essential to minimize interruptions and distractions caused to the users and the surrounding environment [Donner, 2004].
A related problem is the fact that users do not keep up cognitively and technically with mobile computing devices. Gilbert et al. [2005] note that few consumers are able to set up new digital devices and integrate them into everyday life. They give the data-enabled mobile phone as the prime example. In many markets, mobile phones have a product life cycle of 12 months or less [Winters et al., 2004]. While some subscribers are able to put their new phones to immediate and full use, others find the learning curve is so steep that they move on to a replacement without ever having learned to exploit the functionality available in the previous phone [Gilbert et al., 2005; Ziefle and Bay, 2005].
Furthermore, the evolution in mobile user interface design is driving towards maximizing the portion of the screen size in the phone face, colourizing the display and minimizing the whole product size while

Chapter 4 Mobile phone adoption and use
A model for representing the motivational and cultural factors that influence mobile phone usage variety 72
increasing the number of features [Nguyen and Garrett, 2003; Winters et al., 2004]. This causes escalating complexity with regard to functional range and increased complexity related to overloaded key functionality [Ziefle and Bay, 2005]. While providing users with more utilities, these new features may also put extra cognitive load on the users and make the use of mobile phones more difficult and cumbersome [Ling and Hwang, 2005].
Human attention is becoming the most precious resource, considerably more so than computational power since it is more constrained [Donner, 2004]. Interface designers aim to preserve human attention and improve usability by using the mental models and knowledge that users already have of mobile phones [Noy, 2004; Weißenberg et al., 2004]. The personal history of a user proved successful in specifying user preferences while the histories of other users were not useful unless the user’s preferences matched their own [Terveen et al., 2002].
Another approach to reducing the cognitive overload is to provide personalised information services [Lee and Lu, 2003] based on the user profile [Weißenberg et al., 2004]. Mobile phones are usually designed for use by only one person, which makes personalisation easier. Information on the individual’s situation and personal demands can be used in determining the appropriate set of information and services [Teo and Pok, 2003a]. For example, Ho and Kwok [2003] considered the use of personalisation in filtering advertisements on mobile phones since the information overload makes it difficult to locate the useful messages. They found that customers have more concerns regarding the usefulness, and most likely the accuracy, of useful personalized messages than about the privacy issues. Apart from the incentive to manage the information overload, customization of mobile devices is also a key issue owing to the limitations of the user interface in terms of size, resolution and ‘surfability’ [Tsalgatidou et al., 2000].
Having considered the implications of usability and cognitive overload for mobile phone adoption and usage, the selection of mobile phone features is the next issue to be considered.
4.3.3 Selecting mobile phone features
The term ‘mobile phone feature’ needs to be defined since it has different meanings in different contexts. As noted in Chapter 1, in the context of this research, features are designated as any specification, component, capability, service or function that a mobile phone offers the user, except where explicitly stated otherwise.
Vendors of mobile phones tend to list items such as alarm, phone book, screensavers, etc., as phone features, while camera, Bluetooth and MMS are listed under phone capabilities [Vodacom, 2005].
Han et al. [2004] regard features as a specification of a product from a user satisfaction point of view. User satisfaction is defined as the user’s subjective feeling toward a product based on the components, their properties and the relationship between them [Han et al., 2004]. Satisfaction is a core aspect of usability [9241-11, 1998].
Advances in technology and the marketing push of features together with the user pull for new features lead to an ever-increasing number of features to choose from [Coen et al., 2002]. There are people who see

Chapter 4 Mobile phone adoption and use
A model for representing the motivational and cultural factors that influence mobile phone usage variety 73
mobile phones as a communication tool, claiming not to care about their appearance or symbolism [Katz & Sugiyama, 2005]. On the other hand there are the people to whom the status that design, logo, brand or new capability imparts, is crucial. ‘In order to underscore the element of prestige in a technology that is becoming omnipresent, there has been a figurative arms race towards more lavish phones’ [Katz and Sugiyama, 2005].
Despite the importance of features in marketing or purchasing a mobile phone, the consumer may not actually use all the functionality [Kiljander, 2004]. Adding design features increases the price and the complexity of using the phone [Ziefle and Bay, 2004; Rondeau, 2005].
Rogers’ [2003] innovation diffusion curve implies that products are often sold very successfully simply because they have become available. The product initially tends to have a few obviously useful and focused features. With time and increasing market saturation what tends to happen is that features are added with increasing frequency, often leading to ’feature creep‘ [Norman 1988] or ‘featuritis’ [Palen, Salzman et al. 2000].
This trade-off between adding features and maintaining usability warrants careful consideration. Norman [1998] uses Moore’s law [Moore, 1965] of substantial, sustained improvement of computing power to predict that usability will become more important than adding features. He argues for a critical point after which technical capability will become adequate and hence irrelevant, and subtler properties like usability will then become critical.
Thimbleby [2001] highlights another consequence of Moore’s law: the continuous availability of new, more featured products discourages efforts to improve the usability of products with short life cycles. This phenomenon is driven by the need to increase the demand and desirability of the product but in reality it often has the effect of reducing usability and tends to be counter-productive.
Mohageg and Bergman [2000] introduced the concept of the ‘functionality threshold’ to mark the point beyond which further functionality creates unnecessary complexity. Kiljander [2004] highlights the 80/20 rule according to which designers should identify and focus on the 20% functions that will meet 80% of user’s task needs.
Much research is directed at finding the set of key features around which the user interface should be optimised for each target group [Jarvenpaa et al., 2003; 2004]. A literature overview offered the following research directions and findings on identifying such critical mobile phone features:
• Han, Kwang et al. [2004] developed empirical models to link design features to satisfaction levels. Design properties common to ‘desirable’ and ‘undesirable’ phones were then extracted by comparing the values of the critical design features. While the study contributes an approach to identifying desirable attributes, they studied only the physical attributes of the phone such as shape, body material, colour, etc.
• Jarvenpaa, Lang et al. [2003] looked at distinguishing ‘nice-to-have’ features from ‘must-haves’ in m-commerce by looking at how the devices affected people’s lives. They found that mobile communications have increased user’s freedom psychologically, socially and physically, but that

Chapter 4 Mobile phone adoption and use
A model for representing the motivational and cultural factors that influence mobile phone usage variety 74
some users are experiencing disorders of freedom which deflect from the value of mobile communication. They recommend that the industry should move beyond ‘nice-to-have’ services to ‘must-have’ services that affect people’s lives positively.
• Teo and Pok [2003a] studied the adoption of the Internet and WAP-enabled phones in Singapore. They found that Internet users are generally young, male and educated. Respondents did express significant interest in using WAP-enabled mobile phones for time-sensitive activities such as buying concert/cinema tickets, receiving personalised news and appointment reminders.
• A study by Ling and Hwang [2005] considered user preference for specific features. They studied five mobile phone design features: camera, colour display, voice dialling, Internet browsing and wireless connectivity (e.g. Bluetooth, infrared, etc.). Their results indicate that by including colour display and Internet browsing features in mobile phone design, user’s overall satisfaction may significantly improve. However, users’ overall satisfaction may equally not be significantly affected by the existence of the camera, voice dialling and wireless connectivity. Redundant features place an unnecessary cognitive load on users and make the use of the phone unnecessarily complicated and cumbersome [Ling and Hwang 2005].
• Alahatuha et al. [2005] conducted a study in Finland and identified the most important new features in the private user’s sector as colour display, GPRS/EDGE, WAP, MMS and Java functionality. These features set the basis for most current mobile services and their presence has increased rapidly. Their study indicated that nearly all new mobile phones in Finnish markets had the above-mentioned features in 2004, and almost half of all mobile phones used in Finnish markets would have these features by the end of 2005 [Alahatuha et al., 2005].
• Ziefle and Bay [2004] researched different factors that contribute to mobile phones’ complexity (e.g. structure of the phone menu, function naming, appropriateness of the categorisation of menu functions or complexity of keys), but could not find which is principally harmful with regard to the ease and the success with which a phone can be used.
• Ziefle and Bay [2004] also reported that the current trend in the mobile area is in the direction of escalating complexity with regard to functional range and increased complexity related to overloaded key functionality. This trend is continuing, despite the fact that features are not the most important criteria to customers in selecting a mobile phone [Marcus, 2005b; Ziefle and Bay, 2005].
It is therefore difficult for designers to discern the right way to boost phone value. Sometimes the addition of a feature does indeed prove particularly attractive, as is the case for SMS messaging, which is clearly valued and used by mobile phone users [Gilbert and Kendall, 2003; Jenson, 2004]. On the other hand, WAP services which are technically more sophisticated than SMS have failed to attract the expected user support [Gilbert and Kendall, 2003].
Sometimes a feature results in a severe reduction in the usability of the device and proves counter- productive in terms of increasing value across all user types [Croasmun, 2004], for example the perceived

Chapter 4 Mobile phone adoption and use
A model for representing the motivational and cultural factors that influence mobile phone usage variety 75
need to design smaller phones. Another example is the use of video telephony. Call costs were assumed to be the reason for low usage, but a study by O'Hara et al. [2006] established that social and practical problems were the real barriers to use. The problems included concerns about privacy management in public spaces and practical problems with ambient noise and lighting in particular locations.
It has also been found that new mobile users often have unformed or uninformed ideas about mobile phone usage and find that their actual usage of the phone is different from what they initially anticipated [Palen et al., 2000]. Finally, since phones are marketed in terms of features or services, e.g. Phonescoop [2006], it is left to the buyer to match these to their anticipated and unarticulated uses of the phone. It is thus very difficult for the buyer to determine the actual value of the phone to himself or herself at the time of purchase.
This section again emphasised the need for supporting users in coping with the complexity caused by the many options offered. The approach of starting with specific design elements, features or services has an inherent limitation – the number of features increases daily and it is not practical to study all the different combinations of features to produce reliable results on what the optimal selection of features and functions is. This provides further justification for developing a model to represent mobile phone usage variety.
4.3.4 Consumer Segmentation
Demographic, social and cultural variables that influence mobile phone use are discussed in Chapter 3. In this section market approaches to consumer segmentation are discussed.
Consumer needs are not all of the same kind, do not have the same priorities and they also vary according to user population [Jokela, 2004]. Mobile phone manufacturers attempt to match the different consumer segments with corresponding product segmentation [Marturano and Wheatly, 2000]. Treating the market as homogeneous would lead to product failure [Woo and Fock, 1999] and therefore companies conduct consumer research to reduce the risk of that [Balaji et al., 2005].
Teo and Pok [2003b] found that mobile phones should be marketed as lifestyle products, rather than technological innovations, since compatibility with values, lifestyle and norms is positively associated with adoption intention. Nokia was the first to introduce strategic segmentation by designing different models to target different market segments [Adner, 2003]. For example, the Nokia 1610 model offered ease of use and durability, the Nokia 8110 model offered portability and the Nokia 9000 model was designed to incorporate the latest technology.
The mobile phone industry uses various consumer segmentation strategies and models to understand consumer behaviour and decision-making mechanisms when it comes to purchasing a product. Baffoy [Baffoy, 2000] describes the following general segment orientations in mobile phone use:
• Geographic segmentation: States, countries, regions, cities, urban or rural areas, etc.
• Demographic segmentation: Age, sex, family size, family life cycle, income, occupation and education.

Chapter 4 Mobile phone adoption and use
A model for representing the motivational and cultural factors that influence mobile phone usage variety 76
• Behavioural segmentation: Usage rate, brand loyalty, use occasions or situations, etc.
• Psychographic or lifestyle segmentation: Attitudes, values, activities, interests, opinions, perceptions, benefits sought and problems solved.
Different categorization approaches are applied in clustering consumers [Ketola and Röykee, 2001; Gilbert and Kendall, 2003; Ketola, 2002; Rogers, 2003] :
• Expertise-based: Users are categorised as novice, casual and expert users based on their expertise in using mobile phones. Ketola and Röykee [Ketola and Röykee, 2001] believe that this is the categorization most often applied.
• Product buying or adoption based: Users are categorised according to their adoption styles as innovators, early adopters, early majority, late majority or laggards.
• Marketing segmentation: Users are categorised according to combinations of lifestyle such as:
o Trend-setters or mobile professionals who use mobile e-mail, intranet and extranet services for work-related activities.
o Time managers who need to optimise schedules and activities.
o Sophisticates driven by a need to present material status.
o Social connectors who keep up their social life while on the move.
o Technology enthusiasts with an interest in technological developments.
o Misers are people who are unwilling to pay for wireless data services. Cost is an important mediating factor in their mobile phone usage behaviour.
o Laggards who are usually the last to know about a technology and might possibly never adopt it.
User categorization can also be based on differences in spatial memory and reasoning abilities, and preferred learning style, though these approaches do not usually fit into the resource-constrained realities of mobile phone product definition and development [Kiljander, 2004].
As noted before, the consumer base for mobile phones is wide and varied. On the one hand a new user may have no previous experience with a similar phone or with mobile phones in general, and on the other the person may be a seasoned user of a mobile device functioning in a radically different way. Therefore Kiljander [2004] advises that mobile phone functioning should be designed for all user types. This means that it has to be both intuitive for first-time use and efficient in long-term use.
All consumer segmentations are in some phase of the purchasing life cycle, which consists of the following four phases [Kiljander, 2004]:
• Pre-purchasing
• Purchasing
• Ownership
• Re-purchasing.

Chapter 4 Mobile phone adoption and use
A model for representing the motivational and cultural factors that influence mobile phone usage variety 77
•
This cycle is important in the mobile phone industry where phones are often bought on a contract that includes an automatic upgrade after a fixed period of time. The old phone is often passed on to a family member who activates another new ownership relation.
Baffoy [2000] argues that the basic idea of segmentation is that market segments must be delineated on the basis of factors with a causal relationship to future purchase behaviour. He also states that the correlation between need and behaviour is higher than correlations between need and variables like personality, lifestyle and demography. This supports the idea of studying user behaviour as a point of departure in understanding the factors that influence mobile phone usage variety.
4.4 USAGE VARIETY For any application to succeed it must address a market requirement or user need [Balaji et al., 2005].
Apart from business applications, mobile phones are used to address/satisfy a variety of needs including [Ling and Yttri, 1999; Kwon and Chidambaram, 2000; Ling and Haddon, 2001; Marcus, 2005b] :
• Increasing safety and security, e.g. calling for help in emergencies
• Constant accessibility
• Source of information
• Display: Status enhancement via display
• Maintenance of social network
• Entertainment
• Coordination of everyday life: Micro-coordination, referring to the use of mobile phones for logistical purposes (organisation of personal and social activities), and hyper-coordination, referring to the use of a mobile phone for self-presentation and personal expression.
Repeating safety and security, coordination and the degree to which the handset is perceived as an artefact of personal display from the list above, Campbell and Russo [2003] adds the following factors that affect perceptions and uses of mobile phones:
• Attitudes about mobile phone use while driving
• Comfort with mobile phone services
• Attitudes about mobile phone use in public
• Comfort with mobile phone technology.
As discussed in Chapter 3, Ling, R. and Haddon [2001] note that the influence of generation on various orientations, e.g. accessibility and display, is generally more important to teenagers, micro-coordination to families with children, and safety and security to older people.
Tamminen et al. [2004] identify three kinds of motivational needs relating to mobile telephony:
• Personal needs, which include privacy and security.

Chapter 4 Mobile phone adoption and use
A model for representing the motivational and cultural factors that influence mobile phone usage variety 78
• Navigation or way-finding needs born of a need to know or to optimise.
• Social needs, which reflect an awareness of changes in schedule and social activities.
Trying to make sense of all these various use varieties, Marcus and Chen [Marcus and Chen, 2002b, 2002a] proposed a set of mobile phone usage spaces (as depicted in Figure 4.4).
Figure 4.4: Usage Spaces based on Marcus and Chen [Marcus and Chen, 2002a; Marcus, 2005b]
To organise the complexity of people’s behaviour and relate the various use varieties, Marcus and Chen [Marcus and Chen, 2002a; Marcus, 2005b] proposed a set of mobile phone usage spaces (as depicted in Figure 4.4). These usage spaces provide a feasible starting point for reasoning about uses and needs, which can then be used as a point of departure in determining the required functionality (features).
We will now discuss each of these mobile device usage spaces in more detail by giving Marcus’ description, followed by other support from the literature.
• Identity usage space: Being at the centre of the five usage spaces, this space contains information about the user. Besides the communication possibilities, personalisation of a mobile phone to reflect the user’s identity and make it more individually meaningful and symbolic is an important factor in the adoption of the phone [Teo and Pok, 2003a; Hansen et al., 2005]. Personalisation is also used as a strategy to filter the information, services and applications available on the Internet and make it relevant to the user [Katz and Sugiyama, 2005].
• Relationships usage space: This space describes the extending of existing social protocols [Marcus & Chen, 2002a]. Above and beyond traditional phone calls, text messages have proved to be very successful and the possibilities are being enhanced with the addition of MMS and video [Jenson, 2004]. Mobile phones connect an individual to friends, strangers and the wider community in previously unknown ways. Khalil and Connelly [2005a] attribute a new social order to the
Relationships
Entertainment
Commerce
Self-Enhancement
InformationIDENTITY
Relationships
Entertainment
Commerce
Self-Enhancement
InformationIDENTITY

Chapter 4 Mobile phone adoption and use
A model for representing the motivational and cultural factors that influence mobile phone usage variety 79
prevalence of mobile phones, which they describe as a shift from place-to-place communication to person-to-person communication. Mobile phones allow for opportunities to activate, manage and enhance relationships and build trust under the time and space constraints of contemporary life [Licoppe and Heurtin, 2001]. Mobile computing renders possible applications like electronic newspapers, stock trading and e-commerce. These applications take on added value when users are mobile or working away from their offices or homes [Agrawal & Famolari, 1999]. However, user value in mobile phones still seems to focus on communications [Jarvenpaa et al., 2003; Teo and Pok, 2003a; Adomi, 2006].
• Entertainment usage space: ‘This space represents the enjoyment of portable media such as music, games and other leisure activities.’ [Marcus and Chen, 2002b]. Wong and Hiew [2005] see mobile entertainment as a subset of mobile commerce, since it involves transactions of economic value. They define mobile entertainment as services that utilize wireless telecommunication networks that incur a cost upon usage [Wong and Hiew, 2005]. Mobile phones offer a wide range of possibilities for entertainment systems such as playing games and downloading music [Jarvenpaa et al., 2003; Teo and Pok, 2003a], albeit within a very constrained environment [Coulton et al., 2005].
• Commerce usage space: ‘This space refers to the enabling of commercial services such as electronic banking’ [Marcus and Chen, 2002b]. Unlike the other spaces, m-commerce involves services being provided from the business world to the individual. E-commerce is performed on the Internet connected with fixed computers while M-commerce refers to a mobile environment connected via mobile devices. While the potential of mobile commerce has been negatively affected by uncertain technology standards, the complexities of interactive multi-media applications and the threat of governmental regulation, there are many technological and business factors driving m-commerce [Jarvenpaa et al., 2003; Keshav, 2005].
• Self-enhancement usage space: ‘Self-Enhancement is about enhancing aspects of personal value to the user’ [Marcus and Chen, 2002a]. For example, enhancing personal safety, improving efficiency in organising their personal life and health monitoring. Thimbleby [2001] notes that mobile phones are valued for their status more than for their effectiveness of communication. Education may also slot into this sphere. The new paradigm of ‘anytime, anywhere computing’ effects a shift from ‘electronic’ to ‘mobile’ services and the benefits of this newly-gained mobility are expected to be reflected in more efficient education and improved learning results [Palen and Salzman, 2001; Lehner et al., 2003].
• Information usage space: This relates to personal information e.g. phone numbers and appointments listed for personal organisation as well as non-personal information. Non-personal information comprises reference information such as weather reports, dictionaries and business information [Marcus and Chen, 2002b]. Khalil and Connelly [2005a] found that cell phones are the dominant platform for Internet access in terms of numbers. While few people currently use cell phones for data access, they expect this to change as technology and services develop [Alahatuha

Chapter 4 Mobile phone adoption and use
A model for representing the motivational and cultural factors that influence mobile phone usage variety 80
et al., 2005]. Mobile phones offer an efficient means disseminating information to a large consumer population by broadcasting information of common interest to many users such as stock prices, weather information or for advertising [Tsalgatidou et al., 2000] .
Besides these usage spaces identified by Marcus, the literature study has also provided support for the following spaces:
• Image (including self-image): This relates to the identity usage space but here it is viewed as an independent space (not the intersection of other spaces). Mobile phones were introduced as business tools, yet personal use is the fastest-growing sector of the market [Kwon and Chidambaram, 2000; Coen et al., 2002]. Besides the communication possibilities, personalisation of a mobile phone to reflect the user’s identity is an important factor in adoption [Hansen et al., 2005]. Mobile phones are presented as an embodiment of youth, modernism and futurism, being of high status and socially desirable [Katz and Sugiyama, 2005]. Consequently mobile phones are perceived as a means of decorative, personal display and by some even as fashion accessories [Campbell and Russo, 2003; Ling and Hwang, 2005]. Mobile phones are used to project information about the user’s style and how the user wants other people to see them [Pedersen, 2003; Katz and Sugiyama, 2005]. Mobile phones offer the opportunity to become connected to a group. This is especially important to people not so well connected [Wei and Lo, 2006] .
• Safety and security: The use of a cell phone for ensuring safety and security [Ling and Yttri, 1999; Kwon and Chidambaram, 2000]. People state that being able to summon aid or assistance in emergencies is one of the primary reasons for having a cell phone [Campbell and Russo, 2003; Katz and Sugiyama, 2005]. Parents buy children mobile phones for enhancing personal safety. Though this may lead to a false sense of security, enhancing safety is a perceived use of mobile phones. Mobile phones can be used in health monitoring, which then makes them essential devices for the user’s safety. While Marcus lists safety and security under self-enhancement, other researchers, notably Ling & Yttri [Ling and Yttri, 1999] and Katz and Sugiyama [Katz and Sugiyama, 2005] consider it as an independent usage space.
• Micro-coordination: The instrumental use of the mobile phone for logistical purposes, e.g. co-ordinating appointments while on the move. For example, confirming the venue for a meeting or changing the schedule [Ling and Haddon, 2001; Campbell and Russo, 2003; Nickerson and Isaac, 2006].
• Hyper-coordination: Using the mobile phone in the social presentation of self and personal expression in social encounters [Ling and Yttri, 1999; Campbell and Russo, 2003]. This also includes the physical appearance of the phone as a form of expression. This space encompasses the self-enhancement and identity spaces as identified by Marcus [Marcus, 2005b].

Chapter 4 Mobile phone adoption and use
A model for representing the motivational and cultural factors that influence mobile phone usage variety 81
4.5 SUMMARY This chapter has reviewed technology acceptance and use models. Adoption was considered by
looking at Rogers’s model for the innovation of diffusions, which originated in sociology but was later applied in the field of marketing. The domestication model for technology consumption from sociology and CSCW was then considered as a model that went beyond adoption to address usage as well.
However, the main focus was on TAM and two other models who were based on TAM, namely UTAUT and a model by Kwon and Chidambaram [2000] which has been applied to study mobile phone adoption both from a marketing perspective and an HCI perspective.
The TAM, together with the adaptations proposed to the original TAM, provides a tangible starting point to consider the factors that influence mobile phone adoption. The TAM has been applied to model mobile phone adoption and usage and the findings were that perceived ease of use significantly affected users' extrinsic and intrinsic motivation, while apprehensiveness about cellular technology was found to have had a negative effect on intrinsic motivation [Kwon and Chidambaram, 2000].
After considering several studies on technology adoption and specifically mobile phone adoption, the view of the UTAUT is taken, namely that adoption and usage models consist of the direct determinants of usage behaviour like ease of use, usefulness, social factors, facilitating factors, attitude towards adoption and use and behavioural intention to use. The impact of these determinants on usage intention are mediated by demographic, and socio-economic as described in the UTAUT model [Venkatesh et al., 2003].
In this study the demographic variables of age, gender and ethnic culture (as indicated by mother-tongue) will be monitored. Socio-economic variables will not be investigated but participants in the research will be selected on the basis of similar job status and income to control the influence of this variable. Social influence will be captured by questions aimed at relating mobile phone use to cultural dimensions. Technological advancement, which can be viewed as a demographic variable or a cultural dimension, will be captured along with technological orientation as a personal factor.
TAM was developed for technology adoption in organisations [Malhotra and Galletta, 1999; Kleijnen et al., 2004]. In organisations the infrastructure and cost factors may have less of an influence than in individual use and therefore facilitating conditions will have to be monitored since this study deals with personal mobile phone usage.
Having considered technology adoption and usage models, the chapter moved on to a discussion of the factors that influence mobile phone adoption and usage. The usability of mobile phones, the cognitive load that mobile phone usage entails, the selection of features and user segmentation were the issues considered.
Many mobile phone users are not coping with the continuous interruption and increased cognitive load caused by the advancement in technology and escalation in features. The discussion on mobile phone features led to the conclusion that the constant addition of new features is technology and market-driven and therefore likely to continue. Nevertheless, adding features is not always beneficial to usability and there is a need for guidelines or models on how to select the optimal features for a specific target group.

Chapter 4 Mobile phone adoption and use
A model for representing the motivational and cultural factors that influence mobile phone usage variety 82
Reflecting on user segmentation and mobile phone usage variety, it became evident that mobile users are not a homogeneous group. Research studies have shown the effect of individual differences (e.g. age, gender, education, culture and personal orientation) on the use of information technology [Kwon and Chidambaram, 2000; Kleijnen et al., 2004]. This means that there is a need for diversification on other grounds than cost.
The current approach where cost is the primary factor determining the number of features is already leading to usability problems caused by cognitive overload [Ziefle and Bay, 2005]].
This review on mobile phone adoption and use supports the need for modelling mobile phone usage variety in order to help users understand and express their needs. The model for mobile phone adoption presented by Kwon and Chidambaram [Kwon and Chidambaram, 2000] does not address motivational and cultural needs.
Mobile phone usage spaces as proposed by [Ling and Yttri, 2002; Marcus and Chen, 2002a; Marcus, 2005b] provided a starting point in trying to develop a reusable model of mobile usage variety. Marcus’s usage spaces provide a useful and understandable base for understanding and organising user behaviour, but no empirical evidence could be found to support the model.
This study will look into providing empirical evidence for Marcus’s usage spaces and the other usage spaces of image, security and organisation (micro and hyper organisation) as identified in existing literature.
Another aim of this research is to consider how usage spaces are related to features. Relating features to usage spaces provides a way to understand and manage the selection of features. Existing usage space models do not specifically relate features to usage spaces.
Usage spaces are labelled by using non-technical terms that users can understand, while designers and marketers can use the spaces to identify required features. By managing the selection of features when purchasing or using a phone, the usability problem of cognitive overload caused by the escalating number of features in mobiles is addressed.
Reconsidering the research questions, the following findings from this chapter are relevant: Does infrastructure influence mobile phone usage? According to this literature survey, infrastructure
such as cost (billing), system quality and system reliability does influence mobile phone use [Kleijnen et al., 2004; Roberts, 2004]. The implications for this study are that infrastructure will have to be controlled in the research design.
Do cultural and social factors influence mobile phone usage? The fact that social factors, which include cultural factors, influence mobile phone adoption is well-known [Kwon and Chidambaram, 2000; Pedersen, 2003; Meso et al., 2005]. However, the influence of these factors on usage is not as well-researched [Pedersen et al., 2002]. Mobile phone usage has been researched by using aggregate diffusion theories that consider the importance of communication between network members and the social position of network members. However, this perspective does not consider the technology user perspective (applying TAM and other traditional adoption models) or the user-as-consumer perspective (applying consumer behaviour models). Pedersen [Pedersen et al., 2002] recommends triangulating models from the

Chapter 4 Mobile phone adoption and use
A model for representing the motivational and cultural factors that influence mobile phone usage variety 83
technology user, network member and consumer perspectives to address this problem. This research considers the user as an individual with emotional and cognitive issues and also explores the social and cultural contexts. The perspective of the user as a network member is not considered.
How can motivational user needs be related to mobile phone use? Organising mobile phone behaviour into usage space provides one approach to investigating this question. The usage spaces described are based on observations and argument rather than on empirical evidence. If usage spaces can be based on some theoretical foundation, they can be used to describe usage variety. This will also address the final question, i.e how can usage variety be described?

Chapter 5 Research context
A model for representing the motivational and cultural factors that influence mobile phone usage variety 84
CHAPTER 5: RESEARCH CONTEXT
5.1 INTRODUCTION The literature review presented in Chapters 2, 3 and 4 reviewed the mobile phone infrastructure
environment, factors influencing the mobile phone user, and mobile adoption and use. The findings and the research opportunities identified in mobile phone usage variety are outlined in this chapter. This is followed by a discussion of the research focus of this study.
A summary of the main findings and challenges relevant to mobile phone usage is presented in section 5.2. The research focus for this study and how the findings from Chapters 2, 3 and 4 will be incorporated are formulated in 5.3. The summary in section 5.4 concludes the chapter.
5.2 REVIEW OF LITERATURE STUDY The literature overview had as its point of departure the research question on the motivational and
cultural factors that influence mobile phone usage variety from different perspectives. Chapter 2 dealt with the influence of the mobile phone infrastructure and the major findings are summarised in section 5.2.1. The findings from Chapter 3, which contains a discussion on the demographic factors, motivational needs and cultural influences that could play a role in mobile phone usage variety are summarised in section 5.2.2. In Chapter 4 models for mobile phone adoption and usage as well as factors that influence mobile phone adoption and usage were considered. The major findings are summarised in section 5.2.3.
Based on this overview, the research questions are revised and the new questions are presented in section 5.3. The chapter is concluded by the summary in section 5.2.4.
5.2.1 Findings from Chapter 2
In Chapter 2 on mobile phone infrastructure it was noted that the mobile industry consists of two different yet interacting subsystems:
• The platform (handset) component consisting of hardware and software applications involving designers, manufacturers and handset providers [Palen et al., 2000]
• The mobile service component consisting of communication networks involving technical and communication designers and mobile service providers [Coen et al., 2002].
The dynamic, fact-paced, evolving nature of the mobile technology industry is driven by market forces and competition due to continual change and diversification in products and services [Cooper, 2001; Coen et al., 2002]. A complicated business model integrates and manages the subsystems of producing, marketing and servicing the mobile industry [Tsalgatidou et al., 2000; Macinnes et al., 2002; Balaji et al., 2005].

Chapter 5 Overview of mobile phone usage
A model for representing the motivational and cultural factors that influence mobile phone usage variety
85
Mobile handsets extend the concept of interacting with a single device to that of interacting with different systems, i.e. networks and services. This convergence of systems results in mobile handset usability being more than a user interface design issue [Nurvitadhi, 2002] and many users are confused and overwhelmed by the complexity of this interaction.
In summarizing the findings in Chapter 2, it can be said that the mobile phone industry is competitive, complex, dynamic and rapidly changing. Mobile phone users are overwhelmed and confused by all the information available and all the options to choose from. Therefore users need a model for representing mobile phone usage variety and the mediating factors in order to understand their needs. If the model can relate user needs to mobile phone features used it will also be useful to marketers and designers who have the challenge of matching user needs with mobile phone features.
5.2.2 Findings from Chapter 3
In Chapter 3 on the mobile phone user, it was established that mobile phone usage can be influenced by the demographics of the user, socio-economic status, social and cultural factors. The fact that age influences mobile phone use has been accepted, but there are conflicting findings on gender. Theories for motivational human needs were discussed and evidence linking motivational needs to user’s satisfaction with products was found. Nevertheless, no study specifically investigating the link between motivational human needs and mobile phone usage variety could be found. This finding led to the formulation of the following sub-question:
• Is there a link between motivational needs and mobile phone usage variety?
In order to be useful, communication technology is completely dependent on a social network and therefore the user’s social context should be considered when considering the diffusion of communication technologies. The social context encompasses the cultural context, the latter being one of the focal points of this study. Models and meta-models of culture were considered in order to gain an understanding of the cultural factors that should be considered when investigating mobile phone usage variety. It was found that user culture comprises of different facets (or spheres) like the ethnic, social and organisational cultures in which the user lives and works. This raises questions about the influence of these different facets on mobile phone usage. Many studies consider mobile phone usage in the organisational or work setting, but this study focuses on personal use only.
Some studies have found the influence of national culture to be significant but other studies found no significant difference regarding mobile phone adoption and usage. This means that research is needed to establish the influence of national culture (which encompasses ethnic culture) on mobile phone adoption and usage. This leads to the formulation of the following research sub-question:
• What are the cultural factors that influence mobile usage variety?
The different cultural contexts (ethnic, social and organisational) each have rules and accepted behaviours. Mobile phone usage is a disruptive technology since it affects the way other technologies and

Chapter 5 Overview of mobile phone usage
A model for representing the motivational and cultural factors that influence mobile phone usage variety
86
systems are used. This raises the question of whether mobile phone usage will adhere to the existing rules of the cultural context, leading to the formulation of the next research sub-question, namely:
• Does mobile phone usage conform to the cultural context of the user?
This study focuses on personal use and therefore the work and organisational contexts will not be considered. Given the fact that demographic, socio-economic, social and cultural factors may influence mobile phone usage, any empirical study on mobile phone usage will have to take this into account. This means that the research design will have to limit or at least monitor the influence of these factors.
5.2.3 Findings from Chapter 4
In Chapter 4 on mobile phone adoption and use, it was found that technological factors e.g. bandwidth, transmission quality and network coverage, influence mobile phone adoption and usage. In addition, infrastructural, economic and management factors such as pricing policy, national regulations and staff competence were found to make a significant difference to mobile phone adoption and usage. It was also found that mobile adoption and usage are influenced by non-technological factors such as ease of use, usefulness and social considerations.
Technology adoption and consumption are viewed from different perspectives that involve different paradigms and models. Factors influencing mobile phone adoption and use have been researched from a sociological and also from a market research perspective. Technology adoption models have been applied to model certain aspects of mobile phone adoption and use successfully. The model by Kwon and Chidambaram [2000] on mobile phone adoption and use explained some of the variance in users’ perceptions, motivations and usage but they note that further research is necessary to identify the independent variables that account for the remaining variance.
Based on the review of models for understanding technology adoption, and mobile phone adoption and use specifically, it was found that these models consist of constructs that determine mobile phone usage and factors that mediate adoption and usage. The determinants of usage behaviour have been listed as ease of use, usefulness, social factors, facilitating factors, attitude towards adoption and use, and behavioural intention to use. The impact of these determinants on usage is mediated by demographic, socio-economic and personal factors.
In considering the factors that influence mobile phone adoption it was found that mobile phone users are overwhelmed and confused by the escalating number of features available on their phones. The concept of usage spaces for describing usage variety has been proposed by Marcus and Chen [Marcus and Chen, 2002a; Marcus, 2005b]. This forms a useful point of departure in studying mobile phone usage although no empirical evidence was provided to support this model. This leads to the formulation of the following research sub-question:
• Can Marcus’s usage spaces model be supported by empirical evidence?

Chapter 5 Overview of mobile phone usage
A model for representing the motivational and cultural factors that influence mobile phone usage variety
87
Other usage space models have also been proposed from the field of sociology, e.g. Ling and Yttri [Ling and Yttri, 1999]. Nevertheless, none of the models reviewed made any attempt to link these usage spaces to motivational user needs, or relate the usage spaces to mobile phone features. If the usage spaces can be linked to specific features, they can be used to convert user needs (expressed in non-technical terms) to required features expressed in technical terms. The latter is necessary if the model is to have any practical application value for marketers and designers. Bridging the gap between user needs and features would be of value to users, designers and marketers. This leads to the last sub-question:
• Can usage spaces represent usage variety in a way that is usable and useful to mobile phone users, designers and marketers?
Figure 5.1 depicts the following sets of factors involved in this study:
• User factors including demographic, socio-economic, cultural and personal factors. This study will focus on demographic, cultural and personal factors.
• The facilitating conditions represent the mobile infrastructure perspective, which will not be investigated further.
• The technological adoption and usage factors represent the user perspective, which includes perceive user needs, perceived ease of use, and user attitude towards adoption and use. This study focuses only on user needs related to mobile phone usage.
Figure 5.1: Factors involved in this study
User Factors
• Demographic
• Socio-economic
• Personal
• Culture
Facilitating Conditions
• System quality and service
• Cost of service
• Cost of phone
Technology adoption and usage
• Perceived user needs
• Product perceived ease of use
• User attitude
Mobile phone usage

Chapter 5 Overview of mobile phone usage
A model for representing the motivational and cultural factors that influence mobile phone usage variety
88
5.3 RESEARCH FOCUS FOR THIS STUDY The focus of this research will be on mobile phone uses as related to user needs (a user perspective),
rather than on mobile phone features (a marketing perspective) although features will be considered in relation to usage spaces. After the literature review the research questions formulated in Chapter 1 are now reviewed. In Chapter 1, the following research questions and sub-question were formulated. The main research question is now given, followed by the sub-questions:
• What are the components of a model to represent the influence of motivational needs and cultural factors on mobile phone usage variety?
Sub-questions:
• Does infrastructure influence mobile phone usage?
• How can motivational user needs be related to mobile phone use?
• Do cultural and social factors influence mobile phone usage?
• How can usage variety, i.e., the different applications for which a product is used or the different situations in which a product is used, be described?
After the literature review the main research question remains unchanged. With regard to the sub-questions, one is removed and a new one is added. The sub-question on infrastructure will not be considered further since the literature study in Chapters 1, 2 and 3 has provided substantial evidence that infrastructure does indeed influence mobile phone usage. The revised set of research sub-questions is as follows:
• Is there a link between motivational needs and mobile phone usage variety?
• What are the cultural factors that influence mobile phone usage variety?
• Does mobile phone usage conform to the cultural context of the user?
• Can usage spaces represent usage variety in a way that is usable and useful to mobile phone users, designers and marketers?
• Can Marcus’s usage spaces model be supported by empirical evidence?
The next step in this research process will be to look at research methodologies in order to find the appropriate methodology and research design. Given the many factors that have been found to influence mobile phone adoption and usage, the research will have to be designed to control or at least monitor some of these variables. Each question will now be considered together with the preliminary research plan.
• Questions 1: Is there a link between motivational needs and mobile phone usage variety? Mobile phone usage variety will be represented by usage spaces. A questionnaire driven survey will be used to investigate the link between motivational needs and usage spaces. The findings will be triangulated with the qualitative findings from the surveys and continued observations of people’s mobile phone usage.

Chapter 5 Overview of mobile phone usage
A model for representing the motivational and cultural factors that influence mobile phone usage variety
89
• Questions 2: What are the cultural factors that influence mobile phone usage variety? The cultural factors will be represented by cultural dimensions and mobile phone usage variety by usage spaces. The first objective will be to investigate the relevance of cultural dimensions for mobile usage. If cultural dimensions are found to be relevant to mobile phone usage then the influence of cultural dimensions on usage variety will be investigated.
• Question 3: Does mobile phone usage conform to the cultural context of the user? This question will be considered while investigating question 2, though this question will only be addressed qualitatively.
• Question 4: Can usage spaces represent usage variety in a way that is usable and useful to mobile phone users, designers and marketers? A questionnaire driven survey is planned to gather quantitative data. The data will be analysed statistically and then triangulated with the findings of the qualitative observations on mobile phone usage variety. The initial plan is to propose a model for mobile phone usage variety and then test this model with users, designers and marketers.
• Question 5: Can Marcus’s usage spaces model be supported by empirical evidence? Establishing that usage spaces can be empirically motivated is fundamental to proposing a model for usage variety, since usage variety will be represented by usage spaces. This will be done as part of the research described for sub-question 4.
The findings on the sub-questions will then be considered with the main research question in mind to ascertain if a model for representing the motivational and cultural factors that influence mobile phone usage, can be proposed on the basis of this research. Chapter 6 will consider research methodologies in general and then consider research methods used in HCI, before focusing on research methods appropriate to this study.
5.4 SUMMARY This chapter has reviewed the findings from Chapters 2, 3 and 4, which form the theoretical foundation
for this study. Findings from Chapter 2 justify the argument that mobile phone users need support in understanding their motivational and cultural needs in using mobile phones. Findings from Chapter 3 highlight the importance of demographic variables, motivational needs and cultural factors in studying mobile phone usage variety.
Findings from Chapter 4 provide further evidence that users are not coping with the rapid developments and escalating number of features on mobile phones. Usage spaces are proposed as an approach to demarcate the usage domain in an attempt to manage the complexity of mobile phone usage variety.
The theoretical foundation has now been laid by identifying the basic concepts to be considered in a model for representing the motivational and cultural factors that influence mobile phone usage variety.

Chapter 5 Overview of mobile phone usage
A model for representing the motivational and cultural factors that influence mobile phone usage variety
90
Models from fields relating to mobile phone usage have been considered and contrasted to find the core of what has been done, what can be done and what should be done in investigating this research question.
The research questions formulated in Chapter 1 are revisited and refined according to the findings from the literature study. These sub-questions are the focus of the research design, which will be presented in Chapter 6.

Chapter 7 Results and analyses
A model for representing the motivational and cultural factors that influence mobile phone usage variety 91
CHAPTER 6: RESEARCH DESIGN AND METHODOLOGIES
6.1 INTRODUCTION The literature study presented in Chapters 2, 3 and 4, as summarised in Chapter 5, provides substantial
theoretical evidence about the need for investigating the motivational and social factors that influence mobile phone usage variety.
This chapter has a two-fold aim. Firstly it discusses the research philosophy and research methods relevant to this research, and secondly it discusses the research design and implementation.
The chapter is structured as follows: In section 6.2 the appropriate philosophy for the research questions is discussed. Section 6.3 deals with research methods appropriate for HCI, whilst section 6.4 considers research methods for studying mobile phone usage. Section 6.5 is focused on the methods used in this research.
The research design is discussed in section 6.6. Phase 1 of the study encompasses the initial literature study. Phase 2 encompasses the data gathering as discussed in section 6.7. Phase 3 refers to the proposition of the model as discussed in section 6.8, while phase 4 encompasses the evaluation of the model in section 6.9. The chapter concludes with the summary in section 6.10.
6.2 RESEARCH PHILOSOPHY ‘A research philosophy or paradigm, shapes how people study their world’ [Rubin and Rubin, 2005]. A
paradigm represents a way of looking at the world, interpreting what is seen and deciding which of the things seen by researchers are genuine, valid and noteworthy. Olivier [Olivier 2004] describes research philosophies as accepted models or patterns that guide a research group. The paradigm indicates how the research ought to be conducted, by whom and with what degree of involvement.
There are several paradigms in the philosophy of science, namely positivism (also called phenomenology), realism, interpretivism, postmodernism, critical theory [Mouton, 2001], the feminist theory [Rubin and Rubin, 2005] and critical realism [Pather and Remenyi, 2004]. Positivism, interpretivism and critical realism are of interest to this research and can be described as follows:
• Positivism is a research approach that views scientific knowledge as verifiable or at least falsifiable [Olivier, 2004]. The research is termed ‘quantitative’ and is based on rigorous, systematic and repeatable data-capturing methods. The researcher is as objective as possible in pursuit of the objective reality.
• Interpretivism, also termed ‘qualitative research’, does not rely on numerical or statistical analyses of data or evidence but assumes that our knowledge of reality is gained only through social constructions such as language, consciousness, shared meanings, documents, tools and other

Chapter 6 Research Design and Methodologies
A model for representing the motivational and cultural factors that influence mobile phone usage variety
92
artefacts [Klein and Myers, 1999]. The interpretive approach accepts that it is impossible to be truly objective and the main aim is to understand what is being studied.
• Critical realism assumes that society is socially constructed, but advocates that a combination of approaches is often the most effective way of conducting research [Pather and Remenyi, 2004]. The researcher is seen as an agent who does research with the explicit intention of changing what is being researched.
Interpretivism focuses on the meaning people attribute to an object or event and it recognises that researchers make cultural assumptions that influence their questions and how they interpret what they see and hear. ‘The researchers themselves become the data-gathering instruments whose skills in listening, observing and understanding are crucial.’ [Rubin and Rubin, 2005].
Qualitative data therefore depends on the researcher’s judgement as to what is interesting, useful and important. Interpretivist researchers argue that carefully implementing procedures such as triangulation can control the bias inherent in individual researchers [Pather and Remenyi, 2004].
The field of HCI is multidisciplinary and has emerged from an interaction between computer science, the behavioural sciences and design science [Zimmerman and Muraski, 1995; Plimmer, 2005] . The traditional science, the design science and the engineering approaches are used to cater for the multidisciplinary nature of HCI research [Ford, 2005]:
• The traditional science approach is positivist, focusing on empirical methods to collect quantitative data for building and evaluating mathematical models [Pather and Remenyi, 2004].
• The design science approach promotes a craft-based approach with qualitative evaluations on systems or artefacts after they have appeared [Zimmerman et al., 2004].
• The engineering approach suggests a combination of the traditional science and the design science approaches [Ford, 2005].
In this study the traditional science approach is followed in some investigations but is augmented by qualitative methods where possible. The various schools of interpretivism reject many of the tenets of positivism [Rubin and Rubin, 2005]. Based on the arguments for and against each of these approaches, Ford [2005] concludes that there is still no consensus on the strategy that should be used in HCI research.
Paradigms in research philosophy are related to paradigms in research methodology. Positivism and interpretivism will be contrasted below according to four key questions proposed by Rubin and Rubin [2005] to distinguish positivism from naturalist-interpretive approaches and to comment on appropriate methodologies for this research. This is done to demonstrate that it is essential to incorporate both positivistic and interpretivistic methods in this study.
Fraser [2003] discusses criticism on the mixing of qualitative and quantitative methods in investigating the social world and maintains that qualitative and quantitative methods can, and should, be combined since there are more than two ways of knowing, understanding and learning about the world. For example, understanding causality requires quantitative methods [Olivier, 2004] just as understanding how

Chapter 6 Research Design and Methodologies
A model for representing the motivational and cultural factors that influence mobile phone usage variety
93
perceptions were created require a qualitative approach [Fraser, 2003]. Critical realism is the research paradigm that allows for the integration of quantitative and qualitative methods.
The questions address the following issues [Rubin and Rubin, 2005]: the core goal of the research as discussed in section 6.2.1, the perception of truth as discussed in section 6.2.2, the research instruments as discussed in section 6.2.3 and the role of the researcher as discussed in section 6.2.4.
6.2.1 The core goal of the research
In a positivist paradigm the goal is to find the objective truth. In an interpretive paradigm the goal is to construct meaning within the context of the research problem.
The goal of this research is to understand a complex situation. In pursuing this goal it is necessary to consider the context of research and the context of the researcher, as is done by interpretive researchers to form an understanding of how perceptions of the world are created [Fraser, 2003]. However, a closer inspection of the research problem reveals sub-goals that can be addressed only by positivist quantitative methods, for example, using survey data to find correlations between gender and the type of contract (fixed or pay-as-you go).
Critical realism advocates combining approaches in conducting research [Pather and Remenyi, 2004] and therefore it follows that critical realism is the appropriate philosophical paradigm for this research.
6.2.2 What does truth mean?
A positivist approach sees truth as objective and verifiable, or at least amenable to being proven false [Olivier, 2004]. Popper found it more potent to disprove a theory than to prove it, and advocated that scientists should seek disconfirming evidence [Mouton, 2001; Field and Hoyle, 2005].
In contrast, interpretivist researchers do not aim for uniformly shared understanding and finding the absolute truth [Rubin and Rubin, 2005]. ‘Understanding is the main role of interpretivist, and never prediction’ [Pather and Remenyi, 2004].
The findings that emerge from this research present an understanding of the motivational and cultural factors that influence people in using mobile phones. Understanding of a phenomenon relates to the interpretivist analysis of truth. The truth about the factors that influence mobile phone usage variety is certainly not independent of human perception. On the other hand, central tendencies and measures of what is typical, or average, can be useful in delimiting and managing the domain of usage variety.
If correlations between user attributes and user preferences can be established, these can be used to delimit the research domain and differentiate between the important questions.
Extrapolating from a set of observations to draw general conclusions is called inductive reasoning, while deductive reasoning starts with premises contained in theories or models, and then draws conclusions [Mouton, 2001]. When using inductive reasoning, we have to take note of three conditions necessary to infer effect from cause [Field and Hoyle, 2005]:

Chapter 6 Research Design and Methodologies
A model for representing the motivational and cultural factors that influence mobile phone usage variety
94
• Cause has to precede effect.
• Cause and effect should correlate.
• All other explanations of the cause-and-effect relationship should be ruled out.
The combining of qualitative and quantitative methods complies with critical realism [Pather and Remenyi, 2004]. However, the formulation of determinative causal propositions on mobile phone usage is severely hampered by the fact that mobile phones belong to the class of empowering technologies that are likely to amplify (instead of reduce) psychological, social and cultural divergences, because of their capacity to be used for different purposes in any sphere of life [Geser, 2004].
6.2.3 What types of research instruments are appropriate?
Positivism relies on quantitative research instruments to deliver measurable results [Pather and Remenyi, 2004]. The typical research instruments include surveys using standard questionnaires, experiments and statistical analyses of the data [Olivier 2004]. In contrast, interpretive-constructivist research relies on observation and interviews to capture data for qualitative analyses.
In this research both interviews and questionnaires were used. Quantitative research is useful in deriving causal attributions, e.g. we can determine which feature is used by a specific age group most frequently. Qualitative research looks at the reasons for causality, providing a deeper understanding of a specific situation.
The use of a positivist instrument, such as a questionnaire, to find explanations to be used in an interpretivist approach is not contradictory, but rather an explanatory means of coming to grips with the identification of the relevant issues [Urbaczewski et al., 2002].
User preferences in using mobile phones give rise to some objective questions where uniformly shared understanding is possible, e.g. use frequency of a mobile phone feature. On the other hand, the reasons for using a mobile phone feature cannot be quantified in the same way and a qualitative approach is necessary to elicit information that will create an understanding of why a specific feature is or is not used.
6.2.4 How does and should the researcher affect the process of discovery?
In the initial stage of the requirements gathering for this research, much time was spent on observing people informally during structured interviews, and listening to their accounts of mobile phone usage as interpretive constructivist researchers would do, in order to build an understanding of the mobile user context.
As the researcher, I did affect the research through design and operational decisions. However, this influence was counteracted by following the prescribed systematic principles of questionnaire design and empirical evaluation in conducting the survey. On the other hand, the understanding gained from the qualitative observations helped to make sense of the quantitative findings later on.

Chapter 6 Research Design and Methodologies
A model for representing the motivational and cultural factors that influence mobile phone usage variety
95
Based on all four of the key questions posed in sections 6.2.1 to 6.2.4, this research can therefore be described as belonging to the research philosophy of critical realism.
6.3 RESEARCH METHODS FOR HCI HCI is an interdisciplinary, ubiquitous and evolving field [Chen et al., 2005]. Carrol [2001] suggests
that the evolution of research in HCI is being driven by the challenge of bringing together the following four roots:
• Prototyping and iterative development from software engineering
• Software psychology and human factors of computing systems
• User interface software from computer graphics
• Models, theories, and frameworks from cognitive science.
Sun [2004] distinguishes between the engineering perspective and the humanist perspective in HCI research whilst Ford [2005] adds the traditional science (positivist) and the design science (craft-based qualitative evaluation) approaches.
The engineering perspective regards usability as the quality of an individual artefact, while the humanist perspective suggests that usability research should include the contextual, social and cultural angles of product use, encompassing more than the measurable qualities of products [Sun, 2004]. Sociological perspectives in the design and evaluation of interactive systems have become one of the more significant trends in HCI research and practice over the past decade [Dourish and Button, 1998; Millen, 2000].
According to Cockton [2004], the goal of HCI is to deliver value. To this end, he advocates the co-ordination of system-, user- and context-centred design in a value-centred framework. Sutcliffe [2005] advocates focusing on typical classes of problems common in HCI, understanding the cognitive and social implications of those problems and applying the appropriate theories to solve them.
This links up with the current trends in information technology research. According to Olivier [2004] the research goals in information technology can be categorised as: technical goals that deal with the implementations of systems and related issues, social goals that deal with the people issues, and philosophical goals that deal with responsibility, accountability and the legal aspects. The same applies to HCI. The methods used to achieve these goals are empirical, creative or tautological [Olivier, 2004]:
• Empirical methods depend on observation and include surveys, case studies and experiments.
• Creative methods are intended to devise new abstractions or mechanisms to be used in computing, e.g. models, prototypes and algorithms.
• Tautological or manipulation methods transform their input to reveal something that was not obvious from the input, e.g. mathematical proofs and arguments.

Chapter 6 Research Design and Methodologies
A model for representing the motivational and cultural factors that influence mobile phone usage variety
96
In the selection of research instruments or tools, availability, reliability, relevance and validity are criteria to consider. These criteria can be described as follows [Mouton, 2001; Field and Hoyle, 2005]:
• Availability refers to the ability to obtain the research instrument, which may be sophisticated instrumentation, recording devices and other scientific equipment.
• Reliability is described as the ability of the method to produce the same results under the same conditions.
• Relevance refers to the need to ensure that the instrument can be applied in the intended context of use.
• Validity is the ability of the research method to measure what it is supposed to measure.
It is the goal of any research to satisfy these criteria but this is not always possible when dealing with issues in the social domain. When compromising these criteria is unavoidable, it is important to acknowledge the fact and state the scope of the expected problem.
The research question for this study lies in the social domain since mobile phone usage is influenced by social as well as infrastructural and technical factors. The appropriate methods for the social domain are literature surveys, case studies, surveys and experiments [Olivier, 2004], as well as ethnography, grounded theory, focus group and action research [Mouton, 2001].
A special focus of this study is the cultural factors that influence mobile phone usage. Cultural awareness is actively researched in HCI and significant progress has been made in cross-cultural studies [Huang and Tilley, 2001; Ford, 2005].
HCI research has drawn on cross-cultural studies in other fields such as anthropology and sociology, Hofstede’s cultural dimensions have been the subject of many studies relating culture to software usability [Marcus & Gould 2000; Sun 2001; Badre 2002; de Wet et al. 2002; Ford & Gelderblom 2003, Ford 2005] and other models for managing cross-cultural software design has also been discussed in section 3.5.4.
6.4 RESEARCH METHODS FOR MOBILE TECHNOLOGY Tarasewich [2002] notes that user-centred evaluation methods were originally designed to fit into the
development processes for stationary work station applications. Digital convergence of cellular technology and services in the mobile phone with simultaneous limitations on size, bandwidth and processing power, introduces new kinds of usability requirements not properly addressed through the traditional set of methods [Ketola and Röykee, 2001]. Despite the differences, Kangas and Kinnune [2005] found reason to be confident about the use of traditional design practices on condition that their flexibility is increased for the mobile environment.
In a study on emerging methods for understanding mobile technology use, Hagen et al. [2005] found a lack of consistency in the discussion and conceptualisation of mobile HCI research and they advocate the need for more technologically sophisticated and contextually appropriate ways of gathering data. They grouped the methodological responses in mobile HCI into the following categories:

Chapter 6 Research Design and Methodologies
A model for representing the motivational and cultural factors that influence mobile phone usage variety
97
• Mediated data collection: data and metadata about use are automatically generated as a side effect of using the device in a natural setting.
• Simulations and enactments: methods and techniques where prototypes are tested and the user experience is reflected upon. This provides experiential information sensitised to real context of use. Simulations focus on capturing knowledge about physical movement, device input and the ergonomics of mobile devices. Enactments focus on the reasons for using mobile devices and their potential for enhancing human capacity.
• Combinations where established usability methods such as performance measuring, interviews and surveys to determine user satisfaction are combined with mediated data collections or simulations and enactments.
Preece et al. [2002] support the argument that new kinds of usability requirements are introduced by mobile phone technology that are not addressed by the traditional set of methods, and emphasize the variability of the context of use in mobile devices. The user may be mobile, multi-tasking and prone to interruptions, which means that their cognitive capacity and attention is reduced. Kaptelinin et al. [1999] list several attempts to come up with tools and techniques to support context awareness in the design and evaluation of computer technologies, including task analysis, participatory design and contextual design.
User context has been researched from the physical [Lee and Lu, 2003; Korpipaä et al., 2004], social [Ling, 2001; Geser, 2004] and cultural [Choi, Lee, and Kim, 2005] perspectives. The literature study (Chapter 2) also highlighted a further context, namely the marketing context. Each of these research contexts is briefly described below: research in the physical context in section 6.4.1, research in the social and cultural context in section 6.4.2 and the marketing perspective in section 6.4.3.
6.4.1 Physical context
Physical context is studied from a representational perspective, which sees context as observer-independent entities, ready to be sensed, represented and acted upon by an agent [Qualasvirta et al., 2005].
Research on personalisation of computing devices based on physical context awareness abounds [Kaasinen, 2003; Terziyan and Vitko, 2003]. For example, Lee and Lu [2003] have constructed a computational model for each individual user to predict their preferences for the incoming information. Khalil and Connelly [2005a] present a study to evaluate the feasibility and the effectiveness of automatic context-aware configuration for mobile phones, studying physical context. In these studies the approach is mostly to develop and test a prototype of a system for capturing and interpreting physical context. Though most of these systems include a user model, the focus is on user location obtained by processing sensor information.
Location-based, context-aware systems improve the usability of mobile devices but it must be borne in mind that the context-awareness exhibited by people is radically different from that of computational systems [Korpipaä et al., 2004]. Much research in mobile technology is based on the premise that the main

Chapter 6 Research Design and Methodologies
A model for representing the motivational and cultural factors that influence mobile phone usage variety
98
problems are the small keyboards, low-resolution, limited-size screen and unreliable wireless networks [Kristoffersen and Ljungberg, 1999; Palen et al., 2000]. Kankainen & Oulasvirta [2003] corroborate the fact that research in mobile and ubiquitous computing has been mainly technology-driven and maintain that there is a lack of understanding of the everyday needs related to mobile and ubiquitous computing.
6.4.2 Social and cultural context
As usability is accepted as an integral part of the design process, the focus shifts from evaluating user actions to engaging with users [Sun, 2004]. In an overview of mobile phone research strategies for a global market, Page [2005] emphasises the importance of contextual observations and ethnographic input in understanding the global mobile requirements.
Contextual and cultural challenges in mobile technology use have been realised and addressed by using contextual design [Blom et al., 2005; Holtzblatt, 2005]. However, the fast pace and all the many uncontrollable variables in naturalistic settings make it difficult to exercise the academic rigour required [Blom et al., 2005].
Computer-supported collaborative work (CSCW) studies the gap between social requirements and technical feasibility [Ackerman, 2000; Green et al., 2001]. Mobile interaction and use is researched with a qualitative approach, often involving interviews and fieldwork. Examples include studies to suggest guidelines for context-sensitive systems by Brown and Randell [2004], a study towards a social theory of the mobile phone by Geser [2004], a study on social construction by Campbell and Russo [2003], and a study of mobile telephony and the coordination of everyday life by Ling [2001].
Culture has been cited as a factor that influences mobile phone usage [Urbaczewski et al., 2002; Choi, Lee, and Kim, 2005] and several studies have been done, as discussed in section 3.5.4.2.
6.4.3 Marketing context
According to Limaye and Victor [1995] ‘Anecdotal work on intercultural business communication, while useful for illustrating key concepts and contributions to the stock of information available, needs to be supplemented by rigorous empirical research’. This represents the view of many market researchers who prefer the questionnaire-driven, quantitative applications of technology adoption models to research aspects of mobile adoption and use. Examples include the study by Kwon and Chidambaram [2000] on mobile telephone adoption, a study on consumer acceptance of wireless finance by Kleijnen et al. [2004] and other studies discussed in Chapter 4, section 4.2.1.
Pedersen [2003] notes that even though literature on the adoption and use of mobile services is quite extensive, surprisingly few studies are found applying traditional models of ICT adoption such as the technology acceptance model. He suggests that studies of mobile ICT adoption might apply different perspectives than those used in traditional ICT adoption and use.

Chapter 6 Research Design and Methodologies
A model for representing the motivational and cultural factors that influence mobile phone usage variety
99
6.5 RESEARCH METHODS USED IN THIS STUDY Interviews, grounded theory and ethnography are the qualitative methods applied in this study. This
research started out by observing the field of mobile phone usage and from those observations theories emerged. This is in accordance with grounded theory in which the researcher begins by observing the field of interest and then allows for the theory to emerge from their observations [Glaser and Strauss, 1967]. Purposive sampling is used to select new participants based on their differences from those already interviewed. The process continues until new observations do not add to the pool of knowledge. The initial theories were supported or refuted by existing models from literature, which guided the study further.
Both qualitative as well as quantitative methods were used in this research. In quantitative research, correlational (or observational) and experimental methods can be distinguished [Field and Hoyle, 2005]:
• Observational (correlational) methods observe what naturally happens without interfering.
• Experimental methods manipulate some aspect of the environment and observe the effect.
The two approaches differ in the manipulation of variables, i.e. observational research aims for unobtrusive observation of naturally occurring phenomena, while experimental research deliberately manipulates the environment [Field and Hoyle, 2005].
This research was purely observational without any deliberate interference with people’s mobile phone usage. It was empirical in the sense that evidence was gathered through observation and measurement.
While striving for replicability, i.e. the goal that other researchers applying the same methods to the same subject should get the same results, and objectivity, it has to be acknowledged that the context of this research can arguably influence the findings. Therefore the biographic profiles of the participants provided in Chapter 7 and the procedure description as provided in section 6.7 have to be considered.
The primary research methods employed in this research, namely literature review, interviews, survey and ethnography will now be discussed in more detail.
6.5.1 Literature Review
The aim of the literature review was to highlight the main definitions, theories, models and empirical findings that provide background to the research question, i.e. it provided the theoretical foundation for the research. The literature overview as presented in Chapters 2, 3 and 4 reviewed the existing body of knowledge in the field of mobile phone infrastructure, the issues affecting the mobile phone user, and technology adoption and usage, from the perspective of this research. Based on this body of content knowledge, the initial study was planned and delimited. The findings will also be used to assess the contribution of the research to the scientific body of knowledge.

Chapter 6 Research Design and Methodologies
A model for representing the motivational and cultural factors that influence mobile phone usage variety
100
6.5.2 Interviews
Interviewing for information gathering entails asking questions of another person or a group of people. Interviewing people can provide information on their needs, opinions, attitudes, perceptions, observations and behaviour [Thomas, 1999]. The participants are requested to reflect on their experiences with an object, concept or event in their own words.
Interviewing is a process that starts with identifying the need for specific information and then develops appropriate questions to obtain that information. A person with the appropriate expertise is identified and interviewed, and finally the information is assessed [Zimmerman and Muraski, 1995].
Interviews range from formal, highly structured interviews, based on a fixed questionnaire, to informal, responsive interviews as extended conversations. Responsive interviews are different from conversations as they are more focused, more in-depth, and more detailed than conversations [Rubin and Rubin, 2005]. Apart from avoiding the practical, legal, privacy and ethical issues involved in automated data capturing, asking participants to describe their communication activity retrospectively, is the least intrusive way to gain information on their mobile phone usage [Blom et al., 2005].
In this research the interviews were directed towards:
• Eliciting verifiable facts and ‘reality out there’ through questions on basic issues such as frequency and duration of communication interaction, breadth of interaction (how many communication partners) and variety of tasks.
• Eliciting social and cultural perceptions that could influence mobile phone usage.
• Uncovering participant’s perceptions about mobile phone usage and reflections about the experience of using a mobile phone.
6.5.3 Survey
Surveys are conducted by means of interviews or by distributing questionnaires to a sample (or the entire target population) for completion [Olivier, 2004]. Surveys can be self-administered, personal surveys (interviewer-administered), telephonic and online which includes e-mail, computer-direct and web-based variations [Zimmerman and Muraski, 1995; Zimmer, 2004; Ford, 2005].
‘Questionnaires are written in many different ways, to be used in many different situations and with many different data-gathering media’ [Brace 2004:2]. Questionnaires are not always required for a survey [Olivier 2004], but they do provide a standardised interview across all subjects [Brace 2004]. According to Harbich and Auer [2005], usability testing often relies on questionnaires as they are easy to handle, reliable, statistically objective, economical and easy to evaluate. Questionnaire design is a specialised activity and therefore we address this issue in more depth in Appendix 1.
For the purpose of this research we distinguish between a survey by interview, which is designed for extracting in-depth information from a very limited number of people, and a survey by the administering of questionnaires aimed at obtaining a larger number of responses. In both cases questionnaires can be used as

Chapter 6 Research Design and Methodologies
A model for representing the motivational and cultural factors that influence mobile phone usage variety
101
a data-capturing tool but in the personal interview the interviewer has the opportunity to adapt the questions according to the responses.
During interviews the interviewer gathers deep, richly nuanced data from a limited number of test participants – this is termed ‘qualitative information gathering’. Doing a survey with a fixed-response questionnaire means that no dynamic adaptations are possible and the responses are collected from a larger number of respondents – this is termed ‘quantitative information gathering’. The aim in quantitative information gathering is usually to include a large number of participants, since a certain minimum number is required for statistical analyses.
Surveys are useful in quantifying user preferences in adoption and usage but they are not as useful in discovering new needs [Qualasvirta, 2005]. In modelling mobile phone usage it is important to know the reasons behind a specific use or non-use. This type of information is extremely difficult to capture with a fixed-response questionnaire, since it is important that these responses reflect realistic conditions. Ethnography, as discussed in the next section, aims to capture responses in natural settings [Mouton, 2001].
6.5.4 Ethnography
Sociological understandings and methods have been used to study the settings in which work is conducted, to inspire and guide the design of interactive systems, and to evaluate those systems in real working conditions [Millen, 2000]. Ethnography, derived from the anthropological practice of immersion in other cultures to understand and express social reality, is such a method [McGuigan, 2005].
In ethnography, research participants are treated as a ‘foreign tribe’ with the researcher as the anthropologist studying the culture of this ‘tribe’ [Olivier, 2004]. Culture is not limited to ethnic culture but is seen in the widest possible way. Ethnographic research typically involves field work done in natural settings with a bias towards understanding activities from the informants’ perspective [Millen, 2000].
Fieldwork and the naturalistic observations used in ethnography are usually qualitative and aimed at in-depth descriptions of a small number of cases (less than 50) [Mouton, 2001]. In defence of ethnography versus market research, Gilmore [2002] notes: ‘Ethnographic stories and observations are clearly not based on representative samples, since there is nothing average or typical about them. But the truth is that there is no average person out there’.
Fieldwork in natural settings is time-consuming while the dynamic mobile industry has short product cycles which require quick answers to design questions [Blom et al., 2005]. In response to this problem, Millen [2000] advocates the use of ‘rapid ethnography’, which is a collection of field methods intended to provide an understanding of users and their activities given significant time pressures as experienced in mobile phone research. The core elements include limiting or constraining the research focus and scope, using key informants, capturing field data by using multiple observers and interactive observation techniques, and collaborative qualitative data analysis [Millen, 2000].

Chapter 6 Research Design and Methodologies
A model for representing the motivational and cultural factors that influence mobile phone usage variety
102
6.5.5 Statistical analyses
Quantitative research methods use statistics to analyse their results. Zimmerman and Muraski [Zimmerman and Muraski, 1995] divides statistics into descriptive statistics and inferential statistics. Descriptive statistics provide a description of the population based on numerical values while inferential statistics provide a tool for explaining and predicting selected characteristics of the individuals studied. Inferential statistics or sampling statistics is applied to a sample of the population. One or more statistical tests are run and this is then generalised back to the original population [Berger and Maurer, 2002].
Descriptive statistics are calculated from the characteristics of the population, sample or group, enabling the researcher to describe the group [Olivier, 2004]. Inferential statistics are used to determine whether experimental hypotheses (predictions regarding the research) are true [Field, 2005] and also to mine the statistics for trends that were not obvious from the qualitative analysis.
Selecting the appropriate statistical test can be a daunting task. Basic selection guides for selecting a statistical test according to the data category(nominal, ordinal or interval/ratio data) and whether the researcher is comparing independent groups or match groups, are available [Zimmerman and Muraski, 1995; Field and Hoyle, 2005]
In this study descriptive statistics was used to build a demographic profile of the group against which the findings could be contextualised and interpreted. This meant calculating distribution measures on gender, age, language etc. for the participants in the pilot study, the survey and the verification survey.
The inferential statistics used in this research include reliability analysis, data reduction and correlation analysis. Appendix 6 provides more detail on the statistical analyses used in this study.
6.6 RESEARCH DESIGN This research was planned and conducted in phases where the findings of one phase were used as
input to the next, as depicted in Figure 6.1. The research commenced with Phase 1, a literature study (as presented in Chapters 2 to 4), after which
the research question was delimited and placed in context. This was followed by Phase 2, the data-gathering phase, consisting of three sub-phases:
The initial requirements gathering: This sub-phase consisted of structured interviews and observation of people using their phones as well as the mini-survey with sales people. This was followed by additional literature searches to support the observation and findings. The focus was on finding the motivational and cultural factors that influence mobile phone usage. Nevertheless, other factors, e.g. demographic factors as discussed in Chapter 3, section 3.2, were also known to influence mobile phone usage and therefore it was necessary to gather as much data as possible about mobile phone usage.

Chapter 6 Research Design and Methodologies
A model for representing the motivational and cultural factors that influence mobile phone usage variety
103
Figure 6.1: Research phases in this study The pilot study: This sub-phase tested the usefulness of the questionnaire (which had been refined after
the interviews) in capturing data from a larger number of participants in a less supervised setting. The data was analysed to see if all the constructs tested had internal validity. For example, do the five questions supposed to test for the cultural dimension of uncertainty avoidance, validly test that construct according to
PHASE 1
Initial Literature Study
Mobile phone infrastructure
Factors influencing the mobile phone users
Mobile phone adoption and use
Delimit research question
PHASE 2.1
Requirements Gathering
Interviews
Develop first version of questionnaire
Mini-survey
Analyse findings
Literature study on findings
PHASE 2
Data Gathering
PHASE 2.2
Testing Questionnaire
Update questionnaire based on findings of Phase 2
Testing the questionnaire
Analyse findings
Literature study on findings
PHASE 2.3
Conduct Survey
Finalise research questions
Develop questionnaire for survey
Conduct survey
Analyse findings
Literature study on findings
PHASE 3
Propose Model
Identify determining factors
Identify mediating factors
Identify relationships between components
PHASE 4
Evaluate Model
Verify model statistically
Validate model with users
Evaluate model for simplicity, generality, comprehensiveness, exactness and clarity
Evaluate usefulness of the proposed mode

Chapter 6 Research Design and Methodologies
A model for representing the motivational and cultural factors that influence mobile phone usage variety
104
their Cronbach’s Alpha coefficient? This was then followed by additional literature searches to support the observation and findings. All the findings were used in adapting the questionnaire for the survey.
The final survey: The next sub-phase was the final survey with the aim of collecting data for statistical analysis that could be used to answer the research questions. The questionnaire used in the pilot study and the one used in the final survey included open-ended questions for capturing qualitative data, but the focus was on gathering quantitative data. At the end of the survey the results were again compared against additional literature searches to support the observation and findings.
Following Phase 2, a model for representing the motivational and cultural factors that influence mobile phone usage was proposed (Phase 3). The proposed model was tested quantitatively in Phase 4 by validating the importance of each of the components and their correlation in a survey. The model was also tested qualitatively by testing the usefulness of the model in explaining people’s mobile phone usage in terms of completeness and comprehensibility. The verification survey could only be designed once the model was developed.
The remaining three phases in the research design for this study will now be discussed by looking at the objectives of each phase, how the study was conducted, how the results were analysed and how the findings of one phase influenced the design of the next phase. The results of Phase 2 are presented in Chapter 7, the proposed model in Chapter 8 and the evaluation of the proposed model in Chapter 9.
6.7 PHASE 2: DATA GATHERING The data gathering consisted of the initial requirements gathering as discussed in section 6.7.1, the
pilot study as discussed in section 6.7.2 and the survey as discussed in section 6.7.3.
6.7.1 Phase 2.1: Initial requirements gathering
The first sub-phase of the data-gathering phase focused on identifying the relevant issues in mobile phone usage and how to capture them. This meant refining the aims and developing the questionnaire based on the literature study and other relevant studies on cultural factors as discussed in 3.5.4 and mobile phone usage studies as discussed in section 4.2.1.
A study to gather contextual information on mobile phone use in South Africa has been conducted by Hugo [Hugo, 2000]. The study provides a narrative account of interviews on how people integrate mobile phones into their daily life and work life. The usefulness of Hugo’s study is limited by the fact that it omits data like the number of people interviewed and the selection criteria for the participants. No other studies, or suitable data collections, could be found. Therefore it was necessary to collect primary data for this research.
The requirements-gathering phase will now be considered in more detail by looking at the goal of the interviews in section 6.6.1.1, the development of the questionnaire in 6.7.1.2, the selection of the participants in 6.7.1.3, and conducting the interviews and mini-survey in 6.7.1.4.

Chapter 6 Research Design and Methodologies
A model for representing the motivational and cultural factors that influence mobile phone usage variety
105
6.7.1.1 The Goal of the interviews
The goal of the interviews was to gain a better understanding of the way in which people use their mobile phones and to observe if the questionnaire is usable, effective and efficient in capturing the data needed. The goal of the mini-survey was to gain an understanding of the approach marketers follow in selling mobile phones in order to understand the support users are given in selecting mobile phones.
6.7.1.2 Developing the questionnaire
An in-depth literature study did not provide any questionnaire usable for capturing the user profile that includes cultural dimensions and user preferences for mobile scenarios. Surveys have been done on mobile use, e.g. Kiljander’s study on interaction styles [Kiljander, 2004], but this questionnaire did not provide the data needed to explore relations between cultural dimensions, user behaviour and user needs.
Surveys from marketing were found useful, notably those of Kleijnen et al [2004] and Roberts [Roberts, 2004] whose studies are described in section 4.2.1. However, none of these studies covered the scope of this research and therefore only individual questions could be reused.
Existing questionnaires, literature on usage spaces [Marcus, 2005b], and commercial information about features of mobile phones were therefore consulted in compiling the initial questionnaire. Information about the following facets was captured:
• Biographic detail: Age group, gender; qualifications, home language, work language, social language, and technological development based on level of computer literacy and computer experience.
• Cultural dimensions: Based on the literature survey it was decided that, despite the criticism noted in section 3.5.4, gathering information on cultural dimensions is the best approach for this research, since it was necessary to gather quantitative data as well. A questionnaire developed by Ford [Ford, 2005] for capturing Hofstede’s cultural dimensions was used as a starting point for the questions on this topic.
• Priorities in selecting and using a mobile phone, frequency of features used, and utilisation of the menu system: This was based on research about critical attributes in mobile phones [Woo and Fock, 1999; Nurvitadhi, 2002; Kleijnen et al., 2004; Choi, Lee, and Kim, 2005], as well as work on mobile preferences by Marcus [2005b].
6.7.1.3 Selecting the test participants
Ten people participated in the interviews. The first three included one male between the ages of 20-29, one female between 30 and 39, and one female between 50-and 60 years of age. The results of the first three interviews were not scored as the sessions were unstructured and adapted according to the responses

Chapter 6 Research Design and Methodologies
A model for representing the motivational and cultural factors that influence mobile phone usage variety
106
of the test participants. The contents of the questionnaire changed drastically after each of the first three sessions.
The next seven test participants were selected to include both a male and a female in the following age groups: 20-29; 30-39; 40-49, and one female from the group 50-59. The test participants were selected to represent three different ethnic groups (African, Asian and European).
In order to investigate usage variety it was necessary to choose participants who were likely to make full use of the mobile phone’s capacity and features. The test participants were all selected for being technologically advanced, since technological advancement has been found to increase mobile phone usage [Kleijnen et al., 2004].
6.7.1.4 Conducting the interviews
The four principles for contextual interviewing, namely context, partnership, interpretation and focus, as described by Holtzblatt [2003] were used to guide the interview process as follows:
• Context: gather data on the way people use their mobile phones by observing how they use the phones and asking them about their behaviour.
• Partnership: Collaborate with users to understand their behaviour; let them lead the interview.
• Interpretation: Determine the meaning of the customer’s words and actions by sharing your interpretation and letting them fine-tune the meaning.
• Focus: Decide on the scope of the project and keep to it.
All the participants were exposed to the same methods and instruments. They were briefed that the aim of the study was to evaluate the questionnaire and to obtain information about how they use their phones.
Participants were observed in a usability laboratory and videotaped while completing the questionnaire. They were encouraged to voice their opinions about the questions, to ask questions and make recommendations.
The questionnaire (see Appendix 2) contained questions for capturing demographic details of the user, followed by questions on the use of their mobile phone and preferences in using the phone. Being more familiar to participants, the term ‘cell phone’ rather than mobile phone was used in the questionnaires. The questionnaire was followed by a short interview with each participant to gain a fuller understanding of the way in which they use their mobile phone, and to give them the opportunity to respond outside the structured format of the questionnaire.
The interviews were directed towards:
• Eliciting verifiable facts and ‘reality out there’ through questions on issues such as frequency and duration of communication interaction, breadth of interaction and variety of tasks.
• Discovering interviewees’ perceptions about mobile phone usage and reflections about the experience of using a mobile phone. This consisted of a mix of facts with personal experiences and emotional reactions in response to the questions (e.g. why did you decide to use voice rather than

Chapter 6 Research Design and Methodologies
A model for representing the motivational and cultural factors that influence mobile phone usage variety
107
SMS in a particular situation? or how different does it feel to receive a message on a mobile device as opposed to a desktop? etc.)
In most cases, the reviews were videotaped and reviewed to ensure reliability and to facilitate the interpretation of the conversations and surrounding cues.
A combination of the information about the way the participants use their mobile phone, informal feedback from participants and observations made during the sessions was used to adapt and refine the questionnaire for the pilot study.
6.7.1.5 Mini-survey
In order to gain a better understanding of the support people get in buying a mobile phone and the approach marketers’ use when advising potential customers about buying a mobile phone, a mini-survey was conducted with 10 marketers as part of the initial requirements gathering. Ten different sales people were visited (four at mobile phone shops in Pretoria and six at the Vodacom Techno Expo on 10 September 2005). The salespeople were approached with the following statement:
‘I want to buy a mobile phone.’ Whatever their response, it was followed by the question: ‘What do you recommend?’ The responses (whether a return question, a recommendation or providing a brochure) were recorded. Chapter 7, table 7.2 depicts the responses followed by a discussion of the findings.
6.7.2 Phase 2.2: Pilot study
In an exploratory study it is difficult to formulate hypotheses, yet it is necessary to consider what kind of data would be useful. At this pilot study stage of this research, the following two questions guided the investigation:
• How do cultural dimensions influence mobile phone usage patterns?
• What other factors influence mobile phone usage variety (e.g. infrastructure, features etc.)?
6.7.2.1 The Goal of the pilot study
A pilot study is necessary to test the questionnaire and observation schedule [Olivier, 2004]. Despite checking and rechecking the questionnaire, misunderstood questions, unexpected responses and problems in completing the questionnaire can only be identified by a real-life test. The participants do not have to be selected randomly since you do not plan to generalise the results, but the bigger the variety in the group, the better the chances of catching potential problems [Olivier, 2004].
6.7.2.2 Updating the questionnaire
At this stage the research questions and the information needed to answer the questions were reconsidered. It was realised that some of the questions reflected human-human interaction (for which

Chapter 6 Research Design and Methodologies
A model for representing the motivational and cultural factors that influence mobile phone usage variety
108
Hofstede’s dimensions [Hofstede, 1995] were designed), while the goal of this research was to investigate human-computer interaction. The questions were changed accordingly.
The data measurement, data types, scales and how they would be analysed to explore the link between cultural dimensions and usage variety, were considered. The data captured consisted of categorical nominal data, e.g. gender, also interval data as obtained from preferences expressed on a five-point Likert scale.
The questionnaire used in the pilot study is provided in Appendix 3.
6.7.2.3 Selecting the test participants
The participants were selected according to specific criteria, since there is evidence that age, education level, work environment and social environment influence mobile phone usage [Kwon and Chidambaram, 2000; Pedersen, 2003; Kleijnen et al., 2004; Selian, 2004; Kim and Lee, 2005]. The observations in the interviews confirmed the difference in mobile phone usage between age groups.
Purposive sampling is the practice of selecting participants according to specified criteria [Olivier, 2004]. In this case third-year computer science and information students were the most homogeneous group available regarding age, education level, work environment and social environment.
The participants were a group of 40 third-year computer science students, 65% male and 35% female, from Monash University (South African campus). They were from a variety of nationalities, but most students at the University are from an above-average socio-economic background. This was important to ensure that they would be in possession of a mobile phone with average or above-average functions and services, and could afford mobile phone services.
6.7.2.4 Conducting the pilot study
The students were invited to a session on mobile phone research. The lecturer issued the invitation to students, but was not involved in the research or data capturing and stated that participation was optional. Students were requested to fill in a questionnaire, which was followed by a short presentation to explain the rationale of the research. The presentation included a short question-and-answer session during which students could ask questions on the project. The presentation was scheduled for after the survey to ensure that students were not influenced by it. The responses were anonymous but students were requested to answer all the questions.
6.7.2.5 Analysis of the pilot study data
Descriptive statistics were used to present the demographic profile of the participants. Then the data was analysed with exploratory factor analysis, a technique for identifying clusters of variables that relate to each other [Field 2005]. This was done in order to understand the structure of the set of variables and to eliminate unused features from an original group of 46 features (derived from various mobile phone models and literature from manufacturers) so as to arrive at a more significant group of features.
Chapter 6 Research Design and Methodologies
A model for representing the motivational and cultural factors that influence mobile phone usage variety
109
In order to triangulate, the same problem was approached with a different strategy. Mobile phone features were grouped around a specific use. For example, relationship building is a need identified by Marcus [Marcus and Chen, 2002b]. Typical features associated with this need are caller identity, missed calls, phone book, reminders and SMS.
Once the group of features for supporting a need was identified, an analysis to ascertain reliability of relatedness was performed on the features, i.e. a Cronbach’s Alpha was calculated for each group. In the same way, groups with different combinations of features for each use were created. If these groups of features demonstrated cohesion, as measured by the reliability analyses, we could proceed to seek correlations between other user characteristics and the group.
6.7.3 Phase 2.3: Survey
When dealing with opinions and people’s behaviour, every contribution is important and we could not discard any information on the basis that only one person mentioned it. On the other hand, if this model is to be used by marketers and designers then the quantification of a preference (i.e. how many people find it important) is necessary to decide whether or not a specific feature is required. Therefore findings need to be supported by statistical evidence.
6.7.3.1 The Goal of the survey
The goal of this survey was to provide quantitative data to be used in creating a model of the motivational and cultural factors that influence mobile phone usage.
6.7.3.2 Identifying information needed to answer the research question
The questionnaire was designed to capture data that can be analysed for correlations between the user needs expressed as uses, their preferences and how they use their mobile phones. If correlations could be found, then user needs (instead of the cultural profile as was planned) can be used to predict user preferences and make recommendations about the features a person needs in a mobile phone.
6.7.3.3 Updating the questionnaire
The questionnaire was tested in the interviews and refined for the pilot study. In the pilot study it was tested on 40 respondents and recommendations were made. It was then refined still further according to the recommendations made at the end of the pilot study. The questionnaire used in the survey is provided in Appendix 4.

Chapter 6 Research Design and Methodologies
A model for representing the motivational and cultural factors that influence mobile phone usage variety
110
6.7.3.4 Selecting the test participants
The participants were again selected purposively for criteria such as age, education level, social and work environment. The final study had 138 participants, 68% male and 32% female. Their ages ranged from 18 to 27, with an average age of 20. We selected computer science or information systems students from two South African universities, with the expectation that they would use technologically advanced mobile phones. Table 6.1 compares the pilot study with the survey in terms of participants’ mother-tongue distribution. The category Sotho encompasses Sepedi, SeSotho and SeTswana, while Nguni encompasses IsiNdebele, IsiXhosa and IsiZulu.
Language Pilot (%) Survey (%) Afrikaans 13 34 English 17 15 Nguni 15 16 Shona 8 0 Sotho 47 27 Tshivenda 4 Xitsonga 4
Table 6.1: Comparison of language distribution
6.7.3.5 Conducting the survey
The students were invited to a session on mobile phone research. The lecturers at the two participating universities extended the invitation to students, but were not involved in the research. A session was done at each campus during February of 2006. Participation was optional and anonymous. Upon completion of the questionnaire, there was a presentation on the rationale behind the research as a token of gratitude towards the students for their time and input.
6.8 PHASE 3: PROPOSE MODEL A model captures the essential aspects of a system or process [Olivier, 2004]. Models are created from
data, concepts and the hypotheses that form the theories.
• Data: the measurements and records of activity or events. Data should be valid and reliable.
• Concepts: the abstract ideas relevant to the questions you are trying to answer in your research. Abstract ideas should be expressed as operational definitions containing some piece of data that can be recorded or observed. For example, defining usage breadth as the number of associates to whom calls are directed and from whom calls are received. Operational definitions should be valid, i.e. measure the concepts you are trying to quantify.

Chapter 6 Research Design and Methodologies
A model for representing the motivational and cultural factors that influence mobile phone usage variety
111
• Hypotheses: Statements that explain the relationships between concepts. A set of related hypotheses go into making up a theory about your research problem.
Data, concepts and hypothesis are fundamental to all types of research, but how they are dealt with differs according to the discipline. In positivist approaches the hypotheses or theories are expressed in a way that that can be translated into statistical tests [Mouton, 2001]. In contrast, interpretivist approaches express hypotheses in ways that allow for partitioning, comparison, triangulation and other qualitative methods of analysis [Miles and Huberman, 1994].
In the initial stages tentative models are useful to clarify the problem. In this study the first model contained the user, the mobile phone and their interactions as components. At that stage it was realised that the research question required a quantitative as well as a qualitative approach.
Inductive reasoning is used to construct a model to fit certain empirical data [Mouton, 2001]. From this first tentative model we moved on to state the assumptions and investigate the alternatives. For example, having selected university students as participants to control demographic influences, it had to be assumed that their socio-economic status is relatively the same. It is not always possible to check if assumptions are valid and therefore it is important to state them so that any other researcher can decide how that could influence the findings.
At that stage alternatives were considered, i.e. asking school children to participate in the survey, but the problems with the regulation that their parent should give written permission made this very difficult. As the model evolves it becomes more differentiated as it addresses specific issues in more detail. Based on the differentiated model, a general model is proposed that caters for most of the trends observed in the differentiated models. When constructing a model the researcher has to take note of existing models and compare the new model to similar models by looking at the strengths and weaknesses of each. The relevant models on motivational needs and culture are discussed in Chapter 3 and those on technology adoption in Chapter 4. .
Models developed from quantitative methods are expressed in rigid formalisms where the relationships between the components are statistically motivated. For example, the TAM [Davis et al., 1989] and the model for mobile phone adoption and use [Kwon and Chidambaram, 2000]. The problem with this level of rigour is that it does not allow for the inclusion of qualitative observations that have not yet been verified statistically or may not be amenable to quantitative evaluation.
This research lies at the intersection of fields and therefore the model will be more structured than the textual description type of models used in sociology but less formal that the statistical models used in marketing. The components of the model and their relations will be motivated quantitatively and qualitatively but the statistical strength or weakness of the relationships will not be considered.
In the early stages of the research a predictive kind of model with reasoning capabilities was envisaged. However, as the complexity of the situation unfolded it was clear that the personal factor would always be present and therefore the model would be more like a menu from which a user could select.
Models are evaluated according to the following metrics [Olivier, 2004]:

Chapter 6 Research Design and Methodologies
A model for representing the motivational and cultural factors that influence mobile phone usage variety
112
• Simplicity: A model should be simple enough to allow comprehension of the essence of the concept being modelled.
• Comprehensiveness: The model should allow one to deal systematically with the different aspects of the problem without getting bogged down in the detail.
• Generality: A model should address as many variations of the problem as possible.
• Exactness: The closer the model fits the perceived problem, the more likely it is to be accepted.
• Clarity: The purpose of the components, the operations and the interactions between them should be evident.
6.9 PHASE 4: EVALUATE MODEL Models should be conceptually coherent, consistent and testable [Mouton, 2001]. Evaluating a model
means verifying what it has been developed correctly and also validating that the correct model has been developed [Boehm, 1984]. The model will be verified quantitively by means of a questionnaire, with questions designed to capture the importance participants assign to each component in the model and the correlations between components. The model will also be verified qualitatively by comparing it with existing models with a similar purpose.
The model will be validated by evaluating it with users and considering the usefulness of the model. It will also be evaluated for simplicity, comprehensiveness, generality, exactness and clarity. The evaluation procedure and the findings are described in Chapter 9. The questionnaire used in the verification survey is provided in Appendix 5.
6.10 SUMMARY The first part of this chapter considered the concept of a research philosophy and provided a brief
overview of research methods in HCI. The methods used in this research were then discussed in more detail.
The second part described the research design for this research and then described the research process for each of the phases following the initial literature study phase in more detail, i.e. data gathering, proposing the model and evaluating it. The results of the data-gathering phase are discussed in Chapter 7, the proposed model in Chapter 8 and the evaluation of the model in Chapter 9.

Chapter 7 Results and analyses
A model for representing the motivational and cultural factors that influence mobile phone usage variety 113
CHAPTER 7: RESULTS AND ANALYSES
7.1 INTRODUCTION This chapter describes the analyses of the data obtained from the initial requirements gathering, the
pilot study and the survey. The statistical analysis of the data was done with SPSS version 14.0. The results from the initial requirements gathering are considered in section 7.2 and the results and
analyses of the pilot study data are considered in section 7.3, whilst the survey results are discussed and analysed in sections 7.4 to 7.8. The demographic profile of the participants in the survey as well as infrastructural preferences regarding their mobile phone use are described in section 7.4. In section 7.5 the analyses of the questions relating to cultural dimensions are discussed. The aim is to try to relate mobile phone user behaviour to cultural dimensions in order to seek motivational and cultural factors that influence people in selecting mobile phones. The analysis of the data captured for priorities on buying a mobile phone is given in section 7.6, whilst section 7.7 deals with the analyses of the data on feature frequency use by using two different data reduction methods, namely factor analysis and optimal scaling. In section 7.8 the factors identified in each of the three areas of investigation, namely cultural dimensions, priorities on buying and feature frequency usage are correlated. Section 7.9 deals with the findings in the context of the research questions and section 7.10 summarises this chapter.
7.2 THE INITIAL REQUIREMENTS GATHERING The initial requirements gathering consist of the interviews and the mini-survey. The findings from the
interviews are discussed in section 7.2.1, the findings from the mini-survey are discussed in section 7.2.2 and the implications of these findings for the design of the pilot study questionnaire and this research in general are discussed in section 7.2.3.
7.2.1 Results from the interviews
The results of the interviews (based on the questionnaire provided in Appendix 2) are depicted in Table 7.1. The columns depict the participants’ mobile phone usage on the criteria listed in the rows. The capacity used was determined by going through the menu items on their mobile phone with the respondents and expressing the number they used as a percentage of the total number of items on the mobile phone. It is interesting to note that none of the participants used more than 50% of the features on their mobile phone.
Efficiency was measured by looking at the time required to complete the questionnaire. The session was planned to last 30 minutes, and the actual times varied from 20 to 40 minutes.

Chapter 7 Results and Analyses
A model for representing the motivational and cultural factors that influence mobile phone usage variety
114
Age group of participants in years 50 to 60 40 to 50 30 to 40 20 to 30 Capacity of phone used 7 % 32% 40% 16% 20% 41% 38%
Uncertainty avoidance High High High Medium- High
Low High Low
Time orientation Long Long Long Long Long Short Short Individualist (I) / Collectivist (C)
I I I C
I C
C
Power distance Low Low Low Low Low Low Low Number of stored phone numbers
20 45 50 20 80 38 185
Priority uses: Relationship (R) Safety and security (S) Information (I)
R, S R, S, I R, S R, S R, S R,S S
Priorities in purchasing
price effective ease of use battery
price effective efficient ease of use battery
effective ease of use battery
price effective efficient ease of use battery
price effective efficient battery
price effective efficient
battery
Table 7.1: Results from the interviews One test participant complained of disorientation while doing the questionnaire on cultural dimensions,
and frequently selected ‘not sure’ as a response. Another was worried about being inconsistent and repeatedly returned to earlier questions and answers. The shorter responses and apparent loss of concentrations towards the end of the questionnaire would increase in a less supervised setting. Therefore the number of 60 questions had to be reduced. Based on the answers and verbal feedback, 5 questions were changed and 9 omitted.
The video recording of the participants were reviewed, looking for specific behaviours that could give additional information on the usability of the questionnaire. User satisfaction was judged by the comments and behaviour of test participants. Based on the review of the recordings, it was found that the participants had little trouble in completing the questionnaire. When looking at cultural dimensions, none of the participants could be identified as high power-distant. All were working in a low power-distant environment and we speculated that their work culture could have influenced their ethnic or personal culture. In all four of the other dimensions, i.e. individualism/collectivism, uncertainty avoidance, male/female and time orientation, we found participants from both sides of the scale.

Chapter 7 Results and Analyses
A model for representing the motivational and cultural factors that influence mobile phone usage variety
115
The questionnaire was effective in capturing the basic demographic detail but some questions had to be adapted. For example, we intended to use home language as a basis for classifying ethnic groups but then all the participants indicated English as their home language. They either did not use their mother tongue at home or preferred to say it was English. The fact that they did not list their ethnic language as their home language, made it impossible to make an ethnic connection. Questions concerning ethnic classification have been reported to influence responses, or alienate test participants [Gladwell, 2005], and it was therefore difficult to tell whether the problem was that it is a sensitive issue, or whether it was the wording. Home language was replaced with ‘mother tongue’, which was described as the first language they learnt to speak.
Two of the participants accidentally skipped questions and were requested to go back and fill in the answers. Scoring the tapes helped to engage with the user’s behaviour on a more detailed level in order to gain an understanding of how they experienced the questionnaire and their thoughts on mobile phones. As the situation was primarily exploratory, no attempt was made to do any quantitative analyses of the data.
7.2.2 Results from mini-survey
Table 7.2 depicts the results from the mini-survey conducted with sales people from different mobile phone vendors. The columns indicate the following:
• First column: a number to identify the respondent.
• Second column: enquiry about the price the customer can afford.
• Third column: enquiry about contract options (contract or pay-as-you go).
• Fourth column: enquiry about features needed, i.e. need for a camera.
• Fifth column: a personal recommendation on what they would choose.
• Sixth column: offering a brochure to the customer.
• Seventh column: a question on the purpose of the phone, i.e. customer’s needs.
The responses show that only 20% of the responses were directed at finding the user’s purpose for the phone, while 30% of the responses were directed at features and 20% at price. This suggests that customer support in selecting mobile phones is feature and price-driven rather than user-driven.
This informal observation does not provide any evidence that sales people do not consider user needs in recommending mobile phones. Nevertheless, Karl Popper stated that it is more powerful to seek disconfirming evidence than to try to corroborate a theory [Field, 2005]. This means that if there is one sales person who used the feature-driven approach then it cannot be said that it does not exist. Having found that six of the ten sales people interviewed started with features and services, it can therefore be concluded that the feature-driven approach does exist and it could affect mobile phone usage.

Chapter 7 Results and Analyses
A model for representing the motivational and cultural factors that influence mobile phone usage variety
116
Price Service Features Personal
RecommendationBrochure Purpose
1 √ √ 2 √ √ 3 √ √ 4 √ √ 5 √ √ 6 √ √ 7 √ √ 8 √ √ 9 √ √ 10 √ √ Total 4 (20%) 2 (10%) 6 (30%) 2 (10%) 2 (10%) 4 (20%)
Table 7.2: Summary of sales people’s responses
7.2.3 Implications for the pilot study
The interviews highlighted the importance of stating the context explicitly. Questions have to be very specific and contextualised, e.g. the way people reason about time in general may not apply to the concept of time in the mobile use scenario. This suggested the existence of a separate mobile phone culture that cannot be deduced from the participants’ ethnic or any other cultural base.
Although the issue of using the mobile phone for personal security was included in the questionnaire, the security of the mobile phone device itself was not addressed in the questionnaire. However, it did emerge as an important topic to add questions about. Participants older that thirty generally used less of their mobile phone capacity, and their attitudes were markedly different from the attitudes of people younger than 30.
The following findings relate to participants over the age of 30:
• They thought of a mobile phone mostly as a mobile version of the traditional phone.
• The highest priority identified was using the mobile phone for security, followed by relationship building. Two people voiced concerns about losing their mobile phone and consequently all the data on it.
• Many questioned the value of a feature before being willing to consider using it.
• When their automatic update to a new version was due, they often gave the new phone to a relative and preferred to keep the old phone.
The following was noted about the mobile phone usage of participants under the age of 30:
• They viewed the phone as a tool for communication, organization and especially entertainment.

Chapter 7 Results and Analyses
A model for representing the motivational and cultural factors that influence mobile phone usage variety
117
• They demonstrated a keen interest in exploring all the features available, but were inhibited by cost.
These findings led to the observation that people do not use the full capacity of their mobile phones and that their interest and use of the phone is not primarily focused on features. A combination of the information about the way they use their mobile phone, informal feedback from participants and observations made during the sessions was used to adapt and refine the questionnaire for the pilot study.
7.3 THE PILOT STUDY The results of the pilot study with 40 participants will now be considered (Appendix 3 contains the
questionnaire used in the pilot study). The results and analyses of the data from the pilot study are considered in section 7.3.1 where participants’ priorities on buying, the cultural dimensions and feature frequency usage is considered. The implications the findings of the pilot study had for this research are dealt with in section 7.3.2.
7.3.1 Results and analysis from the pilot study
Users were requested to list the most important issues they consider in buying a mobile phone. The responses are aggregated under categories as depicted in Figure 7.1. The most important response related to having a specific feature, rather than having many features (which was second). Price was ranked third and usability fourth in the top four priorities.
Technology5% Usability
12%
Specific feature21%
Appearance8%
Brand9%
Size8%
Features19%
Price14%
Service4% Technology
UsabilitySpecific featureAppearanceBrandSizeFeaturesPriceService
Figure 7.1: Priority issues on buying a mobile phone
The second aim of the pilot study was to consider the feasibility of using cultural dimensions to explain
mobile phone feature preferences. The Cronbach’s alpha values were computed as listed in Table 7.3. It follows that only the dimension of technological development had a correlation above 0.7, but uncertainty avoidance at 0.65 came close to 0.7 and warranted further investigation.

Chapter 7 Results and Analyses
A model for representing the motivational and cultural factors that influence mobile phone usage variety
118
Dimension Cronbach’s Alpha Coefficient Variables Alpha Technological development Raw 0.731244 Standardised 0.731047 Time-perspective Raw 0.250291 Standardised 0.182336 Uncertainty avoidance Raw 0.654830 Standardised 0.679292 Time-orientation Raw -0.732048 Standardised -0.873414 Individualism Raw -0.086748 Standardised -0.057296
Table 7.3: Reliability of cultural dimensions The content of each question was checked to see if it reflected the dimension accurately and in the case
of the individualism dimension, it was found that the questions focused on the individual versus a group, while they should have focused on the individual versus relatives and family in order to represent collectivism. These questions were adapted accordingly. No content changes were made to the questions for the other dimensions.
For time-orientation and time-perspective the internal validity of the items was unacceptably low. Research on relating cultural dimensions to usability in web site interfaces [Ford and Kotze, 2005b] was also inconclusive concerning time-orientation since not enough test-subjects could be identified as short-term oriented. Based on the results of the pilot study and the support in literature for the difficulties in identifying certain cultural dimensions [Ford and Kotze, 2005b], only the dimensions of technological development, uncertainty avoidance and individualism/collectivism were retained, albeit with a revised set of questions for the latter.
Thirdly the feature frequency usage was captured by asking participants to indicate their use of each feature as never, less than monthly, monthly, weekly and daily. Exploratory factor analysis was done on this data for all of the 46 features. The result of the factor analysis is not shown here as this result is mainly used to update the questionnaire for the survey.
However, the factor analyses indicated that usage frequency clustered around features used very often, e.g. phone book, SMS and missed calls, and also features used seldom, e.g. conference calling and e-banking, which was to be expected. More interesting was the other clusters which seemed to be grouped around a specific need, as follows:
• Safety and security: Voice calls, SMS, phone book, caller identity and missed calls
• Relationships: Voice calls, SMS, phone book, caller identity and missed calls

Chapter 7 Results and Analyses
A model for representing the motivational and cultural factors that influence mobile phone usage variety
119
• Organisation: alarm, phone book, profile, reminders and missed calls
• Personal information: photo-album, camera, SMS and personal notes.
The groupings were not significant, but the idea that feature usage clusters around certain motivational needs warranted further investigation in the survey.
Another approach is to start with a usage space (specific need), select a group of features that could possibly support this space, and then try to find the internal reliability of the construct. The uses and groups of features that demonstrated a Cronbach’s Alpha value greater than or equal to 0.6 are presented in Table 7.4. A value of less than 0.7 is not significant, but at this stage it was more important to note all trends and tendencies for further investigation in the survey rather than to provide evidence.
Use Features Cronbach’s Alpha Relationships caller identity, missed calls, phone book, reminders, SMS 0.724 Self-image profiles, ring tones, screensavers 0.600 Organize alarm, reminders, phone book,
vibrating alert, missed calls, caller identity 0.680
Personal history camera, photo album, picture messages 0.824 Table 7.4: Reliability analyses
The results in Table 7.4 suggest that safety and security/relationships, organisation and personal history
definitely warrant further investigation while self-image seems less important. The use of a mobile phone for safety and security would require features such as voice calls, SMS, phone book and caller identity, almost the same set required for relationships.
The feature usage frequency table (not shown here) indicated that there was no student who used all of the 46 features listed in the questionnaire, 26 of the 46 features were used by less than 50% of the participants and only 5 of the features were used on a daily basis by all the participants. This supports the notion that many users do not use the full capacity of their mobile phones.
We can only speculate on the reasons why so few features were used regularly. Based on the conclusion that the questionnaires were answered truthfully, the following explanations can be considered (as noted the term ‘features’ includes both handset features and network services, but in this evaluation it was found necessary to distinguish between features and services, since services were found to be harder to use):
• Ignorance concerning the availability of features: two students constantly indicated that very basic features, e.g. an alarm, were not available, but this proved incorrect when checked against the model they used.
• Ignorance concerning the availability of services: some services, e.g. e-banking, have to be set up with service providers in order to become available.

Chapter 7 Results and Analyses
A model for representing the motivational and cultural factors that influence mobile phone usage variety
120
• Cost: Access to e-mail and browsing the Internet is a relatively costly service in South Africa and this could influence the use.
The rest of the questionnaire was also revised: changing questions to a more optimal format, adding new items and removing questions not found informative, or usable, in the pilot study.
7.3.2 The implications of the pilot study for the survey
This pilot study had only 40 respondents, which makes it precarious to attempt to generalize the findings. What it does provide is confirmation of Kiljander’s statement [Kiljander, 2004] that most users use only a small percentage of the features available on the mobile phone. This seems contradictory to the finding that features is an important issue in buying a phone, i.e. a specific feature and the number of features are important when purchasing the phone even though the features may not be used regularly or not used at all.
Unfortunately the questionnaire did not capture the reasons for not using a feature, or not using it regularly. Therefore it was not clear if it was due to lack of interest, lack of information or due to financial reasons.
Acknowledging that feature use can be influenced by different factors, the statistical analysis looked at the needs expressed versus the features actually used. This analysis gave an indication of particular feature groupings that need to be investigated. It became clear that there are emerging usage spaces such as security, personal organization and personal history that need to be given serious consideration.
The original idea was to formulate the hypotheses for this research between elements of the user profile and elements of mobile use preference. The aim was to establish whether or not a correlation exists between cultural dimensions and user preferences in using mobile devices. However, the results from the pilot study indicated that trying to identify users according to cultural dimensions is problematic. Of the five user dimensions selected to categorize users, only two could be tested reliably. This means that the data needed for investigating the research question on cultural dimensions cannot be collected as planned.
Analysing the frequency of features usage with factor analyses leads to the discovery of distinct groupings of features that seem to represent motivational user needs. This supports the idea of a needs-based approach, which means investigating correlations between user needs and mobile phone variety, instead of a cultural dimension-driven approach. All these findings were taken into account when revising the questionnaire presented in Appendix 4 for the survey questionnaire as presented in Appendix 5.
Section 7.4 to sections 7.8 will discuss the results obtained from the survey and section 7.9 will discuss the overall findings.

Chapter 7 Results and Analyses
A model for representing the motivational and cultural factors that influence mobile phone usage variety
121
7.4 PROFILE OF THE SURVEY PARTICIPANTS This section describes the analyses of the data obtained from the survey. The participants in this group
were purposively selected for age and education level, since age [Kwon and Chidambaram, 2000; Pedersen, 2003; Kleijnen et al., 2004] and education [Ling and Haddon, 2001; Teo and Pok, 2003a; Nickerson and Isaac, 2006] have been found to influence mobile phone usage.
According to [Kwon and Chidambaram, 2000; Urbaczewski et al., 2002] nationality influences mobile phone use. In contrast, Rice and Katz [2003] found that race does not influence mobile phone usage. Given these contradictory findings, the participants were selected to include different ethnic groups. However, since participation was optional, there was no control over the percentage of each group.
Employment status, income and experience in using the mobile phone are moderating factors influencing people’s mobile phone use [Rice and Katz, 2003; Nickerson and Isaac, 2006]. Selecting students could control employment status and to a degree income, but experience with the mobile phone was a variable that could not be controlled.
Section 7.4.1 deals with the demographic profile of the participants, providing descriptive statistics on age, gender and language of the sample. In order to gain a better understanding of the infrastructural factors that could influence the behaviour of these participants, the infrastructure used, e.g., type of contract, brand of phone and service provider chosen, are considered in section 7.4.2
7.4.1 Demographic profile
There were 138 participants of whom 64 (46%) were male and 74 (54%) female, 69% attended urban schools, while 31% completed their matriculation in a rural area. All participants have successfully completed the matriculation examination and were third-level (third-year) students from two universities in Pretoria, namely the Tshwane University of Technology (60 students) and the University of Pretoria (78 students).
In general the questionnaires had few missing values; only one of the questionnaires was very incomplete and this case was discarded. Further analysis was hence done on 137 cases with missing values reported where appropriate.
Data on the demographic variables of age, mother tongue and gender were captured, and each of these will now be discussed in turn. Age was distributed as depicted by the histogram in Figure 7.2 with an average age of 21.
The mother-tongue language distribution is used as an indication of ethnic origin: most participants had Afrikaans as their mother tongue (36%) with Sotho (24%) in second place, English (16%) in third place and Nguni (15%) in fourth place as depicted in Figure 7.3.
The influence of ethnic culture is not analysed further due to the difficulties in capturing ethnic origin correctly (as discussed in section 7.2.1). Even the use of language (mother tongue), which was found to be the most acceptable indicator of ethnic origin, is open to criticism on practical and ethical grounds.

Chapter 7 Results and Analyses
A model for representing the motivational and cultural factors that influence mobile phone usage variety
122
Another reason is that many of the respondents came from more than one ethnic culture and it would be impossible to categorise them according to ethnic origin.
27.025.024.023.022.021.020.019.018.017.0
Age
40
30
20
10
0
Coun
t
1%2%3%
5%
12%
28%
22%
16%
7%
4%
Age Distribution
Figure 7.2: Age distribution Figure 7.3 depicts the mother-tongue language distribution. Language is used as an indication of ethnic
origin: most participants had Afrikaans as their mother tongue (36%) with Sotho (24%) in second place, English (16%) in third place and Nguni (15%) in fourth place as depicted in Figure 7.3.
The influence of ethnic culture is not analysed further due to the difficulties in capturing ethnic origin correctly (as discussed in section 7.2.1). Even the use of language (mother tongue), which was found to be the most acceptable indicator of ethnic origin, is open to criticism on practical and ethical grounds.
Another reason is that many of the respondents came from more than one ethnic culture and it would be impossible to categorise them according to ethnic origin.
The gender split was 46% male and 74% female. On the question of gender, the literature on the subject reported contradictory findings. Some studies found a difference between the mobile phone use of men and women [Ho and Kwok, 2003; Bina and Giaglis, 2005] while other studies on gender were inconclusive [Rice and Katz, 2003; Nickerson and Isaac, 2006].
Gender is not the focus of this research and therefore gender differences are not investigated in all possible ways. Only priorities on buying and technological development were investigated for gender differences since they related to gender differences found in section 3.2.

Chapter 7 Results and Analyses
A model for representing the motivational and cultural factors that influence mobile phone usage variety
123
2%
4%4%
24%
15%16%
36%OtherXitsongaTshivandaSothoNguniEnglishAfrikaans
Mother-tongue
Mother-tongue distribution
Figure 7.3: Mother-tongue distribution
The results of the independent-samples t-test for priorities on buying, as depicted in Table 7.5, were
not significant as far as gender difference is concerned:
• technology/features t(132)=1.18, p=0.24;
• accessibility t(132)=-0.22, p=0.83;
• usability t(132)= -.05, p =0.96 and
• appearance/image t(132)= -1.4, p=0.16.
Equal variances were assumed in all these cases. It follows that p> 0.05 in all these cases, which means there is no significant difference between genders for these participants regarding the priorities of buying tested here.
The technological development (also referred to as ‘technological advancement’) is a measure of the participant’s familiarity with the use of technology. Technological advancement is discussed in section 7.3.1 since it has been identified as a cultural dimension [Baumgartner, 2003], but other studies list it as a demographic variable [Kleijnen et al., 2004].

Chapter 7 Results and Analyses
A model for representing the motivational and cultural factors that influence mobile phone usage variety
124
Another independent-samples t-test (not shown here) was used to analyse the effect of gender on technological development. Technological development was computed by taking the average of computer skills, computer experience, web experience and e-mail experience, and grouping that by gender). On average, men were more technologically advanced (M=4.27, SE=0.134) than women (M= 3.29, SE=0.150). Furthermore, t(135)=4.853), p< 0.0, indicating that gender groups differed significantly regarding their own perceived technological development. The bar chart in Figure 7.4 depicts technological development (TechDev) rating grouped by gender. This leads to the notion that gender may influence certain issues but gender difference cannot be generalised to all dimensions of mobile phone usage.
5.004.003.002.001.00
TechDev
60.0%
50.0%
40.0%
30.0%
20.0%
10.0%
0.0%
Perc
ent
FemaleMale
Q2 Gender
Figure 7.4 : Gender distribution and technological development
Sig. t df Sig (p) Mean Difference SE Difference
Technology/Features .500 1.18 132 .240 .204 .173
Accessibility .500 -.22 132 .83 -.038 .174
Usability .266 -.05 132 .96 -.008 .174
Appearance/ Image
.907 -1.4 132 .16 -.245 .172
Table 7.5: Independent samples t-test (2-tailed)

Chapter 7 Results and Analyses
A model for representing the motivational and cultural factors that influence mobile phone usage variety
125
7.4.2 Infrastructure measures of mobile phone usage
The survey questionnaire (Appendix 4) contained questions on mobile phone selection and use. It was found that 34% of participants had a contract, while 66% used pay-as-you-go. Males were distributed equally, i.e. between having a contract and the pay-as-you-go system. Females favoured the latter, with only 20% of the women having a contract. The participants made use of three different service providers and were divided as follows: Cell-C (10%), MTN (33%) and Vodacom (57%).
The length of time for which the participant had been using mobile phones was captured (not the time with the specific phone). The average was 4.6 years with a mode value of 5 years, which means that most participants have had ample exposure to mobile phone use. The questionnaire listed 12 brands, of which only 7 were used by the participants, with Nokia being used by most participants (50%) followed by Motorola in second place (21%). The distribution between brands is depicted in Figure 7.5.
OtherSony Ericsson
SamsungSagemNokiaMotorolaLG
Brand
50.0%
40.0%
30.0%
20.0%
10.0%
0.0%
Perc
ent
5%8%
14%
1%
50%
21%
1%
Distribution between Brands
Figure 7.5: Distribution between mobile phone brands

Chapter 7 Results and Analyses
A model for representing the motivational and cultural factors that influence mobile phone usage variety
126
7.5 CULTURAL DIMENSIONS In analysing the usage behaviour of mobile phone users, the following cultural dimensions were
investigated: technological development, uncertainty avoidance and individualism/collectivism. The reliability analysis for these dimensions was done as described in section 7.5.1. Owing to problems with the internal consistency in the responses to the questions, the method of optimal scaling was employed to explore Questions 12 to 20. The optimal scaling approach is described in section 7.5.2.
7.5.1 Reliability analysis
Starting with the dimensions of technological development, Questions 5, 6, 7 and 8 were set for measuring the dimension of technological development and the responses to the individual questions are depicted in Table 7.6. (The number of participants was 137 unless otherwise indicated as for questions 7 and 8.
Looking at the responses to Questions 5 and 6, it seems as if some students in the group have never used a computer. It seems highly unlikely that a third-level student in computer science has never used a computer. A possible explanation is that the five students were not part of the third-level computer science or information systems class but came along with friends. It is also possible that these students were not honest, a problem all questionnaire-driven design has to deal with. Fortunately the percentage of students who report they have never used a computer is low, not more than 4%.
It is noteworthy that 9.5 % have never used the World Wide Web and 17.5 % have no e-mail experience. This is improbable but not impossible since computer laboratories restrict web usage and many students in South Africa may not have e-mail or web access at home.

Chapter 7 Results and Analyses
A model for representing the motivational and cultural factors that influence mobile phone usage variety
127
Question 5: Computer skill recoded Frequency Percent Never Used 5 3.6 Low 15 10.9 Average 38 27.7 High 36 26.3 Very High 43 31.4 Question 6: Computer experience Frequency Percent None 5 3.6 Low 18 13.1 Moderately low 17 12.4 Moderately high 21 15.3 High 76 55.5 Question 7: Web skill Frequency Percent Never 13 9.5 Beginner 8 5.8 Novice 7 5.1 Competent 35 25.5 Proficient 32 23.4 Expert 41 29.9 Total 136 99.3 Question 8: E-mail experience Frequency Percent Never 24 17.5 Beginner 10 7.3 Novice 8 5.8 Competent 26 19.0 Proficient 40 29.2 Expert 28 20.4 Total 136 99.3 No Internet access (1 case in recoded as missing) 1 .7 (No e-mail access ()
Table 7.6: Technological development based on the answers to questions 5, 6, 7, 8 The averages of the response values represent an indication of the general computer skills of the
respondents as depicted in Table 7.7. It follows that all the participants are above average regarding computer skill, computer experience, web and e-mail skills.

Chapter 7 Results and Analyses
A model for representing the motivational and cultural factors that influence mobile phone usage variety
128
N Minimum Maximum Mean Std. Deviation Q5 Computer skill recoded 137 1 5 3.71 1.132
Q6 Computer experience 137 1 5 4.06 1.241 Q7 Web skill 136 1 6 4.38 1.568 Q8 E-mail experience 136 1 6 3.97 1.755
Table 7.7: Technological development based on the answers to questions 5, 6, 7 and 8 All the questions were not measured on the same scale and therefore they had to be rescaled before
doing the reliability analysis.. Questions 5 and 6 were rescaled to a 10-point scale according to the formula: Result = (Response –Minimum value)/Range * 10. For example, if the scale was from 1 to 5 and X is defined as the response to Question 6, then the
rescaled value = (X-1)/5*10. The result of the reliability analysis performed on the rescaled values is depicted in Table 7.8. The Cronbach’s Alpha of 0.931 is satisfactory since it is above the acceptable level of 0.7. It can therefore be deduced that these questions measured the same construct, i.e. technological development.
N of Items = 4 Cronbach's Alpha = .931
Item-Total Statistics
Scale Mean if Item Deleted
Scale Variance if Item Deleted
Corrected Item-Total Correlation
Cronbach's Alpha if Item Deleted
Q5 12.44 18.368 .810 .927 Q6 12.09 16.738 .909 .894 Q7 11.75 14.667 .877 .897 Q8 12.19 13.406 .848 .920
Table 7.8: Reliability analyses on recoded values of Questions 5,6,7,8 Questions 13, 14, 15, 16 and 17 were set for measuring the dimension of uncertainty avoidance. The
result of the responses to Questions 13, 14, 15, 16 and 17 is depicted in Table 7.9. Note that the data for Question 14 had to be reversed to be in line with the direction of the other questions on uncertainty avoidance.
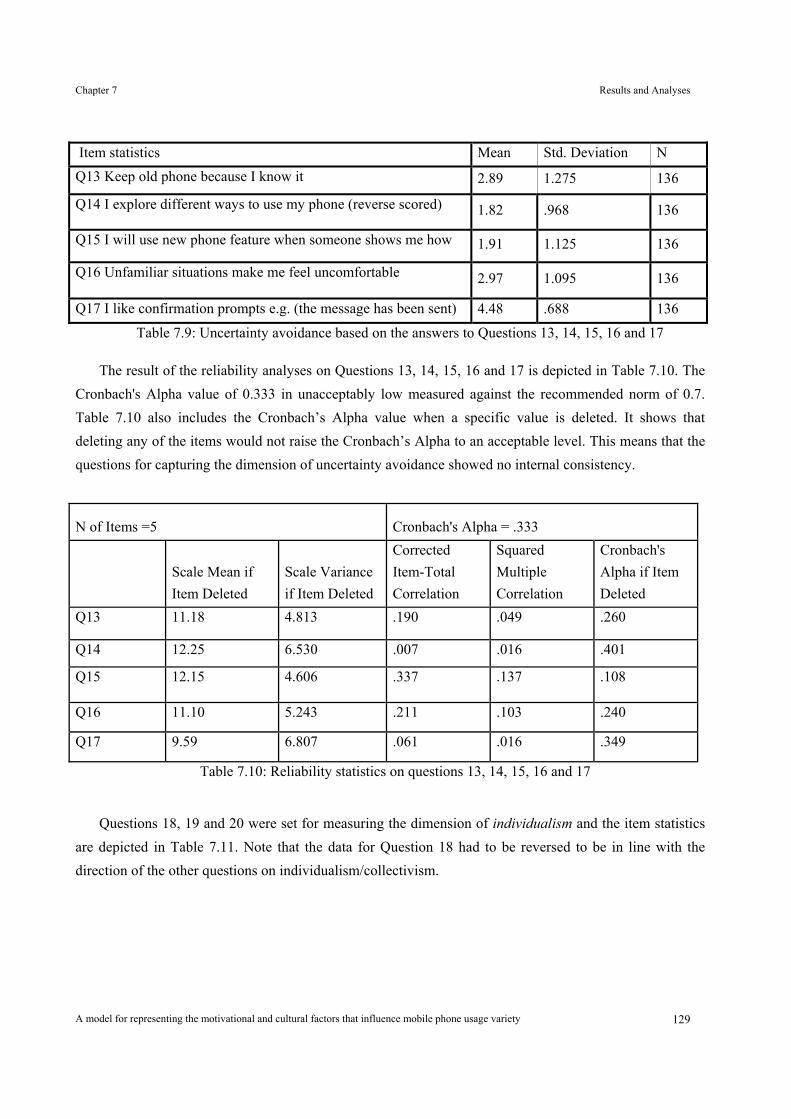
Chapter 7 Results and Analyses
A model for representing the motivational and cultural factors that influence mobile phone usage variety
129
Item statistics Mean Std. Deviation N Q13 Keep old phone because I know it 2.89 1.275 136
Q14 I explore different ways to use my phone (reverse scored) 1.82 .968 136
Q15 I will use new phone feature when someone shows me how 1.91 1.125 136
Q16 Unfamiliar situations make me feel uncomfortable 2.97 1.095 136
Q17 I like confirmation prompts e.g. (the message has been sent) 4.48 .688 136
Table 7.9: Uncertainty avoidance based on the answers to Questions 13, 14, 15, 16 and 17
The result of the reliability analyses on Questions 13, 14, 15, 16 and 17 is depicted in Table 7.10. The Cronbach's Alpha value of 0.333 in unacceptably low measured against the recommended norm of 0.7. Table 7.10 also includes the Cronbach’s Alpha value when a specific value is deleted. It shows that deleting any of the items would not raise the Cronbach’s Alpha to an acceptable level. This means that the questions for capturing the dimension of uncertainty avoidance showed no internal consistency.
N of Items =5 Cronbach's Alpha = .333
Scale Mean if Item Deleted
Scale Variance if Item Deleted
Corrected Item-Total Correlation
Squared Multiple Correlation
Cronbach's Alpha if Item Deleted
Q13 11.18 4.813 .190 .049 .260
Q14 12.25 6.530 .007 .016 .401
Q15 12.15 4.606 .337 .137 .108
Q16 11.10 5.243 .211 .103 .240
Q17 9.59 6.807 .061 .016 .349
Table 7.10: Reliability statistics on questions 13, 14, 15, 16 and 17
Questions 18, 19 and 20 were set for measuring the dimension of individualism and the item statistics
are depicted in Table 7.11. Note that the data for Question 18 had to be reversed to be in line with the direction of the other questions on individualism/collectivism.

Chapter 7 Results and Analyses
A model for representing the motivational and cultural factors that influence mobile phone usage variety
130
Item Statistics for questions Mean Std. Deviation N
Question 18 (reverse scored) 4.14 .909 137
Question 19 3.31 1.027 137 Question 20 4.30 .942 137
Table 7.11: Individualism/collectivism on Questions 18, 19 and 20 The reliability analysis and the item-total statistics when a specific value is deleted for Questions 18,
19 and 20 are depicted in Table 7.12. The Cronbach’s alpha value of 0.342 is unacceptably low and deleting any items would not change that significantly. This means that the questions for capturing the dimension of individualism/collectivism had no internal consistency.
N of items = 3 Cronbach's Alpha = .341
Scale Mean if Item Deleted
Scale Variance if Item Deleted
Corrected Item-Total Correlation
Squared Multiple Correlation
Cronbach's Alpha if Item Deleted
Q18 7.61 2.180 .216 .054 .218
Q19 8.44 1.880 .231 .059 .177 Q20 7.45 2.294 .141 .020 .360
Table 7.12: Reliability statistics on Questions 18, 19 and 20
7.5.2 Optimal scaling on responses concerning cultural dimensions
The reliability analyses presented in section 7.5.1 show that the answers to technological development showed a significant correlation (0.931), which indicates the questions are measuring the same construct. However, the correlations for uncertainty avoidance (0.333) and individualism/collectivism (0.341) were below the acceptable level of 0.7, which then means that the questions set for these dimensions are not necessarily measuring the same construct. Question 12 pertains to multi-tasking which does not relate directly to any of these dimensions.
Given the fact that no internal validity could be found for the questions that were supposed to represent cultural dimensions of uncertainty avoidance (Questions 13 to 17) and collectivism/individualism (18 to 20), an alternative approach to exploring the data was considered in order to verify this finding.
It could also be useful to include the responses to Questions 21 to 24, which provided further information on usage behaviour related to mobile phones. Unfortunately, Questions 21 to 24 were

Chapter 7 Results and Analyses
A model for representing the motivational and cultural factors that influence mobile phone usage variety
131
measured on a binary scale while the other questions were measured on a five-point ordinal scale. In order to include the binary questions 21 to 24, the method of optimal scaling was employed to reduce the dimensionality of Questions 12 to 20 to be comparable with Questions 21 to 24.
SPSS14.0 CATPCA (Principal Components Analysis for Categorical Data) was applied to the responses to each question in an attempt to group the responses that are closely related, and then to combine these responses into a single measurement. The purpose was to transform these variables to dichotomous (Yes/No) variables, based on the maximum dispersion between the objects and measures resulting from the optimal scaling of these variables.
The results of the optimal scaling of Questions 12 to 20 are depicted in Table 7.13, but the graphic result is omitted since it is impossible to conclude anything from it. The reliability of the analysis (Cronbach’s Alpha values) is less than 0.7 for each individual dimension but 0.83 on the combined data set. This implies that all the questions are consistently measuring the same construct but the measurementof the individual dimensions are not consistent.
If the data is rescaled from a five point scale to a dichotomous (2 point scale) then, based on the eigenvalues, 53% of the variance is explained by dimensions 1 and 47% by dimension 2. The data pertaining to 137 participants were used, but two of these 137 cases had missing values and were discarded. The individual plots per question are now considered.
Category plots were used to determine where the categories should be split in order to obtain an
optimal cut-off point for recoding Questions 12 to 20 to binary variables. The category plot for each question is given in Figure 7.6 up to Figure 7.14. For example, in Figure 7.6 the ‘strongly agree’ category was clearly separated from the others for Question 12. Thus it was decided to separate the responses so that those who strongly agreed were in one group, and the rest were classified into a second group as depicted in Table 7.14.
The same was done for Questions 13, 14, 15, 16 as depicted in Figure 7.7 through to Figure 7.10 where it was possible to separate the responses to each question into two groups. The results of the groupings are shown in the corresponding tables 7.15 up to 7.18.
The responses to Question 17 could not be separated into two groups as is evident from Figure 7.11. This variable was discarded, since the category plot was not logical. The responses to Questions 18, 19 and
Case Processing Summary Dimension
Cronbach’s Alpha based on the total Eigen-value
Total (Eigen-value)
Variance explained
1 (Yes) .572 2.033 53% 2 (No) .494 1.783 47% Total .830 3.816
Table 7.13: Model summary for optimal scaling of questions 12 to 20

Chapter 7 Results and Analyses
A model for representing the motivational and cultural factors that influence mobile phone usage variety
132
20 were analysed according to the same procedure to recode the responses to a dichotomous value. The results are depicted in Figures 7.12 to 7.14 and the corresponding tables 7.19 to 7.21.
Figure 7.6: Question 12: plot on preference to multi-task
Q12 Multi-tasking (binary) Frequency Percent Valid Percent Cumulative Percent
Valid Strongly no 117 85.4 86.0 86.0 Strongly yes 19 13.9 14.0 100.0 Total 136 99.3 100.0 Missing System 1 .7 Total 137 100.0
Table 7.14: Question 12 - division on preference to multi-task

Chapter 7 Results and Analyses
A model for representing the motivational and cultural factors that influence mobile phone usage variety
133
Figure 7.7: Question 13 - plot on keeping old phone (uncertainty avoidance)
Q13 Keep old phone because I know how to use it (binary Frequency Percent
Valid Percent
Cumulative Percent
Valid Strongly no 119 86.9 87.5 87.5 Strongly yes 17 12.4 12.5 100.0 Total 136 99.3 100.0 Missing System 1 .7 Total 137 100.0
Table 7.15: Question 13 - keeping old phone (uncertainty avoidance)

Chapter 7 Results and Analyses
A model for representing the motivational and cultural factors that influence mobile phone usage variety
134
Figure 7.8: Question 14 - explore different ways to use phone plot (uncertainty avoidance) Note: QQ indicates reverse scoring
Frequency Percent Valid Percent Cumulative Percent Valid Strongly no 77 56.2 56.2 56.2 Strongly yes 60 43.8 43.8 100.0 Total 137 100.0 100.0
Table 7.16: Question 14 – explore different ways to use phone (uncertainty avoidance)

Chapter 7 Results and Analyses
A model for representing the motivational and cultural factors that influence mobile phone usage variety
135
Figure 7.9: Question 15 –new feature use plot (uncertainty avoidance)
Frequency Percent ValidPercent Cumulative Percent Valid Not strongly yes 107 78.1 78.1 78.1 Strongly yes 30 21.9 21.9 100.0 Total 137 100.0 100.0
Table 7.17: Question 15 – new feature use (uncertainty avoidance)

Chapter 7 Results and Analyses
A model for representing the motivational and cultural factors that influence mobile phone usage variety
136
Figure 7.10: Question 16 – unfamiliar situations plot (uncertainty avoidance)
Frequency Percent Valid Percent Cumulative Percent Valid Not strongly
yes 89 65.0 65.0 65.0
Strongly yes 48 35.0 35.0 100.0 Total 137 100.0 100.0
Table 7.18: Question 16 – unfamiliar situations (uncertainty avoidance)

Chapter 7 Results and Analyses
A model for representing the motivational and cultural factors that influence mobile phone usage variety
137
Figure 7.11: Question 17 – Uncertainty avoidance
This variable was discarded, since it is impossible to distinguish groups of values.
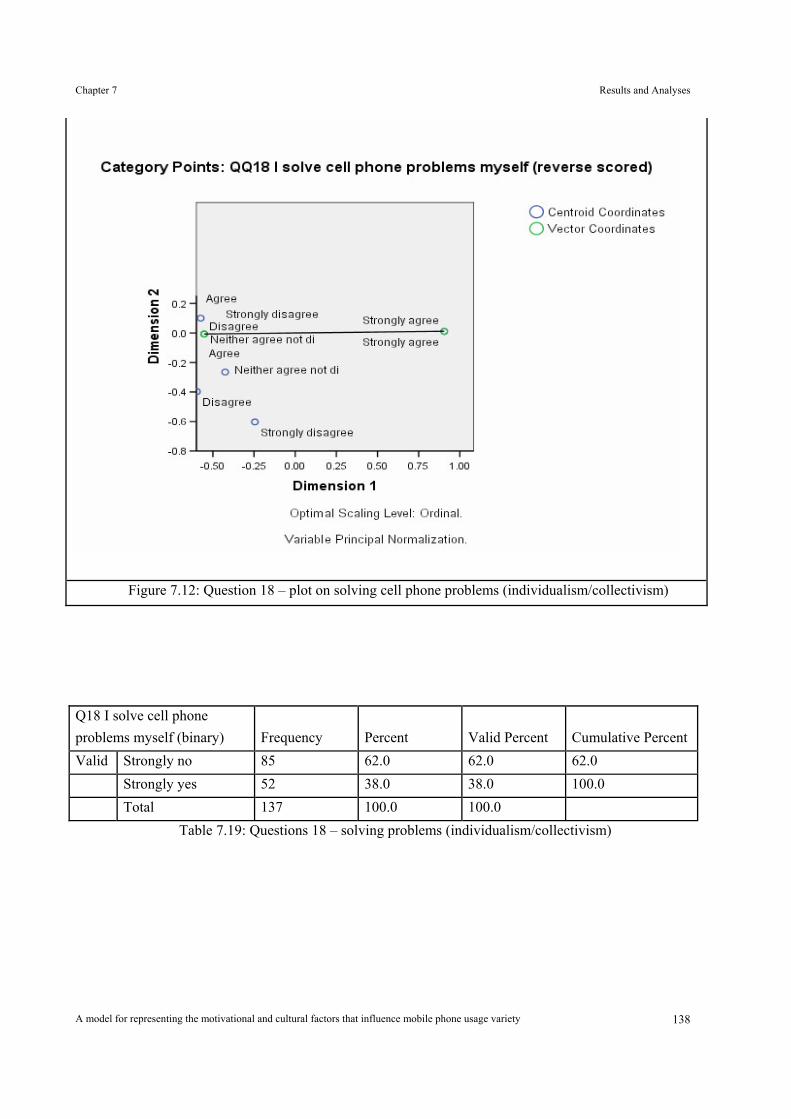
Chapter 7 Results and Analyses
A model for representing the motivational and cultural factors that influence mobile phone usage variety
138
Figure 7.12: Question 18 – plot on solving cell phone problems (individualism/collectivism)
Q18 I solve cell phone problems myself (binary) Frequency Percent Valid Percent Cumulative Percent Valid Strongly no 85 62.0 62.0 62.0 Strongly yes 52 38.0 38.0 100.0 Total 137 100.0 100.0
Table 7.19: Questions 18 – solving problems (individualism/collectivism)

Chapter 7 Results and Analyses
A model for representing the motivational and cultural factors that influence mobile phone usage variety
139
Figure 7.13: Question 19 – plot on working with family (individualism/collectivism)
Frequency Percent Valid Percent Cumulative Percent Valid Strongly no 103 75.2 75.2 75.2 Strongly yes 34 24.8 24.8 100.0 Total 137 100.0 100.0
Table 7.20: Question 19 - working with family (individualism/collectivism)
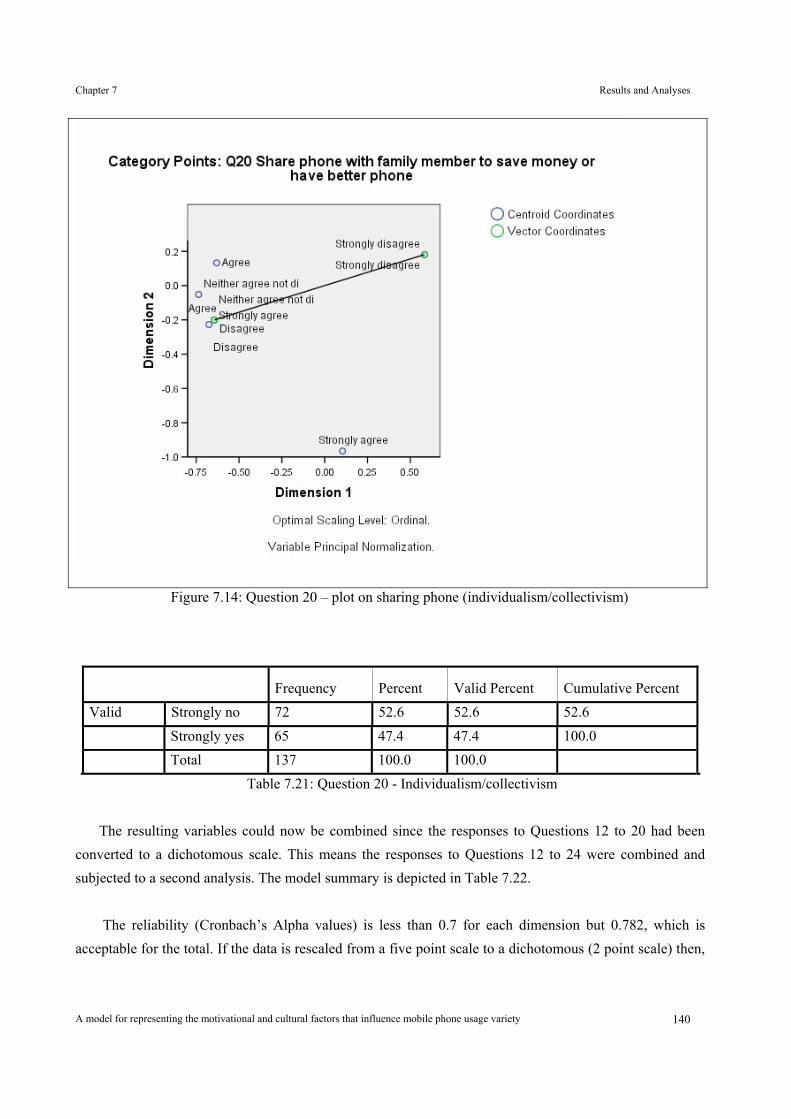
Chapter 7 Results and Analyses
A model for representing the motivational and cultural factors that influence mobile phone usage variety
140
Figure 7.14: Question 20 – plot on sharing phone (individualism/collectivism)
Frequency Percent Valid Percent Cumulative Percent Valid Strongly no 72 52.6 52.6 52.6 Strongly yes 65 47.4 47.4 100.0 Total 137 100.0 100.0
Table 7.21: Question 20 - Individualism/collectivism The resulting variables could now be combined since the responses to Questions 12 to 20 had been
converted to a dichotomous scale. This means the responses to Questions 12 to 24 were combined and subjected to a second analysis. The model summary is depicted in Table 7.22.
The reliability (Cronbach’s Alpha values) is less than 0.7 for each dimension but 0.782, which is
acceptable for the total. If the data is rescaled from a five point scale to a dichotomous (2 point scale) then,

Chapter 7 Results and Analyses
A model for representing the motivational and cultural factors that influence mobile phone usage variety
141
based on the eigenvalues, 51% of the variance is explained by dimensions 1 and 49% by dimension 2. The purpose of this second analysis was to investigate possible associations between responses to the questions.
Dimension Cronbach's Alpha based on the total Eigen-value
Total (Eigen-value)
Variance Accounted For
1 (Yes) .480 1.785 0.51 2 (No) .466 1.745 0.49 Total .782(a) 3.531
Table 7.22: Model Summary for questions 12 to 24 Figure 7.15 graphically displays the result of the second optimal scaling, illustrating a correspondence
between the responses to certain pairs of questions. Based on the inspection of the graph the responses to the following questions cluster together:
• Questions 13 and 16
• Questions 19 and 15
• Questions 14 and 18
• Questions 12 and 24
• Questions 21, 22 and 20

Chapter 7 Results and Analyses
A model for representing the motivational and cultural factors that influence mobile phone usage variety
142
Figure 7.15: Second optimal scaling result
Following this result, the responses to questions that clustered on the graph (Questions 13 and 16); (Questions 19 and 15); (Questions 14 and 18); (Questions 12 and 24) and (Questions 21, 22 and 20) were cross-tabulated and this correlation matrix was analysed. The responses that correlated significantly were grouped together into a new variable. Tables 7.19 up to 7.28 show how the variables were combined. Question 23 was omitted because only 4 persons said ‘no’. The dimensionality was therefore reduced and simplified from 13 questions to five new variables that describe various distinct aspects of behaviour and attitude towards mobile phone usage. These new variables are:
• Questions 13 and 16 - Uncertainty avoidance (Variable 1)
• Questions 15 and 19 - Independence from assistance (Variable 2)
• Questions 14 and 18 - Independence to explore and solve problems (Variable 3)
• Questions 12 and 24 - Efforts to maximise time and technology (Variable 4)
• Questions 20, 21 and 22 - Family orientation (Variable 5).

Chapter 7 Results and Analyses
A model for representing the motivational and cultural factors that influence mobile phone usage variety
143
Question 16 Uncomfortable in unfamiliar situations (binary) Total
Strongly no Strongly yes Question 13 Keep old phone because I know how to use it (binary)
Strongly no 82 37 119
Strongly yes 6 11 17
Total 88 48 136 Table 7.23: Cross-tabulation (Questions 13 and 16)
Frequency Valid Percent Valid Not strong 11 8.1 Moderate 43 31.6 Very strong 82 60.3 Total 136 100.0
Table 7.24: Comfort with unfamiliar (Questions 13 and 16)
Question 19: Like to do task with family member (binary) Total
Strongly no Strongly yes Question 15: Someone must show me new phone features (binary)
Strongly no 86 21 107
Strongly yes 17 13 30
Total 103 34 137 Table 7.25: Cross-tabulation (Questions 15 and 19)

Chapter 7 Results and Analyses
A model for representing the motivational and cultural factors that influence mobile phone usage variety
144
Frequency Valid Percent Valid Not strong 58 42.3 Moderate 46 33.6 Very strong 33 24.1 Total 137 100.0
Table 7.28: Independence to explore and solve problems (Questions 14 and 18)
V24 I use all my cell pone features Total
No Yes V12 Multi-tasking
Strongly no 16 101 117
Strongly yes 3 16 19 Total 19 117 136
Table 7.29: Cross-tabulation on time and technology(Questions 12 and 24)
Frequency Percent Valid Percent Valid Not strong 13 9.5 9.5 Moderate 38 27.7 27.7 Very strong 86 62.8 62.8 Total 137 100.0 100.0
Table 7.26:Independence from assistance (Questions 15 and 19)
Q18 I solve cell phone problems myself Total
Strongly no Strongly yes Q14 I like different ways of using phone
Strongly no 58 19 77
Strongly yes
27 33 60
Total 85 52 137 Table 7.27: Cross-tabulation (Questions 14 and 18)

Chapter 7 Results and Analyses
A model for representing the motivational and cultural factors that influence mobile phone usage variety
145
Frequency Valid Percent Valid Low 16 11.8 Moderate 104 76.5 High 16 11.8 Total 136 100.0 Missing System 1 Total 137
Table 7.30: Efforts to maximize time and technology (Questions 12 and 24)
Q21 I use the same network as my family members
Q22 I use family advice when I decide which phone to buy No Yes No Q20 Share phone with family
member Strongly no 45
16
Strongly yes 34 16 Yes Q20 Share phone with family
member Strongly no
5 6
Strongly yes 6 9 Table 7.31: Cross-tabulation on family orientation (Questions 20, 21 and 22)
Frequency Percent Valid Percent Valid Very Weak 45 32.8 32.8 Moderately Weak 55 40.1 40.1 Moderately Strong 28 20.4 20.4 Very Strong 9 6.6 6.6 Total 137 100.0 100.0
Table 7.32: Family orientation (Questions 20, 21 and 22) This analysis verified the existence of the uncertainty avoidance dimension albeit based only on
Questions 13 and 16 where Questions 13, 14, 15, 16 and 17 were originally meant to capture uncertainty avoidance.
Variables 2 and 3 represent new dimensions based on independence versus dependence in a specific area. Although this is reminiscent of the individualism/collectivism dimension, we need further evidence to equate these concepts. Variable 4 also introduces a new dimension, namely that of optimising time and

Chapter 7 Results and Analyses
A model for representing the motivational and cultural factors that influence mobile phone usage variety
146
technology, and variable 5 represents family orientation, which can be equated with individualism/collectivism.
This verifies the existence of the three cultural dimensions, together with the identification of three concepts which could be new dimensions or could possibly be subsumed under existing dimensions as discussed in Chapter 8.
7.6 PRIORITIES ON BUYING Question 29 covered priorities on buying and required participants to mark the aspects listed in Table
7.33 as totally unimportant, not important, nice to have, important and very important. A reliability test was done to investigate the internal validity of these questions, resulting in an alpha coefficient value of 0.723, which is considered satisfactory as it is above 0.7. Item 4, namely ease of use, could have been deleted from the scale, but the improvement would have been minimal. It was therefore decided to retain this item.
Cronbach's Alpha = .723 Number of Items = 11
Scale Mean if Item Deleted
Scale Variance if Item Deleted
Corrected Item-Total Correlation
Cronbach's Alpha if Item Deleted
Q29_1 Price 40.44 25.496 .350 .706 Q29_2 Technology 40.46 24.686 .489 .686 Q29_3 Number of features 40.72 24.430 .517 .681
Q29_4 Ease of Use 40.46 27.302 .154 .738 Q29_5 Battery life 39.93 27.371 .275 .715 Q29_6 Look and feel 40.35 25.327 .459 .691 Q29_7 Brand of phone 40.94 24.237 .380 .703 Q29_8 Network coverage 39.94 27.545 .274 .715 Q29_9 Network quality 39.86 27.145 .352 .707 Q29_10 Connect to computer 40.74 24.721 .398 .699
Q29_11 Camera 40.80 24.643 .460 .689 Table 7.33: Reliability analyses on question capturing priorities on buying
The items were then subjected to exploratory factor analyses (extraction method: Principal Component
Analysis, rotation method: Varimax with Kaiser Normalization). Rotation converged in 5 iterations. Table 7.34 contains the results. Three of the four factors had eigen-values above 1 and the eigen-value for the fourth factor was 0.9. These factors explain 66% of the variance. The factors identified were:

Chapter 7 Results and Analyses
A model for representing the motivational and cultural factors that influence mobile phone usage variety
147
• Technology and Features – consisting of Questions 29.2; 29.3; 29.10
• Access (network coverage and battery life) - consisting of Questions 29.5, 29.8, 29.9
• Accessibility (ease of use and price) - consisting of Questions 29.1, 29.4
• Appearance and Image - consisting of Questions 29.6, 29.7, 29.11.
This factor analysis therefore resulted in reducing the dimensions from 11 questions to 4 buying priorities that were distinct and could be used to describe some of the factors that consumers consider when they purchase mobile phones.
Component Technology Access Accessibility Image Q29_1 Price .309 .130 .768 -.097 Q29_2 Technology .779 -.033 .111 .177 Q29_3 Number of features .774 .117 -.058 .232 Q29_4 Ease of Use -.171 -.031 .796 .220 Q29_5 Battery life -.034 .602 .466 .025 Q29_6 Look and feel .130 .189 .152 .786 Q29_7 Brand of phone .291 .067 -.057 .658 Q29_8 Network coverage .040 .874 -.044 .067 Q29_9 Network quality .059 .882 .034 .138 Q29_10 Connect to computer .765 .059 -.020 .059 Q29_11 Camera .565 -.106 .135 .476
Table 7.34: Factor analysis on priorities on buying data
7.7 FEATURES The questionnaire contained 32 features for which the frequency of use was captured. Figure 7.16
gives an indication of overall feature use and inspection shows that all features are not used with the same frequency. Participants selected feature frequency use as never, less than once a month, weekly, monthly or daily. If a feature was not available on the phone it was recoded as ‘never’. This is a limitation since it is possible that the person would use the feature if it were available. The counter-argument is that participants often incorrectly marked a feature as not available, simply because they were not aware of its existence and not because it was unavailable on the specific phone.
In response to questions relating to ease of use, 97% of participants found their phone easy to use (and 3% did not). This is important since it indicates that if features were not used it is not because they did not know how to use them; there are other reasons that need to be investigated. Based on scrutiny of Figure 7.16 it can be concluded that:
• The participants in this group do not use all the features and functions on their phones.

Chapter 7 Results and Analyses
A model for representing the motivational and cultural factors that influence mobile phone usage variety
148
• Features are not all used with the same frequency.
• Mobile phones are primarily used for communication.
0% 10% 20% 30% 40% 50% 60% 70% 80% 90% 100%
E-Banking
CarKitCompatible
Currency Converter
Tri/Quad
Stopwatch
Voicerecorder
Torch
Voicedialling
FM
Internet
Videocapture
MP
Videoplayer
Bluetooth
MMS
Personalorganiser
Predictivetext
Games
Camera
Calculator
PhotoAlbum
Ringtones
Reminders
Profiles
Calendar
Calleridentity
Vibratingalert
Alarm
Checkmissedcalls
Phonebook
SMS
Daily Weekly Monthly < 1 x monthly Never N/A
Figure 7.16: Frequency of use per feature
The feature most often used is SMS. This corresponds to the results of a survey done among university students in Japan [Nurvitadhi, 2002]. The same study found that in the US, games was the most important feature, with e-mail and voice recording second [Nurvitadhi, 2002]. The fact that e-mail usage was so low could possibly be attributed to the cost since this is a major factor in South Africa and many students do not have an independent income.

Chapter 7 Results and Analyses
A model for representing the motivational and cultural factors that influence mobile phone usage variety
149
In investigating usage variety it is of interest to find out if there were secondary clusters, other than features often used and features seldom used. The exploratory factor analysis approach to identifying new groupings is discussed in section 7.7.1 and the optimal scaling approach in section 7.7.2.
7.7.1 Exploratory factor analysis for features
Exploratory factors analysis is meant to detect trends and find clusters of features that can be grouped around similar values for further investigation. The aim of this analysis was to see if features cluster together in terms of usage frequency. In order to confirm these groupings, confirmatory factor analyses, for which this sample is unfortunately too small, are needed.
The result of the exploratory factor analysis is depicted in Table 7.35 with the six factors identified presented in the columns, the factors all have eigen-values above 1.2 and explain 56% of the variance. On inspection of 7.35, the following groupings emerged:
• First component: a clustering around technology not used. This could be interpreted as supporting the unimportance of features or the clustering could be due to the fact that many phones do not have these features or cost.
• Second component: a clustering around camera, photo-album, MMS, ring tones, etc. These features could possibly present the idea of creating a personal history.
• The third grouping include features such as the phone book, caller identity, calculator, check missed calls, SMS, etc., which could be related to relationships or organisation, though calculator is difficult to explain either way.
• The fourth factor includes vibrating alert, reminders, profiles and the calendar which could suggest the need to organise.
• Inspection of the features in components five and six does not reveal any relation of these components to any specific usage.
It can be argued that the first grouping reflects new technology not available on all phones while the third grouping reflects common features, but this does not explain groupings two and four and therefore it is argued that there is something beyond availability.

Chapter 7 Results and Analyses
A model for representing the motivational and cultural factors that influence mobile phone usage variety
150
Features 1 2 3 4 5 6
Q35_3 Bluetooth .812
Q35_30 Video player .786 .328
Q35_29 Video capture .758
Q35_17 MP3 .752
Q35_12 E-mail .735
Q35_32 Voice recorder .711
Q35_2 Internet .665 .427
Q35_18 Personal organizer .641
Q35_7 Camera .630 .592
Q35_20 Photo Album .628 .627
Q35_13 E-banking .626
Q35_31 Voice dialling .508 .311
Q35_5 Calendar .492 .423
Q35_10 Currency converter .411 .385
Q35_14 FM .371 .344 .335
Q35_21 MMS .406 .660
Q35_22 Ring tones .554
Q35_25 Tri/Quad .383
Q35_19 Phone book .768
Q35_6 Caller identity .705
Q35_4 Calculator .507
Q35_9 Check missed calls .477
Q35_28 Vibrating alert .622
Q35_26 Reminders .593
Q35_24 Profiles .329 .472 .315
Q35_23 Predictive text .321 .324 .351
Q35_16 Torch .770
Q35_27 Stopwatch .664
Q35_15 Games .717
Q35_11 SMS .454 .371 -.492
Q35_1 Alarm .338 -.452
Table 7.35: Factor analysis on features

Chapter 7 Results and Analyses
A model for representing the motivational and cultural factors that influence mobile phone usage variety
151
7.7.2 Optimal scaling for feature clusters
The optimal scaling technique was applied in order to triangulate the factor analyses clusters with the findings of the optimal scaling technique. The full set of factors is depicted in Figure 7.17 and the following features are selected based on proximity (distance from the 0 point on the axis and other features).
• Group 1 (relationships/safety and security): Caller Identity; Check Missed calls; SMS; Phone Book.
Group 1 features were removed and optimal scaling was done on the remaining set of features. The result is depicted in Figure 7.18 where the following clusters were identified:
• Group 2 (voice input/output): voice dialling; voice recording
• Group 3 (micro-organisation): vibrating alert; profiles; reminders; alarm.
After removing the features from Group 2 and 3, optimal scaling was done on the remaining features. This led to the result depicted in Figure 7.19, where the following cluster was identified:
• Group 4 (personal history): camera; mp3; personal organiser; photo; video capture; video player.
After removing the features from Group 4, optimal scaling was done on the remaining features. This led to the result depicted in Figure 7.20. No further groups could be identified from this graph.
Interpreting the data on feature frequency use is hampered by two limitations. Looking at features not used, it is possible that features were not used simply because they were not available or due to cost. We also have to bear in mind that the frequency was measured on a non-interval scale, i.e. weekly is not twice as frequent as daily. Group 2 containing voice dialling and voice recording was omitted from further analysis since it could not be related to a usage space.
However, despite these limitations, two different data reduction methods, i.e. factor analyses and optimal scaling, produced similar groupings. The following usage spaces emerge from this analysis:
• Safety and security
• Relationships
• Organisation
• Personal history.

Chapter 7 Results and Analyses
A model for representing the motivational and cultural factors that influence mobile phone usage variety
152
Figure 7.17: Optimal scaling plot on full set of features
Figure 7.18: Optimal scaling plot after removal of group 1 features

Chapter 7 Results and Analyses
A model for representing the motivational and cultural factors that influence mobile phone usage variety
153
Figure 7.19: Optimal scaling plot after removal of groups 1, 2 and 3
Figure 7.20: Optimal scaling plot after removal of groups 1, 2, 3 and 4

Chapter 7 Results and Analyses
A model for representing the motivational and cultural factors that influence mobile phone usage variety
154
7.8 CORRELATION MATRICES We now have five variables extracted from the questions on users’ mobile phone behaviour, we have
the four factors extracted from the priorities on buying mobile phones questions and we have the three clusters of feature groupings according to frequency as summarised below:
Mobile phone behaviour:
• Uncertainty avoidant (Questions 13 and 16)
• Independence from assistance (Questions 15 and 19)
• Independence to explore and solve problems (Questions 14 and 18)
• Efforts to maximise time and technology (Questions 12 and 24)
• Family orientation (Questions 20, 21 and 22).
Priorities on buying:
• Technology and features - Questions 29.2; 29.3; 29.10
• Access (network coverage and battery life) - Questions 29.5, 29.8, 29.9
• Accessibility (ease of use and price) - Questions 29.1, 29.4, 29.5
• Appearance and Image -Questions 29.6, 29.7, 29.11.
Combining the results from the factor analyses and the optimal scaling on feature usage, results in the following groupings:
• Safety and security (caller identity; check missed calls; SMS; phone book)
• Relationships (caller identity; check missed calls; SMS; phone book)
• Organisation (vibrating alert; profiles; reminders; alarm)
• Personal History (camera; mp3; personal organiser; photo; video capture; video player).
The following groupings were observed from the ongoing qualitative observation of mobile phone usage. They did not emerge from the analyses but since cost and availability could mask their importance they are noted for further investigation.
• Non-personal information (Internet, e-mail).
• Commerce Orientation (e-mail; e-banking; messages).
• Non-personal information (Internet, e-mail).
• Entertainment (games, messages, mp3 player)
• Self-enhancement (currency converter, calculator, calendar). Shows some similarity with variable 4 (Efforts to maximise time and technology enhancement.
These three sets of features were correlated in a correlation matrix. A summary of significant correlations (Spearman’s coefficient for non-parametric data) is presented in Table 7.36. Most of the questions were measured on a 5-point Likert scale but the data is considered ordinal and non-parametric

Chapter 7 Results and Analyses
A model for representing the motivational and cultural factors that influence mobile phone usage variety
155
since the response of strongly agree is not exactly double the response of agree, which is what parametric data measures imply.
Table 7.36 depicts the correlations between the variables that emerged from mobile phone behaviour, priorities on buying and the feature frequency analyses discussed in this section. On inspection of Table 7.36, the findings provide definite support for the idea that feature use is related to usage spaces through the identification of correlations between groupings such as organisation, personal history, commerce orientation and selection priorities such as technology/features and self-enhancement since these correlations have been flagged as significant or highly significant. Note that uncertainty avoidance is reverse-scored and should actually be read as ‘non-uncertainty avoidance’.
Dimension Correlated dimensions Correlation Technology/ Features Independence to explore and solve problems 0.306(**) Maximise time and technology 0.236(**) Appearance and Image Independence to explore and solve problems 0.198(*) Family orientation -0.181(*) Personal Enhancement Technology/ Features 0.192(*) Organisation Technology/ Features -0.199(*) Image 0.265(**) Family orientation -0.207(*) Personal History Uncertainty avoidant (rs) 0.187(*) Independence from assistance 0.207(*) Technology/ Features 0.367(**) Self-enhancement 0.313(**) Organisation 0.462(**) Commerce Orientation Maximise time and technology 0.225(**) Technology/ Features 0.334(**) Self-enhancement 0.351(**) Organisation 0.391(**) Personal History 0.648(**) Non-uncertainty avoidant Independence from assistance 0.344(**) Maximise time and technology Independence to explore and solve problems -0.307(**) Note: * means significant at the 0.05 level and ** means significant at the 0.01 level.
Table 7.36: Summary of significant correlations
The findings also support the relationship between interpersonal influence and subjective norm since
family orientation is negatively correlated with image and organisation. The finding that collectivism (family orientation) is possibly negatively correlated with organisation is supported by Baumgartner [2003]

Chapter 7 Results and Analyses
A model for representing the motivational and cultural factors that influence mobile phone usage variety
156
who noted that scheduling is not as important in the collectivist orientation. The significant correlations between personal history, uncertainty avoidance, independence from assistance, technology/ features and organisation seem to represent the innovators as identified by Rogers Innovation diffusion model.
7.9 DISCUSSION OF THE FINDINGS As discussed in section 4.4, Geser [2004] listed usage intensity (UIN), usage breadth (UB) and usage
variety (UV) as the three dimensions along which to analyse mobile phone usage quantitatively. These dimensions were used in this study.
The responses to the question on usage breadth (Question 30) revealed that 21% of respondents had less than 51 stored numbers on their phone, 34 % had 51 to 100 stored numbers and 45% had more than 100 stored numbers. However, based on the observations in the interviews, people have difficulty in finding the exact number and these are probably guesses.
Question 37 in the survey questionnaire, on usage intensity, did not provide trustworthy data. A possible explanation is that it was the last question in the questionnaire. The questions were either not completed or completed in such a way that the data was suspect, e.g. number of calls was incredibly high. The data obtained from Question 35 on frequency of feature use was usable and analysis of this data (as discussed in section 7.7) revealed that:
• People do not use all the features and functions on their phones.
• Features are not all equally important
• Some features are prerequisites for others, which introduces the notion of a group of core features.
• Feature use clusters around user-specific needs that emerged from the factor analyses in section 7.7.1 and was confirmed by the optimal scaling method in section 7.7.2. The following usage clusters or spaces emerged from this survey:
o Safety and security
o Relationships
o Micro-organisation of activities
o Self-enhancement (Extension of variable 4 – maximising time and technology)
o Personal history.
The following spaces emerged from the ongoing qualitative observation but could not be verified by the survey.
o Entertainment
o Non-personal information (Internet, e-mail)
o Commerce orientation (e-mail; e-banking; messages).
In order to relate these findings to the research question and research sub-questions, the findings will now be discussed according to the sub-questions stated in Chapter 5.

Chapter 7 Results and Analyses
A model for representing the motivational and cultural factors that influence mobile phone usage variety
157
7.9.1 Is there a link between mobile phone usage variety and motivational needs?
The needs that have emerged from the quantitative analysis are as follows:
• Safety and security, relationships; organisation; personal history; exploration (independence to explore and solve problems), extension of potential (maximising time and technology)
The following needs emerged from the qualitative observations and informal discussions:
• Image enhancement.
• Non-personal information or commerce orientation.
All of these can be mapped to motivational needs that have been identified by either Maslow [Maslow, 1971] or the Institute of Management [The Institute for Management Excellence, 1997] and therefore these findings support the notion that there is a link between mobile phone usage variety and motivational needs.
7.9.2 What are the cultural factors that influence mobile usage variety?
The mobile phone usage behaviour of a person (mobile phone interaction) cannot be measured using person-to-person behaviour as identified in cultural dimensions and this posed a problem in trying to measure the cultural dimensions since the responses to the questions supposed to measure a specific dimension showed no internal consistency, which is necessary for reliability. However, through alternative techniques (optimal scaling), the following dimensions have been found to be important in using a mobile phone:
• Technological development
• Uncertainty avoidance
• Family orientation (collectivism vs. individualism).
The following new constructs have been identified, but as indicated they could possibly be subsumed under existing dimensions:
• Independence from assistance (could possibly be subsumed in individualism).
• Independence to explore and solve problems (could possibly relate to individualism).
• Efforts to maximise time and technology (could possibly be subsumed in time perception).
7.9.3 Does mobile phone culture conform to the cultural context of the user?
Some of the cultural dimensions listed by Hofstede [1995] and Baumgartner [2003] did emerge as listed in section 7.7.1 but when in conflict with mobile phone culture, the qualitative observations showed that mobile phone culture took precedence. This affirms the fact that mobile phone culture does not conform to the cultural context of the user.

Chapter 7 Results and Analyses
A model for representing the motivational and cultural factors that influence mobile phone usage variety
158
7.9.4 Can usage spaces represent usage variety in a way that is usable and useful to mobile phone users, designers and marketers?
It is proposed that people will find it easier to relate to usage spaces, which can be expressed in non-technical terms, than to relate to features that are technical, continuously evolving and termed differently by different manufacturers. The fact that features can be associated with usage spaces (as discussed in section 7.9) means that it is only necessary for the prospective customer or user to identify their needs (as expressed by usage spaces) and this can then be converted to the required features by the designer or marketer. This means that usage spaces can be used to represent usage variety in a way that is usable and useful to mobile phone users, designers and marketers.
7.9.5 Can Marcus’s usage spaces model be supported by empirical evidence?
From the factor analyses on the frequency of feature usage data, the usage space of relationships (as identified by Marcus [2005b] ) emerged and this was verified by the optimal scaling technique. This provides empirical support for one of the five usage spaces. The fact that only one of the six spaces has been verified could be due to experimental factors, e.g. the questionnaire design, age or experience of the participants or the analysis of the data. If the qualitative observations are taken into account then the existence of all Marcus’s usage spaces have been verified.
7.10 SUMMARY This chapter contains the results and analysis of the data captured in this initial requirements-gathering
phase, pilot study and survey. After each phase the implications for this research were discussed. The research questions were then revisited in the context of the findings of this chapter.
The primary focus of this chapter was on the quantitative findings, as the qualitative findings are used mostly to interpret and provide reasons for the quantitative findings. Nevertheless, the qualitative observations underlie the decisions on which components to include and how the components in the mobile phone technology usage model (MOPTUM) are related. MOPTUM is discussed in Chapter 8.

Chapter 8 Proposed model
A model for representing the motivational and cultural factors that influence mobile phone usage variety 159
CHAPTER 8: PROPOSED MODEL
8.1 INTRODUCTION This chapter integrates and synthesises the findings from the initial research with the results of the
ongoing literature study to propose a model for representing the motivational and cultural factors that influence mobile phone usage.
This research was built around a main research question, namely ‘What are the components of a model to represent the motivational needs and cultural factors on mobile phone usage variety? ’ and the following sub-questions:
• Is there a link between motivational needs and mobile phone usage variety?
• What are the cultural factors that influence mobile phone usage variety?
• Does mobile phone usage conform to the cultural context of the user?
• Can usage spaces represent usage variety in a way that is usable and useful to mobile phone users, designers and marketers?
• Can Marcus’s usage spaces model be supported by empirical evidence?
• Does infrastructure influence mobile phone usage
In Chapter 7 the first five of these sub-questions were reviewed in the context of the findings from the survey. The last question, concerning infrastructure, had already been answered in Chapter 5 since the literature study provided sufficient evidence that infrastructure does indeed influence mobile phone use. Nevertheless, data on infrastructure was captured, as the proposed model would be incomplete if this component were not represented. The incorporation of infrastructure as a facilitating factor in the model is discussed in section 8.3.1.
Returning to the other research sub-questions, in this chapter the main research question and first five sub-questions are discussed in the context of all the findings from this research. This includes the qualitative observations, the interviews, pilot study and the survey. In section 8.2 the first five research questions are reviewed against the findings of the empirical study and the conclusions are contrasted with findings from the ongoing literature study.
However, the main research question has not yet been answered. In order to suggest an answer to this question, the mobile phone technology usage model (MOPTUM) is proposed in section 8.3. This model was synthesised from the main findings of this research as well as the findings from literature. Section 8.4 deals with how this model differs from the other models used in the development of MOPTUM. Finally section 8.5 concludes with a summary of the chapter.

Chapter 8 Proposed Model
A model for representing the motivational and cultural factors that influence mobile phone usage variety 160
8.2 REVIEWING THE FINDINGS In this section the research sub-questions presented in Chapter 1, as revised and expanded in Chapter 5,
will be reviewed. The possibility of a link between mobile phone usage variety and motivational needs is considered in section 8.2.1. Section 8.2.2 deals with the finding on the cultural factors that influence mobile phone usage variety. In section 8.2.3 there is a discussion of whether mobile phone usage conforms to cultural contexts. In section 8.2.4 we look at the potential of usage spaces to represent usage variety in a way that is usable and useful to mobile phone users, designers and marketers. Finally the findings on providing empirical evidence for Marcus and Chen’s usage spaces model [2002b] are discussed in section 8.2.5.
8.2.1 Is there a link between mobile phone usage variety and motivational needs?
The interviews in the initial requirements gathering led to different findings for different age groups. Security was one of the most important reasons why people over the age of 30 had a mobile phone, yet people under the age of 30 did not find the security aspect important. In contrast, people under the age of 30 used mobile phones for entertainment and for storing personal information, uses that did not feature with the respondents over the age of 30.
Apart from emphasising the importance of age, this also led to the identification of distinct uses that go beyond communication. The analysis of the pilot study data showed that feature frequency usage clustered around some needs that seemed to go beyond cultural dimensions.
The best concept that could be found to describe this something was motivational user needs. These needs relate basic human needs as identified by Maslow [1954], Herzberg [1968] and The Institute of Management Excellence [1997].
Motivational human needs are clearly different from the general approach to user needs followed in HCI, where user needs are mostly context and task-related. Preece et al. [2002] argue that user needs should be deduced from an analysis of the user characteristics and capabilities, what they are trying to achieve, how they are achieving it currently, and whether they could be supported to achieve their goals differently.
Motivational human needs go much deeper than the need to complete a specific task, as they relate to the core of what the human beings are. This difference in needs could possibly be attributed to the fact that mobile phones are the ultimate personal computer. Mobile phones are physically much closer to the user than personal computers and most other computing devices, and therefore mobile phones can be seen as a constant companion mostly dedicated to one person. Personalisation comes almost automatically through using features such as the phone book, SMS, blogging or the photo album. The fact that the phone is always with the person also means that the potential for image enhancements exists.

Chapter 8 Proposed Model
A model for representing the motivational and cultural factors that influence mobile phone usage variety 161
Finding needs is hampered by at least two major problems. Firstly, many variables may potentially influence the need and secondly, user needs are individualistic, which makes it difficult to address the needs of groups and organizations [Jones and Marsden, 2005a; Qualasvirta, 2005].
Nevertheless, the findings of this research suggest that some relationship exists between mobile phone usage and motivational human needs and that this relationship warrants further investigation.
8.2.2 What are the cultural factors that influence mobile usage variety?
Regarding the cultural factors that influence mobile phone usage variety, this research has uncovered more questions than answers. After the literature survey on culture, as described in section 3.5, and the approaches to researching user culture, as described in section 6.4.2, it was decided to use cultural dimensions as a research focus. The cultural dimensions identified by Hofstede [1995] as well as the dimension of technological advancement from Baumgartner’s list [2003], were used in the initial research.
There were two main reasons for this decision. Firstly, cultural dimensions have been well researched in HCI [Ford and Gelderblom, 2003]. Despite criticism of the approach, more studies using cultural dimension have been found than for any of the other approaches noted in section 3.5.4. Secondly, using cultural dimensions allows for a quantitative research approach as well as a qualitative one. The other cultural research approaches, listed in section 3.5.4, have the following limitations for this research:
• Cultural marker models, being based on cultural dimensions too, are mainly focused on interface design while this study takes a wider view of interaction.
• Cultural behaviour models are based on the on-line behaviour of users that does not encompass mobile phone usage.
• Activity Theory does not provide for quantitative evaluation.
In addition to Activity Theory, Sun [2004] mentions Genre Theory and the British Cultural Studies as approaches to the study of cultural usability, but these studies allow for qualitative evaluation only.
Considering the results of the survey, as described in section 7.5, it was found that the questions aimed at capturing the dimensions of technological advancement showed internal consistency, but no internal consistency could be found between the groups of questions that were supposed to measure the cultural dimensions of uncertainty avoidance and individualism/collectivism. It should be noted that the cultural dimensions of power distance, male/female and time orientations were abandoned after the pilot study, due to difficulties in finding questions that produce internally consistent responses. At that stage it seemed as if the use of cultural dimensions was not practical simply because no questions could be found to measure the dimensions consistently.
In order to control whether the problem was with the analysis, the complete data set (except for technological advancement questions) was analysed with optimal scaling. Here the cultural dimensions of uncertainty avoidance and individualism/collectivism emerged (though not based on the original grouping of questions). This suggests that the original questions were not appropriate to measure the latter two

Chapter 8 Proposed Model
A model for representing the motivational and cultural factors that influence mobile phone usage variety 162
dimensions as intended. Technological advancement has been identified as a cultural dimension by Baumgartner [2003]. However, it can also be seen as a demographic variable [Venkatesh et al., 2003] and therefore it will be treated as a demographic variable for the rest of this study.
The optimal scaling procedure produced three new constructs as discussed in section 7.5. These constructs are:
• Independence to explore and solve problems (could possibly relate to individualism dimension).
• Efforts to maximise time and technology (could possibly be subsumed under time perception dimension).
A third construct emerged that could not be linked to any of Baumgartner’s (and for that matter Hofstede’s) dimensions.
• Independence from assistance, which is different from individualism but could possibly be related to self-efficacy, i.e. self-confidence, in the individual’s ability to enact a behaviour [Pedersen, 2003].
This leads to the conclusion that certain cultural dimensions are relevant for describing the mobile phone usage behaviour of a group of people.
The participants were selected to control demographic and socio-economic factors, but not for ethnic culture. It is accepted that both sides of each dimension are present in every ethnic culture, and Hofstede’s study [Hofstede, 2001] concerns the fact that there is a correlation between ethnic culture and the prevalence of one side of the culture. For example, it may be said that more German people are individualistic than collectivistic.
This means that the data could be analysed further to try to relate the cultural dimensions to ethnic culture. This was not done since many of the participants were found to be bi-cultured or multi-cultured, and the division into ethnic culture groups would result in small samples of unequal size.
According to all these findings it can be said that the existing cultural dimensions of technological advancement, uncertainty avoidance and individualism/collectivism influence mobile phone usage, while three new constructs arose from the statistical analyses. Further research is necessary to determine whether these constructs are new cultural dimensions or whether they are manifestations of existing cultural dimensions.
8.2.3 Does mobile phone usage conform to the cultural context of the user?
According to the observations made during this research, mobile phone culture does not always conform to the cultural context of the user. Mobile phones allow people to interact across space. This interaction often takes place at the expense of the people with whom they are sharing a public or private space.
The tendency to apply other rules in the mobile phone context was first observed in the initial interviews when people queried the context of the questions. For example, a question was asked on

Chapter 8 Proposed Model
A model for representing the motivational and cultural factors that influence mobile phone usage variety 163
whether time-orientation (short-term orientation versus long term-orientation), pertains to personal relationships or mobile phone usage. The participants made a short-term oriented selection when it applied to mobile phone use, even though they saw themselves as long-term oriented in general.
This notion was confirmed in the pilot study. It was found that sets of cultural dimension questions which exhibited internal validity in measuring person-to-person behaviour, when used by Ford [2005], did not exhibit internal validity when adapted to measure person-to-mobile phone behaviour in the pilot study of this research. This is supported by Strom [2005b] who argued that the identification of Hofstede’s dimensions was based on human-human interaction and therefore they are not applicable to HCI.
Nevertheless, the two cultural dimensions retained and tested for in the survey, i.e. uncertainty avoidance and individualism/collectivism did emerge from the optimal scaling analyses. It is therefore concluded that cultural dimensions are relevant to human-mobile phone interaction, but the questions to measure these dimensions have to be adapted and tested carefully. This makes sense if we consider the fact that the cultural dimensions appeal to the human component, which still remains a central part of the mobile phone usage scenario.
This leads to the conclusion that cultural dimensions are relevant to mobile phone interaction, but mobile phone interaction does not always conform to the cultural context of the user.
Nevertheless, over the two-year duration of this study a trend was observed to the effect that people’s general mobile phone behaviour became more culturally sensitive (e.g. fewer meetings were disrupted by mobile phone usage). This is supported by Ling [2005] who noted that mobile phones would merge into the background of everyday things and become less notable as their use becomes entrenched in society.
8.2.4 Can usage spaces represent usage variety in a way that is usable and useful to mobile phone users, designers and marketers?
Usage variety is represented in this thesis by usage spaces that can be seen as a subset of all the usage variety possibilities. The identification of usage spaces (namely relationships, organisation, personal history and commerce) based on the observations and data pertaining to the frequency of feature usage from the survey, suggests that there is a link between mobile phone usage spaces and mobile phone features.
It is proposed that users will find it easier to relate to usage spaces which can be expressed in non-technical terms than to relate to features which are technical, continuously evolving and termed differently by different manufacturers. This proposition is validated in section 9.3.
The fact that features can be associated with usage spaces means that if the prospective customer or user can identify their needs (as expressed by usage spaces), the usage spaces can be used to identify the necessary features. This means that usage spaces can be used as a tool to capture user needs and convert them to features required. Therefore usage spaces can be used to represent usage variety in a way that is

Chapter 8 Proposed Model
A model for representing the motivational and cultural factors that influence mobile phone usage variety 164
usable and useful to mobile phone users, designers and marketers. The qualitative evaluation in section 9.4 provides evidence about the success of this process.
However, given the many factors involved, the model should be seen as a guide only and the recommendation has to be discussed with a prospective customer.
8.2.5 Can Marcus and Chen’s usage spaces model be supported by empirical evidence?
Marcus and Chen proposed a usage space model [Marcus and Chen, 2002b], but no empirical evidence to support this model could be found in the literature study. The statistical analysis on feature usage frequency in this study identified the following usage spaces:
• Safety and security
• Relationships
• Organisation
• Personal history.
This means that one of Marcus and Chen’s usage spaces (the relationships space) could be verified statistically while entertainment, m-commerce, self-enhancement and information have been observed qualitatively.
The findings could have been influenced by the questionnaire design and the participants selected. Marcus and Chen’s model was not developed for a specific demographic profile, and given the influence of demographic, socio-economic or cultural factors, it is possible that other spaces may emerge with another group of participants.
The survey questionnaire was designed to capture general data about mobile phone use and identified the usage spaces from this data. This approach was useful in getting as many uses as possible. However, in validating Marcus and Chen’s usage spaces it would be more effective to ask questions about the specific spaces. This is done in the verification survey discussed in Chapter 9. Nevertheless, the important finding from the survey is the statistical evidence (see section 7.7) that mobile phone use does cluster around usage spaces.
8.3 PROPOSED MODEL At this point in the study knowledge from different sources has been collected. The findings include
the qualitative observations and the quantitative findings from the pilot study and the survey. These findings are now integrated with the findings from the literature study, especially the existing models for mobile phone adoption and usage, in an attempt to answer the main research question, namely:
What are the components of a model to represent the influence of motivational needs and cultural factors on mobile phone usage variety?

Chapter 8 Proposed Model
A model for representing the motivational and cultural factors that influence mobile phone usage variety 165
MEDIATING FACTORS
DETERMINING
FACTORSACTUAL
SYSTEM USE
influence differentiateMEDIATING FACTORS
MEDIATING FACTORS
DETERMINING
FACTORS
DETERMINING
FACTORSACTUAL
SYSTEM USEACTUAL
SYSTEM USE
influence differentiate
The body of knowledge gathered from this research is integrated and presented as the mobile phone technology usage model (MOPTUM). MOPTUM is based on a synthesis of TAM [Davis, 1989], UTAUT [Venkatesh et al., 2003; Venkatesh, 2005] and a mobile phone technology adoption model as proposed by Kwon and Chidambaram [2000], the results of the empirical study and other supporting literature.
MOPTUM is structured by distinguishing three components, namely the factors that mediate mobile phone usage, the factors that determine mobile phone usage and the actual system use, as illustrated in Figure 8.1:
• The mediating factors include demographic, socio-economic and personal factors.
• The determining factors include social influence, facilitating conditions, perceived ease of use, perceived usefulness and behavioural intention to use.
• Actual system use is differentiated into usage intensity, usage breadth and usage variety. Usage variety is divided into two levels of usage spaces, namely core spaces and additional spaces. The usage spaces are safety and security, relationships, organisation, personal information, non-personal information, m-commerce, entertainment, personal history, image, expansion and philanthropy.
Figure 8.1: Distinguishing components of the model Figure 8.2 depicts the components of MOPTUM as well as the relationships between the components.
All the relationships between determining factors are affected by mediating factors, except those involving facilitating conditions. The following relationships are influenced by mediating factors:
• Social influence and perceived ease of use
• Social influence and perceived usefulness
• Social influence and behavioural intention to use
• Perceived ease of use and behavioural intention to use
• Perceived usefulness and behavioural intention to use
• Behavioural intention to use and actual system use.
• Facilitating conditions and actual system use.
Each of these components will now be discussed in more detail.

Cha
pter
8
Prop
osed
Mod
el
A
mod
el fo
r rep
rese
ntin
g th
e m
otiv
atio
nal a
nd c
ultu
ral f
acto
rs th
at in
fluen
ce m
obile
pho
ne u
sage
var
iety
16
6
Figu
re 8
.2: M
obile
pho
ne te
chno
logy
usa
ge m
odel
(MO
PTU
M)
Soc
io-e
cono
mic
Fa
ctor
s (S
F)
Per
ceiv
ed E
ase
of U
se
(PEU
)
Per
ceiv
ed E
ase
of U
se
(PEU
)
Per
ceiv
ed U
sefu
lnes
s
(PU
)
Per
ceiv
ed U
sefu
lnes
s
(PU
)
Soci
al In
fluen
ce
(SI)
Soci
al In
fluen
ce
(SI)
Beha
viou
ral I
nten
tion
(BI)
Beha
viou
ral I
nten
tion
(BI)
Faci
litat
ing
Con
ditio
ns
(FC
)
Faci
litat
ing
Con
ditio
ns
(FC
)A
ctua
l Sys
tem
Use
(U)
Act
ual S
yste
m U
se
(U)
Usa
ge In
tens
ity
(UIN
)
Usa
ge In
tens
ity
(UIN
)
Usa
ge B
read
th
(UB)
Usa
ge B
read
th
(UB)
Usa
ge V
arie
ty
(UV
)
Usa
ge V
arie
ty
(UV
)
Usa
ge S
pace
s
(US
)
Usa
ge S
pace
s
(US
)
Usa
ge S
pace
s
(US
)
PF,
DF,
SF
PF, D
F, S
F
PF,
DF,
SF
PF,
DF,
SF
PF, D
F, S
F
MED
IATI
NG
FAC
TOR
S
DET
ERM
ININ
G F
ACTO
RS
PF,
DF,
SF
PF, D
F, S
F
Dem
ogra
phic
Fa
ctor
s (D
F)Pe
rson
al F
acto
rs
(PF)

Chapter 8 Proposed Model
A model for representing the motivational and cultural factors that influence mobile phone usage variety 167
8.3.1 Determining Factors
As illustrated in Figure 8.2, the following five determining factors have been identified:
• Social influence (SI): Also referred to as subjective norm (SN) in the TRA [Fishbein and Ajzen, 1975]. This encompasses the social pressure exerted on the individual by the opinions of other individuals or groups. In MOPTUM, social influence also includes the cultural influences as recommended by Urbaczewski [2002].
• Facilitating conditions (FC): Refer to the mobile phone infrastructure. This includes variables such as system service, system quality, cost of the handset and cost of the service as determined by the business model of the service provider.
• Perceived usefulness (PU): The extent to which a user believes that he or she will benefit from using the mobile phone.
• Perceived ease of use (PEU): The extent to which a user believes that using the mobile phone will be free of effort.
• Behavioural intention (BI): The intention to enact the behaviour of using the phone.
Table 8.1 contains a summary of the supporting evidence for including these determining factors.
Component Supporting evidence for inclusion
1.Social influence (SI)
Component of the TRA [Fishbein and Ajzen, 1975] but not of TAM. The need to add social norm to the TAM has been recommended by [Malhotra and Galletta, 1999; Urbaczewski et al., 2002; Pedersen, 2003; Teo and Pok, 2003b]. Component of the mobile phone technology adoption and use model by Kwon and Chidambaram [2000] and UTAUT[Venkatesh et al., 2003].
2. Facilitating conditions (FC)
TAM was developed for organisations where the infrastructure and cost did not concern the user [Pedersen, 2003]. Other studies on technology adoption and use have noted the need to recognise system factors notably security, reliability, digital standards and web connectivity [Kleijnen et al., 2004; Roberts, 2004; Meso et al., 2005] while Uzoke et al. [2006] added the importance of management factors.
3. Perceived usefulness (PU)
Component of the TAM. Importance verified in quantitative evaluations of the model (section 9.2) interviews and qualitative observations.
4. Perceived ease of use (PEU)
Component of the TAM and the model by Kwon and Chidambaram [2000] while UTAUT [Venkatesh et al., 2003] refers to effort expectancy. Verified in interviews, observations and quantitative findings of this study.
5. Behavioural intention (BI)
Component of the TAM and UTAUT.
Table 8.1: Supporting evidence for determining factors in MOPTUM

Chapter 8 Proposed Model
A model for representing the motivational and cultural factors that influence mobile phone usage variety 168
8.3.2 Mediating Factors
As illustrated in Figure 8.2, three mediating factors have been identified as influencing mobile phone usage:
• Personal factors (PF): Refers to personal preference and user’s beliefs about the benefit of technology including relative advantage, compatibility, complexity, trialability, observability, image and trust. Personal factors encompass individual beliefs (IB) which are included in the external variables (EV) component of the TAM model and explicitly noted by Barnes and Huff [2003].
• Demographic factors (DF): Variables like age, gender, education and technological development.
• Socio-economic factors (SF): Described by variables like job status, occupation and income.
Table 8.2 contains a summary of the supporting evidence for including these mediating factors in MOPTUM.
Component Supporting evidence for inclusion
Demographic Factors (DF)
DF is a component of the external variables (EV) of TAM, UTAUT and of the mobile phone technology adoption and use model by Kwon and Chidambaram [2000]. Demographic variables have been found to influence mobile phone usage [Kwon and Chidambaram, 2000; Coen et al., 2002; Kleijnen et al., 2004; Wilska, 2003]
Socio-economic factors (SF)
SF is a component of the mobile phone technology adoption and use model by Kwon and Chidambaram. Socio-economic status has been found to influence mobile phone usage in other studies [Rice and Katz, 2003].
Personal factors (PF)
Based on the observation of people’s mobile phone usage and literature references about the personal aspect of mobile phones [Terveen et al., 2002; Teo and Pok, 2003b] it was observed that people with the same demographic factors and socio-economic status vary from being innovators to being laggards on the scale of Robert’s Diffusion of Innovations model. For example, when considering two students with the same socio-economic status the one had an expensive phone with many features and a contract, while the other has a basic phone with pay as you go. This implies that personality factors also influence mobile phone usage.
Table 8.2: Supporting evidence for mediating factors in MOPTUM

Chapter 8 Proposed Model
A model for representing the motivational and cultural factors that influence mobile phone usage variety 169
8.3.3 Actual System Use
As illustrated in Figure 8.2, the actual system use component is extended to include usage variety, usage breadth and usage intensity, concepts that existing adoption models do not deal with.
• Usage variety: The different applications for which a product is used or the different situations in which a product is used, regardless of frequency, and the number of associates to whom calls are directed and from whom calls are received [Geser, 2004].
• Usage intensity: Frequency of use, i.e. how often the product is used or time duration of use [Geser, 2004].
• Usage breadth: The number of associates to whom calls are directed and from whom calls are received [Geser, 2004].
• MOPTUM model proposes the extension of usage variety to include the usage spaces depicted in Figure 8.2 and described in Table 8.3.
Table 8.3 contains a summary of the supporting evidence for including these actual system use components in MOPTUM
Component Supporting evidence for inclusion
Actual System Use (U)
Component of the TAM and the mobile phone technology adoption and use model by Kwon and Chidambaram [2000]. The latter considers extent of use (number of calls, length of calls and personal versus work-related use).
Usage variety (UV)
Not a component of any of the previous models. Necessary to quantify usage behaviour. Defined by Geser [2004].
Usage intensity (UIN)
Not a component of any of the previous models. Necessary to quantify usage behaviour. Defined by Geser [2004].
Usage breadth (UB)
Not a component of any of the previous models. Necessary to quantify usage behaviour. Defined by Geser [2004].
Usage spaces (US)
Not a component of any of the previous models. Necessary to quantify usage variety and provide terms which users, designers and marketers can all understand. Proposed by Marcus and Chen [2002b] and Ling and Yttri [1999].
Table 8.3: Supporting evidence for actual system use components in MOPTUM

Chapter 8 Proposed Model
A model for representing the motivational and cultural factors that influence mobile phone usage variety 170
8.3.4 Usage Spaces
Usage spaces are divided into two categories, as illustrated in Figure 8.3:
• Core usage spaces: Features related to these usage spaces have to be present in order to satisfy basic mobile phone user needs. If designers and service providers wish to increase mobile phone usage this is where they should focus first, not in terms of adding new features, but rather in terms of examining the current features and adapting them for specific motivational user needs.
• Additional usage spaces: We argue that all the other usage spaces identified can be classified as incentives and would influence the user’s satisfaction with the mobile phone. In MOPTUM there is no hierarchy between the additional usage spaces – they are considered to be of equal importance. The extent of satisfaction will, however, differ between individual users as values, needs and uses will differ from individual to individual. For example, some users might be satisfied with a mobile phone that only has features related to the usage spaces classified as core while the astute business traveller might only be satisfied once all, or most, of the additional usage space features have been provided.
Figure 8.3: Two categories of usage spaces
The following usage spaces have been identified as core spaces for the target group of university students under the age of 30:
• Safety and Security: making people feel safer and providing security, e.g. allowing people to call for assistance.
• Relationships: building and maintaining relationships, e.g. phoning or messaging friends.
Organisation
Philanthropy
Personal
History
Expansion
Personal
InformationImage Entertainment
Safety and
SecurityRelationships
M-commerce
Non-personal
Information
CORE USAGE SPACES
ADDITIONAL USAGE SPACES
Organisation
Philanthropy
Personal
History
Expansion
Personal
InformationImage Entertainment
Safety and
SecurityRelationships
M-commerce
Non-personal
Information
CORE USAGE SPACES
ADDITIONAL USAGE SPACES

Chapter 8 Proposed Model
A model for representing the motivational and cultural factors that influence mobile phone usage variety 171
• Personal information: storing personal information about the user on the phone.
• Organisation: micro-organisation and making arrangements on the move, e.g. co-ordinating appointments.
Table 8.4 contains a summary of the evidence to justify the inclusion of these spaces in MOPTUM.
Usage Space Name
Features associated with this usage space
Evidence for inclusion from the research results followed by supporting evidence from literature
Safety and security
Voice calls, SMS, phone book. The following were noted but found less important: MMS, speed dials, camera, video, sound recording.
Qualitative study: Yes Pilot study: 75% of participants listed it as important. Survey: This greatly overlaps with the features identified for the relationship space. Other: [Ling and Yttri, 2002; Campbell and Russo, 2003; Katz and Sugiyama, 2005; Nickerson and Isaac, 2006].
Relationships
Voice calls, SMS, MMS, caller ID, phone book, MXIT The following were found less important: video conference, voice dialling
Qualitative study: Yes Pilot study: Yes Survey: Yes, identified in frequency of feature use Other: [Ling and Yttri, 2002; Marcus and Chen, 2002b; Nurvitadhi, 2002; Nickerson and Isaac, 2006]
Personal information
Phone book, notes, call log, camera, photo collection manager
Qualitative study: Yes Pilot study: Yes Survey: Yes, identified in frequency of feature use Other: [Marcus and Chen, 2002a; Teo and Pok, 2003a; Alahatuha et al., 2005; Keshav, 2005]
Organisation
Voice calls, calendar, alarm, to-do list, notes, reminders, SMS, MMS
Qualitative study: Yes. Pilot study: Yes Survey: Yes, identified in frequency of feature use Other: [Ling and Haddon, 2001; Ling and Yttri, 2002; Katz and Sugiyama, 2005; Nickerson and Isaac, 2006]
Table 8.4: Supporting evidence for core usage spaces in MOPTUM

Chapter 8 Proposed Model
A model for representing the motivational and cultural factors that influence mobile phone usage variety 172
•
Usage Space Name
Features associated with this usage space
Evidence for inclusion from the research results followed by supporting evidence from literature
Non-personal information
Voice calls, SMS, MMS, Internet, e-mail, MXIT
Qualitative study: No Pilot study: Yes Survey: Yes, but not very important Other: [Marcus and Chen, 2002a]
Entertainment:
Games, music, television, SMS (jokes), MMS, chat rooms, camera, video, blue tooth for multi-player games
Qualitative study: Yes, for younger participants. Pilot study: Yes Survey: Yes Other: [Mohageg and Bergman, 2000; Marcus and Chen, 2002a; Nurvitadhi, 2002; Nickerson and Isaac, 2006]
M-commerce:
e-banking, SMS, Internet, e-mail Qualitative study: Yes Pilot study: No Survey: Yes (see section 7.8) Other: [Marcus and Chen, 2002a; Lee and Lu, 2003; Keshav, 2005; Nickerson and Isaac, 2006]
Expansion
Navigation, time zones, currency conversion, calculator, sound and/or video recording
Qualitative study: Yes Pilot study: Yes Survey: Yes (see section 7.8) Other: [Ling and Yttri, 1999; Smyth, 2000; Lehner et al., 2003]
Image (including self-image)
Brand of phone, form factors, latest technology or purposely old technology, ring tones, themes, wallpaper
Qualitative study: No Pilot study: No Survey: No Other: [Marcus and Chen, 2002a; Campbell and Russo, 2003; Teo and Pok, 2003b; Hansen et al., 2005; Katz and Sugiyama, 2005]
Personal history
Camera, phone book, notes, SMS, blogs, calendar, sound and/or video recording
Qualitative study: Yes Pilot study: Yes Survey: Yes (see section 7.8) Other: [Teo and Pok, 2003a; Hansen et al., 2005; Rhee et al., 2006]
Table 8.5: Supporting evidence for additional usage spaces in MOPTUM
•

Chapter 8 Proposed Model
A model for representing the motivational and cultural factors that influence mobile phone usage variety 173
The following usage spaces have been identified as additional spaces for the target group of university students under the age of 30:
• Non-personal information: Finding non-personal information on products and services, e.g. news, prices, sport results, lotto results, etc.
• Entertainment: music, jokes, playing games, or subscribing to chat rooms as entertainment. For some students this is a core space but it is classified as additional since not all students find it essential.
• M-commerce: Buying, selling and financial transactions, e.g. electronic banking, transaction notifications from the bank, or buying things.
• Expansion: The mobile phone as a tool in exploring new environments or finding new ways to do things, e.g. an aid in navigating, education or health monitoring.
• Image (including self-image): Enhancing image by the appearance, brand, model, ring tone and accessories of the mobile phone.
• Personal history: creating a personal history, e.g. taking photos, managing photo collections, mail messages and blogs to keep a record of personal events. This space may overlap with personal information to some extent but here the focus is on preservation rather than immediate use.
Table 8.5 contains a summary of the evidence to justify the inclusion of these spaces in MOPTUM.
•
8.3.5 Relationships between the components of MOPTUM
As illustrated in Figure 8.2, the demographic, socio-economic and personal factors mediate the relationships indicated between the determining factors in MOPTUM. Each of the relationships influenced by mediating factors will now be listed together with the evidence for representing this relationship.
• Social influence and perceived ease of use: Social influence may influence the way a person perceives ease of use. For example, a student may be exposed to many discussions regarding mobile phone use and regularly see his or her friends use mobile phones. This social interference may influence their perception of the ease of mobile phone use. This relationship is represented in the model by Kwon and Chidambaram [2000].
• Social influence and perceived usefulness: Social influence may influence the way a person perceives usefulness. For example, if all a person’s children want him or her to have a mobile phone for safety and security reasons, considerable pressure is exerted on that person to perceive a mobile phone as useful. This relationship is represented in the model by Kwon and Chidambaram [2000].
• Social influence and behavioural intention to use: Social influence, such as peer pressure may influence a person’s intentions to use the mobile phone without even considering other

Chapter 8 Proposed Model
A model for representing the motivational and cultural factors that influence mobile phone usage variety 174
determinants like usefulness. This relationship is represented in the UTAUT [Venkatesh et al., 2003].
• Perceived ease of use and behavioural intention to use: How easy a person finds a mobile phone to use can influence their intentions to use it. In TAM perceived ease of use is related to the behavioural intention to use via attitude but not directly.
• Perceived usefulness and behavioural intention to use: How useful a person finds a phone, can influence their intention to use it. In TAM perceived ease of use is related to the behavioural intention to use via attitude, but no directly.
• Facilitating conditions and behavioural intention to use: A person may have the intention to use a mobile phone but be deterred from doing so by infrastructural conditions such as network availability or network service. This relationship is represented in the UTAUT [Venkatesh et al., 2003].
• Behavioural intention to use and use behaviour (actual system use): The behavioural intention to perform the behaviour, i.e. use the mobile phone, is jointly determined by SI, PEU, PU and FC.
Note that these relations could not be verified quantitatively from the survey data since the survey data was used (together with all the other data captured up to the survey) to identify the determinants. This means that the determinants were not known at the time of the survey and therefore no provision was made to capture data on the relations between them. Data for the verification of these relations is captured in the verification survey and the findings are discussed in section 9.2.
8.4 COMPARING MOPTUM WITH OTHER MODELS RELATED TO MOBILE PHONE USAGE
As noted, MOPTUM is based on a synthesis of models describing technology adoption. The difference between MOPTUM and the major contributing models, notably TAM, the model for mobile phone technology adoption and UTAUT, will now be discussed.
The differences and similarities between MOPTUM and the TAM are discussed in section 8.4.1, in section 8.4.2 MOPTUM is compared to the mobile phone technology adoption and use model by Kwon and Chidambaram, section 8.4.3 deals with MOPTUM in relation to UTAUT and section 8.4.4 considers how MOPTUM is related to usage space models.
8.4.1 MOPTUM and TAM
The noteworthy differences between MOPTUM, as illustrated in Figure 8.2 and TAM, are the following:
• TAM models technology adoption while MOPTUM models mobile phone use. Use is dependent on the initial decision to adopt technology, and therefore adoption is a prerequisite for use.

Chapter 8 Proposed Model
A model for representing the motivational and cultural factors that influence mobile phone usage variety 175
• The external variables component in TAM is differentiated into demographic, socio-economic and personal factors in MOPTUM.
• TAM was developed for organisations, which means that infrastructure was provided by the organisation. The cost of using a technology, as perceived by the users, was therefore not considered a relevant variable [Malhotra and Galletta, 1999; Pedersen, 2003; Kleijnen et al., 2004]. In the mobile phone scenario, infrastructure and cost are important to the individual user and therefore this component of facilitating factors has been added.
• Social influence (or subjective norm) was not included in the TAM, though the TRA, on which it is based, did include the component. The inclusion has been advocated by Malhotra and Galletta [1999]. Venkatesh and Davis [2000] found that social influence influenced both perceived usefulness (PU) and use behaviour, but noted that social influence diminished over a three-month period as the participants became more familiar with the technology. Pedersen [2005] found weak support for including social influence in mobile phone adoption and attributed this partly to their selection of innovative participants.
• TAM did not model cultural influence but the inclusion of culture in explaining mobile Internet adoption is advocated by Urbaczewski et al. [2002]. Social influence encompasses cultural influences, and therefore cultural influence as exerted by peer culture, organisational and ethnic culture on the issue of ’what will the other person(s) think of my decision’ is represented as part of the social influence component.
8.4.2 MOPTUM and THE KWON AND CHIDAMBARAM MODEL
The application of TAM to mobile phone adoption and usage focused on extrinsic and intrinsic motivations, and found that user’s perceptions were significantly associated with their motivation to use mobile phones [Kwon and Chidambaram, 2000]. For example, perceived ease of use was found to significantly influence user’s extrinsic and intrinsic motivation to use mobile phones. The following differences between the mobile phone technology adoption and use model by Kwon and Chidambaram [2000] and MOPTUM are noted:
• Both consider demographic variables, including age, gender and nationality, for their influence on ease of use but MOPTUM also includes technological development and technological orientation. This makes these models more specific than TAM, which refers to external variables without stating the specific variables.
• According to the Kwon and Chidambaram model, the respondent’s individual characteristics of gender, income and occupation have no significant effect on their perceptions of mobile phones or the social pressure to use them. According to MOPTUM personal factors do influence mobile phone usage perceptions. The effect of nationality was not reported in either of the studies.

Chapter 8 Proposed Model
A model for representing the motivational and cultural factors that influence mobile phone usage variety 176
• The Kwon and Chidambaram model and MOPTUM both include the influence of social pressure on technology usage. The Kwon and Chidambaram model notes apprehensiveness as a factor influencing intrinsic motivations, while MOPTUM identified uncertainty avoidance.
• The mobile phone technology adoption and use model by Kwon and Chidambaram considers usage by looking at number of calls (similar to usage intensity) and length of calls, and differentiates between personal use and work-related use (differentiating into usage variety). MOPTUM also distinguished UI but does not distinguish between personal and work related use. However, the basic usage spaces remain applicable to both work and personal use and the allocation will be based on individual preference and requirements.
• The Kwon and Chidambaram model and MOPTUM explain some of the variance in mobile phone user’s perceptions, motivations and usage, but both models acknowledge that much of the variance remains unexplained.
8.4.3 MOPTUM and UTAUT
The noteworthy differences between MOPTUM and UTAUT are the following:
• UTAUT models general technology adoption and use, while MOPTUM focuses on mobile phone adoption and usage.
• UTAUT refers to performance expectancy and effort expectancy, which are not included in the MOPTUM, though effort expectancy seems related to ease of use.
• Gender, age and experience as referred to by UTAUT are included under demographic factors in the MOPTUM, while personal factors and socio-economic factors are added as mediating factors.
• MOPTUM considers only personal use and therefore volitional use, as identified in UTAUT, is not relevant in MOPTUM.
8.4.4 MOPTUM and usage space models
Marcus and Chen’s usage space model [Marcus and Chen, 2002a; Marcus, 2005b] is the basis for the MOPTUM model’s refinement of usage spaces. Marcus and Chen’s model [2005b] proposed six usage spaces, namely relationships, information, commerce, entertainment, self-enhancement and the identity space that lie at the core of the intersection of the other spaces as described in Chapter 4, section 4.6.
MOPTUM provides quantitative support for the existence of the relationships space. However, based on the interviews and qualitative observations of mobile phone usage, all Marcus and Chen’s dimensions can be supported, i.e. people use mobile phones for all these spaces.
An important difference between MOPTUM and Marcus and Chen’s model is that MOPTUM has the goal of linking mobile phone features to usage spaces. This means that the spaces are distinguished as

Chapter 8 Proposed Model
A model for representing the motivational and cultural factors that influence mobile phone usage variety 177
separate entities even though they may overlap, as the same feature may be used in two or more spaces. For example, SMS may be used for relationship building as well as organisation.
Looking at the findings regarding features, the analysis of the survey data as discussed in section 7.7 provides evidence that features cluster around user-specific uses. While some of these uses correspond to the usage spaces proposed by Marcus and Chen [2005b], i.e. relationships, information, m-commerce and self-enhancement, others like security, micro and hyper-organisation correspond to the usage spaces proposed by Ling and Yttri [2002].
The dimensions which emerged from the feature frequency also show similarities with the basic human needs levels proposed by Maslow [1954] and the Institute of Management Excellence [2006]. The fact that some features were used by almost all users while other features were only used by some users, suggests the existence of a set of core usage spaces and additional usage spaces which may not be used by all people.
Herzberg’s distinction between hygiene and motivational needs supports the idea of a set of core needs [Herzberg, 1968]. Kano’s model [Kano, 1984; Parker, 2006] identifies levels of importance attributed to product features, as discussed in section 4.4.3, and supports the idea of feature grouping according to user needs. Kano’s model distinguishes between basic needs, performance needs and excitement needs. The basic needs are the features that customers generally expect of a product or service, while at the other side of the spectrum, the excitement needs refer to the features that will excite or delight the customers. The categories in Kano’s model range progressively from the minimum requirements which will cause dissatisfaction if not met - the 'must be' factors, the 'more is better' - to the 'surprise and delight' factors which distinguish the product [Kano, 1996].
MOPTUM identifies only two groups and therefore the core group includes the dissatisfiers and the must haves while the additional group includes the more is better and the surprise and delight factors.
Given the demographic profile of the participants in the survey, i.e. university students in South Africa under the age of 30, the core uses were safety and security, relationships, organisation and personal information. The distinction between core usage spaces and the rest will have to be adapted according to the demographic, socio-economic and personal factors of the user. For example, a teenager in Sweden may have relationships, entertainment and personal history as core groups.
8.5 SUMMARY In this chapter the findings of the research have been considered in relation to the research questions
presented in Chapter 5. Regarding the research questions, the following has been found:
• The usage spaces identified show similarities with models of basic motivational needs and lead to the notion that mobile usage spaces may be influenced by motivational human needs, i.e. there seems to be a link between motivational human needs and mobile phone usage variety
• The cultural factors of uncertainty avoidance and individualism/collectivism influence mobile phone usage. Technological advancement was also found to influence mobile phone usage but will

Chapter 8 Proposed Model
A model for representing the motivational and cultural factors that influence mobile phone usage variety 178
be regarded as a demographic factor for the rest of the research. Independence to explore, independence from assistance and efforts to maximise time and technology were identified as constructs that should be investigated further to find whether they are new dimensions or manifestations of existing dimensions.
• Mobile phone usage does not always conform to the cultural context of the user.
• Usage spaces can be used to represent usage variety but the usefulness of this idea can only be determined by the evaluation of the MOPTUM.
• One of Marcus and Chen’s usage spaces have been verified qualitatively by the findings of this research, which leads to the conclusion that Marcus and Chen’s usage spaces can be verified empirically.
The findings are then integrated to propose a mobile phone technology usage model (MOPTUM), which is based on the TAM, the mobile phone technology adoption and use model by Kwon and Chidambaram, UTAUT and usage space models. The newly proposed mobile phone usage model was described and the inclusion of each component was motivated.
The components of the MOPTUM are structured into determinant factors and mediating factors. This structure has been used in UTAUT, but the selecting of determinants and mediating factors and their composition is new. MOPTUM combines the demographic, socio-economic and infrastructural components from these different models to form the group of mediating factors. Mediating factors influence the relationships between determinants. The determinants consist of the social influence, perceived ease of use, perceived usefulness and behavioural intention components.
As noted, MOPTUM integrates and synthesises concepts from three technology adoption models, but the main contribution of MOPTUM is to extend and refine the actual use component to include usage frequency, usage breadth and usage variety, and then to extend usage variety further into usage spaces.
In order to be useful, the MOPTUM model will have to balance being generic and sufficiently advanced to survive the fast-paced and volatile nature of mobile telephony, with being specific enough to provide useful guidance. If this can be achieved, the model for understanding the factors that influence mobile phone use will be useful to mobile users, marketers and the designers of mobile phones. The evaluation of the model is described in Chapter 9.

Chapter 8 Proposed Model
A model for representing the motivational and cultural factors that influence mobile phone usage variety 179
CHAPTER 9: EVALUATION OF THE MODEL
9.1 INTRODUCTION The MOPTUM model is based on the knowledge and insight gained by triangulating between the
qualitative observations made during the two-year duration of the study, the quantitative findings and the continued literature survey. The aim of this chapter is to describe the evaluation process of the MOPTUM model proposed in Chapter 8 and to discuss the findings of the evaluation.
MOPTUM was evaluated in different ways. This evaluation consisted of the verification of the model, the validation of the model, the evaluation of the model against criteria set for modeling and finally the evaluation of the usefulness of the model as follows.
• Verification, poses the question: Are we building the product right? [Boehm, 1984]. This involves sets of activities that ensure that a model correctly represents specific concepts. For MOPTUM this means testing that the components are measured consistently and are related as presented in the model. This was done by administering a specially designed survey to capture responses about the concepts in MOPTUM and this data was then analysed statistically. The verification is discussed in section 9.2.
• Validation: Are we building the right product? [Boehm, 1984]. This involves sets of activities that ensure that the model that is proposed is traceable to the model requirements. Validation succeeds when a model functions in a manner that is reasonable to expect it will, i.e. does it model what it is supposed to model? This validation discussed in section 9.3.
• The evaluation of MOPTUM against the modelling criteria set by Olivier [2004] is discussed in section 9.4.
• Usefulness (utility): Is the model able to produce results? This means determining its fitness for a particular use. In this study it meant evaluating the usefulness of MOPTUM in converting user needs expressed in terms of usage spaces to mobile phone features required. This usefulness evaluation is discussed in section 9.5.
9.2 VERIFICATION The participants in the verification survey were 59 university students from Monash (South Africa)
University where the pilot study was conducted the previous year. The questionnaire used in the verification survey is available as Appendix 5.
Table 9.1 shows how the questions in the questionnaire are related to the components in the MOPTUM model. Socio-economic data was not captured since the participants were selected to be of similar job

Chapter 9 Evaluation of the model
A model for representing the motivational and cultural factors that influence mobile phone usage variety 180
status and income. Demographic data including age, gender, mother tongue and technological advancement were captured, whilst technological orientation was the only personal factor captured.
Dimension Abbreviation Question number(s)
Demographic factors DF 1-7,
Personal factors PF 8
Social influence SI 9-37
Facilitating conditions (Infrastructure) FC 52
Perceived usability PU 41; 42; 43
Perceived ease of use PEU 38; 39; 40
Attitude A 44; 45; 46
Behavioural intention BI 49
Usage intensity UIN 47
Usage breadth UB 48
Usage variety UV 9-37
Usage space order US 50
Association of features with usage spaces US 51
Table 9.1: Relating the questions in the questionnaire to some of the components in MOPTUM
Social influence data were captured by questions on mobile phone usage that related to both
motivational human needs and usage spaces. For example, the question: ‘I use my cell phone for managing my social life’ relates to the usage space of relationships that is based on the need for a sense of belonging. The usage spaces identified in section 8.3.4 are based on motivational human needs as depicted in Table 9.2.
Three questions were set for each of the concepts: perceived ease of use (PEU), perceived usefulness (PU) and attitude (A). The attitude component forms part of TAM, but is not included in MOPTUM (or in UTAUT). This set of questions on attitude (A) is aimed at determining whether the exclusion of the attitude component from MOPTUM was a valid decision. The question on behavioural intention is aimed at discerning the importance attributed to each usage space. In an organisational environment it makes sense to ask people if they intend to use a specific technology, but since all the participants had already made the choice to buy a mobile phone it is assumed that they intend to use the phone. What is not obvious is what they intend to use the phone for and thus Question 49 captures the importance they attribute to each usage space.
Actual use (U) is captured by usage intensity (UIN), usage breadth (UB) and usage variety (UV). As noted, the usage spaces are based on motivational human needs and therefore SI (Social Influence) and UV (Usage Variety) are captured by the same questions. Question 50 captures the order of importance attributed to usage spaces in order to triangulate the results with those from Question 49, which also

Chapter 9 Evaluation of the model
A model for representing the motivational and cultural factors that influence mobile phone usage variety 181
measures the importance of usage spaces. Question 51 captures data on the features associated with each usage spaces.
Table 9.2 shows how Questions 9 to 37 are related to the usage spaces. At least two questions were set for each usage space and the order of these questions was randomized according to questionnaire design procedure (as described in Appendix 1).
User needs have been discussed in Chapter 3 and usage spaces in Chapter 4. The usage spaces identified are all based on motivational needs. In order to verify that motivational needs are relevant to mobile phone usage, the questionnaire has questions on mobile phone usage spaces (Questions 9 to 37) and questions on the importance of each usage space (Questions 49 and 50). The responses to these questions were analysed to seek correlations between motivational human needs and mobile phone usage as discussed in section 9.2.3.1. The needs that could be associated with each usage space are also indicated in Table 9.2.
Usage Space Motivational Needs
Question
10. I use my cell phone for safety e.g. calling emergency services when in need.
16. Having my cell phone with me provides a sense of security.
1. Safety and security
Safety and security
31. I use my cell phone to contact friends/family members when I am worried about their safety.
11. I use my cell phone to maintain social relations (e.g. call or send messages) to friends.
18. I use my cell phone for managing my social life.
2. Relationships
Sense of belonging, Community, Acceptance 32. I use my cell phone to keep in touch with my family.
17. I use cell phones for organisation such as determining the time and place of a meeting.
24. My cell phone is useful in organising day-to-day activities.
3. Organisation
Cognitive, Expansion
26. I use a cell phone to organize appointments and synchronise events.
9. I use my cell phone for personal information management i.e. phone numbers, birthdays, etc.
4. Information Personal
Security, Cognitive, Expression 13. I use my cell phone to find or process information.
13. I use my cell phone to find or process information.
20. I use my cell phone for finding non-personal information i.e. getting prices, reservations or lotto results
5. Information Non- Personal
Cognitive, Exchange
33. I use my cell phone for sharing information with others and receiving information in return.

Chapter 9 Evaluation of the model
A model for representing the motivational and cultural factors that influence mobile phone usage variety 182
Usage Space Motivational Needs
Question
19. I used my cell phone for buying, selling or making reservations. 6. M-commerce Exchange
29. I use my cell phone for e-banking or other financial transactions.
12. I use my cell phone for improving my self-esteem, i.e. the brand, model, appearance, etc., affect the way I feel about myself.
14. My cell phone tells something about my image.
15. The phone I choose and the way I use it is a way of showing who I am.
7. Self-image
Esteem, Expression Acceptance
23. My cell phone is useful in improving my self-image, i.e. having a funky or cool phone makes me feel good.
8. Entertainment Cognitive 21. I use a cell phone for entertainment when I am travelling or waiting for someone.
27. I use my cell phone for entertainment e.g. listening to music or playing games, etc.
30. Apart from organizing events, I do not think of a cell phone as entertainment.
34. Using my cell phone to call, send messages and connect to MX-IT is part of my entertainment.
22. I collect photos, letters, notes and other memorabilia on my cell phone.
28. I use my cell phone to keep a personal history, i.e. save messages and photos.
9. Personal history
Expressions, Esteem
36. I find the call log on my mobile phone account useful as a record of my personal calls.
25. I use my cell phone as a tool to explore my environment.
35. My cell phone allows me to expand my boundaries of contacts, activities and possibilities.
10. Expansion
Expansion, Adventure
37. I use my cell phone for finding directions when I have to go to a place I have not been before.
Table 9.2: Relating questions 9 to 37 to usage spaces
9.2.1 Demographic profile of the participants
The participants in the verification of the model survey were selected to be as similar as possible to the participants in the survey. The following demographic variables were measured to confirm this selection:

Chapter 9 Evaluation of the model
A model for representing the motivational and cultural factors that influence mobile phone usage variety 183
age, gender, language (mother tongue), technological advancement and technological orientation (questions 1-8) and behavioural factors influencing mobile use adoption (questions 9 to 37).
The participants in the validation survey were undergraduate university students, 39 (66%) of whom were male, 16 (27%) female, while 4 (7%) did not indicate their gender.
Considering age, 95% of the participants were between 18 and 30 years of age. The remaining 5% were under the age of 35, with a mean age of 23. The ages in the survey ranged from 17 to 27 with a mean age of 21. The students in the validation questionnaire were thus slightly older on average than those for the survey.
The language distribution in Figure 9.1 depicts the participant’s mother tongue. The ethnic distribution (based on mother tongue) indicates that Setswana (48%) and English (29%) are the biggest groups, while distribution in the survey was the largest for Afrikaans (36%) and English (24%). Quite a large number of participants (12%) selected other as mother tongue. The reason could be that their mother tongue was not among the 20 languages listed, since Monash (South-Africa) has students from many African countries, such as Zambia, Zimbabwe and Botswana. The languages mentioned under ‘other’ were Shona, Lunda and Nyanja.
12%2%
48%4%
4%
29%
OtherSiswatiSetswanaIsiZuluIsiXhosaEnglish
Language
Figure 9.1: Language distribution according to mother-tongue
The average of the combined score for questions five, six and seven that make up the technological
advancement measurement was 4.45 (table not shown here). This means that the participants were all above the middle value of 3 on the 5-point scale. Table 9.3, depicts the Cronbach’s Alpha on the dimension of technological advancement and shows that the questions capturing technological advancement had internal consistency.

Chapter 9 Evaluation of the model
A model for representing the motivational and cultural factors that influence mobile phone usage variety 184
Cronbach's Alpha = .834 N of Items= 3
Scale Mean if Item Deleted Scale Variance if Item Deleted
Corrected Item-Total Correlation
Cronbach's Alpha if Item Deleted
Computer skills 9.37 1.410 .652 .846
Web skills 8.68 1.808 .789 .714
E-mail skills 8.76 1.667 .698 .767
Table 9.3: Reliability of technological advancement responses
These results and findings verify that the participants in the study fitted the requirements set for the purposive sampling, namely university students under the age of thirty (except for the five percent between 30 and 35) who are technologically advanced.
9.2.2 The Influence of infrastructure and cost
Question 52 captured the importance the participants attribute to infrastructure and cost. Table 9.4 contains descriptive statistics split by gender for all factors. The mean is above 3 (which is the middle value in the 5-point scale), which shows that both genders find all these factors important.
Gender N Mean Std. Deviation SE Mean
Male 38 3.8947 .92384 .14987 System service Female 14 3.9286 1.32806 .35494
Male 38 3.9474 .95712 .15526 Cost of service Female 15 3.8000 1.20712 .31168
Male 38 4.1579 .94515 .15332 Cost of phone Female 15 4.2000 .86189 .22254
Male 37 4.5946 .89627 .14735 System quality Female 15 4.5333 1.06010 .27372
Table 9.4: Group statistics for t-test on infrastructural variables
The results of the one sample t-test, depicted in Table 9.5, show that the difference is significant (p<0.05) and therefore it can be concluded that the participants all find the infrastructural variables of system service, cost of service, cost of phone and system quality important. This justifies the inclusion of the facilitating conditions (FC) component in the MOPTUM.

Chapter 9 Evaluation of the model
A model for representing the motivational and cultural factors that influence mobile phone usage variety 185
One-Sample Test T-test Test Value = 3 t
df
p : Sig. (2-tailed)
Mean Difference
95% Confidence Interval of the Difference
Lower Upper
System service 6.543 55 .000 .89286 .6194 1.1663
Cost of service 7.163 56 .000 .96491 .6950 1.2348
Cost of phone 10.142 56 .000 1.21053 .9714 1.4496
System quality 13.068 55 .000 1.58929 1.3456 1.8330
Table 9.5: One-sample t-test on infrastructure variables
9.2.3 Relating the findings to the model
The reliability analysis of all 29 of the usage variety questions (9 to 37) combined gives a significant Cronbach’s Alpha value of 0.842. This means that these questions have internal consistency in measuring social influence (SI) and usage variety (UV), which are both related to motivational needs in MOPTUM. However, when the questions were grouped according to usage spaces and tested for internal consistency, the values were below 0.7. This could be due to the wording of the questions or the relatively small number of participants.
The fact that internal validity could not be demonstrated for the individual factors (dimensions) means that the questions could not be grouped to represent specific dimensions as planned. However, the responses to each question could still be investigated. The next section describes correlations between needs and usage spaces in an attempt to see if the questions on usage spaces can be correlated with those on behavioural intention to use.
9.2.3.1 Correlations between needs and usage spaces
The responses to questions designed to measure a specific need were correlated with the importance attributed to the specific usage space and the results are all depicted in Table 9.6. The significant values at 0.05 level are indicated with a * and those at 0.01 with a **.
Kendall's coefficient was used since it is appropriate for a small data set with a large number of tied ranks [Field, 2005]. Note that N denotes the number of responses, there were 59 participants in total but N varies according to the number of missing responses.

Chapter 9 Evaluation of the model
A model for representing the motivational and cultural factors that influence mobile phone usage variety 186
Safety and security (SS) Q10 Q16 Q31 Q49_SS
Correlation Coefficient 1.000 Q10 Sig. (2-tailed)
Correlation Coefficient .231(*) 1.000 Q16 Sig. (2-tailed) .044
Correlation Coefficient .267(*) .091 1.000 Q31 Sig. (2-tailed) .022 .436
Correlation Coefficient .129 .319(**) .258(*) 1.000
Sig. (2-tailed) .261 .006 .029
Q49_SS N 58 57 58 58
Relationships (Rel) Q11 Q18 V32 Q49_Rel
Correlation Coefficient 1.000 Q11 Sig. (2-tailed) .
Correlation Coefficient .366(**) 1.000 Q18 Sig. (2-tailed) .003 .
Correlation Coefficient .378(**) .114 1.000 V32 Sig. (2-tailed) .004 .346 .
Correlation Coefficient .168 .231 .238 1.000
Sig. (2-tailed) .183 .050 .060 .
Q49_Rel N 59 58 59 59
Organisation (Org) Q17 Q24 O26 Q49_Org
Correlation Coefficient 1.000 Q17 Sig. (2-tailed) .
Correlation Coefficient .331(**) 1.000 Q24 Sig. (2-tailed) .004 .
Correlation Coefficient .319(**) .487(**) 1.000 O26 Sig. (2-tailed) .005 .000
Correlation Coefficient .319(**) .323(**) .363(**) 1.000
Sig. (2-tailed) .006 .004 .001 .
Q49_Org
N 57 57 58 58

Chapter 9 Evaluation of the model
A model for representing the motivational and cultural factors that influence mobile phone usage variety 187
Information (PInfo, NInfo) Q9 Q13 Q20 Q33 Q49_ PInfo
Q49_ NInfo
Correlation Coefficient 1.000 Q9 Sig. (2-tailed) .
Correlation Coefficient .337(**) 1.000 Q13 Sig. (2-tailed) .003 .
Correlation Coefficient .216 .162 1.000 Q20 Sig. (2-tailed) .062 .139 .
Correlation Coefficient -.070 .176 -.224 1.000 Q33 Sig. (2-tailed) .570 .132 .059 .
Correlation Coefficient .035 -.068 .179 -.016 1.000 Q49_ PInfo Sig. (2-tailed) .772 .560 .129 .897 .
Correlation Coefficient .042 .165 .355(**) .036 .314(**) 1.000
Sig. (2-tailed) .715 .135 .002 .760 .007 .
Q49_ NInfo N 58 57 57 58 57 58
M-commerce (MCom) Q19 Q29 Q49_MCom
Correlation Coefficient 1.000
Sig. (2-tailed) .
Q19
N 58
Correlation Coefficient .251(*) 1.000
Sig. (2-tailed) .020 .
Q29
N 58 59
Correlation Coefficient .048 .342(**) 1.000
Sig. (2-tailed) .666 .002 .
Q49_ MCom N 57 58 58

Chapter 9 Evaluation of the model
A model for representing the motivational and cultural factors that influence mobile phone usage variety 188
Image and Fashion (IF) Q12 Q14 Q15 Q23 Q49_IF
Correlation Coefficient 1.000 Q12 Sig. (2-tailed) .
Correlation Coefficient .516(**) 1.000 Q14 Sig. (2-tailed) .000 .
Correlation Coefficient .364(**) .527(**) 1.000 Q15 Sig. (2-tailed) .001 .000 .
Correlation Coefficient .452(**) .559(**) .573(**) 1.000 Q23 Sig. (2-tailed) .000 .000 .000 .
Correlation Coefficient .495(**) .521(**) .497(**) .627(**) 1.000
Sig. (2-tailed) .000 .000 .000 .000 .
Q49_IF
N 57 57 57 57 58
Entertainment (Ent) Q21 Q27 Q30 Q34 Q49_Ent
Correlation Coefficient 1.000 Q21 Sig. (2-tailed) .
Correlation Coefficient .590(**) 1.000 Q27 Sig. (2-tailed) .000 .
Correlation Coefficient .206 .303(**) 1.000 Q30 Sig. (2-tailed) .068 .007 .
Correlation Coefficient .083 .016 .127 1.000 Q34 Sig. (2-tailed) .464 .889 .249 .
Correlation Coefficient .289(*) .528(**) .263(*) -.055 1.000
Sig. (2-tailed) .013 .000 .020 .628 .
Q49_Ent
N 56 58 58 58 58

Chapter 9 Evaluation of the model
A model for representing the motivational and cultural factors that influence mobile phone usage variety 189
Expansion (Exp) Q25 Q35 Q37 Q49_Exp
Correlation Coefficient 1.000 Q25
Sig. (2-tailed) .
Correlation Coefficient .063 1.000 Q35
Sig. (2-tailed) .589 .
Correlation Coefficient .204 .045 1.000 Q37
Sig. (2-tailed) .067 .686 .
Correlation Coefficient .346(**) .019 .353(**) 1.000
Sig. (2-tailed) .002 .866 .001 .
Q49_Exp
N 57 58 58 58
Personal History (PHist) Q22 Q28 Q36 Q49_ PHist
Correlation Coefficient 1.000 Q22
Sig. (2-tailed) .
Correlation Coefficient .212 1.000 Q28
Sig. (2-tailed) .065 .
Correlation Coefficient .092 .119 1.000 Q36
Sig. (2-tailed) .406 .308 .
Correlation Coefficient .483(**) .369(**) -.100 1.000
Sig. (2-tailed) .000 .002 .380 .
Q49_PHist
N 56 58 58 58
Table 9.6: Correlations between individual questions and the importance attributed to the usage space
The usage spaces of safety and security, relationships, personal information, non-personal information,
m-commerce, image, entertainment, expansion and personal history have been analysed here. For all these usage spaces there is a significant positive correlation between the usage space and the responses to at least one of the questions capturing the need. This implies that there is a correlation between the persons’ behaviour regarding the usage space and the importance they attach to the usage space. Furthermore this implies that mobile phone usage behaviour (represented by the usage space) could be influenced by motivational human needs.

Chapter 9 Evaluation of the model
A model for representing the motivational and cultural factors that influence mobile phone usage variety 190
9.2.3.2 Correlations between the components of the model
In order to verify the structure of the model, one needs to calculate the correlations between the components. However, before this can be done it is necessary to check that each component is measured consistently. This is done by calculating the Cronbach’s Alpha measure of reliability. The Cronbach’s Alpha on the dimensions of perceived ease of use (PEU) as depicted in Table 9.7, perceived usefulness (PU) as depicted in Table 9.8 and attitude as depicted in Table 9.9 (A), provide evidence that the groups of questions, meant to measure certain dimensions, have internal consistency (since all the values were above 0.7).
Perceived Ease of Use (PEU) Cronbach's Alpha = 0.803
N of Items = 3
Scale Mean if Item Deleted
Scale Variance if Item Deleted
Corrected Item-Total Correlation
Cronbach's Alpha if Item Deleted
Q38 8.64 1.919 .685 .704
Q39 8.57 1.758 .722 .656
Q40 9.10 1.708 .566 .839
Table 9.7 : Reliability of perceived ease of use (PEU) questions
Perceived Usefulness (PU) Cronbach's Alpha = 0.735
N of Items = 3
Scale Mean if Item Deleted
Scale Variance if Item Deleted
Corrected Item-Total Correlation
Cronbach's Alpha if Item Deleted
Q41 7.08 4.182 .426 .790
Q42 7.56 2.699 .689 .481
Q43 7.42 2.490 .613 .593
Table 9.8: Reliability of perceived usefulness (PU) questions
Attitude (A) Cronbach's Alpha = 0.711
N of Items = 3
Scale Mean if Item Deleted
Scale Variance if Item Deleted
Corrected Item-Total Correlation
Cronbach's Alpha if Item Deleted
Q44_Wise 3.46 2.181 .591 .576
Q45_Harmful 3.36 1.906 .427 .772
Q46_Good 3.50 1.782 .610 .517
Table 9.9: Reliability of attitude (A) questions

Chapter 9 Evaluation of the model
A model for representing the motivational and cultural factors that influence mobile phone usage variety 191
Facilitating conditions (FC) Cronbach's Alpha = 0.633
N of Items = 3
Scale Mean if Item Deleted
Scale Variance if Item Deleted
Corrected Item-Total Correlation
Squared Multiple Correlation
Cronbach's Alpha if Item Deleted
SystemQuality 12.0727 5.069 .329 .164 .620
CostPhone 12.4364 5.065 .330 .216 .619
SystemService 12.7636 4.554 .375 .190 .593
CostService 12.6909 3.662 .639 .414 .377
Table 9.10: Reliability of facilitating conditions
Table 9.10 depicts the reliability of the questions on facilitating conditions. The Cronbach’s Alpha value of 0.633 is below the 0.7 threshold, and is therefore not statistically significant. The last column indicates that the cost of service exercises the greatest influence on the facilitating conditions, since deleting this item will decrease the Cronbach’s Alphs value the most.
At this point it has thus been established that perceived ease of use (PEU) and perceived usefulness (PU) have been measured reliably, whereas the facilitating conditions (FC) have not.
When considering technology adoption in organisations, it makes sense to consider the behavioural intention to use the technology. However, when considering personal mobile phone use, this concept needs a reassessment. Surely the fact that a person has bought a mobile phone testifies to the person’s behavioural intention to use it. A few cases were found where elderly people, provided with mobile phones by their children, had no intention of using it, but in general the fact that a person had a mobile phone was evidence of the behavioural intention to use it.
Behavioural intention was thus measured only in relation to usage variety by looking at the importance each of the usage spaces held for the participant. According to TAM, attitude (A) is supposed to influence behaviour intention (BI). Attitude was captured reliably (as indicated in Table 9.9). However, the fact that attitude has been omitted from UTAUT suggests that attitude may also be subsumed into behavioural intention to use.
At this point it has been established that the social influence (SI), perceived usefulness (PU) and perceived ease of use (PEU) components of MOPTUM have been measured reliably, but that facilitating conditions (FC) could not be measured reliably. Behavioural intention (BI) has been measured only through the importance participants associate with certain uses, i.e. the behavioural intention to use a specific usage space.
The next step is now to verify the structure of the model by finding supporting evidence for the relationships between the components. A multi-variant correlation was done between factors representing components (perceived ease of use (PEU), perceived usefulness (PU), usage intensity (UIN), usage breath (UB)) and variables like technical advancement (Tech_Adv) from demographic factors and technological

Chapter 9 Evaluation of the model
A model for representing the motivational and cultural factors that influence mobile phone usage variety 192
orientation (Tech_O) from personal factors respectively, as depicted in Table 9.11. In this case the Pearson correlation coefficient was used as some of the data was measured on the interval scale (usage frequency and usage breadth). The significant values at 0.05 level are indicated by one asterisk (*) and those at 0.01 by two asterisks (**).
Tech_ Adv
PEU
PU
A
Tech_O
UIN
UB
Pearson Correlation
1 Tech_Adv
Sig. (2-tailed) .000
Pearson Correlation
.480(**) 1 PEU
Sig. (2-tailed) .000
Pearson Correlation
.245 .241 1 PU
Sig. (2-tailed) .061 .066
Pearson Correlation
-.010 .009 -.178 1 A
Sig. (2-tailed) .941 .944 .176
Pearson Correlation
.389(**) .661(**) .220 .053 1 Tech_O
Sig. (2-tailed) .002 .000 .094 .689
Pearson Correlation
.127 -.055 .090 -.043 .032 1 UIN
Sig. (2-tailed) .337 .678 .500 .745 .812 .124
Pearson Correlation
.274(*) .216 .162 .067 .105 .203 1 UB
Sig. (2-tailed) .036 .100 .222 .613 .429 .124
N 59 59 59 59 59 59 59
Table 9.11: Components of the MOPTUM and technological influence
In the light of the information contained in Table 9.11 it follows that technological advancement (Tech_Adv) has a significant positive correlation (0.01 level) with perceived ease of use (PEU) and technological orientations (Tech_O), as well as a significant positive correlation (0.05 level) with usage breadth (UB). This means that people who are technologically advanced tend to be technologically orientated, find perceived ease of use important, and have a wider contact network than people who are not

Chapter 9 Evaluation of the model
A model for representing the motivational and cultural factors that influence mobile phone usage variety 193
technologically advanced. Technological advancement is a demographic variable and therefore this result confirms that demographic variables can influence PEU.
Moreover it also indicates that people who are technologically oriented find perceived ease of use important. Technological orientation is a personal factor and therefore this indicates that personal factors can influence PEU.
The positive relationship between technological advancement (also technological orientation) and ease of use is somewhat surprising, as one may argue that technologically advanced/oriented people would cope with technology and not find ease of use important. On the other hand it can be argued that they are aware of the value of ease of use due to their experience with technology.
The fact that there is no significant correlation between attitude towards use and any of the other determinants is interesting. This corresponds with the qualitative observation that most people between the ages of ten and 70 use mobile phones. Dissatisfaction with the perceived ease of use, or the usefulness, do not deter people from using the phone. This finding supports the validity of omitting the attitude (A) component, which is a component of TAM, from MOPTUM. (This omission of attitude as a separate component is also confirmed by it being omitted from UTAUT). Attitude is therefore subsumed in behavioural intention in MOPTUM.
Table 9.12 depicts the correlations between facilitating conditions (infrastructural variables) and the determinants of perceived ease of use and perceived usefulness. The significant values at 0.05 level are indicated by a * and those at 0.01 by a **. Note that the statistical significance (Sig) of the Pearsons’s correlation was all calculated two-tailed.
From inspection of Table 9.12 it follows that:
• Perceived ease of use is related to technological orientation, technological advancement, system service and to a lesser degree to system cost. This confirms the influence of personal factors (PF) like (technological orientation (Tech_O)), demographic factors (DF) like (technological advancement (Tech_Adv)) and facilitating conditions (FC) on perceived ease of use (PEU).
• Perceived usefulness is correlated with system cost and system quality. This confirms the influence of facilitating factors (FC) on perceived usefulness (PU).
• Technical orientation is correlated with technical advancement and system service. This suggests that people with a high score on the personal attribute of technological orientation (typically innovators according to Rogers Innovation Diffusion Model) are inclined to be technologically advanced and find system service important, i.e. personal factors (PF) may influence facilitating conditions (FC).
• Technological advancement is correlated with system service, system cost and system quality. This suggests that people with a high score on technological advancement find system service, system cost and system quality important, i.e. demographic factors (DF) influence facilitating conditions (FC) as represented by these infrastructural variables.

Chapter 9 Evaluation of the model
A model for representing the motivational and cultural factors that influence mobile phone usage variety 194
EOU PU Tech_O Tech_ Adv
System Service
System Cost
Phone Cost
System Quality
Pearson 1 Sig.
PEU
N 59 Pearson .241 1 Sig. .066
PU
N 59 59 Pearson .661(**) .220 1 Sig. .000 .094
Tech_O N 59 59 59
Pearson .480(**) .245 .389(**) 1 Sig. .000 .061 .002
Tech_ Adv
N 59 59 59 59 Pearson .356(**) .159 .385(**) .294(*) 1 Sig. .007 .242 .003 .028
System Service N 56 56 56 56 56
Pearson .286(*) .334(*) .154 .352(**) .430(**) 1 Sig. .031 .011 .254 .007 .001
System Cost N 57 57 57 57 56 57
Pearson .016 .248 -.124 .113 .162 .456(**) 1 Sig. .907 .063 .358 .402 .232 .000
Phone Cost N 57 57 57 57 56 57 57
Pearson .189 .265(*) .177 .366(**) .225 .393(**) .108 1 Sig. .162 .048 .193 .006 .098 .003 .427
Service Quality
N 56 56 56 56 55 56 56 56
Table 9.12 Components of the MOPTUM and infrastructural variables
• System service is correlated with system cost. This suggests that people who find system service important also care about system cost. Both are facilitating conditions (FC).
• System cost is correlated with phone cost and system service. This suggests that people who find system cost important also care about phone cost and system service. This suggests that infrastructural variables could be related.
A count of the significant correlations (vertically and horizontally) for each variable produces the following:

Chapter 9 Evaluation of the model
A model for representing the motivational and cultural factors that influence mobile phone usage variety 195
• System cost: 6
• Technological advancement: 5
• System service : 4
• Perceived ease of use: 4
• Technological orientation: 3
• System quality: 3
• Perceived usefulness: 2
• Phone cost: 1
Given the sample of students who are responsible for their own phone bills the importance of system cost is understandable. A mobile phone is often acquired as part of a contract and this explains why the cost of the phone is not important. In summary it can be said that the following has been confirmed:
• Demographic (DF) and personal factors (PF) can influence perceived ease of use (PEU).
• Demographic (DF) and personal factors (PF) can influence facilitating conditions (FC).
• Facilitating conditions (FC) can influence perceived ease of use (PEU) as well as perceived usefulness (PU) (this was not depicted in UTAUT).
These findings support the inclusion of personal factors (PF), which is a contribution by MOPTUM, as well as the recognition of the influence of infrastructure (facilitating conditions (FC)) as important elements in personal mobile phone usage.
If mediating factors are found to influence a component, it can be argued that they will indirectly influence all the relations of those components. For example, demographic (DF) and personal factors (PF) have been found to influence facilitating conditions (FC) and therefore it is assumed that they will influence the relation between facilitating conditions (FC) and behavioural intention (BI), as well as the relation between facilitating conditions (FC) and the actual use (U) component.
Note that support for the correlations listed, does not invalidate the other relations in MOPTUM that are not discussed here. All the relations depicted in MOPTUM are based on evidence from more than one source, i.e. observations, literature reviews, or empirical findings and will be retained unless in conflict with new findings.
Based on this verification survey the only change to MOPTUM is to include the influence of facilitating conditions (FC) on perceived usefulness (PU) and perceived ease of use (PEU), as well as the influence of mediating factors on facilitating conditions (FC).
9.2.3.2 Relative importance of usage spaces
In Question 49 the participants were required to rate the importance of each of the 10 usage spaces presented to them. Figure 9.2 shows the importance attributed to each usage space by the participants: only the percentages for ‘very important’, ‘important’ and ‘nice to have’ are indicated on the bars since the

Chapter 9 Evaluation of the model
A model for representing the motivational and cultural factors that influence mobile phone usage variety 196
graph became unreadable when all the percentages were added. According to Figure 9.2, the four spaces rated very important by most users are:
• Relationships, personal information, organisation and safety and security.
In Question 50 the participants were asked to rank the 10 usage spaces (provided in random order) from 1 to 10. The average of this ordering was computed for the whole data set and is depicted in Figure 9.3. Looking at Figure 9.3, the three spaces rated most important are:
• Organisation, personal information and relationships.
Having captured data on the same concept from two different questions allows us to triangulate and observe that the first three spaces at the intersection of these two sets are: relationships, personal information and organisation. In Figure 9.2 the fourth usage space is safety and security, while Figure 9.3 has three spaces (safety and security, personal history and entertainment) in second place (having three in first place). Therefore safety and security is rated fourth.
56
49
39
37
27
20
19
14
10
10
36
36
36
39
25
14
20
14
5
32
8
14
15
39
46
51
44
29
37
8
0% 20% 40% 60% 80% 100%
Relatio
nship
sInf
ormati
on(P
)Orga
nisati
on
Safety
and s
ecuri
ty
Person
al Hist
oryM-commerc
eEnte
rtainm
ent
Inform
ation
(NP)Self
-imag
eExpan
sion
VIP
Important
Nice to Have
Not Impartant
Totally unimportant
Missing
Figure 9.2: Relative importance attributed to usage spaces based on question 49

Chapter 9 Evaluation of the model
A model for representing the motivational and cultural factors that influence mobile phone usage variety 197
It was expected that safety and security would rate higher. The fact that safety and security only took fourth place can possibly be attributed to the age of the participants since the qualitative observations indicated that safety and security did indeed constitute a core use, especially in South Africa where crime is a big issue.
Triangulating these findings with the qualitative findings, the core usage spaces proposed are: Relationships, personal information, organisation, safety and security, while all the other spaces are in
the additional group. These results support the notion that usage spaces can be divided into core spaces and additional spaces, as proposed in Figure 8.3.
0 1 2 3 4 5 6 7
Organisation
PersonalInformation
Relationships
Entertainment
Personal History
Safety andsecurity
Expansion
Non-personalInformation
M-commerce
Self-image
Figure 9.3: Relative importance attributed to usage spaces based on question 50
9.2.3.3 Usage intensity and usage breadth
The students were selected since they were expected to be frequent mobile phone users. Table 9.13 depicts mobile phone usage frequency and serves to confirm that only 5.1% of the 59 participants see themselves as average or light users, while the rest are moderate, heavy or very heavy users.

Chapter 9 Evaluation of the model
A model for representing the motivational and cultural factors that influence mobile phone usage variety 198
Frequency Percentage of users Cumulative percentage of users
Very heavy 10 16.9 16.9
Heavy 21 35.6 52.5
Moderate 25 42.4 94.9
Average light 1 1.7 96.6
Light user 2 3.4 100
Table 9.13: Usage frequency Usage breadth is depicted in Table 9.14. Most users believe that they have between 100 and 150 stored
numbers on their phone, but in the interviews it was observed that users find it difficult to get this information from their phone and these are probably only estimates. None of the participants believed that they had more than 150 numbers.
Numbers stored on phone Frequency Percent
1 Less than 10 1 1.7
2 From 10 to 20 0 0
3 From 21 to 50 13 22.0
4 From 51 to 100 14 23.7
5 From 100 to 150 31 52.5
6 More than 150 0 0
Total 59 100.0
Table 9.14: Usage breadth in terms of numbers stored As has been noted, MOPTUM was synthesized from other models, mainly UTAUT, TAM and the
model by Kwon and Chidambaram, and therefore the correlations SI and PEU, SI and PU as well as PEU and BI, PU and BI, SI and BI have not been verified quantitatively again in this survey. However, these relations are retained in the model based on the available literature (the fact that they are included in existing models) and observations.
The validation is now discussed in section 9.3. The findings from the verification survey will be triangulated with the findings from the validation to present the final MOPTUM model in section 9.4.
9.3 VALIDATION The aim of the validation is to establish whether the right model has been developed, i.e. a model to
represent the motivational and cultural factors that influence mobile phone usage variety and also to capture the reasons why people found the MOPTUM useful or not useful.

Chapter 9 Evaluation of the model
A model for representing the motivational and cultural factors that influence mobile phone usage variety 199
Six of the ten participants interviewed in the original study were interviewed again. They included two people between the ages of 20 and 30, two between the ages of 30 and 40 and two above 40.
MOPTUM, as depicted in Figures 8.2 and 8.3, was presented to them and the following questions were then put to them:
• Have you ever felt confused to the point where you needed help in selecting or using a mobile phone?
• What do you use your mobile phone for?
• Do you find this model helpful in selecting a mobile phone?
• What is positive about MOPTUM?
• What is negative about MOPTUM?
The responses per age group to these questions are discussed below.
9.3.1 Response: age group from 20 to 30
Both participants said that they have found mobile phone usage confusing at times and hence would be interested in a model for representing the components to facilitate understanding. The following factors were listed as the main factors influencing their mobile phone usage behaviour: cost of service, network coverage, battery life. This group listed the following as priority usage spaces: safety and security, relationships, personal information, non-personal information, entertainment.
One participant felt that mobile phones had too many functions and that this complicated the ease of use. Both participants found the model useful in understanding mobile phone usage. One of them made a recommendation on the position of the components on the diagram to enhance clarity. No negative findings were noted.
9.3.2 Response: age group from 30 to 40
One participant said that he never found mobile phone usage confusing. He believed that the model could be useful to other people, but personally he did not need support in understanding mobile phone usage variety.
The second participant was an experienced mobile phone user (possibly even more so than the first participant in this age group) but stated that there had been situations in which he did find something about mobile phone usage confusing. He believed the model could be useful to himself and other people.
They listed the following as priority uses: safety and security, relationships, organisation, personal information, non-personal information, personal history, expansion. They could not identify anything negative. On the positive side they thought that the model could be useful to a wide variety of people, especially people over 40.

Chapter 9 Evaluation of the model
A model for representing the motivational and cultural factors that influence mobile phone usage variety 200
9.3.3 Response: age group above 40
Both participants said that they have found mobile phone usage confusing at times and hence would be interested in a model for representing the components to facilitate understanding. They noted safety and security as the most important uses, followed by the building and maintenance of relationships. They found MOPTUM useful in representing usage since usage spaces provided a simple, non-technical way to express mobile phone use. One participant described a mobile phone as something that was ‘small and always missing’. She remarked that her husband told her to ‘phone the thing’ when it was missing and was indignant about the fact that he expected her to know her mobile phone number.
They listed the following uses: safety and security, relationships, organisation. They could not identify anything as positive or negative about the model. Nevertheless, they felt that
looking at the model gave them a new awareness of factors that could influence mobile phone use. MOPTUM contained all the uses they listed and also introduced new usage spaces.
9.3.3 Combined responses on usage spaces
The participants were then requested to mark the usage spaces relevant to their mobile phone usage and the responses are shown in Table 9.15. The cases where both participants found the space relevant to their use is indicated in bold, italics are used to indicate the case where both participants did not find the usage space relevant. From inspection it can be remarked that two usage spaces, namely safety and security and relationships, are important to all participants, whilst image is not important to any group.
Age: 20 to 30 Age: 30 to 40 Age: above 40
Participant’s gender Male Female Male Male Male Female
Safety and security Yes Yes Yes Yes Yes Yes
Relationships Yes Yes Yes Yes Yes Yes
Organisation Yes No Yes Yes Yes Yes
Personal information Yes No Yes Yes Yes No
Non-personal information Yes No Yes No Yes No
M-commerce Yes No No No No No
Entertainment Yes Yes Yes No No Yes
Expansion No No Yes Yes No No
Personal history Yes No Yes No Yes No
Image No No No No No No
Philanthropy Yes No Yes Yes Yes No
Table 9.15: Usage spaces relevant to the participants’ mobile phone usage
However, the findings about image should be reconsidered. When the participants in the below 30 age group were questioned about image, they said that it was important to many of their friends, but not to

Chapter 9 Evaluation of the model
A model for representing the motivational and cultural factors that influence mobile phone usage variety 201
them personally. This statement had repeatedly been made and therefore it is suggested that people may find it socially inappropriate to say that a mobile phone is important to their image.
MOPTUM has now been verified by the quantitative evaluation of the components and relationships between the components. MOPTUM has also been evaluated qualitatively to confirm that this is the right product, i.e. the model represents the motivational and cultural factors that influence mobile phone usage variety.
9.4 MODEL EVALUATION The model is now evaluated by verifying it against established criteria as discussed in section 9.4.1 and
then the overall structure of MOPTUM is evaluated as discussed in section 9.4.2.
9.4.1 Verifying MOPTUM against established criteria
According to Olivier [Olivier, 2004], a model should be evaluated against the criteria of simplicity, comprehensiveness, generality, exactness and clarity, as discussed in section 6.9. The qualitative findings on the evaluation of each of these will now be discussed.
• Simplicity: For the purpose of a research environment, MOPTUM allows comprehension of the concepts being modelled without additional explanation. Further development and simplifications are, however, necessary to make all concepts accessible to mobile phone users, marketers and developers. For example, instead of facilitating conditions, the infrastructural variables of service cost, service quality, etc., should be identified. However, this further refinement is not possible without first describing the model in an conceptual format, as has been done for MOPTUM.
• Comprehensiveness: MOPTUM’s usage spaces provided for all the different mobile phone uses listed by the participants. This suggests that it provides comprehensive coverage of mobile phone usage.
• Generality: MOPTUM was developed for a specific user group but during the validation it was found be useful to other users as well. The structure of core usage spaces and additional spaces makes it flexible, i.e. the model can be adapted by changing the usage spaces. Furthermore, it does not focus on specific models of mobile phones, but rather views mobile phone usage from a generic perspective common to all mobile phone users, namely motivational user needs.
• Exactness: MOPTUM systematically deals with the different aspects of solving the problem, keeping all the components on the same level so as not to become bogged down in the detail. Each component of MOPTUM can be clearly distinguished from the other components.
• Clarity: The users’ satisfaction with MOPTUM indicates that the model fits the perceived problem and can be used to solve the problem. The purpose of the components, the operations and the interactions between them are evident when looking from a technology acceptance perspective, but

Chapter 9 Evaluation of the model
A model for representing the motivational and cultural factors that influence mobile phone usage variety 202
the academic contribution will have to be developed further into a commercial product to have the required clarity required by end-users.
9.4.2 Verifying the overall structure of MOPTUM
Several of the components of MOPTUM are based on the integration and synthesis of other models. This means that it was not necessary for all the components and relationships to be verified or validated in this research.
Figure 9.4 depicts the final MOPTUM model. There are two differences from the original MOPTUM, as depicted in Figure 8.2:
• This final MOPTUM also depicts the relationship between facilitating conditions (FC) and both the components of perceived ease of use (PEU) and perceived usefulness (PU).
• The mediating factors (demographic, socio-economic and personal) have been found to influence the relationship between facilitating conditions (FC) and behavioural intention to use (BI) as well. This has been indicated on the diagram in Figure 9.4 by placing the abbreviations for the mediating factors next to the line indicating this relationship.
As has already been mentioned, MOPTUM is synthesized from other models, mainly UTAUT, TAM and the model by Kwon and Chidambaram and therefore the correlations SI and PUE, SI and PU as well as PEU and BI, PU and BI have not been verified again with this verification survey. The fact that both quantitative and qualitative evidence was incorporated into MOPTUM makes it impossible to verify the entire model quantitatively. Nevertheless, all the existing relationships in MOPTUM are based on at least two sources, which could be the literature survey, quantitative findings or qualitative findings.

Cha
pter
9
Eval
uatio
n of
the
Mod
el
A m
odel
for r
epre
sent
ing
the
mot
ivat
iona
l and
cul
tura
l fac
tors
that
influ
ence
mob
ile p
hone
usa
ge v
arie
ty
203
Figu
re 9
.4: M
OPT
UM
with
ver
ified
com
pone
nts a
nd re
latio
ns in
solid
line
s
Per
ceiv
ed E
ase
of U
se
(PEU
)
Per
ceiv
ed E
ase
of U
se
(PEU
)
Per
ceiv
ed U
sefu
lnes
s
(PU
)
Per
ceiv
ed U
sefu
lnes
s
(PU
)
Soc
ial I
nflu
ence
(SI)
Soc
ial I
nflu
ence
(SI)
Beha
viou
ral I
nten
tion
(BI)
Beha
viou
ral I
nten
tion
(BI)
Faci
litat
ing
Con
ditio
ns
(FC
)
Faci
litat
ing
Con
ditio
ns
(FC
)A
ctua
l Sys
tem
Use
(U)
Act
ual S
yste
m U
se
(U)
Usa
ge In
tens
ity
(UIN
)
Usa
ge In
tens
ity
(UIN
)
Usa
ge B
read
th
(UB)
Usa
ge B
read
th
(UB)
Usa
ge V
arie
ty
(UV
)
Usa
ge V
arie
ty
(UV
)
Usa
ge S
pace
s
(US
)
Usa
ge S
pace
s
(US
)
Usa
ge S
pace
s
(US
)
PF,
DF,
SF
PF, D
F, S
F
PF,
DF,
SF
PF,
DF,
SF
PF,
DF,
SF P
F, D
F, S
F
DET
ERM
ININ
G F
ACTO
RS
PF,
DF,
SF
PF, D
F, S
F
Soc
io-e
cono
mic
Fa
ctor
s (S
F)
MED
IATI
NG
FAC
TOR
S
Dem
ogra
phic
Fa
ctor
s (D
F)Pe
rson
al F
acto
rs
(PF)

Chapter 10 Contribution
A model for representing the motivational and cultural factors that influence mobile phone usage variety 204
9.5 THE USEFULNESS OF MOPTUM In order to demonstrate the usefulness of MOPTUM, its use in converting user needs to required
mobile phone features is illustrated. The resulting information can be used by the user to find a phone with matching features that will satisfy his or her specific needs; by marketers to recommend a particular mobile phone model; or by developers in designing a mobile phone for a specific target market.
As noted in section 8.3.4, there are core usage spaces and additional usage spaces. There is also a set of prerequisite features that are needed to support the other uses. For example, a phone book is a prerequisite for using caller ID, speed dialling and many other features in the safety and security, relationships, organisation and personal information spaces. Similarly, the messages feature should have a feature to show the log of messages sent as well as functions for saving and deleting messages. The phone book and the supporting functions relating to a feature are assumed to be prerequisites and will not be repeated for each usage space.
The prerequisite features together with the features to support the core uses present the ‘must haves’ identified by Kano (see section 3.3), while the additional uses represent the ‘more is better’ and the ‘surprise and delight’ features.
Section 9.5.1 discusses the applicability of MOPTUM to two different user orientations within the same age group, while section 9.5.2 discusses the applicability of MOPTUM to other age groups.
9.5.1 Application of MOPTUM within the same age group
MOPTUM will now be applied to the needs expressed by the two participants under the age of 30. They were selected since they fitted the target group of university students, under the age of 30 being of similar socio-economic status. As discussed under consumer segmentation in section 4.3.4, mobile phone use can be categorised by criteria other than age. Even within the age group (between 20 and 30 years) technological orientations and technological advancement remain important.
As discussed in section 9.3.1, the participants were asked some questions about their mobile phone usage, then MOPTUM was presented to them and they were asked to select the usage spaces their mobile phone usage relates to. The responses and results of each of these participants will be discussed as separate cases to show that even within the same demographics, socio-economic group differentiation in terms of needs is necessary. Participant 1 is discussed under section 9.5.1.1 and Participant 2 under 9.5.1.2.
9.5.1.1 Participant 1: Female
This participant was technologically advanced but expressed frustration about the continual addition of new mobile phone features, which made her phone difficult to operate. This leads to the conclusion that she was neither an innovator nor an early adopter, but rather part of the early majority. She selected the following usage spaces to represent her mobile phone usage preferences: safety and security, relationships, personal information and entertainment (games only).

Chapter 9 Evaluation of the model
A model for representing the motivational and cultural factors that influence mobile phone usage variety 205
Based on Tables 8.4 and 8.5, these usage spaces would require the following features: voice calls, phone book, SMS and MMS messages, speed dialling, phone book, caller ID, notes, reminders, games. Note that not all the features listed in Table 8.4 and Table 8.5 need to be included.
This is where personal factors come into play. Some people may see a camera as necessary for security, i.e. to take pictures of offenders. However, since this person is not highly technologically oriented, this would not be part of the basic recommendation, though the option should be mentioned.
The participant should then be presented with a selection of mobile phones that offer these features to make her selection. This is where the mediating influence of demographic, socio-economic and personal factors should be exercised, since the user can choose a mobile phone from the recommended set to accommodate these factors.
9.5.1.2 Participant 2: Male
This participant was technologically advanced and enjoyed using new technology. His mobile phone usage was only limited by the cost of mobile phone services. This led to the conclusion that he was an early adopter or even an innovator. He selected the following usage spaces to represent his mobile phone usage: safety and security, relationships, organisation, personal information, non-personal information, m-commerce, entertainment, personal history and philanthropy. This means that only expansion and image were not included.
Based on Table 8.4 and 8.5, these usage spaces would require the following features: voice calls, SMS and MMS messages, speed dialling, caller ID, notes, reminders, camera, video capture, calendar, alarm, to-do list, internet, e-mail, games, radio and blogs.
This again is where personal factors come into play. For example, television may fit the person’s usage space of entertainment, but due to the cost limitation expressed it may not be useful, though the option and the cost implications should be mentioned. The participant should then be presented with a selection of mobile phones that offer these features and exercise his personal preference as mediated by demographic, socio-economic and personal factors.
The issue of what to select as prerequisite features and which features to associate with each usage space needs further refinement but I believe the point has been made that usage spaces can be useful in guiding feature selection. Refining the model and making it commercially viable is beyond the scope of this study.
9.5.2 Application of MOPTUM to other age groups
The literature study provides evidence that age influences mobile phone use (section 3.2) and this was verified in the interviews. However, it is important to keep in mind that age is not the only determining variable. Given only the user’s age it is possible to give a recommendation but other variables such as technological orientation will help to customise and improve the recommendation. Section 9.5.2.1

Chapter 9 Evaluation of the model
A model for representing the motivational and cultural factors that influence mobile phone usage variety 206
considers the application of MOPTUM to younger users between the ages of 15 and 20 years whilst section 9.5.2.2 looks at older users between the ages of 60 and 70 years.
9.5.2.1 Users between the age of 15 and 20
Based on the literature survey and observation, the following would be core usage spaces for this group: safety and security, relationships, organisation, personal information and entertainment. Additional information about the user such as technological orientation and special requirements would be useful to customise the recommendation.
Looking at Table 8.4 and 8.5, these usage spaces would then require the following features: Voice calls, SMS, phone book, MMS, speed dials, camera, video, sound recording, caller ID, phone book, call log, camera, photo collection manager, calendar, alarm, to-do list, notes, reminders, games, music, television, SMS (jokes), MMS, chat rooms (MXIT), camera, video, blue tooth for multi-player games.
The selection of some of these features e.g. television and blue tooth for multi-player games is subject to other constraints such as price and infrastructure. The MXIT service was not included in the survey but has since gained popularity, so the phone should be able to support MXIT. This is an example of how the usage space approach makes it possible to incorporate new features without changing the basic model.
9.5.2.2 Users between the age of 60 and 70
Based on the literature survey and observation, the following would be core usage spaces for this group: safety and security, relationships and micro-organisation. Based on Table 8.4 and 8.5, these usage spaces would require the following features: voice calls, SMS and MMS messages, speed dialling, caller ID, phone book, calendar, alarm, to-do list, notes and reminders.
This is where personal factors come into play. MOPTUM should be seen as the starting point in making a recommendation and the more information available about the user the more optimal the final recommendation will be.
9.6 SUMMARY AND CONCLUSION This chapter has discussed the evaluation of MOPTUM, from a validation, verification and usefulness
perspective. The verification served to confirm the inclusion of the determining factors, the mediating factors and
the extension of the actual use attribute in MOPTUM:
• Regarding the mediating factors, the verification confirmed that demographic factors and personal factors influence perceived ease of use.
• Socio-economic factors were controlled by selecting participants in the same socio-economic group and therefore this influence was not measured although it has been found to influence mobile phone usage, as was discussed in section 3.2.

Chapter 9 Evaluation of the model
A model for representing the motivational and cultural factors that influence mobile phone usage variety 207
• Social influence was verified in two ways, firstly by the fact that the questions measuring the construct were found to be reliable in measuring the same construct. Secondly, the optimal scaling analyses provided evidence of the relevance of a cultural dimension, for example, the fact that the dimension of uncertainty avoidance applies to mobile phone usage. Cultural dimensions are expressions of social behaviour and therefore these findings support the relevance of social influence.
• Facilitating factors were found to influence both perceived ease of use and perceived usefulness. MOPTUM has been adapted to recognise the influence of facilitating conditions on perceived usefulness and perceived ease of use, as well as the influence of mediating factors on facilitating conditions.
• It was found that mobile phone usage behaviour could be influenced by motivational human needs since the responses to the questions on motivational needs related to the importance people attribute to the corresponding usage space as discussed in section 9.2.3.1.
• The validation confirmed that there was a need for a model to represent the factors that influence mobile phone usage.
• The model was found to be comprehensive in dealing with the relevant factors and usage spaces, and general to the extent that it covered the uses expressed by all three of the groups. Evaluating exactness is difficult but the participant’s enthusiasm for the usefulness of the model supports the notion that MOPTUM fits mobile phone usage variety and manages to model it closely.
• The model was not simple enough to be useful without explanation and the relations between components were not always clear. However, this version was necessary to express the findings in a conceptually complete and rigorous way and developing a simplified version is the natural progression from academic contribution to product contribution.
MOPTUM was evaluated for its usefulness and potential to convert user needs to features. The applicability within the target age group (20-30) as well as the applicability to two other age groups was demonstrated.
The issue of what to select as prerequisite features and which features to associate with each usage space needs further refinement but this chapter serves to make the point that usage spaces can be useful in guiding feature selection. Refining the model to make it commercially viable is beyond the scope of this study.
MOPTUM, as described in Chapter 8 and evaluated in Chapter 9, therefore provides an answer, though not necessarily the only answer, to the main research question: What are the components of a model to represent the influence of motivational needs and cultural factors on mobile phone usage variety?
Chapter 10 considers the contribution of the research.

Chapter 10 Contribution
A model for representing the motivational and cultural factors that influence mobile phone usage variety 208
CHAPTER 10: CONTRIBUTION
10.1 INTRODUCTION This chapter discusses the contribution this study makes to the body of knowledge on HCI (human-
computer interaction). In order to ascertain the contribution of this study it is necessary to look at the situation prior to this study and then consider the current situation. A brief overview of the situation when this study commenced is given in section 10.2. The scientific contribution is discussed in section 10.3, whilst section 10.4 is devoted to the product contribution. Section 10.5 concludes with a summary on the contribution of the research.
10.2 OVERVIEW At the outset of this study in early 2005, several studies had already applied the TAM to mobile phone
adoption and use as discussed in section 4.2. Most applicable to this research is that of Kwon and Chidambaram [2000], who tested the TAM for mobile phone adoption and use. In their study, use was limited to number of calls, length of calls and personal versus work-related use, making no further provision for usage variety.
UTAUT is another major contribution in the field of technology adoption and usage, but UTAUT focuses on technology adoption models for organisations and therefore UTAUT does not give consideration to factors concerning personal use. For example, UTAUT notes facilitating conditions in relation to use behaviour but this influence becomes more prominent in personal use, and therefore facilitating conditions also influence behavioural intention, something that is not represented in UTAUT.
Neither UTAUT nor the model by Kwon and Chidambaram [2000] consider personal factors to be a mediating factor. Given the personal nature of mobile phones this is an important issue.
10.3 SCIENTIFIC CONTRIBUTION According to Field [2005] there are four basic plots in research, namely to:
• Test a theory.
• Replicate a theory.
• Extend findings.
• Resolve an anomaly that has arisen in other work.
This research tests a theory, replicates a theory and extends findings. It also integrates findings from different models, which involves linking concepts and models across different fields of research. The scientific contribution of this study will now be discussed under these headings.

Chapter 10 Contribution
A model for representing the motivational and cultural factors that influence mobile phone usage variety 209
10.3.1 Testing a theory
This study has tested Marcus and Chen’s usage space model [Marcus and Chen, 2002a; Marcus, 2005b]. Marcus and Chen’s usage space model has been proposed and discussed, but no evidence could be found that it had been empirically tested. In this study the existence of these spaces was investigated and the following was found:
• Evidence for the existence of the relationships (quantitatively) and m-commerce, information, entertainment and self-enhancement (qualitatively). In MOPTUM the information space has been differentiated into personal and non-personal information.
• Although the importance of self-enhancement has been verified, it was not included in the MOPTUM model as a usage space. The reason being that all of the spaces contribute to self-enhancement and therefore self-enhancement is seen as a result of mobile phone use rather than a separate usage space.
• According to Marcus and Chen’s model, the identity space lies at the intersection of the usage spaces. However, when considering usage spaces as separate entities, the identity space seems to be on another level, again more of a consequence than a direct usage space and therefore it is not presented in MOPTUM.
Testing the Diffusion of Innovations model was not one of the research questions. However, the findings from the cultural dimensions in section 7.5 suggest different behavioural approaches to mobile phone use which can possibly be related to the innovators, early adopters and laggards as identified in Rogers’s Diffusion of Innovations theory [Rogers, 2003]. The correlation between technical orientation, technological advancement, perceived ease of use and usage breadth as discussed in section 9.2.3.2 fits the profile of the innovators as described in the Diffusion of Innovations theory and hence supports the theory.
The qualitative and quantitative evaluation tests aspects of UTAUT, TAM and the model by Kwon and Chidambaram, as discussed in section 8.4.
10.3.2 Replicating a theory
Replication refers to the application of the theory in a new domain. As noted, MOPTUM is based on the TAM, the model by Kwon and Chidambaram and UTAUT. Therefore MOPTUM replicates theories on technology adoption and use to focus on mobile phone use.
TAM and UTAUT are general theories, i.e. they do not focus on a specific technology. MOPTUM replicates these general concepts from technology adoption in the mobile phone usage domain. Another difference is that TAM and UTAUT were developed for organisations, whereas MOPTUM addresses personal use only, and therefore MOPTUM replicates mobile phone technology adoption and use for personal use.

Chapter 10 Contribution
A model for representing the motivational and cultural factors that influence mobile phone usage variety 210
10.3.3 Extending findings
The MOPTUM extends technology adoption and usage models by:
• Refining the actual use (also referred to as use behaviour or extent of use) component to measure use frequency, use breadth and use variety.
• Use variety is extended and refined to core spaces and additional spaces as depicted in Figure 8.1 and Figure 8.2.
• MOPTUM confirms earlier research in adding social influence [Malhotra and Galletta, 1999; Meso et al., 2005], infrastructure and cost [Kleijnen et al., 2004] as variables that influence mobile phone usage.
• MOPTUM adds personal factors as a mediating factor in mobile phone adoption and usage. This may have been implied in components such as external variables in TAM, etc., but given the personal nature of mobile phone usage it is necessary to explicitly represent personal factors. The issue of personality has been excluded from the scope of this study but the personality attributes of nervous, enthusiastic, original, appreciative and controlled, as noted by Hofstede and McCrae [2004], could possibly be useful in explaining user behaviour not accounted for by MOPTUM.
Regarding Marcus and Chen’s usage space model, MOPTUM extends the concept of usage spaces by adding security, organisation, self-image, expansion, personal history and philanthropy spaces. In Marcus and Chen’s model, the spaces were arranged around a central space of identification. All the spaces are indisputably linked to the identification of the user, but grouping the findings into a core group and an additional group (as done in MOPTUM) make it easier to prioritise user needs and to relate features to usage spaces.
This representation of the usage spaces also reflects Herzberg’s theory [Herzberg, 1968] of core (hygiene) spaces and additional (motivational) spaces and suggests that further refinement may be possible by looking at the ‘attractive’, ‘more is better’, ‘must have’ and ‘indifferent’ categories as proposed by Kano [1996] to make the model more useful for designers and marketers.
10.3.4 Synthesizing theories from different fields
Mobile phone usage has been researched in different fields and from different perspectives as discussed in Chapter 5. However, a high-level model to integrate important findings from these different perspectives could not be found.
The MOPTUM model contributes towards identifying and verifying factors that influence mobile phone use. It draws on research from HCI (usage spaces and usability), sociology and CSCW (domestication theory, usage spaces and trends in using mobile phones), psychology (motivational human needs) and marketing (technology adoption). The MOPTUM integrates, adapts and extends existing models, of which Marcus and Chen’s usage spaces model and the TAM are the most important. One of MOPTUM’s contributions is to recognise the link between the models from market research (TAM and the

Chapter 10 Contribution
A model for representing the motivational and cultural factors that influence mobile phone usage variety 211
various adaptations proposed to TAM), the human needs models from psychology (discussed in Chapter 3) and the usage space models from the fields of HCI, CSCW and domestication research, and concretize these in a model.
The findings suggest a link between mobile phone usage and motivational human needs as described by Maslow [1954], Herzberg [1968] and the Institute for Management Excellence [1997] amongst others, as discussed in Chapter 3.
Theories from psychology have been used in marketing before, for example Herzberg’s motivator-hygiene theory from motivational psychology inspired the theory of quality (Kano analyses) in marketing [Löfgren and Witell, 2005]. Nevertheless, the associations between elements of motivational needs and usage spaces have not been purposely implemented in a model of mobile phone use. MOPTUM captures this association in the structure which links usage spaces to the motivational and social factors that influence mobile phone usage.
Documenting a research direction, which seeks correlations between motivational human needs and usage spaces is important since previous research into human needs in HCI focused mainly on tasks needs.
As noted before, mobile phone adoption and usage is an issue that bridges different fields. When researching the same issue across fields, the different research approaches and philosophies become evident. In the field of marketing, predictive models based on statistical analyses are developed for predicting mobile phone adoption and to a lesser degree mobile phone usage. In contrast, Geser [2004] viewing it from a sociology perspective, believes that it is not possible to create a predictive model for mobile phone usage.
Despite much research on mobile phone adoption and use, few studies have applied systematic experimental or quasi-experimental methodologies and consequently the findings are useful as a basis for extending and modifying current use but do not have any predictive value [Kankainen and Oulasvirta, 2003; Pedersen, 2003]. This research responds to the challenge by applying systematic, experimental methodologies to model mobile phone usage variety.
As noted by Geser [2004], the many variables and the subjectivity involved in mobile phone usage make it impossible to create a totally deterministic model for explaining mobile phone usage, but this should not deter researchers from trying to explain as much of the variance as possible.
Identifying the components and the relationships through qualitative and quantitative methods and representing that in a model helps to create a more solid, shared understanding of mobile phone usage without limiting the problem space. MOPTUM provides a non-technical representation of a complex and highly technical situation that can be useful in bridging the gap between users, designers and marketers.

Chapter 10 Contribution
A model for representing the motivational and cultural factors that influence mobile phone usage variety 212
10.4 PRODUCT CONTRIBUTION The product contribution lies in the value of MOPTUM for researchers, mobile phone users, marketers
and designers. The following aspects of MOPTUM have general benefit:
• The confirmation of the uncertainty avoidance and the individualist/collectivist cultural dimensions as important factors in mobile phone use (see section 7.5).
• The identification of new behavioural factors like independence in exploring and solving problems, as well the drive to optimise time and technology (see section 7.5).
• The distinction between core and additional usage spaces may have implications for the design and marketing of mobile phones, since this relates to Kano’s model of quality attributes for satisfying user needs.
• The fact that these usage spaces are related to motivational human needs provides an improved understanding of user needs in the context of mobile phone usage and opens up a new research direction in HCI, where user needs have mostly been considered as task-related.
Users, marketers and designers have different perspectives and therefore users will be considered in section 10.4.1, marketers in section 10.4.2 and designers in section 10.4.3.
Apart from the scientific contribution of the findings, the questionnaires developed and tested during this research could be of use to researchers in technology adoption and use. This is discussed in section 10.4.4.
10.4.1 Users
The findings from the mini-survey discussed in section 7.2.2 indicated that the sales personnel approached focused on features, contracts and price rather than on user needs. This was confirmed over and over, even by a manager of a handset provider company who stated that handset providers gave marketers incentives to sell specific brands and therefore marketers were more interested in selling specific phones than in understanding user needs (I choose not to reveal the source since that would not be in the interests of their company).
This means that users cannot depend on sales personnel to give them unbiased advice; they need support in understanding their own needs and ensuring that these needs are met.
The MOPTUM could support users who are confused and overwhelmed by the information overload in prioritising their needs when selecting a phone. The usage spaces model provides a non-technical model that can enable users to articulate their needs in terms that relate to their mobile phone usage rather than in the continually changing technical terms that are unfamiliar to them.

Chapter 10 Contribution
A model for representing the motivational and cultural factors that influence mobile phone usage variety 213
10.4.2 Marketers
Marketers are mostly well-versed in the technical specifications of mobile phones and the business models of the service providers, but being able to elicit and process the mobile phone requirements of a person and match them to technical specifications is a complicated task for which there may not be sufficient motivation. MOPTUM can be used as the basis for developing a tool to support people in this process.
As noted, business considerations often take priority over customer needs but this may change as the market becomes saturated. As one market researcher phrased it: ‘Up to now we had no problem in selling mobile phones, the fish has been jumping into the boat, but we will have to start considering user needs as the market becomes saturated’.
The usage spaces model provides a non-technical model that can enable users to articulate their needs, which sales assistants can then translate into technical specifications. Nevertheless, the current model will have to be simplified and customised for this purpose.
10.4.3 Designers
Focusing on long-term user needs gives designers an alternative to the current feature-driven approach. The findings regarding usage spaces and cultural dimensions can assist designers who target a specific market for example, focusing on designing for uncertainty avoidance where confirmation and backup of functions and services are essential.
The usage spaces are by no means an attempt to limit the design space since original design is an essential part of mobile phone marketing. MOPTUM should be seen as a guideline to ensure that a person with specific uses gets a phone with the features to support their uses.
I can only speculate that the MOPTUM model will be of use to designers because no designer has as yet evaluated it. The evaluation by designers will be part of future research, which will begin as soon as MOPTUM has been published.
10.4.4 Questionnaires
As noted in the initial requirements gathering (section 6.7.1) it was impossible to find a comprehensive questionnaire for measuring mobile phone usage behaviour since all the available questionnaires focused on a specific issue, e.g. mobile commerce, and most included only a few questions (fewer than 10). From the initial requirements gathering, through the pilot study, the survey and the verification survey, the set of questions was continually updated, refined and tested.
The final questionnaire includes questions for measuring demographic factors, socio-economic factors and personal factors like technological orientation. Furthermore, there are questions to capture responses concerning technology adoption and usage determinants like perceived ease of use, perceived usefulness, etc., as well as questions regarding usage spaces.

Chapter 10 Contribution
A model for representing the motivational and cultural factors that influence mobile phone usage variety 214
The questionnaires have not been standardised but they provide an extensive set of questions pertaining to mobile phone usage behaviour, as well as groups of questions with internal consistency in measuring specific demographic and cultural dimensions.
10.5 SUMMARY This chapter discussed the contribution of this study by looking at the scientific and product
contributions respectively. From a scientific perspective this research has tested and confirmed the existing theory on usage spaces by Marcus and Chen, and concepts and elements of TAM, UTAUT as well as the model by Kwon and Chidambaram. This research has also replicated technology adoption and usage models by focusing on personal mobile phone usage.
MOPTUM extends and refines existing models for mobile phone adoption and usage by differentiating actual use into usage variety, usage breadth and usage intensity. Usage variety is differentiated into the usage spaces of safety and security, relationships, organisation, personal information, non-personal information, m-commerce, entertainment, personal history, image, expansion and philanthropy.
MOPTUM integrates concepts and models from different fields, notably sociology, CSCW, psychology, HCI and marketing which means that the studies contribute towards bridging the gap between research projects from different fields. MOPTUM involves the integration of different research approaches that operate at different degrees of specification and detail. This makes the model vulnerable to criticism since it may be regarded as too vague from one perspective and too limited from another. Nevertheless, MOPTUM contributes a basis from which more specific research in these fields may be conducted.
The product contribution is considered from the perspective of the user, the designer and the marketer. Due to practical difficulties as a result of market competition and regulation, only the user perspective has been evaluated successfully. However, given the increased market saturation, and comments from marketers, understanding user needs will become more important in future and therefore guidance on improving sales support will become a priority.
Due to practical difficulties, no designer has as yet evaluated the product. Nevertheless, given the tensions between the continuous addition of new features and the constraints on human cognition, the pressure to make the optimal selection of features should make MOPTUM useful to designers.

Chapter 11 Reflection and conclusion
A model for representing the motivational and cultural factors that influence mobile phone usage variety 215
CHAPTER 11: REFLECTION AND CONCLUSION
11.1 INTRODUCTION This final chapter contains a summary of this research, a reflection on the research and the conclusions
and research opportunities for future work. Section 11.2 contains a summary of the research. Having considered what has been done and achieved in this study, section 11.3 constitutes a reflection on what could have been done and why the study was conducted as described in this thesis. This section includes a discussion of aspects related to this research that have not been covered in this study and provides justification for the scope of the study. Section 11.4 concludes this study and section 11.5 looks at possible research opportunities arising from the study.
11.2 SUMMARY OF THE RESEARCH In summarising this research, the research question is repeated in section 11.2.1 and then the findings
in response to the questions are discussed in section 11.2.2. MOPTUM, as the model that integrates the findings to address the main research questions, is presented in section 11.2.3.
11.2.1 Research questions
The main research question for this study is as follows: What are the components of a model to represent the influence of motivational needs and cultural factors on mobile phone usage variety?
In order to disentangle the issues, the following sub-questions were identified:
• Is there a link between motivational needs and mobile phone usage variety?
• What are the cultural factors that influence mobile phone usage variety?
• Does mobile phone usage conform to the cultural context of the user?
• Can usage spaces represent usage variety in a way that is usable and useful to mobile phone users, designers and marketers?
• Can Marcus’s usage spaces model be supported by empirical evidence?
• Does infrastructure influence mobile phone usage
11.2.2 Response to the research sub-questions
The main findings of this research in relation to each research question will now be discussed. Each question is followed by a discussion of the findings relating to that question.
• Is there a link between motivational needs and mobile phone usage variety?

Chapter 11 Reflection and Conclusion
A model for representing the motivational and cultural factors that influence mobile phone usage variety 216
The idea that there could be a link emerged from the groupings found in the factor analysis done on the frequency of use data in the pilot study (section 7.3). The usage frequency of features clustered around something for which motivational human needs seemed to be the most apt description. These groupings were also evident in the factor analysis performed on the frequency of use data in the survey (section 7.7).
The verifications survey data analysis (section 9.2.3.2) shows the correlations found between the importance participants attributed to a motivational need and the usage space that supports that motivational need. Based on these findings it is proposed that there is a link between motivational needs and mobile phone usage variety.
• What are the cultural factors that influence mobile phone usage variety?
The approach chosen to investigate this question is the first decision in a series of decisions that affected the findings. Therefore it has to be acknowledged that there are many cultural factors that influence mobile phone usage variety and this study can only report on those selected for investigation. According to the findings of this study as described in section 7.3 and section 8.2.1, the cultural dimensions of uncertainty avoidance and individualism/collectivism influence mobile phone usage. The study has also produced new constructs, namely:
o Independence to explore and solve problems
o Efforts to maximise time and technology
o Independence from assistance.
Nevertheless, further research is needed to decide whether these constructs are indeed new cultural dimensions or whether they are manifestations of existing dimensions.
• Does mobile phone usage conform to the cultural context of the user?
According to the findings of this study as described in section 8.2, mobile phone usage does not always conform to the cultural context of the user.
• Can usage spaces represent usage variety in a way that is usable and useful to mobile phone users, designers and marketers?
This study started out by looking for cultural factors that could influence mobile phone usage. However, the findings suggest hat motivational human needs, rather than cultural factors, are useful in understanding mobile phone usage. This does not mean that cultural factors are not relevant, only that more research is needed to explain the findings of this study.
The finding on the relevance of motivational human needs for mobile phone usage is the basis for the usage spaces proposed. Based on the discussion in section 8.2 and the evaluation of the MOPTUM model with participants from different age groups as discussed in section 9.3, it is concluded that usage spaces can represent usage variety in a way that is usable and useful to mobile phone users, designers and marketers.
• Can Marcus’s usage spaces model be supported by empirical evidence?
Based on the findings discussed in section 8.2 it is concluded that Marcus’s usage spaces can be supported by empirical evidence.

Chapter 11 Reflection and Conclusion
A model for representing the motivational and cultural factors that influence mobile phone usage variety 217
• Does infrastructure influence mobile phone usage?
This question was answered affirmatively by the literature study in Chapter 2 and confirmed by the results of the survey and verification survey.
11.2.3 The MOPTUM model
As a synthesis from the findings in this research and existing models for mobile phone adoption and usage, the MOPTUM has been developed. MOPTUM is the response to the main research question, since MOPTUM presents the components of a model to represent the influence of motivational and cultural factors on mobile phone usage variety.
The MOPTUM consists of factors determining mobile phone usage and factors mediating mobile phone usage. The determining factors are social influence, facilitating conditions, perceived ease of use, perceived usefulness and behavioural intention to use. The mediating factors are demographic factors, socio-economic factors and personal factors. The following relationships between determining factors are affected by the mediating factors:
• Social influence and perceived ease of use.
• Social influence and perceived usefulness.
• Social influence and behavioural intention to use.
• Perceived ease of use and behavioural intention to use.
• Perceived usefulness and behavioural intention to use.
• Behavioural intention to use and actual system use.
• Facilitating factors and behavioural intention to use.
• Facilitating factors and actual system use.
Actual system use is differentiated into usage intensity, usage breadth and usage variety. Usage variety is differentiated into the usage spaces of safety and security, relationships, organisation, personal information, non-personal information, m-commerce, entertainment, personal history, image, expansion and philanthropy.
11.3 REFLECTION In section 11.3.1 the study is considered from a methodological view, in section 11.3.2 from a
scientific view and in section 11.3.3 the study is discussed in the context of other research.

Chapter 11 Reflection and Conclusion
A model for representing the motivational and cultural factors that influence mobile phone usage variety 218
11.3.1 Methodological reflection
This study involves elements from the fields of sociology, CSCW, HCI, psychology, and marketing. The methodologies used in these fields range from totally qualitative to totally quantitative. Someone looking at this study from a sociological standpoint may find the methodology too restrictive and argue that the data capturing and analysis is not rich enough. On the other hand, someone from the field of marketing may argue that the samples are too small and the statistical analysis too exploratory and even simplistic.
Nevertheless, my position remains that this was the most appropriate method for addressing the research problem. Based on MOPTUM it would be useful to do a qualitative study, possibly using activity theory. On the other hand, a quantitative study involving a large sample of participants, confirmatory factors analyses and rigorous analyses of variance would be useful.
The development of the MOPTUM model was necessary as the base for this future research. Reflecting on the methodology, the issue of qualitative versus quantitative research design will be consider ed in section 11.3.1.1, questionnaire design in 11.3.1.2, questionnaire administration in 11.3.1.3, the analyses of the data in 11.3.1.4, the notation of MOPTUM in 11.3.1.5, and the evaluation in 11.3.1.6.
11.3.1.1 The Qualitative versus the quantitative approach
In researching the factors that influence mobile phone use, the researcher is confronted with both technical and social issues. In researching social issues the qualitative approach is indispensable and it has to be acknowledged that the observations are influenced by the perceptions of the researcher, even though the aim of science is to bring the perceptions as close as possible to the real world.
The qualitative data gathering was aided by daily involvement with the way people from different demographic groups use mobile phones. This was useful in understanding which features are related to which uses, and the reasons why people do, or do not, use certain features.
However, there is the danger that one may become over-familiar with the situations and hence find it difficult to identify and describe behaviour that has become automatic and integrated. This made the questionnaire an indispensable part of the research because it forced the action of taking a step back and thinking about what could influence people in using mobile phones.
While acknowledging that relationships are context-specific, Frazer [Fraser, 2003:7] notes that ‘a causal relationship that constantly generalises across individuals, time and space, is a better and better candidate for a true representation of the objective world.’
Quantitative methods were employed for finding and representing causal relationships. These relationships were not obvious from the qualitative observations. For example, exploratory factor analyses allowed usage dimensions to emerge, but the usefulness had to be verified against the qualitative observations.

Chapter 11 Reflection and Conclusion
A model for representing the motivational and cultural factors that influence mobile phone usage variety 219
11.3.1.2 Questionnaire design
No suitable existing questionnaire could be found, since the existing questionnaires focused on only one aspect of mobile phone, e.g. m-commerce and VOIP. Therefore a new questionnaire had to be designed. Designing a new questionnaire is a time-consuming and very difficult task, the magnitude of which is rarely appreciated at the beginning.
Some questions from existing questionnaires on cultural dimensions were used, but they were originally meant to capture human-human interaction and when adapted for human-computer interactions, the internal validity of the groups of questions was unacceptably low. After the pilot study some of these questions were dropped as it was felt that the questions could not be improved upon. In other words, the problem was not in the wording of the question and evidence was found that other surveys also had problems with capturing these dimensions (see section 6.12.6). Hence, no further attempt was made to capture time-orientation, male/female and power distance dimensions. With the benefit of hindsight, it would have been better to retain the questions since the remaining dimensions emerged stronger in the survey and it is possible that these dropped dimensions would have tested stronger too.
However, the survey already had more than 110 items (responses required to questions) at that stage, and it was necessary to remove some items due to time and cognitive constraints of the participants. The survey eventually contained 98 items. In general, it is recommended that items be kept throughout a survey since the usefulness of a question cannot be assessed before all the data have been analysed.
Another problem is that the researcher gradually becomes more informed about what information would be useful. This is especially evident in the questionnaire design where the verification questionnaire contains questions that would have been very valuable from the beginning. Therefore the use of standardised questionnaires is recommended where these do in fact exist.
In retrospect, the questionnaire for the survey should have included more open-ended questions to cater for qualitative responses. These responses could have provided more insight into ‘why’ people choose specific behaviours. However, the open-ended questions that were included were not answered comprehensively. This could be because the fixed-response questions require less mental effort or because of the large number of questions in the questionnaire.
11.3.1.3 Questionnaire administration
The questionnaires were administered to university students through personal contact by the researcher. Given the fact that the questionnaires were anonymous and attendance and participation was optional, the researcher should not have influenced the outcome by being present. The only influence was that of requesting that they should complete all the questions and that is not considered detrimental to the objectivity of the survey.
It was attempted to obtain input from children of school-going age and the Gauteng Education Department was contacted in this regard (Gauteng is a province of South Africa). The governmental

Chapter 11 Reflection and Conclusion
A model for representing the motivational and cultural factors that influence mobile phone usage variety 220
regulations that the parents should give written permission before children could complete a questionnaire made it impossible to pursue this route.
Conducting a web survey was considered but the maximum recommended time for a web survey is 10 minutes [Toledano, 2005] and since this survey took at least 20 minutes the web was not a viable option. Another problem is that many students in South Africa have restricted web access and therefore it was unlikely that they would spend time filling in a questionnaire unless there was a very incentive.
11.3.1.4 Analyses
Statistical analysis is a tool for visualising, confirming or disproving ideas expressed as hypotheses. Descriptive statistics were useful for visualising the responses of a group of participants in order to contextualise the findings. The explorative statistics and optimal scaling were useful for finding new dimensions and verifying dimensions. Unfortunately, the survey sample was too small for confirmatory factor analyses and analyses of variance.
The research was hampered by the limitations of self-reporting. This problem is counteracted by considering the findings from different groups and triangulating those with observations. Taking all this into account and accepting the limitations noted, I believe the data gathering and analyses were appropriate to the research question.
11.3.1.5 Notation for representing the model
Notations for representing models range from textual descriptions to mathematical notations. Representing the findings in the format used in marketing is a compromise between the textual description models often used in psychology and sociology, the diagrams used in marketing and the formal representation often used in computer science.
Initially the use of an ontology for representing the model was investigated, but to be comparable to other technology adoption models, MOPTUM is represented at the same level as TAM and UTAUT. However, the strength of the correlations between the components is not indicated. The reason is that MOPTUM is based on quantitative findings, qualitative observations and existing models.
On the one hand it is a limitation that the strength of the correlations between components is not indicated, but on the other it allows for the inclusion of qualitative observations (confirmed by literature) that would otherwise be lost. For example, personal factors that mediate the social influence on perceived usefulness could not be confirmed statistically but were included based on the observations of this relationship and the fact that it has been noted in literature.
11.3.1.6 Evaluation
People seem to enjoy discussing mobile phones and their own mobile phone usage. They take pride in the way they use their mobile phones whatever their usage behaviour, from innovator to laggard. Mobile

Chapter 11 Reflection and Conclusion
A model for representing the motivational and cultural factors that influence mobile phone usage variety 221
phone usage is apparently not considered confidential and people mostly volunteered more information than was requested.
The situation with mobile phone service providers and handset providers is totally different. Companies are interested in acquiring information, but cautious about sharing any information not related to the available mobile phone specifications.
The marketing managers of two mobile phone companies were contacted with the request that they evaluate a model for mobile phone adoption and usage. The managers were willing to do the evaluation on condition that the model was sent to them electronically before the meeting. This was problematic for two reasons. Firstly, MOPTUM has not been published and secondly, the current format of MOPTUM requires some explanation before use. The components of the model will have to be translated into a more comprehensible ‘layman’s format before the model can be used independently.
Based on this experience it was decided to postpone the evaluation with the marketer and designer until after the completion of this thesis.
11.3.2 Scientific reflection
The scientific reflection considers the contribution of this research to the existing body of knowledge in the area. TAM has been the basis for much research on technology adoption and usage, and other models such as UTAUT and the mobile phone adoption and usage model have followed. Nevertheless, most of these studies focus on adoption and none of them extend to actual use. The main scientific contribution of this study is to extend mobile phone adoption and usage models to model mobile phone usage variety. The scientific contribution is discussed in more detail in section 10.3.
Another contribution is the identification of personal factors as a mediating influence in mobile phone use. Personality has been excluded from the scope of this study, but personality attributes could be useful in explaining user behaviour due to the very personal relations people have with their mobile phone.
11.3.3 Substantitative reflection
Reflecting on this research and comparing it to other studies in the field of HCI, I realise that the scope was very wide. Most other studies focus on one aspect of mobile phone behaviour i.e. using VOIP or mobile data services, and this makes it easier to stay focused and drill down deep. However, the wide scope made it possible to capture more factors and their interactions which make the contribution unique.
Mobile phone usage is subject to changes in technology, costing and infrastructure. Therefore a repeat of this study at a later date will probably produce a new set of features related to each usage space but the determining factors, mediating factors and usage spaces identified in MOPTUM should still be valid. Capturing and describing the situation at this point in time should also have reference value at a later stage.

Chapter 11 Reflection and Conclusion
A model for representing the motivational and cultural factors that influence mobile phone usage variety 222
11.4 CONCLUSION MOPTUM has been developed in response to the research question ‘What are the components of a
model for representing the motivational and cultural factors that influence mobile phone usage?’ Based on the evaluation of MOPTUM as described in Chapter 9, MOPTUM meets the criteria set for
the evaluation of a model in section 6.9 to the extent that it can be proposed as a model for representing the motivational and cultural factors that influence mobile phone usage, within the scope and constraints of this research. Therefore I propose the acceptance of the hypothesis, namely that a model for representing the motivational and cultural factors that influence of mobile phone usage variety can be developed.
11.5 RECOMMENDATIONS FOR FURTHER RESEARCH This study contributes various opportunities for further research, notably:
• The concept of applying modified technology adoption models for modelling technology usage.
• MOPTUM proposes the inclusion of facilitating factors such as cost and infrastructure relevant to the mobile phone scenario. More research is needed to monitor this factor in the rapidly changing mobile environment.
• MOPTUM proposes the inclusion of personal factors as a mediating influence in determining mobile phone usage behaviour. This opens up the question about the influence of personality traits on mobile phone usage behaviour.
• The identification of new mobile phone usage spaces adds new knowledge and creates new research challenges in verifying, structuring and expanding the model to other demographic groups.
• MOPTUM applies to mobile phone research but the possibility of generalising this model to other mobile applications, such as PDA’s, and technology usage in general, warrant investigation.
• The suggested link between usage spaces and motivational needs warrants further research since this will give a new perspective in HCI research on user needs which have mostly been task- oriented.
• The question of linking mobile phone features and services to usage spaces is very important from a designer point of view. However, the transient nature of features and the subjectivity of what people may understand under ‘entertainment’ for example, could limit the usefulness and make the model even more vulnerable to change.
• The grouping of usage spaces into core and additional spaces suggests that other quality attribute groupings, such of those proposed by Kano, may also apply to mobile phone features. This may be useful to marketers and designers, and hence may be researched from a design perspective or from a marketing perspective.
•

Chapter 11 Reflection and Conclusion
A model for representing the motivational and cultural factors that influence mobile phone usage variety 223
11.6 FINAL REFLECTION A doctoral thesis shows a remarkable resemblance to fantasy literature. It all starts with an immense
problem that can only be solved by acquiring some artefact of power. Obtaining the artefact involves a quest, an epic journey in search of a solution that will presumably change the fate of mankind.
Unaware and ill-equipped for the conflicts, trials and tribulations ahead, the researcher wanders into distant, foreign and often hostile territories, unwittingly fuelling the fires between long-warring factions.
Along the way the researcher is helped and saved by some, betrayed and led astray by other. Not all movement is progress and often the researcher has to retrace steps in going back to a place where things still made sense. The researcher rarely finds what he or she was looking for, but invariably finds something of value that ends the journey. Often this solution is just the realisation of what the problem really is …

A model for representing the motivational and cultural factors that influence mobile phone usage variety 224
LIST OF FIGURES Figure 1.1: Thesis map ................................................................................................................................. 16 Figure 2.1: Key players in mobile infrastructure provision (based on [Rondeau, 2005]) ............................ 27 Figure 3.1: Maslow’s hierarchy of motivational needs ................................................................................ 35 Figure 3.2 Mapping Herberg’s needs to Maslow’s adapted from Verma [Verma, 1995] ............................ 37 Figure 3.3: Quality factors based on the model of the Institute for Manufacturing [2006].......................... 39 Figure 4.1: Diagrammatic representation of the TRA adapted from [Davis et al., 1989] ............................ 60 Figure 4.2 : Technology Adoption Model (TAM) [[Davis et al., 1989]....................................................... 61 Figure 4.3: Expressing Rogers’ adopter groups as a percentage of the population...................................... 66 Figure 4.4: Usage Spaces based on Marcus and Chen [Marcus and Chen, 2002a; Marcus, 2005b]............ 78 Figure 5.1: Factors involved in this study .................................................................................................... 87 Figure 6.1: Research phases in this study................................................................................................... 103 Figure 7.1: Priority issues on buying a mobile phone ................................................................................ 117 Figure 7.2: Age distribution ....................................................................................................................... 122 Figure 7.3: Mother-tongue distribution ...................................................................................................... 123 Figure 7.4 : Gender distribution and technological development............................................................... 124 Figure 7.5: Distribution between mobile phone brands.............................................................................. 125 Figure 7.6: Question 12: plot on preference to multi-task.......................................................................... 132 Figure 7.7: Question 13 - plot on keeping old phone (uncertainty avoidance) .......................................... 133 Figure 7.8: Question 14 - explore different ways to use phone plot (uncertainty avoidance).................... 134 Figure 7.9: Question 15 –new feature use plot (uncertainty avoidance) .................................................... 135 Figure 7.10: Question 16 – unfamiliar situations plot (uncertainty avoidance) ......................................... 136 Figure 7.11: Question 17 – Uncertainty avoidance .................................................................................... 137 Figure 7.12: Question 18 – plot on solving cell phone problems (individualism/collectivism)................. 138 Figure 7.13: Question 19 – plot on working with family (individualism/collectivism) ............................. 139 Figure 7.14: Question 20 – plot on sharing phone (individualism/collectivism) ....................................... 140 Figure 7.15: Second optimal scaling result ................................................................................................ 142 Figure 7.16: Frequency of use per feature.................................................................................................. 148 Figure 7.17: Optimal scaling plot on full set of features ............................................................................ 152 Figure 7.18: Optimal scaling plot after removal of group 1 features ......................................................... 152 Figure 7.19: Optimal scaling plot after removal of groups 1, 2 and 3........................................................ 153 Figure 7.20: Optimal scaling plot after removal of groups 1, 2, 3 and 4.................................................... 153 Figure 8.1: Distinguishing components of the model................................................................................. 165 Figure 8.2: Mobile phone technology usage model (MOPTUM) .............................................................. 166 Figure 8.3: Two categories of usage spaces ............................................................................................... 170 Figure 9.1: Language distribution according to mother-tongue ................................................................. 183 Figure 9.2: Relative importance attributed to usage spaces based on question 49..................................... 196 Figure 9.3: Relative importance attributed to usage spaces based on question 50..................................... 197 Figure 9.4: MOPTUM with verified components and relations in solid lines ........................................... 203

A model for representing the motivational and cultural factors that influence mobile phone usage variety 225
LIST OF TABLES Table 2.1: A comparison of 1G, 2G and 3G mobile communication technology ........................................ 19 Table 6.1: Comparison of language distribution ........................................................................................ 110 Table 7.1: Results from the interviews....................................................................................................... 114 Table 7.2: Summary of sales people’s responses ....................................................................................... 116 Table 7.3: Reliability of cultural dimensions ............................................................................................. 118 Table 7.4: Reliability analyses ................................................................................................................... 119 Table 7.5: Independent samples t-test (2-tailed) ........................................................................................ 124 Table 7.6: Technological development based on the answers to questions 5, 6, 7, 8................................. 127 Table 7.7: Technological development based on the answers to questions 5, 6, 7 and 8........................... 128 Table 7.8: Reliability analyses on recoded values of Questions 5,6,7,8..................................................... 128 Table 7.9: Uncertainty avoidance based on the answers to Questions 13, 14, 15, 16 and 17 .................... 129 Table 7.10: Reliability statistics on questions 13, 14, 15, 16 and 17.......................................................... 129 Table 7.11: Individualism/collectivism on Questions 18, 19 and 20 ......................................................... 130 Table 7.12: Reliability statistics on Questions 18, 19 and 20..................................................................... 130 Table 7.13: Model summary for optimal scaling of questions 12 to 20 ..................................................... 131 Table 7.14: Question 12 - division on preference to multi-task ................................................................. 132 Table 7.15: Question 13 - keeping old phone (uncertainty avoidance) ...................................................... 133 Table 7.16: Question 14 – explore different ways to use phone (uncertainty avoidance).......................... 134 Table 7.17: Question 15 – new feature use (uncertainty avoidance).......................................................... 135 Table 7.18: Question 16 – unfamiliar situations (uncertainty avoidance).................................................. 136 Table 7.19: Questions 18 – solving problems (individualism/collectivism) .............................................. 138 Table 7.20: Question 19 - working with family (individualism/collectivism) ........................................... 139 Table 7.21: Question 20 - Individualism/collectivism ............................................................................... 140 Table 7.22: Model Summary for questions 12 to 24 .................................................................................. 141 Table 7.23: Cross-tabulation (Questions 13 and 16) .................................................................................. 143 Table 7.24: Comfort with unfamiliar (Questions 13 and 16) ..................................................................... 143 Table 7.25: Cross-tabulation (Questions 15 and 19) .................................................................................. 143 Table 7.26:Independence from assistance (Questions 15 and 19).............................................................. 144 Table 7.27: Cross-tabulation (Questions 14 and 18) .................................................................................. 144 Table 7.28: Independence to explore and solve problems (Questions 14 and 18) ..................................... 144 Table 7.29: Cross-tabulation on time and technology(Questions 12 and 24)............................................. 144 Table 7.30: Efforts to maximize time and technology (Questions 12 and 24) ........................................... 145 Table 7.31: Cross-tabulation on family orientation (Questions 20, 21 and 22).......................................... 145 Table 7.32: Family orientation (Questions 20, 21 and 22) ......................................................................... 145 Table 7.33: Reliability analyses on question capturing priorities on buying.............................................. 146 Table 7.34: Factor analysis on priorities on buying data............................................................................ 147 Table 7.35: Factor analysis on features ...................................................................................................... 150 Table 7.36: Summary of significant correlations ....................................................................................... 155 Table 8.1: Supporting evidence for determining factors in MOPTUM...................................................... 167

A model for representing the motivational and cultural factors that influence mobile phone usage variety 226
Table 8.2: Supporting evidence for mediating factors in MOPTUM......................................................... 168 Table 8.3: Supporting evidence for actual system use components in MOPTUM..................................... 169 Table 8.4: Supporting evidence for core usage spaces in MOPTUM ........................................................ 171 Table 8.5: Supporting evidence for additional usage spaces in MOPTUM ............................................... 172 Table 9.1: Relating the questions in the questionnaire to some of the components in MOPTUM ............ 180 Table 9.2: Relating questions 9 to 37 to usage spaces................................................................................ 182 Table 9.3: Reliability of technological advancement responses................................................................. 184 Table 9.4: Group statistics for t-test on infrastructural variables ............................................................... 184 Table 9.5: One-sample t-test on infrastructure variables............................................................................ 185 Table 9.6: Correlations between individual questions and the importance attributed to the usage space .. 189 Table 9.7: Reliability of perceived ease of use (PEU) questions ............................................................... 190 Table 9.8: Reliability of perceived usefulness (PU) questions................................................................... 190 Table 9.9: Reliability of attitude (A) questions .......................................................................................... 190 Table 9.10: Reliability of facilitating conditions........................................................................................ 191 Table 9.11: Components of the MOPTUM and technological influence ................................................... 192 Table 9.12 Components of the MOPTUM and infrastructural variables ................................................... 194 Table 9.13: Usage frequency...................................................................................................................... 198 Table 9.14: Usage breadth in terms of numbers stored .............................................................................. 198 Table 9.15: Usage spaces relevant to the participants’ mobile phone usage.............................................. 200

A model for representing the motivational and cultural factors that influence mobile phone usage variety 227
REFERENCES 12Manage Rigor and Relevance. (2006). Retrieved 2006/08/25 from
http://www.12manage.com/methods_rogers_innovation_adoption_curve.html 9241-11, I. (1998). Guidance on Usability, Retrieved 2006/03/13 from
http://www.iso.org/iso/en/CatalogueDetailPage.CatalogueDetail?CSNUMBER=16883 Ackerman, M. S. (2000). The Intellectual Challenge of CSCW: The Gap Between Social Requirements
and Technical Feasibility. In Human-Computer Interaction, J. Carroll (Eds.),15(2/3):181-203: Addison-Wesley.
Adner, R. (2003). How Nokia won the Mobile revolution in the 1990s. Retrieved 2006/10/17 from http://faculty.insead.fr/adner/PREVIOUS/Projects-May03/How%20Nokia.pdf
Adomi, E. E. (2006). Mobile phone usage patterns. Electronic journal of Academic and Special librarianship, Vol. 7: 1-11.
Agrawal, P., & Famolari, D. (1999). Mobile computing in next generation wireless networks. Paper presented at the Proceedings of the 3rd international workshop on Discrete algorithms and methods for mobile computing and communications, Seattle, Washington, United States: 32-39, ACM Press New York, USA.
Alahatuha, P., Ahola, J., & Hakala, H. (2005). Mobilizing business applications: a survey about the opportunities and challenges of mobile business applications and services in Finland. In Technology Review of Tekes 167/2005. 1:1-54. Helsinki.
Ali-Vehmas, T., & Luukkainen, S. (2005). Service Diffusion Strategies for Push to Talk over Cellular. In International Conference on Mobile Business (ICMB'05. :427-433: IEEE.
AllExperts. (2006). Maslow's hierarchy of needs. Retrieved 2006/09/22 from http://experts.about.com/e/m/ma/Maslow's_hierarchy_of_needs.htm
Anandarajen, M., Igbaria, M., & Anakwe, U. P. (2002). IT acceptance in a less-developed coutry: A motivational factor perspective. International Journal of Information Management, 22(1):47 - 65.
Ark, W. S., & Selker, T. (1999). A look at human interaction with pervasive computers. IBM Systems Journal, 38(4):504-507.
Aykin, N. (2005). Overview: Where to start and what to consider. In Usability and Internationalization of Information Technology, N. Akin (Eds.):3-20. London: Lawrence Erlbaum Associates.
Badre, A. N. (2002). Shaping web usability: Addison-Wesley. Baffoy, S. (2000). 'We are all equal in the eyes of God.'segmentation of the mobile phones market: a study
of the strategies of Ericsson, Nokia and Motorola, Master’s Thesis in Marketing, Stockholm School of Economics, Stockholm.
Balaji, T. S., Landers, B., Kates, S. J., & Moritz, B. (2005). A Carrier’s Perspective on creating a mobile multimedia service. Communications of the ACM, Vol. 48: 49-53.
Barnes, S., & Huff, S. L. (2003). Rising sun: iMode and the wireless Internet. Communications of the ACM, 46(11):78-84.
Baumgartner, V. (2003). A practical set of cultural dimensions, Masters thesis, FH Joanneum, Graz.

A model for representing the motivational and cultural factors that influence mobile phone usage variety 228
Berger, P. D., & Maurer, R. E. (2002). Experimental Design: with applications in management, engineering, and the sciences Belmont, California: Duxbury/Thomson Learning.
Bina, M., & Giaglis, G. M. (2005). Exploring Early Usage Patterns of Mobile Data Services. In International Conference on Mobile Business (ICMB'05):363-369: IEEE.
Blom, J., Chipcase, J., & Lehikoinen, J. (2005). Contextual and Cultural Challenges for User Mobility Research. Communications of the ACM, 48(7):37-41.
Boehm, B. W. (1984). Verifying and validating software requirements and design specification. Software, IEEE, 1(1):75-88.
Boyancigiller, N. A., & Adler, N. J. (1995). The parochial dinosaur: organisational science in a global context. In Cross-cultural management, T. Jackson (Eds.):9-37. London: Oxford: Butterworth-Heinemann.
Brewster, S. (2002). Overcoming the lack of screen space on mobile computers. Personal and Ubiquitous Computing, 6(3): 188-205.
Brome, R. (2005). Camera photo shoot out. Retrieved 2005/11/11 from http://www.phonescoop.com/articles/camera_phones_20_02/
Brown, B., & Randell, R. (2004). Building a context sensitive telephone: some hopes and pitfalls for context sensitive computing. CSCW Journal, 13(3-4):329-345.
Buchanan, G., Farrant, S., Marsden, G., & Pazzani, M. (2001, May 1-5). Improving Mobile Internet Usability. Paper presented at the 10th international conference on World Wide Web, Hong Kong, China: 673 - 680, ACM.
Campbell, S. W., & Russo, T. C. (2003). The Social Construction of Mobile Telephony: An application of the Social Influence Model to Perceptions and Uses of Mobile Phones within Personal Communication Networks. Communication Monographs, 70(4):317-334.
Carrol, J. M. (2001). The Evolution of Human-Computer Interaction. Retrieved 2005-11-02 from http://www.awprofessional.com/articles/article.asp?p=24103
Chen, C., Panjwani, G., Proctor, J., Allendoerfer, K., Kuljis, J., Aluker, S., Sturtz, D., & Vukovic, M. (2005). Visualizing the Evolution of HCI. In People and Computers XIX - The Bigger Picture, J. G. Tom McEwan, David Benyon (Eds.):233-250. Edinburg: Springer.
Chen, G., & Kotz, D. (2000). A survey of context-aware mobile computing research. (No. TR2000-381). Hanover, NH: Dartmouth College.
Choi, B., Lee, I., Kim, J., & Jeon, Y. (2005). A qualitative cross-national study of cultural influences on mobile data service design. In SIGCHI 2005, Conference on Human factors in Computing Systems, 1:661-670. Portland, Oregon: ACM Press.
Chung, K. H. (1969). A Markov Chain Model of Human Needs: An Extension of Maslow's Need Theory. Academy of Management Journal, 12(2):223-234.
Cockton, G. (2004). Value-Centred HCI. In Proceedings of the third Nordic conference on Human-computer interaction (NordiCHI '04), C. Gram & G. Cockton (Eds.),82(149-160. Tampere: ACM.
Coen, A., Dai, L., Herzig, S., Gaul, S., & Linn, V. (2002). The Analysis: Investigation of the Cellular Phone Industry. Retrieved 2006/08/25 from http://web.syr.edu/~spgaul/Final%20Essay%204.1.doc

A model for representing the motivational and cultural factors that influence mobile phone usage variety 229
Cooper, A. (1999). The inmates are running the asylum: why high tech products drive us crazy and how to restore the sanity Indianapolis, Indiana: SAMS.
Cooper, M. (2001). Internet: A Life-Changing Experience. Multimedia, IEEE, 8(2):11-15. Coulton, P., Rashid, O., Edwards, R., & Thompson, R. (2005). Creating entertainment applications for
cellular phones. Computers in Entertainment, 3(3):3-14. Croasmun, J. (2004). Are Ergonomists Really Consulted in Mobile Phone Design? Ergoweb,Retrieved
2005/09/16 from http://www.ergoweb.com/news/. Davis, F. D. (1989). Perceived Usefulness, Perceived Ease of Use, and User Acceptance of Information
Technology. MIS Quarterly, 13(3):319-340. Davis, F. D., Bagozzi, R. P., & Warshaw, P. R. (1989). User acceptance of computer technology: A
comparison of two theoretical models. Management science, 35(8):982-1003. De Wet, L., Blignaut, P., & Burger, A. (2002). Comprehension and usability variances among multicultural
web users in South Africa. In CHI '02 Extended Abstracts Conference on Human Factors in Computing Systems :526 - 527. Minneapolis, Minnesota, USA: ACM Press.
Deci, E. L., & Ryan, R. M. (2000). The "What" and 'Why" of Goal pursuits: Human Needs and Self-Determination of Behaviour. Psychological Inquiry, 11(4):227-268.
Del Gado, E. M. (1996). Culture and Design. In International User Interfaces, E. M. Del Gado & J. Nielsen (Eds.):276. New York: Wiley.
Dey, A. K., D, A. G., & D, S. (2001). A conceptual framework and a toolkit for supporting the rapid prototyping of context-aware applications. Human-Computer Interaction, 16(2-4):97-166.
Dix, A., Finlay, J., Abowd, G., & Beale, R. (1998). Human-Computer Interaction 2 nd ed.: Prentice Hall Europe.
Donner, J. (2004). "Microentrepreneurs and Mobiles: An Exploration of the Uses of Mobile Phones by Small Business Owners in Rwanda. Information Technologies and International Development, 2(1):1-21.
Dourish, P. (2001). Seeking a Foundation for Context-aware Computing. Human-Computer Interaction, 16(2-4):229-241.
Dourish, P., & Button, G. (1998). On ' Technology': Foundational Relationships Between Ethnomethodology and System Design. By: Dourish, Paul; Button, Graham. Human-Computer Interaction, 1998, Vol. 13 Issue 4, p395, 38p, 2 diagrams. Human Computer Interaction, 13(4):395-
432. Duchatelet, M. (2001). Cultural diversity and management/leadership models. American Business
Review:96-99. Dunlop, M., & Brewster, S. (2002). The Challenge of Mobile Devices for Human Computer Interaction.
Personal and Ubiquitous Computing, 6(4):235–236. Field, A. (2005). Discovering statistics using SPSS 2 ed. London: Sage. Field, A., & Hoyle, G. (2005). How to design and report experiments London: SAGE Publications. Fishbein, M., & Ajzen, I. (1975). Belief, Attitude, Intention and Behaviour: An Introduction to Theory and
Research Reading, MA.: Addision-Wesley.

A model for representing the motivational and cultural factors that influence mobile phone usage variety 230
Fitzgerald, W. (2004). Models for Cross-Cultural Communications for Cross-Cultural Website Design. (No. 46563): National Research Council Canada, Institute for Information Technology.
Fitzpatrick, G., & Bruza, P. (2000, April 1-6, 2000). Views on Context in the Enterprise. Paper presented at the Workshop at CHI 2000, ACM Conference on Human Factors in Computing Systems., The Hague. The Netherlands.:
Følstad, A., & Rahlff, O. (2005). Challenges in Conducting User-Centered Evaluations of Mobile Services. Paper presented at the HCI International -11th International Conference on Human-Computer Interaction, C. Stephanidis (Eds.). Las Vegas, Nevada, USA.
Ford, G. (2005). Researching the effects of culture on usability, Thesis (M.Sc) - University of South Africa, University of South Africa, Pretoria.
Ford, G., & Gelderblom, H. (2003). The effects of culture on performance achieved through the use of human computer interaction. In Proceedings Conference of South African institute of Computer Scientists and Information Technologists, J. Eloff, A. Engelbrecht, P. Kotzé, M. Eloff & (Eds.):218-230. Port Elizabeth: ACM.
Ford, G., & Kotze, P. (2005a). Designing usable interfaces with cultural dimensions. In Human-computer interaction - INTERACT 2005:, M. F. Constabile & F. Paterno (Eds.), Rome, Italy, LNCS 3585:713-726, Berlin: Springer.
Ford, G., & Kotze, P. (2005b). Researching culture and usability - a conceptual model of usability. In People and computers XIX: the bigger picture: proceedings of HCI 2005, T. McEwan, J. Gulliksen & D. Benyon (Eds.),1:317-333. Edinburg: London: Springer.
Fraser, K. (2003). Which methodology should I choose? Qualitative, Quantitative or both? Retrieved 2006/09/35 from http://www.angelfire.com/psy/k_fraser
Geoghegan, W. H. (1994,). What ever happened to instructional technology? Paper presented at the 22nd Annual Conference of the International Business Schools Computing Association, 17-20 July . Baltimore, Maryland.
Geser, H. (2004). Towards a Sociological Theory of the Mobile Phone. Retrieved 2006/03/21, from file:///C:/aPhD/Referenced_Mobile/Geser.pdf
Gilbert, A. L., & Kendall, J. D. (2003). A marketing model for mobile wireless services. Proceedings of the 36th Annual Hawaii International Conference on System Sciences (HICSS'03), 3(Track 3).
Gilbert, A. L., Sangwan, S., & Ian, H. H. M. (2005). Beyond usability: the OoBE dynamics of mobile data services markets. Personal Ubiquitous Computing, 9(4):198–208.
Gilder, G. (2002). Telecosm: the world after bandwidth abundance 1 st ed. New York: Touchstone. Gilmore, D. (2002). Understanding and overcoming resistance to ethnographic design research.
Interactions, 9 (3):29 - 35. Gladwell, M. (2005). Blink: the power of thinking without thinking London: Penquin. Glaser, B. G., & Strauss, A. L. (1967). The discovery of grounded theory: strategies for qualitative
research Chicago: Aldine.

A model for representing the motivational and cultural factors that influence mobile phone usage variety 231
Gould, E. W. (Ed.). (2005). Sythesizing the Literature on Cultural Values. London: Lawrence Erlbaum
Associates. GPRSReview2006. (2006). GPRS (General Packet Radio Service), HSCSD & EDGE. Retrieved
2006/08/31 from http://www.mobile-phones-uk.org.uk/gprs.htm Green, N., Harper, N. H. R., Murtagh, G., & Cooper, G. (2001). Configuring the mobile user: sociological
and industry views. Personal and Ubiquitous computing, 5(2):146-156. Habib, L. (2003). Domestication of e-learning technologies: A preliminary conceptual framework,
Retrieved 2006/08/12 from http://home.hio.no/~laurence/NOKOBIT2003.doc Haddon, L. (2003). Domestication and Mobile Telephony. In Machines that Become Us: The Social
Context of Personal Communication Technology, J. Katz (Eds.):43-56. New Brunswick, New Jersey: Transaction Publishers.
Hagen, P., Robertson, T., Kan, M., & Sadler, K. (2005). Emerging research methods for understanding mobile technology use. Proceedings of the 19th conference of the computer-human interaction special interest group (CHISIG) of Australia on Computer-human interaction: citizens online: considerations for today and the future:1 - 10.
Hall, E. T. (1965). The Hidden Dimension NY: Garden City, N.Y.: Anchor Books. Hall, E. T. (1976). Beyond culture Garden City, NY: Anchot Press. Hall, E. T., & Hall, M. R. (1990). Understanding cultural differences: Intercultural Press Inc. Han, S. H., Kim, J. K., Yun, M. H., Hong, S. W., & Kim, J. H. (2004). Identifying Mobile Phone Design
Features Critical to user Satisfaction. HUman Factors and Ergonomics in Manufacturing, 14(1):15-29.
Han Sze Tjong, S., Weber, I., & Sternberg, J. (2003). Mobile Youth Culture: Shaping telephone use in Australia and Singapore. Retrieved 01-01-06 from http://www.bgsb.qut.edu.au/conferences/ANZCA03/Proceedings/papers/Weber_abstract.pdf
Hansen, T. R., Eriksson, E., & Lykke-Olesen, A. (2005, September). Mixed interaction space - expanding the interaction space with mobile devices. Paper presented at the People and computers XIX: the bigger picture: proceedings of HCI 2005, Edinburg, Scotland: 365-380, London: Springer.
Harbich, S., & Auer, S. (2005). Rater bias: The influence of hedonic quality on usability questionnares. Paper presented at the Human_Computer Interaction, Rome, Italy, 1: 1158, Springer.
Hartley, J. (2002). Communication, Cultural and Media Studies: The Key Concepts 3 rd ed. London: Routledge.
Herzberg, F. (1968). One more time: How do you motivate employees? Harvard Business Review, 46(1):53 - 62.
Heukelman, D. (2006). Can a user centred approach to designing a user interface for rural communities be successful? In CHI-SA 2006, D. v. Greunen (Ed.),1(1):51-58. Cape Town: . ACM Press.
Ho, S. Y., & Kwok, S. H. (2003). The Attraction of Personalized Service for Users in Mobile Commerce: An Empirical Study. ACM SIGecom Exchanges, 3(4):10-18.
Hofstede, G. (1995). The business of international business is culture. In Cross-cultural Management, T. Jackson (Ed.):150-154. London: Butterworth-Heinemann.

A model for representing the motivational and cultural factors that influence mobile phone usage variety 232
Hofstede, G. (2001). Culture's Consequences: Comparing Values, Behaviors, Institutions and Organizations Across Nations 2 nd ed. Thousand Oaks, CA: Sage Publications Inc.
Hofstede, G., & McCrae, R. R. (2004). Personality and culture revisited: Linking traits and dimensions of culture. Cross-Cultural Research, 38(1):52-88.
Hoft, N. (1996). Developing a Cultural Model. In International User Interfaces, E. del Gado and. J. Nielsen (Eds.):41-72. New York: John Wiley and Sons.
Holtzblatt, K. (2003). Contextual Design. In The Human-Computer Interaction Handbook, J. A. Jacko & A. Sears (Eds.),1):941-963. London: Lawrence Erlbaum Associates.
Holtzblatt, K. (2005). Designing for the Mobile Device:Experiences, Challenges, and Methods. Communications of the ACM, 48(7):32-35.
Holzinger, A., & Errath, M. (2004). Designing Web-Applications for Mobile Computers: Experiences with Applications to Medicine. In Lecture Notes In Computer Science: User-centered interaction paradigms for universal access in the information society: 8th ERCIM Workshop on User Interfaces for All, C. Stary & C. Stephanidis (Eds.), LNCS 3196:262-267. Austria, Vienna: Berlin; New York: Springer.
Honold, P. (2000). Culture and Context: An Empirical Study for the development of a Framework for the Elicitation of Cultural Influence in Product Usage. International Journal of Human-Computer Interaction, 12(3-4):327 - 345.
Huang, S., & Tilley, S. (2001). Issues of content and structure for a multilingual web site. Paper presented at the 19th annual international conference on Computer documentation. ACM Special Interest Group for Design of Communications, Sante Fe, New Mexico, USA: 103-110, ACM Press.
Hugo, J. (2000). Ethnographic study of cellphone users. Retrieved 2006/10/28, from http://www.chi-sa.org.za/articles/ethno.htm
Huitt, W. (2004). Maslow's hierarchy of needs. Retrieved 10/03/2006, from http://chiron.valdosta.edu/whuitt/col/regsys/maslow.html
Humphreys, L. (2005). Cellphones in public: social interactions in a wireless era. News Media & Society, 7(6):810-833.
Hyyppä, K., Tamminen, S., Hautala, I., & Repokari, L. (2000). The effect of Mental Model Guiding User's Action in Mobile Phone Answering Situations. Paper presented at the NordiCHI2000 Proceedings, Stockholm: NordiCHI and STIMDI 2000.
Iacucci, G. (2001). Bridging Observation and Design in Concept Development for Mobile Services. In Third International Symposium on Human Computer Interaction with Mobile Devices, IHM-HCI 2001. Lille, France.
Institute for Manufactoring. (2006). Innovation and Design Management. Retrieved 2006/10/04 from http://www.ifm.eng.cam.ac.uk/ctm/idm/tools/definition/kano.html
ITU. (2003). Mobile cellular, subscribers per 100 people. Retrieved 2005/10/12 from http://www.itu.int/ITU-D/ict/statistics/at_glance/cellular03.pdf
ITU. (2006). All About the technology. Retrieved 16/05/2006 from www.itu.int/osg/spu/ni/3G/technology/ Jarvenpaa, S. L., Lang, K. R., Takeda, Y., & Tuunainen, V. K. (2003). Mobile commerce at crossroads.
Communications of the ACM, 46(12):41-44.

A model for representing the motivational and cultural factors that influence mobile phone usage variety 233
Jenson, S. (2004). Default Thinking: Why consumer products fail. In The Inside Text: Social perspectives on SMS in the mobile age, R. Harper, L. A. Palen & A. Taylor (Eds.):1-19: Dordrecht: Springer-Verlag.
Ji, Y. G., Park, J. H., Lee, C., & Yun, M. H. (2006). A usability checklist for the usability evaluation of mobile phone interfaces. International Journal of Human Computer Interaction, 20(3):207-231.
Jokela, T. (2004). When Good Things Happen to Bad Products: Where are the Benefits of Usability in the Consumer Appliance Market? Interactions, 11(6):28 - 35.
Jones, M., & Marsden, G. (2005a). Mobile Interaction Design Hoboken, NJ: John Wiley and Sons. Jones, M., & Marsden, G. (2005b). Mobile Interaction Design Tutorial. In Proceedings of the 7th
international conference on Human computer interaction with mobile devices & services, 111(369-370. Salzburg, Austria: ACM Press, New York, NY.
Jordan, P. W. (1998). Designing Pleasurable Producs: Taylor & Francis. Kaasinen, E. (2003). User needs for location-aware mobile services. Personal Ubiquitous Computing,
7:70-79. Kaenampornpan, M., & O'Neill, E. (2004). Modelling context: an Activity Theory approach. Paper
presented at the [EUSAI 2004] Proc. 2nd European Symposium on Ambient Intelligence, Eindhoven, The Netherlands, 2004:
Kaenampornpan, M., O’Neill, E., Kostakos, V., & Warr, A. (2004). Classifying Context Classifications: an Activity Theory Perspective. In Proceedings 2nd UK-UbiNet Workshop. Cambridge, UK.
Kangas, E., & Kinnune, T. (2005). Applying User-Centered Design to Mobile Application Development. Experiences, Challenges, and Methods Designing for the Mobile Device, 48(7):55-59.
Kankainen, A., & Oulasvirta, A. (2003). Design Ideas for Everyday Mobile and Ubiquitous Computing Based on Qualitative User Data. In LECTURE NOTES IN COMPUTER SCIENCE: Universal Access. Theoretical Perspectives, Practice, and Experience: 7th ERCIM International Workshop on User Interfaces for All, N. Carbonell and C. Stephanidis (Eds.),2615(458–464). Paris, France: Springer-Verlag.
Kankainen, A., & Titta, S. (2003). Exploring everyday needs of teenagers related to context-aware mobile services. In Proceedings of 19th International Symposium on Human Factors in Telecommunication :19-26. Berlin, Germany: Fraunhofer Institute.
Kano, N., Seraku, N., Takahashi, F. and Tsuji, S. (1996). Attractive quality and must-be quality. In The best on quality, J. D. Hromi (Eds.), 7 (Milwaukee: ASQC Quality Press.
Kano, N., Tsuji, S., Seraku, N., & Takahashi, F. (1984). 'Miryokuteki Himshitsu to Atarimae Himshitsu' (Attractive Quality Must-be Quality). “Hinshitsu” (Quality),Japan Society for Quality Control, 14(2):147.
Kaptelinin, V., Nardi, B. A., & Macaulay, C. (1999). Methods & tools: The activity checklist: a tool for representing the “space” of context. Interactions, 6 (4): 27 - 39.
Katz, J. E., & Sugiyama, S. (2005). Mobile phones as fashion statements: The co-creation of mobile communication's public meaning. In Mobile communications: Re-negotiation of the social sphere, R. Ling & P. Pedersen (Eds.):63-81. Surrey, UK: Springer.

A model for representing the motivational and cultural factors that influence mobile phone usage variety 234
Keshav, S. (2005). Why cell phones will dominate the future internet? In ACM SIGCOMM Computer Communication Review, 35(2):83-86. New York: ACM Press.
Ketola, P. (2002). Integrating usability with concurrent engineering in mobile phone development, Doctoral dissertation, University of Tampere, Tampere.
Ketola, P., & Röykee, M. (2001). The three facets of usability in mobile handsets (A. 1-2, Trans.). In CHI2001 Workshop, Mobile Communications: Understanding Users, Adoption & Design. Seattle, Washington: ACM.
Khalil, A., & Connelly, K. (2005a). Context-Aware Configuration: A Study on Improving Cell Phone Awareness. Lecture Notes in Computer Science: Modeling and using context, 3554:197 – 209, Springer-Verlag
Khalil, A., & Connelly, K. (2005b). Improving cell phone awareness by using calendar information. Lecture Notes in Computer Science: Human-Computer Interaction - INTERACT 2005, M. F. Constabile & F. Paterno (Eds.), Rome, Italy, LNCS 3585: 588 – 600, Berlin: Springer.
Kiljander, H. (2004). Evolution and Usability of Mobile Phone Interaction Styles, Doctoral dissertation, Kim, J. H., & Lee, K. P. (2005). Cultural Difference and Mobile Phone Interface Design: Icon Recognition
According to Level of Abstraction. Paper presented at the Proceedings of the 7th international conference on Human-Computer Interaction with mobile devices & services, 111: 307 - 310, ACM Press, New York, NY, USA.
Kleijnen, M., Wetzels, M., & De Ruyter, K. (2004). Consumer acceptance of wireless finance. Journal of Financial Services Marketing, 8(3):206-217.
Klein, H. K., & Myers, M. D. (1999). A Set of Principles for Conducting and Evaluating Interpretive Field Studies in Information Systems. MIS Quarterly, 23(1):67-93.
Korpipaä, P., Häkkilä, J., Kela, J., Ronkainen, S., & Känsälä, I. (2004). Utilising context ontology in mobile device application personalisation. Paper presented at the Proceedings of the 3rd international conference on Mobile and ubiquitous multimedia, College Park, Maryland: 133 - 140, ACM Press.
Kristoffersen, S., & Ljungberg, F. (1999). 'Making Place' to Make IT Work: empirical explorations of HCI for mobile CSCW. In Proceedings of the international ACM SIGGROUP Conference on Supporting Group Work. Phoenix, Arizona: ACM Press.
Kurzweil, R. (2003). The law of accelerating returns. Retrieved 2006/10/21 from http://karmak.org/archive/2003/01/art0134.html
Kwon, H. S., & Chidambaram, L. (2000). A test of the technology acceptance model: The case of cellular telephone adoption. In Proceedings of the 33rd Hawaii International Conference on System Sciences, 1(1-10). Hawaii: IEEE Computer Society.
Lähteenmäki, M., & Kaikkonen, A. (2005). Older Adults Adopt New Communication Technology. Paper presented at the HCI International -11th International Conference on Human-Computer Interaction, C. Stephanidis (Eds.) Las Vegas, Nevada, USA.
Lee, W., & Lu, C. (2003). Customising WAP-based informations services on mobile networks. Personal Ubiquitous Computing, 7(6):321 - 330.
Lee, W. J., Kim, T. U., & Chung, J. (2002). User acceptance of the mobile Internet.

A model for representing the motivational and cultural factors that influence mobile phone usage variety 235
Lee, Y. S., Ryu, Y. S., Smith-Jackson, T. L., Shin, D. J., Nussbaum, M. A., & Tomioka, K. (2005a). Usability Testing with Cultural Groups in Developing a Cell Phone Navigation System. Paper presented at the HCI International -11th International Conference on Human-Computer Interaction, C. Stephanidis (Eds.) Las Vegas, Nevada, USA.
Lee, Y. S., Ryu, Y. S., Smith-Jackson, T. L., Shin, D. J., Nussbaum, M. A., & Tomioka, K. (2005b). Usability testing with cultural groups in developing a cell phone navigation system. In Proceedings of HCI International 2005 - 11th International Conference on Human-Computer Interaction, C. Stephanidis (Eds.), Las Vegas, Nevada, USA.
Lehner, F., Holger, N., & Hans, L. (2003). Wireless E-Learning and Communication Environment: WELCOME at the University of Regensburg. University of Regensburg: Service Journal, 2(3).
Leung, C. H., Chan, Y. Y., & Chan, C. S. C. (2003). Analysis of Mobile Commerce Market in Hong Kong. In Proceedings of the 5th international conference on Electronic commerce, 50(408-412). Pittsburgh, Pennsylvania: ACM Press.
Licoppe, C., & Heurtin, J. P. (2001). Managing One's Availability to Telephone Communication Through Mobile Phones: A French Case Study of the Development Dynamics of Mobile Phone Use. Personal and Ubiquitous Computing, 5(2):131 - 140.
Lieberman, H., & Selker, T. (2000). Out of context: Computer systems that adapt to and learn from context. IBM Systems Journal, 39(3-4):617-632.
Limaye, M. R., & Victor, D. A. (1995). Cross-cultural Communication. In Cross-cultural Management, T. Jackson (Eds.):423: Butterworth Heineman.
Lindgren, H. C. (1969). An introduction to Social Psychology second ed. New York: John Wiley & Sons. Ling, C., & Hwang, W. (2005). Users Satisfaction with Five New Cell Phone Features. Paper presented at
the HCI International -11th International Conference on Human-Computer Interaction, C. Stephanidis (Eds.) Las Vegas, Nevada, USA.
Ling, R. (2001). The diffusion of mobile telephony among Norwegian teens: A report from after the revolution (No. Presented at ICUST). Paris: Telenor R&D.
Ling, R. (2005). "It is 'in.' It doesn't matter if you need it or not, just that you have it: Fashion and the domestication of the mobile telephone among teens in Norway". Retrieved 8 Dec 2005, from http://www.telenor.no/fou/program/nomadiske/artikler.shtml.
Ling, R., & Haddon, L. (2001, 18-19 April). Mobile Telephony, mobility and the coordination of everyday life. Paper presented at the Machines That Become Us, New Brunswick, New Jersey: Leto.
Ling, R., & Yttri, B. (1999). Nobody sits at home and waits for the telephone to ring: Micro and hyper coordination through the use of the mobile phone. (No. 30/99). Kjeller, Norway: Telenor Research and Development.
Ling, R., & Yttri, B. (2002). Hyper-coordination via mobile phones in Norway. In Perpetual contact: Mobile communication, private talk, public performance., J. Katz & M. Aakhus (Eds.):139-169. Cambridge: Cambridge University Press.
LISA. (2004). Standardises quality assurance model. Retrieved 2007/01/08 from www.lisa.org/info/about.html

A model for representing the motivational and cultural factors that influence mobile phone usage variety 236
Löfgren, M., & Witell, L. (2005). Kano’s Theory of Attractive Quality and Packaging. Quality management journal, 12(3):7-20.
Macinnes, I., Moneta, J., Caraballo, J., & Sarni, D. (2002). Business Models for Mobile Content: The Case of M-Games. Electronic Markets, 12(4):218-227.
Mahernoff, M. J., & Johnston, L. J. (1999). The Planet Pattern Language for Softwar Internationalisation. Paper presented at the PLoP 1999, The University of Melbourne:
Malhotra, Y., & Galletta, D. F. (1999). Extending the Technology Acceptance Model to Account for Social Influence: Theoretical Bases and Empirical Validation. In Proceedings of the Thirty-Second Annual Hawaii International Conference on System Sciences (Eds.),1(1006: IEEE.
Marcus, A. (2005a). Tutorial: Cross-Cultural User-Interface Design for Work, Home, Play and on the way. Paper presented at the CHI-SA, Johannesburg, South Africa
Marcus, A. (2005b). Tutorial: Mobile user-interface design for work, home, play and on the way, CHI-SA. Cape Town, South Africa.
Marcus, A., & Chen, E. (2002a). Designing the PDA of the future. Interactions, 9(1):34 - 44. Marcus, A., & Chen, E. (2002b). Development of a Future Wireless Information Device. Paper presented at
the Re: Wireless, Mobile Device Design Seminar: 1 - 7, American Center for Design. Marcus, A., & Gould, E. W. (2000). Crosscurrents: cultural dimensions and global Web user-interface
design. Interactions, 7(4):32 - 46. Marturano, L., & Wheatly, D. (2000). User centred research and design at Motorola, Session: Orgaisation
overviews: Mobile Communication. In Conference on Human Factors and Computing systems :221-222. The Hague, Netherlands: ACM Press.
Maslow, A. (2006). Maslow's hierarchy of needs. Retrieved 2006/09/22, from http://experts.about.com/e/m/ma/Maslow's_hierarchy_of_needs.htm
Maslow, A. (1954). Motivation and Personality New York: Harper. Maslow, A. (1971). The farther reaches of human nature New York: The Viking Press. Maslow, A., & Lowery, R. (1998). Towards a Psychology of Being Third ed.: New York. McGuigan, J. (2005). Towards a sociology of the mobile phone. Human Technology, 1(1):45-57. Meso, P., Musa, P., & Mbarika, V. (2005). Towards a model of consumer use of mobile information and
communication technology in LDCs: the case of sub-Saharan Africa. Journal of Information Systems, 15(2):119-146.
Miles, M. B., & Huberman, A. M. (1994). Qualitative data analyses second ed. Three Oaks, London, Delhi: Sage Publications.
Millen, D. R. (2000). Rapid ethnography: time deepening strategies for HCI field research. In Proceedings of the conference on Designing interactive systems: processes, practices, methods, and techniques :280 - 286. New York City.
MobileReview. (2006). Classification of cellar. Retrieved 2006/09/03 from http://www.mobile-review.com/articles/2003/classification2-en.shtml
Mohageg, M., & Bergman, E. (2000, 1-6 April). Information Appliance Design at Sun Microsystems. Paper presented at the CHI '00 extended abstracts on Human factors in computing systems, The Hague, The Netherlands: 63-64, ACM Press.

A model for representing the motivational and cultural factors that influence mobile phone usage variety 237
Moore, G. E. (1965, April 19). Cramming more components onto integrated circuits. Retrieved 2006/10/21, from http://download.intel.com/research/silicon/moorespaper.pdf
Mouton, J. (2001). How to succeed in your masters and doctoral studies Pretoria: Van Schaik. Nakajima, N. (2001). Future Mobile Communications Systems in Japan. Wireless Personal
Communications, 17(4):209–223. Nguyen, T., & Garrett, R. (2003). Final Report for research into "New Technological options for people
with physical disabilities, through the use of telecommunications equipment": Flinders University of South Australia.
Nickerson, R. C., & Isaac, H. (2006). "Am I disturbing you?" A Research model for Investigating the Use of Mobile Phones in Social settings. In Proceedings of the International Conference on Mobile Business, 1(1):35: IEEE Computer Society.
Nielsen, J. (1993). Usability engineering London: AP Professional. Norman, D. A. (1988). The psychology of everyday things New York: Basic Books. Norman, D. A. (1998). The invisible computer London: MIT Press. Noy, N. F. (2004). Semantic Integration: A survey of ontology-based approaches. SIGMOD Record,
33(4):65-70. Nurvitadhi, E. (2002). Trends in Mobile Computing: A Study of Mobile Phone Usage in the United States
and Japan, Doctoral dissertation, Oregon State. O'Hara, K., Black, A., & Lipson, M. (2006). Everyday practices with mobile video telephony. Paper
presented at the Proceedings of the SIGCHI conference on Human Factors in computing systems, Montréal, Quebec: 871-880, ACM Press.
O'Sullivan, Hartley, J., Saunders, D., Montgomery, M., & Fiske, J. (1994). Key concepts in communication and cultural studies. 2 ed. London and New York: Routledge.
Olivier, M. S. (2004). Information technology research: a practical guide for computer science and informatics 2 nd ed.: Van Schaik.
Onibere, E. A., Morgan, S., Busang, E. M., & Mpoeleng, D. (2001a). Human-computer interface design issues for a multi-cultural and multi-lingual English speaking country - Botswana. Interacting with Computers, 13:497-512.
Onibere, E. A., Morgan, S., Busang, E. M., & Mpoeleng, D. (2001b). Human-computer interface design issues for a multi-cultural and multi-lingual English speaking country - Botswana. Interacting with Computers, 13(4):497-512.
Oxford. (1999). Concise Oxford Dictionary. In, J. Pearsall (Eds.),tenth ed. New York: Oxford University Press.
Page, C. (2005). Mobile research strategies for a global market. Communications of the ACM, 48(7):42-48. Palen, L., & Salzman, M. (2001). Welcome to the wireless world: Problems using and understanding
mobile telephony. In Springer Computer Supported Cooperated Work Series, Seattle, WA.(135-153: Springer-Verlag, New York.
Palen, L., Salzman, M., & Youngs, E. (2000). Going wireless: behavior & practice of new mobile phone users. Paper presented at the Proceedings from the 2000 ACM conference on Computer supported cooperative work., Philadelphia, Pennsylvania: 201-210, ACM Press.

A model for representing the motivational and cultural factors that influence mobile phone usage variety 238
Parker, K. (2006). A Little Something Extra Can Have Big Results. Retrieved 2006/09/11, from http://www.isixsigma.com/tt/kano/
Pather, S., & Remenyi, D. (2004, September 2004). Some of the philosophical issues underpinning research in Information systems: from positivism to critical realism. Paper presented at the Proceedings of the 2004 annual research conference of the South African institute of computer scientists and information technologists on IT research in developing countries, Stellenbosch, South Africa, 75: 141-146, SAICSIT in association with the ACM.
Pedersen, P. (2003). Adoption of mobile Internet services: An exploratory study of mobile commerce early adopters. Journal of Organizational Computing and Electronic Commerce, forthcoming.
Pedersen, P. E. (2005). Adoption of Mobile Internet Services: An Exploratory Study of Mobile Commerce Early Adopters. Journal of Organizational Computing & Electronic Commerce, 15 (3):203-222.
Pedersen, P. E., Methlie, L. B., & Thorbjornsen, H. (2002). Understanding mobile commerce and user adoption: a triangulation perspective and suggestions for an explanatory service evaluation framework. In Proceedings of the 35th Hawaii international conference on system sciences.
Perry, M., O'Hara, K., Sellen, A., Brown, B., & Harper, R. (2001). Dealing with Mobility: Understanding access anytime, anywhere. ACM transactions on Computer Human Interaction, 8(4):323-347.
Peterson, R. A. (1994). A Meta-Analysis of Cronbach's Coefficient Alpha. Journal of Consumer Research, 21(2):381-391.
Phonescoop. (2006). Phone Finder. Retrieved 2006/09/03 from http://www.phonescoop.com/phones/finder.php
Plimmer, B. (2005). A Computer Science HCI Course. Paper presented at the People and Computers XIX - The Bigger Picture, Edinburg: 185-200, Springer.
Preece, J., Sharp, H., & Rogers, Y. (2002). Interaction Design - beyond human-computer interaction New York: John Wiley & Sons, Inc.
Qualasvirta, A. (2005). Grounding the innovation of future technologies. Human Technology, 1(1):58-75. Qualasvirta, A., Tamminen, S., Roto, V., & Kuorelathi, J. (2005, 2-7 April 2005). Interaction in 4-second
bursts: The fragmented nature of attentional resources in mobile HCI. Paper presented at the Proceedings of the SIGCHI conference on Human factors in computing systems, Portland, Oregon: 919-928, ACM.
Rappa, M. A. (2004). The utility business model and the future of mobile computing. IBM Systems Journal, 43(1):32-42.
Rhee, Y., Kim, J., & Chung, A. (2006). Your phone automatically caches your life. Interactions, 13(4):42 - 44.
Rice, R. E., & Katz, J. E. (2003). Comparing internet and mobile phone usage:digital divides of usage, adoption, and dropouts (Telecommunications Policy No. 27): Rutgers University, New Brunswick.
Roberts, K. J. (2004). Technology factors in Corporate Adoption of Mobile Cell Phones: A Case Study Analyses. In Proceedings of the 37th International Conference on System Sciences,Track 9(1):90287b: IEEE.
Rogers, E. M. (2003). Diffusion of Innovations 5 th ed. New York: The Free Press.

A model for representing the motivational and cultural factors that influence mobile phone usage variety 239
Rondeau, D. (2005). For Mobile Applications, Branding is Experience. Communications of the ACM, 48(7):61-66.
Roth, J. (2002). Patterns of Mobile Interaction. Personal and Ubiquitous computing, 6(4):282-289. Rubin, H. J., & Rubin, I. S. (2005). Qualitative Interviewing: The art of hearing data 2 nd ed.: Sage
Publications. Russo, P., & Boor, S. (1993). How fluent is your interface? designing for international users. In
Proceedings of the Joint SIGCHI and IFIP Conference on Human Factors in Computing Systems (INTERCHI '93) :342-347. New York: ACM Press.
Rutten, P., Tauman, M., Hagai, B., & Sonnino, A. (2001). Is Moore's Law Infinite? The Economics of Moore's Law. Retrieved 18 Augustus 2006
Ruuska-Kalliokulju, S., Schneider-Hufschmidt, M., Väänänen-Vainio-Mattila, K., & Von Niman, B. (2001). Shaping the future of mobile devices. Results of the workshop on future mobile device user interfaces at CHI 2000. SIGCHI Bulletin, 33:16.
Ryan, R., & Deci, E. (2000). Self-determination theory and the facilitation of intrinsic motivation, social development, and well-being. Retrieved 2006/09/22, from http://72.14.205.104/search?q=cache:PAqpgNwldiAJ:www.psych.rochester.edu/SDT/documents/2000RyanDeciSDT.pdf+%E2%80%A2+Ryan,+R.,+%26+Deci,+E.+(2000).+Self-determination+theory+and+the+facilitation+of+intrinsic+motivation,+social+development,+and+well-being.+American+Psychologist&hl=en&gl=za&ct=clnk&cd=1 http://www.psych.rochester.edu/SDT/documents/2000RyanDeciSDT.pdf.
Salzman, M., Palen, L., & Harper, R. (2001). Mobile Communications: Understanding Users, Adoption, and Design. In Conference on Human Factors in Computing Systems CHI'01 extended abstracts on Human factors in computing systems :481-482. New York: ACM Press.
Schilt, B. N., Hilbert, D. M., & Trevor, J. (2002). Context-aware communication. IEEE Wireless Communications, 9(5):46-54.
Schiphorst, T. (2006). Affectionate Computing: Can we fall in love with a machine. In IEEE MultiMedia, F. Nack (Eds.),13(1):20-23: IEEE.
Scott, J. E., & Gable, G. (1997). Goal congruence, trust, and organizational culture: strengthening knowledge links. Paper presented at the Proceedings of the eighteenth international conference on Information systems, Atlanta, Georgia: 107-120, Association for Information Systems, Atlanta, GA.
Selian, A. N. (2004, 4-5 March). Mobile Phones and Youth: A look at the U.S. Student Market. Paper presented at the 'Shaping the future mobile information society',workshop about social and human considerations of technology, Korea:
Sheppard, C., & Scholtz, J. (1999). The Effects of Cultural Markers on Web Site Use. Paper presented at the Fifth Conference on Human Factors and the Web, Gaithersburg, Maryland:
Silverstone, R., & Haddon, L. (1996). Design and the Domestication of Information and Communication Technologies: Technical Change and Everyday Life. In Communication by Design: The Politics of Information and Communication Technologies, R. Silverstone and R. Mansell (Eds.) :44-74. Oxford: Oxford University.

A model for representing the motivational and cultural factors that influence mobile phone usage variety 240
Simons, A., Irwin, D. B., & Drinnien, B. A. (1987). Maslow's hierarchy of needs. In Psychology - The Search for Understanding. New York: West Publishing Company.
Smith, A., & Chang, Y. (2003). Quantifying Hofstede and developing cultural fingerprints for website acceptability. In Proceedings of IWIPS 2003 Conference, V. Evers, K. Rose, P. Honold, J. Corondo & D. L. Day (Eds.).
Smyth, P. (2000). A history of mobile communication - 1995 to 2010. BT Technology Journal., 18(1):60-61.
Stathisa, K., & Sergot, M. (1998). An abstract framework for globalising interactive systems. Interacting with Computers, 9(4):401-416.
Stephanidis, C., & Savidis, A. (2003). Unified User Interface Development. In The Human-Computer Handbook, J. A. Jacko & A. Sears (Eds.),1(1):1069-1092. Mahwah, New Jersey: Lawrence Earlbaum Associates.
Steverink, N., & Lindenberg, S. (2006). Which Social Needs Are Important for Subjective Well-Being? What Happens to Them With Aging? Psychology and Aging, 21(2):281-290.
Stewart, E. C., & Bennet, M. J. (1991). American cultural patterns: A cross-cultural perspective Yarrmouth, Maine: Intercultural Press, Inc.
Straub, D., Keil, M., & Brenner, W. (1997). Testing the technology acceptance model across cultures: A three country study. Information & Management, 33(1):1 - 11.
Strom, G. (2005a, September). Interaction design for countries with a traditional culture: a comparative study with income levels and cultural values. Paper presented at the People and computers XIX - the bigger picture, T. McEwan, J. Gulliksen & D. Benyon (Eds.), Edinburg : 301-315, Springer.
Strom, G. (2005b). Interaction design for countries with a traditional culture: A comparitive study of income levels and cultural values. In People and Computers XIX - The Bigger Picture, T. McEwan, J. Gulliksen & D. Benyon (Eds.):301 - 316. London: Springer.
Sun, H. (2001). Building a culturally-competent corporate web site: an exploratory study of cultural markers in multilingual web design. Paper presented at the Proceedings of the 19th annual international conference on computer documentation, Sante Fe, New Mexico, Session 5: 95-102, ACM Press, New York, NY.
Sun, H. (2004). Expanding the Scope of Localization: A Cultural Usability Perspective on Mobile Text Messaging Use in American and Chinese Contexts, Doctoral dissertation, Rensselaer Polytechnic Institute, New York.
Sutcliffe, A. (2005). Grand Challenges in HCI: the Quest for Theory-led Design. In People and Computers XIX - the bigger picture, T. McEwan, J. Gulliksen & D. Benyon (Eds.), 2(2):491. Edinburg: Springer.
Swallow, S. S., & Thompson, A. P. (2001). Sensory Fabric for Ubiquitous Interfaces. International journal of Human-Computer Interaction, 13(2):147-159.
Tachikawa, K. (2003). A perspective on the evolution of mobile communications. IEEE Communications Magazine, 41(10):66-73.
Tamaru, E., Hasuike, K., & Tozaki, M. (2005). Cellular Phone as a Collaboration Tool that Empowers and Changes the Way of Mobile Work: Focus on Three Fields of Work. In ECSCW 2005: Proceedings of

A model for representing the motivational and cultural factors that influence mobile phone usage variety 241
the Ninth European Conference on Computer-Supported Cooperative Work, H. Gellersen et al. (Eds.) :247-264. Paris, France: Springer.
Tamminen, S., Oulasvirta, A., Toiskallio, K., & Kankainen, A. (2004). Understanding mobile contexts. Personal and Ubiquitous Computing, 8(2):135 - 143.
Tarasewich, P. (2002). Wireless Devices for Mobile Commerce: User Interface Design and Usability. In Mobile Commerce: Technology, Theory and Applications, B. E. Mennecke & T. J. Strader (Eds.):26-50: Hershey, Pa.: Idea Group Publishing.
Teo, T. S. H., & Pok, S. H. (2003a). Adoption of the internet and WAP-enabled phones in Singapore. Behaviour & Information Technology, 22(4):281-289, Taylor&Francis.
Teo, T. S. H., & Pok, S. H. (2003b). Adoption of WAP-enabled mobile phones among Internet users. Omega: The International Journal of Management Sciences, 31(6):483-498.
Terveen, L., McMackin, J., Amento, B., & Hill, W. (2002). Specifying preferences based on user history. Paper presented at the Proceedings of the SIGCHI conference on Human factors in computing systems: Changing our world, changing ourselves, Minneapolis, Minnesota: 315-322, ACM Press.
Terziyan, V., & Vitko, O. (2003). Bayesian Metanetworks for Modelling User Preferences in Mobile Environment. Lecture Notes in Computer Science, 2821:370-384.
The Institute for Management Excellence. (1997). Basic human needs, Online Newsletter, Retrieved 2006/03/11 from http://www.itstime.com/jun97.htm
Thimbleby, H. (2001). The computer science of everyday things. In Proceedings of the Australian user Interface Conference, 1(1):3-11. GoldCoast: Washington: IEEE Computer Society.
Thomas, S. J. (1999). Designing surveys that work! a step-by-step guide. 1 ed. Thousand Oaks, California: Corwin Press Inc.
Tobin, P. K. J., & Bidoli, M. (2006). Factors affecting the adoption of Voice over Internet Protocol (VoIP) and other converged IP services in South Africa. South African Journal of Business Management, 37(1):31-40. Toledano, Y. (2005). Use Online Surveys to Get the Feedback You Need: Tools and best practices for
conducting Web surveys. Retrieved 2006/12/30, from http://www.techsoup.org/learningcenter/internet/page5048.cfm
Trompenaars, F., & Hampden-Turner, C. (1997). Riding the Waves of Culture. – Understanding Cultural Diversity in Business Second ed. London: Nicholas Brealey Publishingl.
Tsalgatidou, A., Veijalainen, J., & Pitoura, E. (2000). Challenges in Mobile Electronic Commerce. Paper presented at the Proceedings of IeC 2000. 3rd Int. Conf. on Innovation through E-Commerce., Manchester UK:
Urbaczewski, A., Wells, J., & Sarker, S. (2002). Exploring Cultural Differences as a Means for Understanding the Global Mobile Internet: A Theoretical Basis and Program of Research. Paper presented at the Proceedings of the 35th Hawaii International Conference on System Sciences: IEEE Computer Society.y
Uzoke, F. M. E., Seleke, G. G., & Shemi, A. P. (2006). Infrastructural and Behavioural influences on the adoption of eCommerce in Developing Countries. In IST-Africa, P. Cunningham & M. Cunningham (Eds.). Pretoria: IIMC International Information Management Corporation.

A model for representing the motivational and cultural factors that influence mobile phone usage variety 242
Venkatesh. (2005). Theories used in IS research: Unified Theory of Acceptance and Use of Technology. Retrieved 2006/11/13, from http://www.istheory.yorku.ca/UTAUT.htm
Venkatesh, V., & Davis, F. D. (2000). A Theoretical Extension of the Technology Acceptance Model: Four Longitudinal Field Studies. Management Science, 46(2): 186-204.
Venkatesh, V., Morris, M. G., Davis, G. B., & Davis, F. D. (2003). User acceptance of information technology: Toward a unified view. MIS Quarterly, 27(3):425-478.
Verma, V. (1995). Human Resource Skills for the Project Manager: Project Management Institute. Vlok, B. (2006). Interview with past chief engineer Vodacom (SA). Pretoria. Vodacom. (2005). Vodacom Phone review, from
www.vodacom.co.za/phones/reviews/phone_compare.aspx Walters, L. O., & Kritzinger, P. S. (2000). Cellular networks: past, present and future. Crossroads, 7(2):4-
35. Walton, M., & Vukovic, V. (2003). Cultures, Literacy, and the Web: Dimensions of Information "Scent".
In Interactions, D. A. S. Susan M. Dray, Paula Kotzé (Eds.),March-April(64-71. New York: ACM Press.
Walton, M., Vukovic, V., & Marsden, G. (2002). 'Visual literacy' as challenge to the internationalisation of interfaces: a study of South African student web users. In CHI '02 Extended Abstracts Conferenceon Human factors in computing systems :530 - 531. New York: ACM Press.
Wei, R., & Lo, V. (2006). Staying connected while on the move: cell phone use and social connectedness. News media & society, 8(1):53-72.
Weißenberg, N., Voisard, A., & Gartmann, R. (2004, November). Using Ontologies in Personalized Mobile Applications. Paper presented at the Proceedings of the 12th annual ACM international workshop on Geographic informatin systems, Washington, DC: 2-11, ACM Press.
Williams, G. (1995). Cellular Communication Networks, Doctoral Dissertation, Computer Networks Department, Lehigh University, Pennsylvania, US.
Wilska, T. (2003). Mobile Phone Use as Part of Young People’s Consumption Styles. Journal of Consumer Policy, 26(4):441-463.
Winters, F. J., Mielenz, C., & Hellestrand, G. (2004). Design Process Changes Enabling Rapid Development. Retrieved 2006/08/25
Wong, C. C., & Hiew, P. L. (2005). Correlations between Factors Affecting the Diffusion of Mobile Entertainment in Malaysia. Paper presented at the Proceedings of the 7th international conference on Electronic commerce, Xi’an, China, 113: 615-621, ACM Press.
Woo, K., & Fock, H. K. Y. (1999). Customer Satisfaction in the Hong Kong mobile phone industry. The Service Industries Journal, 19(3):162-174.
Yang, K. (2003). Beyond Maslow's Culture-Bound Linear Theory: A Preliminary Statement of the Double-Y Model of Basic Human Needs. In Nebraska Symposium on Motivation,49:175-255) Taipei: Academia Sinica and National Taiwan University.
Yen, D. C., & Chou, D. C. (2000). Wireless communications: applications and managerial issues. Industrial Management & Data systems, 100(9):436-443.

A model for representing the motivational and cultural factors that influence mobile phone usage variety 243
Young, T. (2003). Software Interface Design for Small Devices: Software Practices Lab, University of British Columbia.
Yuan, Y., & Zhang, J. J. (2003). Towards and appropriate business model for m-commerce. Mobile communications, 1(1):35-56.
Zhang, P., & von Dran, G. (2000). Satisfiers and dissatisfiers: a two factor model for website design and evaluation. Journal of the American Society for Information Science, 51(14):1253-1268.
Ziefle, M., & Bay, S. (2004). Mental Models of a Cellular Phone Menu. Comparing Older and Younger Novice Users. Lecture Notes in Computer Science: MobileHCI 2004, 3160/2004:25-37.
Ziefle, M., & Bay, S. (2005). The Complexity of Navigation Keys in Cellular Phones and their Effects on Performance of Teenagers and Older Adult Phone Users. Paper presented at the HCI International11th International Conference on Human-Computer Interaction, C. Stephanidis (Eds.) Las Vegas, Nevada, USA.
Zimmer, T. (2004, 14-17 March). Towards a Better Understanding of Context Attributes. Paper presented at the Proceedings of the Second IEEE Annual Conference on Pervasive Computing and Communications Workshops: 23 - 27, IEEE Computer Society.
Zimmerman, D. E., & Muraski, M. L. (1995). The elements of Information Gathering Phoenix, Arizona: The Oryx Press.
Zimmerman, J., Evenson, S., Baumann, K., & Purgathofer, P. (2004). Workshop on the Relationship between Design and HCI. Paper presented at the CHI '04 extended abstracts on Human factors in computing systems, Vienna, Austria : 1741 - 1742, ACM Press.

A model for representing the motivational and cultural factors that influence mobile phone usage variety 244
LIST OF ABBREVIATIONS A Attitude
1G First generation
2G Second generation
3G Third generation
AMPS Advanced Mobile Phone System
API Application Program Interface
BI Behavioural Intention
CSCW Computer Supported Co-operative work
CSD Circuit Switched Data
CDMA Code Division Multiple Access
DF Demographic Factors
df Degrees of freedom
EV External variables
FDMA Frequency Division Multiple Access
GPRS General packet radio system
GPS Global Positioning System
GSM Global System For Mobile Communications
HCI Human-Computer Interaction
HTML Hypertext markup language
ICT Information and Communications Technology
IMT-2000 International Mobile Technology
IP Internet Protocol
ISDN Integrated Services Digital Network
MMS Multimedia Messaging Service
MOPTUM Mobile Phone Technology Usage Model
p probability
PEU Perceived Ease of Use
PF Personal Factors
PDA Personal Digital Assistant
PTT Push To Talk
PU Perceived usefulness
SE Standard Error
SF Socio-economic Factors
SI Social Influence
SMS Short Message Service

A model for representing the motivational and cultural factors that influence mobile phone usage variety 245
SN Social Norm
TAM Technology Adoption Model
TDMA Time Division Multiple Access
U actual system Use
UB Usage Breadth
UI Usage Intensity
UI User Interface
UTAUT Unified Technology Adoption and Usage Model
UV Usage Variety
VOIP Voice over IP
WAP Wireless Application Protocol
WID Wireless information device
XHTML Extended Hypertext Markup Language
WML Windows Markup Language
A model for representing the motivational and cultural factors that influence mobile phone usage variety 246
APPENDIX 1: QUESTIONNAIRE DESIGN AND EVALUATION 1.1 Questionnaire design ..................................................................................................................... 246
1.1.1 Question order............................................................................................................................... 246 1.1.2 Question content............................................................................................................................ 247 1.1.3 Question format............................................................................................................................. 247
1.2 Problems with doing surveys......................................................................................................... 249
1.2.1 Errors of non-observation ..................................................................................................... 249 1.2.2 Errors of observation ............................................................................................................ 249
1.3 Post-observation error ................................................................................................................... 250 1.4 Data collection and analysis ......................................................................................................... 251 1.5 Level of data .................................................................................................................................. 251 1.6 Steps to prepare for statistical analysis................................................................................................. 251
.................................................................................................................................................................
1.1 QUESTIONNAIRE DESIGN Various guidelines for designing questionnaires are available [Thomas, 1999; Mouton, 2001; Brace,
2004; Willis, 2005]. Guidelines are provided for content, organisation, clarity, conciseness and style. Neijens [2004] distinguishes three aspects of information presentation in questionnaires, namely order, structure and format. The issues of question order, question content, question structure and format will now be considered in more detail as important concerns in the design of the questionnaire used in our study.
1.1.1 Question order
Questionnaire designers need to be aware of the effect prior questions can have and to note the following on question order [Mouton, 2001; Brace, 2004; Willis, 2005]:
Start with more general questions relating to the topic and work through to the more specific or detailed subject matter.
Behavioural questions should be asked before attitudinal questions on the same subject.
Avoid prompting of any information before spontaneous questions on the same subject.
Priming alludes to the effect that asking questions about the respondent’s feelings about a proposal, concept or issue prior to the key question can have on the response to the key question.

Appendix 1 Questionnaire design and evaluation
A model for representing the motivational and cultural factors that influence mobile phone usage variety 247
The consistency effect is a particular type of priming which occurs because respondents are led along a particular route of responses to a conclusion that they can answer in only one way if they are to appear consistent.
Funnelling sequences can be used to take respondents from general questions through to more specific questions on a topic, without allowing earlier questions to condition or bias the responses to the later ones.
When given a list of alternatives, the order of the items may have an effect on their selection. Respondents tend to give more weight to the first-mentioned aspect (primacy effect) or the last- mentioned aspect (recentness effect) than those in the middle. Rotating or randomising the questions is a way of spreading bias across the statements more evenly although it does not eliminate it completely.
The ‘halo effect’ refers to the fact that some respondents evaluate consequences in the light of their existing preferences. For example, a respondent who favours a specific cell phone rates it high on all attributes.
1.1.2 Question content
Question content refers to the question asked and the language used. The wording has to be unambiguous, clear and concise. Only one question at a time should be addressed (i.e. avoid double-barrelled questions) and questions should be phrased in such a way that the respondent is not influenced through the wording [Mouton, 2001].
1.1.3 Question format
Questions are divided into open-format and fixed-response format. The response format of survey questions depends on the information required. Responses can be a series of choices (fixed response) or the opportunity to create a response (open response) [Thomas, 1999]. Open-response items are used to capture new information and gain insight. Table XX provides different types of fixed-response questions with their advantages and limitations.
Types of fixed-response questions with their advantages and limitations[Brace, 2004]; [Zimmerman and Muraski, 1995; Thomas, 1999; Mouton, 2001; Rubin and Rubin, 2005].

Appendix 1 Questionnaire design and evaluation
A model for representing the motivational and cultural factors that influence mobile phone usage variety 248
Format and description Advantages Limitations
Adjective Checklist
Underline/encircle the appropriate adjectives to indicate feelings about a specified concept.
Easy to create Numerical score limited to only the number of adjectives selected
Behaviour Checklist
Check all listed items that apply i.e. activities that have been done.
Provides information about respondent’s experiences and behaviour.
Can be challenging to specify behaviours precisely.
Ranking Format
Rank items based on a common feature
Provides information about the relative standing of a set of items, activities, interests etc.
Does not provide information about intensity.
Likert-Type Rating Scale
Select one of 5 responses for measuring attitude. Range from Strongly agree to Strongly disagree.
Provides for a range of responses with a variety of anchors.
Scores in the middle range may be difficult to interpret.
Semantic Differential Scale
Opposite statements (adjectives) of the dimension are placed at the two ends of the scale. Respondents place a mark along the scale to indicate what they agree with most.
Provides for a range of responses. Can provide detailed information about a concept. Forces questionnaire designer to consider exactly what dimension is measured.
Each set of scales is limited to one concept. Difficult to find opposites that ensure a linear progression from one end to the other.
Stapel scale
Indicate agreement as positive or negative – ranging from +5 to -5
Do not need to find accurate opposites to each dimension to ensure bi-polarity.
Can be confusing for respondents. Needs to be self-administered to ensure that respondents understand correctly.
Appendix 1 Table 1: Different types of questions
The guidelines for creating open-response items are similar to those for fixed-response items but it is
especially important to avoid the following: leading questions, loaded words or phrases, suggesting social

Appendix 1 Questionnaire design and evaluation
A model for representing the motivational and cultural factors that influence mobile phone usage variety 249
desirability or encouraging critiques by sharing a concern [Thomas 1999]. In the following section we will take a closer look at the problems experienced with doing surveys.
1.2 PROBLEMS WITH DOING SURVEYS Surveys may look deceptively easy, but [Zimmerman and Muraski, 1995] warn that inferior data,
erroneous conclusions and costly mistakes are the results of underestimating the complexity of surveys. Olivier [Olivier, 2004] identifies three aspects of surveys that contain pitfalls: sampling the data, designing the questionnaire and applying the results. Lumsden, Flinn et al. [2005] list coverage, non-response, sampling and measurement as the four standard error types. The following major sources of errors in surveys have been identified: [Zimmerman and Muraski, 1995; Thomas, 1999; Mouton, 2001; Brace, 2004].
1.2.1 Errors of non-observation
The common errors in not addressing the right people, coverage errors, sampling errors and non-response errors are explained as follows:
Coverage errors occur when certain people may be excluded from the sample. For example, people who do not have access to the web are excluded from web-based surveys.
Sampling error: The sample selected is not representative of the population.
A non-response error refers to the situation in which some people in the sample are not surveyed or fail to respond to the invitation to participate. Moreover, if some items in the questionnaire are left unanswered, this may introduce bias.
1.2.2 Errors of observation
Interviewers make mistakes in capturing and recording data. Planning is recommended as the most important factor in reducing errors of observation commonly caused by questionnaire design, inadequate training of the interviewers and the interview procedure [Thomas 1999]. Regardless of careful planning and organisation there remains the possibility of errors due to bias and the psychological effect of the survey. The following errors have been noted [Mouton, 2001; Brace, 2004]:

Appendix 1 Questionnaire design and evaluation
A model for representing the motivational and cultural factors that influence mobile phone usage variety 250
Error in data collection Elaboration and reference
Interviewer bias
Personal characteristics such as perceived affiliation, race and gender effects
Selectivity effect Biased observer or interviewer
Researcher distortion Intentional distortion of the facts by the researcher due to preconceptions or prejudices
Placebo effects
Subjects report differences or changes because they are expected rather than those actually experienced.
Hawthorne effect
People change their behaviour due to the change in routine or merely because they are being observed.
Research expectancy effect
Researcher or interviewer may communicate an expectancy that the subject fulfils.
Social Desirability Bias Respondents try to appear other than they are. Consciously they may want to manage the impression they are giving of themselves in terms of social responsibility or unconsciously if they believe themselves to be better than they are.
Evaluation apprehension Respondents may be trying to impress the observer or interviewer.
Demand characteristics Subjects produce the responses they think the researcher wants.
Halo effect Once participants have judged one main issue or feature they tend to judge other aspects dependent on the main effect. They rate them all in the same way, being unable to discriminate between categories.
Appendix 1 Table 2 : Errors in data collection
When writing questionnaires, care must be taken to identify question areas that are possible sources of
the common errors noted here and consider how to minimize possible bias.
1.3 POST-OBSERVATION ERROR ‘Processing error’ refers to the incorrect coding or analysis of the data while ‘interpretation error’
refers to the interpretation of the results. Cumulative errors of all the other types as well as investigator bias could influence the interpretation as well. Response errors are also detected in the post-observation phase. Response error refers to the characteristics of questions and respondents’ processing of those questions that may lead to incorrect answers. Following design guidelines can greatly reduce response errors and enable one to elicit valid and valuable responses.
Even after considering all the principles for questionnaire design, the resulting questionnaire may still contain errors. Therefore piloting or pre-testing is essential [Mouton 2001] and a checklist such as the Question Appraisal System (Willis 2005) is useful. ‘No research is without bias. Bias can be introduced

Appendix 1 Questionnaire design and evaluation
A model for representing the motivational and cultural factors that influence mobile phone usage variety 251
intentionally or unintentionally by the researcher or by the respondents; therefore triangulation is necessary.’[Zimmerman and Muraski, 1995:210].
1.4 DATA COLLECTION AND ANALYSIS Data is gathered to obtain the information required to answer the research question. The quality of the
information and therefore the answer to the research question depends largely on the measurement procedures used in the collection of data and the data analysis.
1.5 LEVEL OF DATA Data can be measured qualitatively or quantitatively [Mouton, 2001]. Quantitative data measurement
uses numbers to represent the properties of the object measured. Therefore quantitative data lends itself to statistical analysis. Qualitative data represents descriptions of things that are made without assigning numbers directly and therefore qualitative research findings are not derived from statistical data analysis techniques [Olivier, 2004]. Qualitative findings are derived through shared meaning, social interaction and interpretation which provide in-depth insights into the problem being investigated [Rubin and Rubin, 2005].
There are four types of measures that can be used in questionnaires, namely nominal, ordinal, interval and ratio measures [Olivier, 2004]. Data at the nominal level consists of categories by name (or number), ordinal data constitutes ranking which means placing some order on the data [Zimmerman and Muraski, 1995]. Interval measures represent data as numerical values with equal intervals between the items. Interval data is based on a measure in some unit where equal intervals on the scale present equal differences in the property being measured but there is no absolute zero [Olivier, 2004].
1.6 STEPS TO PREPARE FOR STATISTICAL ANALYSIS 1. Define the problem as a hypothesis (or a number of related hypotheses). Describe the hypothesis as a function that includes a variable for each concept.
2. Review each variable in your functional equation and make sure the variable reflects the dependent/independent relationship you’re trying to understand.
3. Develop a specific operational definition (a piece of data that can be measured for each variable in the functional representation of your hypothesis).
In this research the data can be divided into data that concerns the user (demographic data) and data that concerns their behaviour when selecting and using mobile phones.
References

Appendix 1 Questionnaire design and evaluation
A model for representing the motivational and cultural factors that influence mobile phone usage variety 252
Brace, I. (2004). Questionnaire design: How to plan, structure and write survey material for effective market research. 1 ed. London: Kogan Page.
Lumsden, J., Flinn, S., Anderson, M., & Morgan, W. (2005, September). What difference do guidelines make? An observational study of online-questionnaire design guidelines put to practical use. Paper presented at the People and computers XIX- the bigger picture, Edinburg, Scotland.
Mouton, J. (2001). How to succeed in your masters and doctoral studies Pretoria: Van Schaik. Neijens, P. (2004). Coping with the Nonattitudes Phenomenon: A survey research approach. In Studies in
Public Opinion: Attitudes, nonattitudes, measurement error and change, P. M. S. W. E. Saris (Eds.):366: Princeton University Press.
Olivier, M. S. (Ed.). (2004). Information Technology Research: Van Schaik. Rubin, H. J., & Rubin, I. S. (2005). Qualitative Interviewing: The art of hearing data 1 ed.: Sage
Publications. Thomas, S. J. (1999). Designing surveys that work! 1 ed. Thousand Oaks, California: Corwin Press Inc. Willis, G. B. (2005). Cognitive Interviewing: a tool for improving questionnaire design Thousand Oaks,
California: Sage Publications Inc. Zimmerman, D. E., & Muraski, M. L. (1995). The elements of Information Gathering Phoenix, Arizona:
The Oryx Press.

Appendix 2 Interview questionnaire
A model for representing the motivational and cultural factors that influence mobile phone usage variety 253
APPENDIX 2 PART 1: USER PROFILE
USER PROFILE QUESTIONNAIRE We are conducting a research project on the use and usability of mobile devices with the goal of improving the usability of mobile devices. This questionnaire will be used to identify your cultural profile, which will be matched at a later stage to your interaction design preferences. As a result, it is important that you fill in your test subject number on the MCQ answer sheet. This questionnaire will be used purely for research purposes, and will not be part of any student’s academic evaluation. Your personal identity will be kept confidential and any answers gained from this questionnaire will not be used against you in any way. The research results will be published in summary form so that there is no way in which you can be personally identified. All individual answers obtained from this questionnaire will be kept confidential. There are no right or wrong answers. Please answer each question honestly and to the best of your ability. Your input and time spent on answering this questionnaire is considered very valuable and is highly appreciated. INSTRUCTIONS TO PARTICIPANTS (1) Fill in your student number on the MCQ answer sheet (2) Answer all questions on the MCQ answer sheet (3) Please answer ALL the questions (Part A and Part B)
PART A Mark with an X next to the appropriate answer and/or type in your answer. 1. What qualification are you registered for? [a] B. Sc Honors [b] B. Com Honors [c] Other, please specify ….. [d] None 2. What is your highest academic qualification? [a] Grade 12 (matric) [b] Trade / technikon (after matric) [c] Undergraduate degree (e.g. B. Com) [d] Postgraduate degree (e. g. Honors B Com) [e] Other, please specify ….. 3. Your mother-tongue(first language that you learned to speak) is? [a] Afrikaans [b] English [c] Xhosa [d] Zulu [e] Other, please specify …..

Appendix 2 Interview questionnaire
A model for representing the motivational and cultural factors that influence mobile phone usage variety 254
4. What language do you most often use at work? [a] English [b] Afrikaans [c] Xhosa [d] Other, please specify ….. 5. What language do you most often use to speak to your friends? [a] English [b] Afrikaans [c] Xhosa [d] Other, please specify ….. 6. Do you wear glasses or contact lenses? [a] No, my vision is fine without them [b] No, but I should [c] Yes, and with the glasses / contact lenses my vision is fine [d] Yes, but I still struggle to see and/or read, even with the glasses / contact lenses 7. Is your vision color-impaired? [a] Yes, I cannot see red writing on a green background, or vice versa [b] Yes, I have difficulty in seeing some colors [c] No 8. Are you? [a] Male [b] Female 9. How would you describe your general level of computer experience? [a] None - I have never used any computer programs [b] Low - I have used one or two computer programs [c] Moderately low - I have learned and used between three and six computer programs [d] Moderately high - I have learned and used more than six different computer programs, but I have no programming skills
[e] High - I have used many different computer programs and have some programming skills 10. What is your level of typing skill? [a] “Hunt and Peck” - less than 15 words per minute [b] Moderately skilled - between 15 and 50 words per minute [c] Highly skilled / touch typist - more than 50 words per minute

Appendix 2 Interview questionnaire
A model for representing the motivational and cultural factors that influence mobile phone usage variety 255
11. What do you use computers mainly for? Note: you may select more than one answer for this question, if relevant. [a] send and receive e-mails / word-processing [b] find information from the internet [c] play games [d] IT industry related work (e. g. creating websites / programming) [e] other, please specify ……… 12. Do you enjoy learning how to use a new computer program? [a] Yes [b] Most of the time [c] Sometimes [d] Seldom [e] Never 13. When learning how to use a new computer program, which do you prefer? [a] read the user manual first, then try to use the program
[b] try to use the program first, and refer to the manual when you need help
[c] find someone who knows how to use the program to teach you
[d] learn the program by using the program, without referring to the user manual
14. When learning how to use a new electronic device, other than a computer e.g. cellphone. Which do you prefer? [a] read the user manual first, then try to use the device [b] try to use the device first, and refer to the manual when you need help [c] find someone who knows how to use the device to teach you [d] learn the device by using it (trial-and-error, without referring to the user manual)
15. How long have you been using a cellphone? [a] less than a year [b] 1 - 2 years [c] 2 - 4 years [d] more than four years 16. How often do you use a cellphone? [a] less than once a week [b] once a week [c] once a day [d] more than once a day [e] more than 5 times a day

Appendix 2 Interview questionnaire
A model for representing the motivational and cultural factors that influence mobile phone usage variety 256
17. How old are you? [a] 18 or younger [b] 20 - 25 [c] 26 - 30 [d] 31 - 40 [d] 41 or older PART B For each of the following statements, please indicate how you feel about each one by making a cross (X) underneath the letter you chose. For example - if you strongly agree with the statement, then choose [a] as your answer - if you agree with the statement, but have no strong feelings about it, then choose [b] as your answer - if you are not sure if you agree or disagree with the statement, then choose [c] as your answer - if you disagree with the statement, but have no strong feelings about it, then choose [d] as your answer - if you strongly disagree with the statement, then choose [e] as your answer 18. I like doing more than one thing at a time and do not always finish one task before attempting the next.
Strongly Agree [a]
Agree [b]
Not Sure [c]
Disagree [d]
Strongly Disagree [e]
19. I understand that peoples plans change and the time schedule should be adapted accordingly.
Strongly Agree [a]
Agree [b]
Not Sure [c]
Disagree [d]
Strongly Disagree [e]
20. I do not like browsing through a menu system on a cellphone, I want to go directly to the task I need to do.
Strongly Agree [a]
Agree [b]
Not Sure [c]
Disagree [d]
Strongly Disagree [e]
21. If a friend keeps me waiting, I will be most unhappy about them wasting my time.
Strongly Agree [a]
Agree [b]
Not Sure [c]
Disagree [d]
Strongly Disagree [e]
22. I prefer a menu system with only one way to get to every submenu.
Strongly Agree [a]
Agree [b]
Not Sure [c]
Disagree [d]
Strongly Disagree [e]

Appendix 2 Interview questionnaire
A model for representing the motivational and cultural factors that influence mobile phone usage variety 257
23. Given the opportunity I would prefer to keep my current cell phone which I understand well or which is familiar to
me even if it does not have all the latest technological features. Strongly Agree [a]
Agree [b]
Not Sure [c]
Disagree [d]
Strongly Disagree [e]
24. On a cell phone I prefer using with a menu system which has only one way to achieve an objective, rather than exploring different possibilities.
Strongly Agree [a]
Agree [b]
Not Sure [c]
Disagree [d]
Strongly Disagree [e]
25. I have no problem proceeding with a task even if the objectives are initially not clearly defined (eg setting up a
new service when I do not know the exact procedure). Strongly Agree [a]
Agree [b]
Not Sure [c]
Disagree [d]
Strongly Disagree [e]
26. Unfamiliar situations make me feel uncomfortable.
Strongly Agree [a]
Agree [b]
Not Sure [c]
Disagree [d]
Strongly Disagree [e]
27. Confirmation prompts e.g. a prompt like “Do you want to send this message?” when you have selected “Send”, would be useful.
Strongly Agree [a]
Agree [b]
Not Sure [c]
Disagree [d]
Strongly Disagree [e]
28. I do not believe in storing names and numbers, I type the numbers in as I need them.
Strongly Agree [a]
Agree [b]
Not Sure [c]
Disagree [d]
Strongly Disagree [e]
29. I believe in planning for the future rather than living my life for the moment.
Strongly Agree [a]
Agree [b]
Not Sure [c]
Disagree [d]
Strongly Disagree [e]

Appendix 2 Interview questionnaire
A model for representing the motivational and cultural factors that influence mobile phone usage variety 258
30. I sometimes use smileys e.g ; ) to write messages.
Strongly Agree [a]
Agree [b]
Not Sure [c]
Disagree [d]
Strongly Disagree [e]
31. I sometimes use stored templates to write messages.
Strongly Agree [a]
Agree [b]
Not Sure [c]
Disagree [d]
Strongly Disagree [e]
32. If I do a favor for someone, I expect that person to return the favor when I need it (e.g. if I give a lift to a friend, I expect that friend to give me a lift when I need one).
Strongly Agree [a]
Agree [b]
Not Sure [c]
Disagree [d]
Strongly Disagree [e]
33. If I encounter a problem in using a service on my cell phone, I persevere in trying to solve the problem even if the service is not essential to me at that moment.
Strongly Agree [a]
Agree [b]
Not Sure [c]
Disagree [d]
Strongly Disagree [e]
34. I would prefer to work on a project on my own, rather than in a group, if there would be the same amount of work for me if I worked on the project in a group or on my own.
Strongly Agree [a]
Agree [b]
Not Sure [c]
Disagree [d]
Strongly Disagree [e]
35. When I have a problem with using my phone, I will try to solve it myself.
Strongly Agree [a]
Agree [b]
Not Sure [c]
Disagree [d]
Strongly Disagree [e]
36. When doing a project as a group each group member should get the same mark for that project, rather than each member getting assessed individually.
Strongly Agree [a]
Agree [b]
Not Sure [c]
Disagree [d]
Strongly Disagree [e]
Appendix 2 Interview questionnaire
A model for representing the motivational and cultural factors that influence mobile phone usage variety 259
37. I prefer to discuss problems in using my cellphone with friends rather than with technical experts. Strongly Agree [a]
Agree [b]
Not Sure [c]
Disagree [d]
Strongly Disagree [e]
38. If a lecturer(or manager) disagrees with the work that I have submitted, and I feel that I am in the right, I will take
it up with the lecturer and stand up for my point of view. Strongly Agree [a]
Agree [b]
Not Sure [c]
Disagree [d]
Strongly Disagree [e]
39. If my superior is an electronics expert and I have a problem with using an electronic device I will NOT approach
him/her for help. Strongly Agree [a]
Agree [b]
Not Sure [c]
Disagree [d]
Strongly Disagree [e]
40. Menu items should be presented by text menus rather than icons.
Strongly Agree [a]
Agree [b]
Not Sure [c]
Disagree [d]
Strongly Disagree [e]
41. Secondary (additional) information about contents should be presented, e.g. when movies currently showing are
selected the ratings should also be available. Strongly Agree [a]
Agree [b]
Not Sure [c]
Disagree [d]
Strongly Disagree [e]
42. A cell phone should provide only the basic services a wide assortment of contents to choose from is not desirable.
Strongly Agree [a]
Agree [b]
Not Sure [c]
Disagree [d]
Strongly Disagree [e]
THANK YOU FOR YOUR PARTICIPATION
--------------------------------------------------------------------------------------------------------------------------------------------- PART 2 : User preferences in using a mobile device 1) Mobile phone: Brand and model e.g. Nokia 2300
2) Would you buy a phone from the same manufacturer again? Please give a reason for your answer.

Appendix 2 Interview questionnaire
A model for representing the motivational and cultural factors that influence mobile phone usage variety 260
3) Which manufacturers would you consider next time you buy a phone?
4) How long have you been using this mobile phone? Please enter Years : months : weeks 5) Why do you have a cellphone? 6) What are the most important tasks that you perform with your cellphone. (Please try to name at least 3 in order of
importance) : 7) What are the most important issues to consider when buying a cellphone (Please try to name at least 3 in order of
importance): 8) The following issues are relevant when buying a new cell phone. Make a cross (X) in the appropriate block to
indicate the importance of the feature to you. Very
important Important Nice to have Not very
important Definitely not important
Price Latest technology The number of features Effective in providing service (gets it done)
Efficient in providing service (no waste of time)
Easy to use Battery life “Look and feel” of the phone 9) How many saved numbers do you currently have on your phone?

Appendix 2 Interview questionnaire
A model for representing the motivational and cultural factors that influence mobile phone usage variety 261
10) Would you prefer a customizable menus system where the main menu shows only the menu’s that you use
frequently (the other options remain available on a sub-level) ? 11) Please indicate the number of times that you use a service daily. If you do not use it daily then select another
option. Task frequency Task Daily Weekly Monthly Less than
Monthly Never No such
Service Make Calls Receive calls Send SMS Receive SMS Do calculations Take photo Set reminders Use alarm clock Use stopwatch Check the time Change volume settings Change ringtones Check missed calls Charge battery 12) Mark the importance of each cellphone use, as far as you are concerned, in the appropriate column. Very
important Important Nice to
have Not important
Really not important
entertainment (games, music, ringtones etc) commerce (buying things)
commerce (electronic banking)
relationship building (keeping in touch with friends and family)
information (getting information on products and services)
self-improvement (education or health monitoring)
making a statement about myself (the brand and model, skin, ringtone etc)
emergencies (call for help)

Appendix 2 Interview questionnaire
A model for representing the motivational and cultural factors that influence mobile phone usage variety 262
13) Write down the number of menu items on the main menu (i.e. number of sub- menus) of your mobile phone: 14) Complete for each item on the main menu : Name of menu item Frequency of use:
(often, seldom, never) Usage of submenu items expressed as a percentage
Example: messages often 20% ( e.g. if you use only: “write messages” and “inbox” of the 10 options available.
15) Have you ever lost your cellphone (due to theft, misplacement or any other cause) in a way that it was not
recovered? 16) Do you have information on your cellphone that is not stored anywhere else? 17) Do you have a password on your phone? 18) Have you ever stored passwords or identification numbers on your cellphone? 19) Have you discovered anything new about your cellphone today?
Thank you for your time and participation

Appendix 3 Pilot study questionnaire
A model for representing the motivational and cultural factors that influence mobile phone usage variety 263
APPENDIX 3: Pilot study questionnaire
Questionnaire on cell phone preferences
This is a UNISA research project about the use and usability of cell phones. The aim with this project is to determine the factors that influence cell phone preferences. This questionnaire will be used for research purposes only. The results will be used to improve service in marketing cell phones and cell phone design. The research results will be published in group form so that there is no way in which you can be personally identified. All individual answers obtained from this questionnaire will be kept confidential. There are no right or wrong answers. Please answer each question honestly and to the best of your ability. Your time spent on answering this questionnaire is considered very valuable and is highly appreciated. INSTRUCTIONS TO PARTICIPANTS (4) Answer all questions on the questionnaire (5) Answer all sections (Part A , Part B and Part C) Participant name (optional): …………………………………………
PART A: Biographic information
Mark the appropriate answer with an X or write your answer where applicable. 43. What is your mother-tongue (first language that you learned to speak)? ……………………………………………………………………………………… 44. What language do you most often use at work/school? ………………………………………………………………………………………

Appendix 3 Pilot study questionnaire
A model for representing the motivational and cultural factors that influence mobile phone usage variety 264
45. What language do you most often use to speak to your friends? ……………………………………………………………………………………… 46. Are you? [a] Male [b] Female 47. How old are you? [a] Under 16 [b] 17 - 20 [c] 21 - 25 [d] 26 - 30 [e] 31 - 40 [f] 41 - 50 [g] 51 - 60 [h] 61 or older 48. What is your highest academic qualification? [a] School (Please write the grade ) [b] Less than matric (left school) [c] Matric / Grade 12 [d] Certificate (1-2 years post matric) [e] Diploma / Degree (3 years post matric) [f] Postgraduate degree [g] Other, please specify ….. 49. How would you describe your general level of computer skills? [a] Very High - I do complex computer programming or other specialised tasks and solve my own computer problems
[b] High – I perform specialised tasks and learn new skills by myself [c] Average – I cope with general computer tasks [d] Low - I perform only simple, repetitive tasks [e] Very Low - I have never used a computer

Appendix 3 Pilot study questionnaire
A model for representing the motivational and cultural factors that influence mobile phone usage variety 265
50. How would you describe your general level of computer experience? [a] None - I have never used any computer programs [b] Low - I have used one or two computer programs [c] Moderately low - I have learned and used between three and six computer programs
[d] Moderately high - I have learned and used more than six different computer programs, but I have no programming skills
[e] High - I have used many different computer programs and have some programming skills
51. If you do not have web access, select option [f]. Otherwise: Indicate your level as a web user. [a] Beginner - have read pages on the Web [b] Novice - have entered addresses and used bookmarks [c] Competent - can use a search engine to find interesting pages [d] Proficient -read the Web daily or use it for my work [e] Expert - run my own Web site or have written HTML pages [f] No web access 52. If you do not have internet access, select option [f]. Otherwise: Indicate your level as a internet user. [a] Beginner – only send and receive e-mail messages [b] Novice – know and use a few basic features [c] Competent – know and use most e-mail features [d] Proficient – know and use advanced e-mail features e.g. … [e] Expert – know use the latest e-mail features and functions [f] No internet access

Appendix 3 Pilot study questionnaire
A model for representing the motivational and cultural factors that influence mobile phone usage variety 266
53. What do you mainly use computers for? Note: you may select more than one answer for this question, if relevant.
[a] send and receive e-mails [b] word-processing [c] computer system for a specific task e.g. administrative system [d] finding information from the internet [e] play games [f] IT industry related work (e. g. creating websites / programming)
[g] other, please specify ………
54. Do you enjoy learning how to use a new computer program? [a] Yes [b] Most of the time [c] Sometimes [d] Seldom [e] Never 55. When learning how to use a new computer program, which do you prefer? [a] read the user manual first, then try to use the program [b] try to use the program first, and refer to the manual when you need help
[c] find someone who knows how to use the program to teach you [d] learn the program by using the program, without referring to the user manual
56. When learning how to use a new electronic device, other than a computer e.g. cellphone. What
do you do most often? [a] read the user manual first, then try to use the device [b] try to use the device first, refer to the manual when you need help [c] find someone who knows how to use the device to teach you [d] learn the device by using it (trial-and-error) without referring to the user manual

Appendix 3 Pilot study questionnaire
A model for representing the motivational and cultural factors that influence mobile phone usage variety 267
57. For how long have you been using a computer? [a] less than a year [b] between one and two years [c] between two and three years [d] more than three years 58. Do you wear glasses or contact lenses? [a] No, my vision is fine without them [b] No, but I should [c] Yes, and with the glasses/contact lenses my vision is fine [d] Yes, but I struggle to see and/or read 59. Is your vision color-impaired ( e.g. colour-blind)? If you select Yes, please specify [a] Yes …………………………………………………………………….. [b] No
PART B : General preferences
For each of the following statements, please indicate the extent to which you agree or disagree with the statement by making a cross (X) in the appropriate description, 60. I like doing more than one thing at a time.
Strongly Agree
Agree
Not Sure
Disagree
Strongly Disagree
61. If a friend keeps me waiting, I will be unhappy about them wasting my time.
Strongly Agree
Agree
Not Sure
Disagree
Strongly Disagree
62. I understand that people’s plans change and the time schedule should be adapted accordingly.
Strongly Agree
Agree
Not Sure
Disagree
Strongly Disagree

Appendix 3 Pilot study questionnaire
A model for representing the motivational and cultural factors that influence mobile phone usage variety 268
63. I do not like browsing through sub-menu’s on a cell phone, I want to go directly to the task I need to do.
Strongly Agree
Agree
Not Sure
Disagree
Strongly Disagree
64. I prefer a menu system with only one way to get to every submenu.
Strongly Agree
Agree
Not Sure
Disagree
Strongly Disagree
65. Given the opportunity I would rather to keep my current cell phone which is familiar to me even if it does not have all the latest features.
Strongly Agree
Agree
Not Sure
Disagree
Strongly Disagree
66. I enjoy exploring different ways of using my cell phone.
Strongly Agree
Agree
Not Sure
Disagree
Strongly Disagree
67. I will not use a new cell phone or cell phone feature until someone shows me how to use it.
Strongly Agree
Agree
Not Sure
Disagree
Strongly Disagree
68. Unfamiliar situations make me feel uncomfortable.
Strongly Agree
Agree
Not Sure
Disagree
Strongly Disagree
69. Confirmation prompts e.g. “Do you want to send this message?” when you have selected “Send”
are unnecessary. Strongly Agree
Agree
Not Sure
Disagree
Strongly Disagree

Appendix 3 Pilot study questionnaire
A model for representing the motivational and cultural factors that influence mobile phone usage variety 269
70. I do not believe in storing names and numbers, I type the numbers in as I need them.
Strongly Agree
Agree
Not Sure
Disagree
Strongly Disagree
71. When buying a cell phone I believe in planning ahead rather than just doing what seems best at the moment.
Strongly Agree
Agree
Not Sure
Disagree
Strongly Disagree
72. I sometimes use the option to insert smileys e.g ; ) in messages.
Strongly Agree
Agree
Not Sure
Disagree
Strongly Disagree
73. If I do a favor for someone, I expect that person to return the favor when I need it (e.g. if I
give a lift to a friend, I expect that friend to give me a lift when I need one).
Strongly Agree
Agree
Not Sure
Disagree
Strongly Disagree
74. If I encounter a problem in using a service on my cell phone, I persevere in trying to solve the
problem even if the service is not essential to me at that moment.
Strongly Agree
Agree
Not Sure
Disagree
Strongly Disagree
75. I prefer to work on a project on my own, rather than in a group.
Strongly Agree
Agree
Not Sure
Disagree
Strongly Disagree
76. When I have a problem with using my phone, I will try to solve it myself.
Strongly Agree
Agree
Not Sure
Disagree
Strongly Disagree

Appendix 3 Pilot study questionnaire
A model for representing the motivational and cultural factors that influence mobile phone usage variety 270
77. When doing a project as a group each group member should get the same mark, rather than each member getting assessed individually.
Strongly Agree
Agree
Not Sure
Disagree
Strongly Disagree
78. I would consider sharing a cell phone with a friend or relative if that enables us to have a better phone or to save money.
Strongly Agree
Agree
Not Sure
Disagree
Strongly Disagree
79. I choose a cell phone or ringtone to suit my needs and personality rather than having the same cell phone or ringtone as my friends.
Strongly Agree
Agree
Not Sure
Disagree
Strongly Disagree
80. When I am on the phone and another call comes in, I don’t know what to do.
Strongly Agree
Agree
Not Sure
Disagree
Strongly Disagree
81. If I call a call centre and get put on hold until an agent is available, I prefer to hang up.
Strongly Agree
Agree
Not Sure
Disagree
Strongly Disagree
82. I do not leave voice mails when I call people.
Strongly Agree
Agree
Not Sure
Disagree
Strongly Disagree
83. I prefer to upgrade my phone before the contract becomes due.
Strongly Agree
Agree
Not Sure
Disagree
Strongly Disagree

Appendix 3 Pilot study questionnaire
A model for representing the motivational and cultural factors that influence mobile phone usage variety 271
PART C : Cell phone preferences Please complete by writing your answer in the box below the question or next to the question where a table is provided. 84. Specify you mobile phone: Brand and model 85. Would you buy a phone from the same manufacturer again? Please give a reason for your answer. 86. Which manufacturers would you consider next time you buy a phone? 87. How long have you been using a cell phone? Please enter the number in years if it is more than one year, if not enter the number of months. Years: Months: 46. How long have you been using your current cell phone? Please enter Years : months : weeks Years: Months: Weeks: 47. What do you use a cell phone for? 48. What are the most important tasks that you perform with your cell phone. (Please try to name at least 3 in
order of importance) : 49. What are the most important issues to consider when buying a cellphone (Please try to name at least 3 in
order of importance):

Appendix 3 Pilot study questionnaire
A model for representing the motivational and cultural factors that influence mobile phone usage variety 272
50. The following issues are relevant when buying a new phone. Make a cross (X) in the appropriate block to
indicate the importance of the feature to you. Very
important Important Nice to have Not very
important Definitely not important
Price Latest technology The number of features Effective in providing service (get it done)
Efficient in providing service (no waste of time)
Easy to use Battery life (talk time) Battery life (standby time) “Look and feel” of the cell phone
Brand of phone Network coverage Network quality Bluetooth Camera MMS GPRS 51. How many saved numbers do you currently have on your phone? 52. Would you prefer a customizable menus system where the main menu shows only the menu’s that you use
frequently (the other options remain available on a sub-level)? Mark appropriate answer with an X Yes No

Appendix 3 Pilot study questionnaire
A model for representing the motivational and cultural factors that influence mobile phone usage variety 273
53. Please indicate the frequency with which you use the feature. If you select Daily give the number of times used as well.
Frequency Feature Daily
(e.g. 5) Weekly Monthly Less than Monthly Never No such
Service Alarm Built-in hands free speaker
Calculator Calendar Call line identity Camera Headset compatible
Car kit compatible Chat SMS Concatenated SMS Conference calling Count down timer Currency converter E-mail E-banking External radio FM radio Games Integrated torch MP3/AAC Organizer PC suite Personal Information Manager
Phone Book (save numbers)
Photo album/gallery Picture messaging Polyphonic ringtones Predictive text Profiles Quad band

Appendix 3 Pilot study questionnaire
A model for representing the motivational and cultural factors that influence mobile phone usage variety 274
Set reminders Screensavers Stopwatch SyncML Timer Tri-band 900/1800/1900 True Tone Ring tones Vibrating alert Video capture Video player Viewfinder display Voice dialling (phone) Voice recorder Change volume settings Check missed calls Connect phone to PC using Bluetooth/Infrared.
Send “please call me” 54. Mark the importance of each cell phone use, as far as you are concerned, in the appropriate column. Very
important Important Nice to
have Not important
Really not important
entertainment (games, music, ring tones etc)
commerce (buying things)
commerce (electronic banking) relationship building (keeping in touch with friends and family)
information (getting information on products and services)
self-improvement (education or health monitoring)
making a statement about myself (brand, model, ring tone etc)
emergencies (call for help)
Being up to date with the latest gadgets and how they work.

Appendix 3 Pilot study questionnaire
A model for representing the motivational and cultural factors that influence mobile phone usage variety 275
55. Write down the number of menu items on the main menu (i.e. number of sub- menus) of your mobile
phone. 56. Have you ever lost your cellphone (due to theft, misplacement or any other cause) in a way that it was not
recovered? Yes No 57. Do you have information on your cellphone that is not stored anywhere else? Yes No 58. Do you have a password/pin code on your phone? Yes No 59. Have you ever stored passwords or identification numbers (e.g. bank codes) on your cell phone? Yes No 60. Have you discovered anything new about your cell phone today? Yes No
THANK YOU FOR YOUR PARTICIPATION

Appendix 4 Survey
A model for representing the motivational and cultural factors that influence mobile phone usage variety 276
Appendix 4 : Questionnaire on cell phone preferences Dear Respondent This questionnaire is part of a UNISA research survey investigating the factors that influence cell phone preferences. We will be grateful if you could assist us by taking the time to complete the questionnaire. Your response will help us to understand the way people use their mobile phones. This questionnaire will be used for research purposes only. The results will be used to improve service in marketing and design of cell phones. The research results will be published in group form so that there is no way in which you can be personally identified. All individual answers obtained from this questionnaire will be kept confidential. Please answer the questionnaire as honestly and fully as you can. There are no right answers to these questions – we value your opinion. Your time spent on answering this questionnaire is considered very valuable and is highly appreciated. Kind Regards Judy van Biljon (Project Leader)
How to complete the Questionnaire 1. Mark only one answer by placing a cross next to the appropriate answer, for example
Have you ever lost your phone? Yes X No
2. In cases where space is limited you may place the cross over the selected answer, for example
I enjoy exploring different ways of using my cell phone
Strongly Agree
Agree
Neither agree nor disagree
Disagree
Strongly Disagree
You may also place the cross next to the answer or under it, for example
I enjoy exploring different ways of using my cell phone Strongly Agree
Agree
Neither agree nor disagree
Disagree
Strongly Disagree
3. When presented with a table of items, mark only one answer by placing a cross under the appropriate heading, for example Feature Monthly Weekly Daily Alarm X Camera X Once you have completed the questionnaire, please return it to the interviewer. Thank you for your time and effort.

Appendix 4 Survey
A model for representing the motivational and cultural factors that influence mobile phone usage variety 277
Questionnaire
Name
Province
1. Please indicate the name, province and town/city of the school/college at which you achieved your school-leaving qualification
Town/City
2. Gender Male Female
3. Age in years
4. What is your highest academic qualification?
School (Please write the grade ) Less than matric (left school) Matric / Grade 12 Certificate (1-2 years post matric) Diploma / Degree (3 years post matric) Postgraduate degree Other, please specify …..
5. How would you describe your general level of computer skills?
Very Low - I have never used a computer Low - I perform only simple, repetitive tasks Average – I cope with general computer tasks Very High - I do complex computer programming or other specialised tasks and solve my own computer problems
High – I perform specialised tasks and learn new skills by myself
6. How would you describe your general level of computer experience?
None - I have never used any computer programs Low - I have used one or two computer programs Moderately low - I have learned and used between three and six computer programs Moderately high - I have learned and used more than six different computer programs, but I have no programming skills
High - I have used many different computer programs and have some programming skills

Appendix 4 Survey
A model for representing the motivational and cultural factors that influence mobile phone usage variety 278
7. Indicate your level as a web/internet user
Never used the web Beginner – have read pages on the web Novice – have entered addresses and used bookmarks Competent – can use a search engine to find information Proficient – know my way around and have done web transactions like e-banking
Expert – run my own web site or have written HTML pages
8. Indicate your level as an e-mail user
Never used the web Beginner – only send and receive e-mail messages Novice – know and use a few basic services Competent – know and use most e-mail features Proficient – know and use advanced e-mail features Expert – know and use the latest e-mail features and functions No internet access
9. Do you wear glasses or contact lenses?
No, my vision is fine without them No, but I should Yes, and with the glasses/contact lenses my vision is fine Yes, but I struggle to see and/or read
10. What is your mother-tongue (first language that you learned to speak)?
1. Afrikaans 2. English 3. IsiNdebele 4. IsiXhosa 5. IsiZulu 6. Sepedi 7. SeSotho 8. Setswana 9. Siswati 10. Tshivenda 11. Xitsonga 12. Greek 13. French 14. German 15. Hindi 16. Gujarati 17. Hebrew 18. Portuguese 19. Spanish 20. Italian

Appendix 4 Survey
A model for representing the motivational and cultural factors that influence mobile phone usage variety 279
11. What language do you most often use in working/studying?
1. Afrikaans 2. English 3. IsiNdebele 4. IsiXhosa 5. IsiZulu 6. Sepedi 7. SeSotho 8. Setswana 9. Siswati 10. Tshivenda 11. Xitsonga 12. Greek 13. French 14. German 15. Hindi 16. Gujarati 17. Hebrew 18. Portuguese 19. Spanish 20. Italian
12. I like doing more than one thing at a time.
Strongly Agree
Agree
Neither agree nor disagree
Disagree
Strongly Disagree
13. I keep my current cell phone even if it does not have all the latest features because I know how to use it
Strongly Agree
Agree
Neither agree nor disagree
Disagree
Strongly Disagree
14. I enjoy exploring different ways of using my cell phone
Strongly Agree
Agree
Neither agree nor disagree
Disagree
Strongly Disagree
15. I will only use a new cell phone or cell phone feature when someone shows me how to use it
Strongly Agree
Agree
Neither agree nor disagree
Disagree
Strongly Disagree
16. Unfamiliar situations make me feel uncomfortable
Strongly Agree
Agree
Neither agree nor disagree
Disagree
Strongly Disagree
17. I like confirmation prompts e.g. “The message has been sent”
Strongly Agree
Agree
Neither agree nor disagree
Disagree
Strongly Disagree
18. When I have a problem with using my phone, I try to solve it myself
Strongly Agree
Agree
Neither agree nor disagree
Disagree
Strongly Disagree

Appendix 4 Survey
A model for representing the motivational and cultural factors that influence mobile phone usage variety 280
19. I prefer to do a task with a family member rather than on my own. Strongly Agree
Agree
Neither agree nor disagree
Disagree
Strongly Disagree
20. I would consider sharing a cell phone with a relative so that we can have a better phone or save money
Strongly Agree
Agree
Neither agree nor disagree
Disagree
Strongly Disagree
21. When deciding which network to sign up with I use the same as my family members
Yes No
22. When deciding which phone to buy I follow the advice of family members
Yes No
23. I find my cell phone easy to use
Yes No
24. I make full use of my cell phone i.e. use most of the features it provides
Yes No
25. How long have you been using a cell phone? (More or less)
Years: Months:
26. Do you have a contract or do you use Pay-as-you-go?
Contract Pay as you go
27. What brand of cell phone do you have now:
Blueberry HP LG Kyocera Motorola Nextel Nokia Sagem Samsung Sanyo Sharp Sony Ericsson Other, please specify ………………….
28. Would you buy a phone from the same manufacturer again? Write your answer in the box below and please give a reason.

Appendix 4 Survey
A model for representing the motivational and cultural factors that influence mobile phone usage variety 281
29. How important are the following to you when buying a new phone? Make a cross (X) in the appropriate block to indicate the importance
Totally Unimportant
Not important
Nice to have
Important Very important
Price Latest technology The number of features
Easy to use Battery life “Look and feel” of the cell phone
Brand of phone Network coverage Network quality Able to Connect to Computer
Camera If Other, Specify
30. How many saved numbers do you currently have on your phone?
Less than 10 From 10 to 20 From 21 to 50 From 51 to 100 From 100 to 150 More than 150
31. If you have never lost your cell phone, mark the first response, otherwise please indicate how you lost it.
Phone has never been lost Phone was stolen Phone was misplaced Phone was damaged Other reason for loss (please specify)
32. Would you consider storing information on your cell phone that is not stored anywhere else?
Yes No
33. Do you put a password/pin code on your phone to protect it?
Yes No

Appendix 4 Survey
A model for representing the motivational and cultural factors that influence mobile phone usage variety 282
34. Have you ever stored passwords or identification numbers (e.g. bank codes) on your cell phone?
Yes No
35. Please indicate how often you use the following mobile phone features
Feature Not available on my phone
Never Less often than once a Month
Monthly Weekly Daily
Alarm Browse Internet Bluetooth Calculator Calendar Caller identity Camera Car kit compatible Check missed calls Currency converter SMS E-mail E-banking FM radio Games Torch MP3/AAC Organiser/Personal information manager
Phone Book Photo album/gallery Picture messaging or MMS
Personalised ringtones Predictive text Profiles (change volume, ringtone etc.)

Appendix 4 Survey
A model for representing the motivational and cultural factors that influence mobile phone usage variety 283
Tri-band or Quad band Set reminders
Stopwatch
Vibrating alert
Video capture
Video player
Voice dialling
Voice recorder 36. Which service provider do you use?
Cell-C MTN Vodacom
37. On average, how many times a day do you make use of the following service?
Service
Number of times used daily (approximately)
Send SMS
Receive SMS
Make call
Receive call
Thank you again for your time and participation!

Appendix 5 Verification Survey
A model for representing the motivational and cultural factors that influence mobile phone usage variety 284
Appendix 5: Questionnaire on cell phone preferences
This is a UNISA research project about the use and usability of cell phones. The aim with this project is to determine the factors that influence cell phone preferences. This questionnaire will be used for research purposes only. The results will be used to improve service in marketing cell phones and cell phone design. The research results will be published in group form so that there is no way in which you can be personally identified. All individual answers obtained from this questionnaire will be kept confidential. There are no right answers to these questions – we value your opinion. Your time spent on answering this questionnaire is considered very valuable and is highly appreciated. Please answer all questions on the questionnaire Participant name (optional): …………………………………………
THANK YOU FOR YOUR PARTICIPATION

Appendix 5 Verification Survey
A model for representing the motivational and cultural factors that influence mobile phone usage variety 285
PART A: Biographic information
Mark the appropriate answer by placing an X next to it or write down your answer where applicable.
1. What is your mother-tongue (first language that you learned to speak)?
1. Afrikaans 2. English 3. IsiNdebele 4. IsiXhosa 5. IsiZulu 6. Sepedi 7. SeSotho 8. Setswana 9. Siswati 10. Tshivenda 11. Xitsonga 12. Greek 13. French 14. German 15. Hindi 16. Gujarati 17. Hebrew 18. Portuguese 19. Spanish 20. Italian
Gender Male Female
3. Age Below 20 21-25 26-30 Above 30 4. What is your highest academic qualification?
School (Please write the grade ) Less than matric (left school) Matric / Grade 12 Certificate (1-2 years post matric) Diploma / Degree (3 years post matric) Postgraduate degree Other, please specify …..
5. How would you describe your general level of computer skills?
Very Low - I have never used a computer Low - I perform only simple, repetitive tasks Average – I cope with general computer tasks Very High - I do complex computer programming or other specialized tasks and solve my own computer problems
High – I perform specialized tasks and learn new skills by myself
6. Indicate your level as a web/internet user Never used the web Beginner – have read pages on the web Novice – have entered addresses and used bookmarks Competent – can use a search engine to find information Proficient – know my way around and have done web transactions like e-banking Expert – run my own web site or have written HTML pages

Appendix 5 Verification Survey
A model for representing the motivational and cultural factors that influence mobile phone usage variety 286
7. Indicate your level as an e-mail user
Never used the web Beginner – only send and receive e-mail messages Novice – know and use a few basic services Competent – know and use most e-mail features Proficient – know and use advanced e-mail features Expert – know and use the latest e-mail features and functions No internet access
8. Which of the following attitudes would best describe you attitude towards technology.
I find pleasure in mastering the intricacies of the technology on my phone. I am not a technologist but I exploit new capabilities on my phone. I wait and see how useful other people find a technology before I consider using it. I am not comfortable with technology and will wait until something has become an established standard before I consider use it.
I am not interested in new technology and try to avoid using it.
PART B: Cell phone related behaviour
Please indicate your cell phone behaviour by marking a cross(X) over the appropriate block.
1 = Strongly Disagree
2= Agree
3 = Neither agree nor disagree
4 = Disagree
5 = Strongly disagree
9. I use my cell phone for personal information management i.e. phone numbers, birthdates etc.
1 2 3 4 5
10. I use my cell phone for safety e.g. calling emergency services when in need.
1 2 3 4 5
11. I use my cell phone to maintain social relations (e.g. call or send messages) to friends.
1 2 3 4 5
12. I use my cell phone for improving my self-esteem, i.e. the brand, model, appearance etc. affect the way I feel about myself.
1 2 3 4 5

Appendix 5 Verification Survey
A model for representing the motivational and cultural factors that influence mobile phone usage variety 287
13. I use my cell phone to find or process information. 1 2 3 4 5
14. My cell phone tells something about my image. 1 2 3 4 5
15. The phone I choose and the way I use it is a way of showing who I am.
1 2 3 4 5
16. Having my cell phone with me is provides a sense of security.
1 2 3 4 5
17. I use cell phones for organisation such as determining the time and place of a meeting.
1 2 3 4 5
18. I use my cell phone for managing my social life.
1 2 3 4 5
19. I use my cell phone for buying, selling or making reservations.
1 2 3 4 5
20. I use my cell phone for finding non-personal information i.e. getting prices, reservations or lotto results.
1 2 3 4 5
21. I use a cell phone for entertainment when I am travelling or waiting for someone.
1 2 3 4 5
22. I collect photos, letters, notes and other memorabilia on my cell phone.
1 2 3 4 5
23. My cell phone is useful in improving my self-image, i.e. having a funky or cool phone makes me feel good.
1 2 3 4 5
24. My cell phone is useful in organising day-to-day activities.
1 2 3 4 5
25. I use my cell phone as a tool to explore my environment.
1 2 3 4 5
26. I use a cell phone to organize appointments and synchronise events.
1 2 3 4 5
27. I use my cell phone for entertainment e.g. listening to music, games etc.
1 2 3 4 5
28. I use my cell phone to keep a personal history i.e. saves messages and photos.
1 2 3 4 5
29. I use my cell phone for e-banking or other financial transactions.
1 2 3 4 5

Appendix 5 Verification Survey
A model for representing the motivational and cultural factors that influence mobile phone usage variety 288
30. Apart from organizing events, I do not think of a cell phone as entertainment.
1 2 3 4 5
31. I use my cell phone to contact friends when I am worried about their safety.
1 2 3 4 5
32. I use my cell phone to keep in touch with my family. 1 2 3 4 5
33. I use my phone for doing financial transaction on the web.
1 2 3 4 5
34. Using my cell phone to call, send messages and connect to MX-IT is part of my entertainment.
1 2 3 4 5
35. I use my cell phone for finding new things to do, i.e. new features and functions.
1 2 3 4 5
36. I find the call log on my account useful as a record of personal calls made.
1 2 3 4 5
37. When I travel I use my cell phone to explore my new environment.
1 2 3 4 5
38. Generally, I find cell phones easy to use. 1 2 3 4 5
39. Learning to operate my cell phone was easy for me. 1 2 3 4 5
40. I find it easy to get a cell phone to do what I want. 1 2 3 4 5
41. A cell phone allows me to get things done faster. 1 2 3 4 5
42. Using a cell phone helps me to perform better in general.
1 2 3 4 5
43. Using a cell phone helps me to get tasks done that I would not have been able to do without it.
1 2 3 4 5
Please mark (x) your response based on what you think will be the most appropriate response for filling in the blank in the next sentence:
All things considered, using a cell phone is a ___ idea.
44. Wise Foolish Extremely Quite Neither Quite Extremely
45. Harmful Beneficial
Extremely Quite Neither Quite Extremely

Appendix 5 Verification Survey
A model for representing the motivational and cultural factors that influence mobile phone usage variety 289
46. Good Bad Extremely Quite Neither Quite Extremely
47. Considering cell phone usage I would describe myself as a ____ user.
Light Average
Light
Moderate Heavy Very heavy
48. How many saved phone numbers do you currently have on your cell phone?
Less than 10 From 10 to 20 From 21 to 50 From 51 to 100 From 100 to 150 More than 150
49. How important do you find a cell phone in the following uses:
Totally Unimportant
Not important
Nice to have
Important Very important
Relationships: Building and maintaining relationships, e.g. phoning or messaging friends.
Organisation: Organisation and making arrangements on the move, e.g. co-ordinating appointments.
Expansion: using my cell phone as tool in exploring new environments e.g. on overseas trips, as an aid in navigating etc.
Information: Finding personal information, i.e. phone book, reminders, etc.
Information: Finding information on products and services (non-personal information) e.g. news, prices, sport results, lotto results, etc.
M-commerce: Financial transactions, e.g. electronic banking, transaction notifications from the bank, or buying things.
Self-image: Enhancing my image by the appearance, brand, model, ring tone and accessories of my phone.
Entertainment: listening to music, jokes, playing games, or subscribing to chat rooms as entertainment.

Appendix 5 Verification Survey
A model for representing the motivational and cultural factors that influence mobile phone usage variety 290
Personal history: creating a personal history, e.g. taking photos, saving photo collections and mail messages to keep a record of things
Safety and security: making you feel safer and providing security e.g. allowing people to call for assistance.
50. Please order the following ten cell phone uses according to importance by placing a number from 1 to 10 in the block next to the name of the space (please identify at least the three most important spaces).
Information: Finding information on products and services (non-personal information) e.g. news, prices etc.
Personal history: creating a personal history e.g. taking photo’s, saving photo collections and mail messages to keep a record of things
Self-image: Enhancing my image by the appearance, brand, model, ring tone and accessories of my phone.
Information: Keeping personal information i.e. phone book, reminders etc.
Relationships: Building and maintaining relationships e.g. phoning or messaging friends
M-commerce: Buying, selling and financial transactions e.g. electronic banking or buying things.
Entertainment: listening to music, jokes, games or subscribing to chat rooms as entertainment.
Organisation: Organisation and making arrangements on the move e.g. co-ordinating appointments.
Expansion: using my cell phone as tool in exploring new environments e.g. on overseas trips, as an aid in navigating etc.
Safety and security: making you feel safer and providing security e.g. allowing people to call for assistance.

Appendix 5 Verification Survey
A model for representing the motivational and cultural factors that influence mobile phone usage variety 291
51. Please indicate which of the following mobile phone features you associate with each of the usage spaces.
Feature Sa
fety
and
secu
rity
Rel
atio
nshi
ps
Org
anis
atio
n
Info
rmat
ion
(per
sona
l an
d no
n-pe
rson
al)
Ent
erta
inm
ent
Pers
onal
his
tory
Sel
f-im
age
M-c
omm
erce
Exp
ansi
on
Alarm Browse Internet Bluetooth Calculator Calendar Caller identity Calling (making a call)
Camera Car kit compatible Check missed calls Currency converter SMS E-mail E-banking FM radio Games Torch MP3/AAC Organiser/Personal information anager
Phone Book
Photo album/gallery Picture messaging or MMS
Personalised ringtones Predictive text

Appendix 5 Verification Survey
A model for representing the motivational and cultural factors that influence mobile phone usage variety 292
Profiles (change volume, ringtone etc.)
Tri-band or Quad band
Set reminders Stopwatch Vibrating alert Video capture Video player Voice dialling Voice recorder
52. How important are the following to you when buying a new phone? Make a cross (X) in the appropriate block to indicate the importance
Totally Unimportant
Not important
Nice to have
Important Very important
Technology and features “Look and feel” of the cell phone
Ease of use Usefulness (helps met to get things done)
Customer service Cost of the service Cost of the phone System quality (e.g. network coverage)

Appendix 6 Additional explanation of the statistical analyses used
A model for representing the motivational and cultural factors that influence mobile phone usage variety 293
APPENDIX 6: ADDITIONAL EXPLANATION OF THE STATISTICAL ANALYSES USED
1 INTRODUCTION
This Appendix provides more detail on the statistics used in this study and how they were analysed and described. In section 1.1 the descriptive statistics used are briefly considered, whilst section 1.2 deals with the inferential statistics.
1.1 Descriptive statistics
Having collected data from a group of participants we need a way in which to summarise the data to make it easier to find general patterns within the scores collected. This can be done by calculating a summary statistic such as an average, median or modus or by representing the data on a graph, for example, plotting of how many participants had each type of mobile phone.
In this study the descriptive statistics are mostly used to verify that the participants belong to the target group. For example, the minimum, maximum, average and modus of the ages are given to show that the participant did indeed belong to the age group between 20 and 30 and to give an indication of how the ages were distributed within these boundaries.
Pie charts were used for plotting percentages, for example the percentage of participants that belonged to each group, while histograms were used to depict frequency distributions.
1.2 Inferential statistics
Inferential statistics are used to determine whether or not the experimental hypothesis under consideration is likely to be true. The inferential statistics used in this research include reliability analysis, data reduction and correlation analysis. Reliability analysis was used to determine the internal consistency of the constructs (dimensions) tested as well as that of new constructs identified, as discussed in section 1.2.1. Factor analysis and optimal scaling were used as data reduction methods, as discussed in section 1.2.2. Correlation matrices were used to find associations between constructs and components of the model, as discussed in section 1.2.3.
For the purpose of this study, the term ‘significant’ should be understood as meaning ‘statistically significant’.

Appendix 6 Additional explanation of the statistical analyses used
A model for representing the motivational and cultural factors that influence mobile phone usage variety 294
1.2.1 Reliability analyses
As noted in section 6.3, reliability is described as the ability of the method to reproduce the same results under the same conditions, i.e. an assessment of the degree of consistency among multiple measurements of a variable [Field, 2005]. The rationale for internal consistency is that if the individual items are measuring the same construct, they should be highly intercorrelated.
If the questions in a questionnaire measure the same construct, the questions are said to have internal consistency [Field and Hoyle, 2005]. This is a particularly important criterion in this research where the questions designed to capture a specific construct must have internal consistency.
Cronbach’s Alpha is the most widely used measure to express the reliability coefficient for internal consistency, and a value of above 0.8 is seen as acceptable [Field, 2005]. In contrast, Hair states that a Cronbach’s Alpha value above 0.7 is acceptable for social science research [Hair et al., 1998]. Field [2005] concedes that values below 0.7 can be expected when working with psychological constructs because of the diversity of the constructs being measured. For the purpose of this study a value of above 0.7 is deemed acceptable.
1.2.2 Data reduction
Besides verifying certain statements about mobile phone usage, this study is also aimed at uncovering new factors that influence mobile phone use. One approach is to find the sub-components or factors of constructs. For example, when considering the exploratory factor, analyses constitute a technique for data reduction and summation which addresses the problem of analysing the structure of the interrelationships (correlations) among a large number of variables [Field, 2005]. In order to do this, a set of common underlying dimensions known as ‘factors’, must be defined This enables the researcher to identify separate dimensions of the structure and then the extent to which each variable is explained by each dimension [Hair et al., 1998].
If these factors make intuitive sense, i.e. go together meaningfully, then factorial validity can be inferred on the construct. For example, technology, number of features and ability to connect to a computer are dimensions of the ‘new technology’ priority in buying a mobile phone.
When interpreting factor analyses it is important to look at the relative sizes of the factors as well as the part of the variance explained. In some cases a construct may contain many factors and yet only a few of these factors may explain the bulk of the variance. The eigen-values are used to represent the amount of variation explained by a factor. An eigen-value of 1 represents a substantial amount of variation and is generally used as the criterion for retaining factors [Field, 2005].
In this study Kaiser’s criterion is used since it is accurate when the number of variables is less than 30. In some cases a scree plot was used to determine the optimal number of factors and then the analysis was rerun for this specified number of factors.

Appendix 6 Additional explanation of the statistical analyses used
A model for representing the motivational and cultural factors that influence mobile phone usage variety 295
The other data reduction method used in this study is optimal scaling. Optimal scaling based on CATPCA (Principal Components Analysis for Categorical Data) provides a graphical view of the clustering of factors. Optimal scaling was applied to the responses to some of the questions in an attempt to group those that are closely related, and then to combine these responses into a single measurement. In this study, optimal scaling was useful in converting ordinal data to dichotomous data or in looking for responses that cluster together in presenting a concept. The method is highly subjective in nature, but due to the problem encountered with some questions being measured on a binary scale and others on an ordinal scale, the method was useful in identifying questions that clustered together in multidimensional space.
Optimal scaling was also used as an alternative to factor analysis. The feature frequency use was first analysed with factors analysis and then with optimal scaling. The factors that emerged from both analyses were retained.
1.2.3 Correlation analysis
In this study it is necessary to establish whether some relationship exists between two variables or two sets of data. In general, the null hypothesis tested in correlation analysis is that the correlation coefficient is equal to zero, against the alternative hypothesis that the correlation coefficient is not equal to zero.
Where the correlation coefficient is significantly different from zero, it can be concluded that there is a significant agreement between the perceptions in the respondent groups regarding the importance of the factors tested.
If the null hypothesis is accepted, it implies that there is no or very little agreement among the respondent groups regarding their perceptions of the importance of the factors listed. If the null hypothesis is rejected, it implies that there is a significant correlation between the variables as perceived by the respondents[Field, 2005].
A correlation coefficient (r-value) lies between -1 and 1, where -1 indicates a perfect negative correlation and 1 a perfect positive correlation.
The kind of correlation used will depend on the type of data. When the data is non-parametric then Spearman’s coefficient is recommended, while Kendall’s tau correlation is recommended for small data sets of non-parametric data with a large number of tied ranks [Field and Hoyle, 2005]. For example, when looking for a correlation between age and the importance participants attach to a certain usage space, with importance measured at ordinal level, a non-parametric test would be appropriate. Although the response is given on a five-point Likert scale, it cannot be assumed that strongly agree is twice as strong as agree and therefore the data is considered ordinal.
In some cases it is only necessary to see if there is a difference between two groups and then a t-test is appropriate. The t-test is the difference between means as a function of the degree to which those means would differ by chance alone [Field, 2005], for example when looking at gender differences with the aim of finding

Appendix 6 Additional explanation of the statistical analyses used
A model for representing the motivational and cultural factors that influence mobile phone usage variety 296
out whether or not there is a difference between males and females when it comes to a specific mode of behaviour. In this case there are different participants assigned to each group and therefore it is called the ‘independent samples t-test’.
If the same group of participants were used, for example, to measure their mobile phone usage preferences over a two-month period, it would be called a ‘dependent samples t-test’.
References
Field, A. (2005). Discovering statistics using SPSS 2 ed. London: Sage. Field, A., & Hoyle, G. (2005). How to design and report experiments London: SAGE Publications. Hair, J. H., Anderson, R. E., Tatham, R. L., & Black, W. C. (1998). Multivariate data analysis 5 ed. Upper
Saddle River: Prentice Hall.