a mixture model of global internet capacity distributions
TRANSCRIPT

A Mixture Model of Global Internet Capacity Distributions
Hyunjin SeoAssistant Professor and Docking Faculty Scholar
William Allen White School of Journalism and MassCommunications
University of Kansas1435 Jayhawk Blvd.,
Lawrence, KS 66045-7515E-mail: [email protected]
Stuart ThorsonDonald P. and Margaret Curry Gregg Professor
The Maxwell SchoolSyracuse University
409 Crouse-Hinds HallSyracuse, NY 13244-1075E-mail: [email protected]
Accepted for publication in Journal of the Association for Information Science and TechnologyCorresponding author: Hyunjin Seo, [email protected]
This paper develops a preferential attachment based mixture model of global Internet band-width and investigates it in the context of observed bandwidth distributions between 2002and 2011. Our longitudinal analysis shows, among other things, that the bandwidth sharedistributions – and thus bandwidth differences – exhibit considerable path dependence wherecountry proportions of international bandwidth in 2011 can be substantially accounted for by apreferential attachment based mixture of micro-level processes. Interestingly, our preferentialattachment model, consistent with empirical data, does not predict increasing concentration ofbandwidth within top ranked countries. We argue that recognizing the strong, but nuanced, his-torical inertia of bandwidth distributions is helpful in better discriminating among competingtheoretical perspectives on the global digital divide as well as in clarifying policy discussionsrelated to gaps between bandwidth rich and bandwidth poor countries.
Keywords: Internet, international bandwidth distribution, digital divide, preferentialattachment, mixture model, path dependence
Introduction
The development of the global Internet as a mediumfor high-speed global communications has had significantconsequences for aspects of society including collabora-tions within and across borders, political movements, so-cial changes, and trade (Benkler, 2006; Castells, 2011).The Internet plays a crucial role in diffusion of innovationsand knowledge (Bonfadelli, 2002; Hassani, 2006; Ioannides,2013; Jovanovic & Rob, 1989), political and civic engage-ment (Howard & Hussain, 2011; Norris, 2003), and eco-nomic development (Heeks & Kenny, 2001; Manyika &Roxburgh, 2011). Social interactions, which have significantimplications for multiple facets of society at local, national,and international levels, are often facilitated by the Internetand online social networking sites (Benkler, 2006; Ioannides,2013; Zenou & Jackson, 2013). Therefore, the strength of acountry’s international Internet connections with other coun-tries can be expected to have significant consequences for itsfuture development.
These connections are not uniformly distributed across theglobe. The so-called global digital divide – differences be-tween countries in terms of access to and use of informationand communication technologies (ICTs) – has been the sub-
ject of active empirical investigation (Asia Pacific EconomicCooperation, 2002; Chinn & Fairlie, 2010; Guillén & Suárez,2005; Hilbert & López, 2011; International Telecommunica-tions Union, 2012; Mossberger, Tolbert, & Hamilton, 2012;Pejovic et al., 2012; Van Dijk, 2005; Wunsch-Vincent &Vickery, 2010). These studies have found significant differ-ences in Internet access and/or use between countries. Policyquestions remain as to whether differences are widening ornarrowing, what factors cause the differences, and even howbest to conceptualize these differences (James, 2007; Yu,2006). Many studies have considered economic, sociolog-ical, political, and regulatory characteristics of countries tounderstand cross-national differences in Internet assets (An-drés, Cuberes, Diouf, & Serebrisky, 2010; Asia Pacific Eco-nomic Cooperation, 2002; Chinn & Fairlie, 2010; Guillén &Suárez, 2005; Roycroft & Anantho, 2003; Van Dijk, 2005;Wunsch-Vincent & Vickery, 2010). However, little researchhas focused on how distributions of global Internet capac-ity have evolved and how changes in the distributions mighthelp us understand growth patterns of the global Internet. Wehighlight this, as the notion of digital divide is inherently adistributional concept. To account for national differences inInternet assets we must understand both the global distribu-

2 HYUNJIN SEO
tion of those assets and how, if at all, characteristics of thesedistributions change over time.
We propose a preferential attachment based mixturemodel of country to country Internet bandwidth distributionsand examine it in the context of observed bandwidth distribu-tions from 2002 to 2011. The dataset analyzed is built frombandwidth capacity data for direct country-to-country Inter-net connections in each year for the period 2002 to 2011.Bandwidth capacity, the contracted amount of capacity fortransfer of Internet data, serves as an upper bound on the to-tal amount of information that can be moved internationallyover the Internet.
We are interested in the recent evolution of the globalcommunications network as measured by the distribution ofinternational bandwidth capacity. This approach permits em-pirical investigation of the impact of initial bandwidth distri-bution on subsequent development. Empirically tested esti-mates of specific forms of growth are essential to discrimi-nating competing theoretical perspectives as well as for clar-ifying policy discussions related to different notions of how,if at all, to address differences between bandwidth rich andbandwidth poor countries. In addition, our model devel-opment offers a methodology for helping advance the un-derstanding and visualization of global communication net-works and distributional differences.
Literature Review
Global Internet Capacity
Previous research showed that global Internet connected-ness has grown significantly over the past decade with theglobal Internet network becoming denser (1 citation removedfor masked review). Growth has not been equally distributedand these inequalities have implications for political, eco-nomic, and social developments across countries, regions,and continents. For this reason, the global digital divide,gaps between countries in terms of access to and use of ICTs,has attracted wide attention from scholars and policy mak-ers (Chinn & Fairlie, 2006; Guillén & Suárez, 2005; Norris,2003; Van Dijk, 2005). Previous studies have investigatedhow Internet assets have spread and developed at differentrates and levels across the globe. In particular, they exam-ined economic, political, social, policy, and/or technologicalvariables to understand what factors influence different levelsof technology adoption and deployment in specific countries.
Infrastructure and economic advancement have generallybeen identified as some of the most important factors relatedto the global digital divide (Asia Pacific Economic Cooper-ation, 2002; Chinn & Fairlie, 2006; Kiiski & Pohjola, 2002;Norris, 2003). For example, Chinn and Fairlie (2006) foundthat per capita income, urbanization rate, and telecommuni-cations infrastructure were significantly associated with per-sonal computer and Internet penetration. Kiiski and Pohjola
(2002) examined 60 OECD and developing countries andfound per capita income and prices of telephone access to bestatistically significant correlates of Internet hosts per 1,000inhabitants. A study of Asia Pacific Economic Cooperation(APEC) member countries identified per capita income andurban population proportion as significant determinants ofthe number of Internet users per capita (Asia Pacific Eco-nomic Cooperation, 2002).
In addition, country specific political and institutional en-vironments are associated with access to and usage of ICTs(Asia Pacific Economic Cooperation, 2002; Dasgupta, Lall,& Wheeler, 2005; C. Lee & Chan-Olmsted, 2004). APEC(Asia Pacific Economic Cooperation, 2002) found that po-litical freedom was positively correlated with Internet pene-tration in 21 APEC member countries. Scholars have alsonoted that political institutions play a key role in shapingadoption, diffusion, and use of the Internet (Dasgupta et al.,2005). Level of education is another factor positively asso-ciated with access to and use of Internet assets in differentcountries (Asia Pacific Economic Cooperation, 2002; Chinn& Fairlie, 2006; Kiiski & Pohjola, 2002; Norris, 2003; Quib-ria, Ahmed, Tschang, & Reyes-Macasaquit, 2003). Basedon a cross-national analysis of Asian countries’ use of com-puter, the Internet, telephone, and mobile phones, Quibria etal. (2003) found that education, along with income and in-frastructure, played a significant role in shaping the digitaldivide.
While there is a general consensus that striking dispari-ties exist between countries in access to and use of Internetassets, there remain disagreements on the evolution of thosedisparities. Guillén and Suárez (2005, p. 697) argue that sig-nificant differences between countries will remain because“they are the result of the fundamental economic, politicaland social gap that separates the advanced from the less de-veloped countries.” They predict that countries with an ini-tial advantage would benefit disproportionately from the In-ternet resulting in a rich-getting-richer phenomenon. Basedon a comparison of Asian and non-Asian countries, Wong(2002) suggested that differences will remain wide and areperpetual, though the research also found the average gapsin ICT diffusion intensity between the Asian and non-Asiancountries as well as among Asian countries to have narrowedslightly during the period of 1994-1998.
Fink and Kenny (2003) present a more optimistic viewarguing that gaps are narrowing in that when a per-incomemeasure of access to a variety of ICTs is used, developingcountries “digitally leapfrog” developed countries and willultimately catch up to the developed. They emphasize thatrelative rates of growth should be examined in determin-ing whether differences between developed and developingcountries are widening or narrowing. Analyzing the pro-cess of Internet diffusion in 214 countries between 1990 and2004, Andrés et al. (2010) also concluded that low-income

MIXTURE MODEL 3
countries are enjoying a faster growth rate than high-incomecountries despite an initial lag and that they are very slowlycatching up.
Hilbert and López (2011) illustrate both the importanceand difficulties in harmonizing empirical measures in this do-main. Decisions to focus on particular measurements oftendepend on availability of data but sometimes also on politicalviews of researchers (Yu, 2006). These differences may alsoresult from the fact that studies in this area have almost ex-clusively focused on examining attributes of individual coun-tries with less attention being paid to the possible role of bothhistory and network relations in amplifying or reducing dif-ferences. We aim to address this by looking at differencesbetween dyads of countries as well as properties of the over-all distribution of global Internet bandwidth.
Growth Patterns of Communication Networks
Communication networks have received increased atten-tion from both scholars and practitioners with rapid devel-opments of ICTs offering actors at different levels of societymore affordable and available ways to connect and interact.Communication networks refer to “patterns of contact thatare created by the flow of messages among communicatorsthrough time and space” (Monge & Contractor, 2003, p. 3).In this increasingly interconnected society, most of our dailycommunication activities are embedded in Internet-basednetworks – whether keeping in touch with friends throughFacebook, exchanging emails with your business partners, orsearching information on the Web. Moreover, cross-nationalsocial relations have been taken to a new level thanks to in-formation technologies (Benkler, 2006; Castells, 2011). Peo-ple in disparate parts of the world work together to producecontent on wikis – collaborative websites – and can sharetheir opinion with widely distributed Internet users throughsocial media such as blogs, Facebook, YouTube, and Twitter.There is empirical evidence that the Internet has facilitatedcommunication between activists in different Arab Springcountries (1 citation removed for masked review). These areonly recent examples showing how communication behavioris embedded in communication networks. The developmentin information technologies has been an important drivingforce of globalization which Giddens (1990, p. 64) defined as“the process of strengthening the worldwide social relationswhich link distant localities in such a way that local eventsare shaped by circumstances at other places in the world.”Studying the patterns of global Internet connectedness willhelp us better anticipate future communication behavior.
Communication scholars have investigated communica-tion networks from the standpoint of the global Internet andinternational telecommunication (Barnett & Park, 2014; Bar-nett, Ruiz, Hammond, & Xin, 2013; Howard, 2010; S. Lee,Monge, Bar, & Matei, 2007; Park, Barnett, & Chung, 2011).For example, Barnett (2001) conducted a longitudinal anal-
ysis of the international telecommunications network from1978 to 1996. His analysis showed that the internationaltelecommunications network has become denser, more cen-tralized, and highly integrated over time. A more updatedpicture of international telecommunications networks wasoffered by S. Lee et al. (2007). They found that the inter-national telecommunication network has evolved toward adecentralized structure with increased clusters within the net-work and increasing connectivity within peripheral nations.
TeleGeography’s annual surveys of Internet traffic and ca-pacity indicates that total raw international Internet band-width has increased from less than 1 Terabit per second(Tbps) in 2002 to about 55 Tbps in 2011 (TeleGeography,2012). The economic impact of the Internet has been enor-mous with Manyika and Roxburgh (2011) estimating thatit now accounts for an average of 3.4 percent of GDP forthe world’s largest economies. Governments, either directlyor indirectly, often provide funding for much of the Inter-net’s development (Hafner & Lyon, 1999; Howard, 2010;Standage, 1998). Barnett and Park (2005) have shown thatthe early pattern of international Internet connections largelymirrored political-economic structure at the time. That is,rich and powerful countries enjoyed high bandwidth directconnections with one another and with some less well off
counties. In comparison, less powerful countries had lowerbandwidth connections with geographic neighbors and, insome cases, one of the bandwidth rich countries.
How networks grow has been a key question, and by nowit has been well documented that many interesting networksgrow in a non-random manner with new assets in the net-work being distributed in proportion to their distribution at aprevious time (Barabási, 2003; Newman, Barabási, & Watts,2006). This dynamic can lead to a “rich getting richer”phenomenon. Preferential attachment is a mechanism oftenposited to account for this type of evolution. Under prefer-ential attachment, the growth of a network is modeled as astochastic process in which certain attributes are distributedto each node in a manner roughly probabilistically propor-tionate to the proportion of those of attributes that node had atthe previous time with new nodes sometimes being added asthe network evolves. Under appropriate assumption, networkgrowth generated by preferential attachment results in rightskewed heavy tailed distributions with a small percentage ofnodes having a disproportionate share of the attribute beingstudied. In the context of the city size distribution, Eeckhout(2004) found that Pareto and lognormal differ most dramati-cally in the left part of the distribution. If we look at all thewebsites on the World Wide Web, we would find that mosthave relatively few links to other sites. A random sample ofwebsites would contain mostly (if not only) such sites. How-ever, a small proportion of websites such as google.com ornaver.com will be linked to by a very large number of other,
4 HYUNJIN SEO
generally smaller, sites. These large sites would be in theheavy right tail of the distribution of all websites.
Scholars have observed that many naturally occurringcommunication networks exhibit a heavy tailed distribution(Barabási, 2003; Hyun, 2012). In heavy tail discussions welook at the lower right part of the probability density functionplot and refer to that as the tail. For example, Hyun (2012)found a heavy tailed distribution of incoming links for polit-ical blogs in the United States, Great Britain, and Germany.
While insufficient attention has been paid to analyzinghow distributions of global Internet capacity have evolvedand how changes in the distributions might help us under-stand growth patterns of the global Internet, several previ-ous studies made theoretical or methodological advances re-lated to this topic. Most recently, Hilbert (2014) analyzed acomprehensive database – based on more than 1,100 differentdata sources from international organizations – in examininginequalities in access to, usage of, and impact of digital infor-mation flows between 1986 and 2010. He found that the levelof informational inequality began to decrease only recently(2006-2010) suggesting that “far-reaching social, economic,cultural, and political transformations of the information rev-olution are yet to come and require research attention” (p.832). In analyzing the network structure of the internationalInternet, Barnett and Park (2014) used four different sourcesof data: (i) bilateral bandwidth between countries, (ii) hyper-link connections among nations’ domain names, (iii) struc-tural equivalence of nations from the perspective of websites,and (iv) structural equivalence of nations from the nationalperspective. They found significant correlations between thehyperlinks, bandwidth and structural equivalence from thewebsite concluding that they should be considered as “multi-ple indicators of the same network” (p. 573). Their findingsalso suggest that the international Internet network “appearsto consist of series of small worlds determined by language,geography and historical circumstances” (p. 563).
This study continues in this tradition and analyzes pat-terns of international Internet bandwidth and connections tounderstand hierarchy and inequality in Internet connectionsacross the globe. Specifically, we examine how growth pat-terns of the global Internet have evolved during the period of2002-2011 and propose a mechanism that may have gener-ated those growth patterns.
Methods
We focus on the distribution of country bandwidth propor-tions over time. Insofar as discussions of the global digitaldivide are concerned, proportions are generally what are ofconcern as they provide a standard for comparing across bothcountries and years. If the bandwidth distribution were tocondense upward over time it would be reflected in changingproportions with bandwidth richer countries gaining a higherproportion of the total bandwidth. Bandwidth amounts, on
the other hand, do not offer clear ways of over time com-parisons. For example, changes in data compression algo-rithms and patterns of demand for types of digital data rendercross time comparisons of absolute levels problematic. Un-like with macro economic statistics such as GNI, there are nogenerally accepted methods for adjusting annual bandwidthamounts to constant values. Thus we consider proportionbandwidth shares in current bandwidth levels.
The literature dealing with international Internet band-width has consistently found that politically powerful andeconomically rich countries have more bandwidth (amountand proportion) than do less well off countries (Barnett,2001; Barnett & Park, 2014). This has meant that, as withmany wealth-related distributions, bandwidth distributionshave heavy right tails; most countries have relatively littlebandwidth and a few have quite a lot.
Our initial theoretical approach to accounting for band-width distributions assumes that as new international band-width is created the likelihood that it will accrue to a particu-lar country will, all other things being equal, be proportionalto the amount that country had at a previous time. Dependingupon precisely how these assignments are done the resultscan result in a rich-getting-richer dynamic in which thereis increased condensation of bandwidth proportions. Moregenerally such a preferential attachment mechanism suggeststhat current distributions are derived from past ones and thusexhibit path dependence (Arrow, 2000; Arthur, 1994; Pier-son, 2000).
Vinciguerra, Frenken, and Valente (2010) tested a prefer-ential attachment model against empirical data on the Euro-pean Internet infrastructure network in examining whethergeographic distance and country borders can explain thestructure of the network. Their analysis found that “the pref-erential attachment logic of network growth, combined withbarriers to connect due to geographical distance and coun-try borders, is successfully reproducing a significant part ofan infrastructure network” (p. 1978). They point out that“the effect of specific historical events” is an important topicthat has not been explored in their research or other previ-ous studies and emphasized the importance of understanding“whether the entry of particular cities early in the networkhas had a long-lasting effect on the resulting network struc-ture that emerged later on” (p. 1981).
To examine preferential attachment with regard to inter-national Internet bandwidth we specify a simple urn-basedmechanism credited to Pólya (Chung, Handjani, & Jungreis,2003; Eggenberger & Pólya, 1923).1 The basic urn problembegins with a finite number of urns each containing one ball.At each new time point, with some probability q, a new urnis created and a new ball is placed in that urn. Or, with someprobability p01 − q, the new ball is placed in an existing urn
1Our notation is based upon that proposed in Chung et al.(2003).

MIXTURE MODEL 5
so that the probability that it is placed in a given urn is pro-portionate to mγ where m is the number of balls already inthat urn.
We reinterpret the urn model in terms of countries andquanta of bandwidth. Each urn becomes a country and eachball a quantum of international bandwidth. The global distri-bution of bandwidth quanta at a particular time would thencorrespond to the number of balls in the various urns. Weconsider the special case where q = 0. That is, new quanta ofbandwidth are allocated only among existing countries2. Inaddition, rather than starting the process with only one mar-ble in each urn we will assume an initial unequal distributionof marbles. If we stipulate that 1Mbps (Megabit per sec-ond) is the size of a single bandwidth quantum, then in 2002the countries ranged from holding 1 quantum to containing369,360 quanta.
The mγ component of the model captures preferential at-tachment and we focus on the simplest case where γ = 1. Inother words, when a new quantum of bandwidth is allocatedthe probability that it will go to a given country is directlyproportional to the share of total bandwidth quanta the coun-try currently possesses. Taken together, these assumptionsproduce what is called a finite Pólya Process.
The particular allocation path taken is itself the result ofa sequence of probabilistic outcomes and any particular pathis but one instance of how allocations might have occurred.There is a distribution of paths which might occur given themodel and the initial conditions. The question of systemevolution can be investigated by identifying the probabilitydensity function, PDF, associated with the various paths un-der given initial conditions. Each run of the system gener-ates a PDF. Suppose there are n countries. Each countrywill have some non-zero percentage of the total bandwidthquanta. These percentages can, after dividing by 100, also beinterpreted as a length n vector of probabilities whose sum is1.0. That vector contains the country shares of the empiricalPDF for that point in the evolution of the process. Given thestochastic nature of the mechanism, each run could producedifferent results. What we are really interested in is, overthe long run, characteristics of the probability distribution ofthese vectors; a PDF over PDFs.
Fortunately, our urn mechanism has several useful proper-ties. First, the vector of balls in urns generated by this modelforms a homogeneous Markov chain. It is Markovian sinceat each time step the urn chosen at random depends only onthe distribution within the urns at the previous time. Ho-mogeneity follows from the probability transition matrix notdepending upon a time index. That the distribution vector is aMarkov chain formalizes the path dependence characteristicnoted above.
In our case, the vector of balls corresponds to the vector of(modeled) bandwidth quanta. However, our interest is withthe proportion of bandwidth held by each country. This cor-
responds to the proportion of the total number of balls eachurn has at a given point in time. The vector of proportions isnot a Markov chain since the ratio value at a time point willdepend not on the ratios at the previous time but rather on theactual number of balls in each urn.
It has been shown that the the sequence of ratios is a Mar-tingale (Mahmoud, 2008) and this has been used to prove thatas the mechanism evolves, the expected ratios will stabilize.Even more usefully, they will follow the Dirichlet distribu-tion whose parameters are the initial number of balls in eachurn.
In our case where there are 184 countries, the distributionof PDFs is described by a Dirichlet distribution, Dir, withparameters α1, α2, . . . , α184 where αi denotes the initial band-width of the ith country. The distribution of the individualPDFs depends upon the vector of initial α values.
One implication of the model is that while the distribu-tion of bandwidth proportions will move around (how muchis characterized by the underlying Dirichlet distribution ofwhich it is a realization) it should, in an expected valuesense, ultimately stabilize around the initial distribution ofbandwidth. This may be counterintuitive given that preferen-tial attachment mechanisms often generate distributions withincreasing concentration over time. In our case the resultfollows from the not unrealistic assumption that new urns(countries) are not created. In model terms, q = 0. If q > 0,then new countries could be created to receive new band-width. An implication is that these late-comers would ini-tially have a very small amount of bandwidth. Additionally,they would be expected to continue to have small proportionof the total as late-comers tend to connect to higher band-width nodes but very few new nodes attach to more recentlow bandwidth ones. Over time this would have the conse-quence of increasing the concentration of bandwidth. Sucha mechanism can be shown to generate power-law distribu-tions. Indeed, following Piketty (2014) one might speculatethat some portion of the growing personal wealth inequalitiesmay be attributable to population changes.
The macroscopic bandwidth amounts we observe are theresult of a number of unobserved micro-processes. Thesemight include preferential attachment (as above) economics,politics, private sector decisions, and so on. As Frank (2014,p. 3) notes, in such cases, “The greater the number ofsmall scale fluctuations that combine to form an aggregate,the greater the total randomness in the macroscopic sys-tem.” Nor are these micro-processes contained within a sin-gle country. The bandwidth between, say, South Korea and
2This is similar, though not identical to the situation in the globalInternet where there were 186 countries in 2002 and 201 countriesby 2002. In our empirical analysis we considered only the 184countries with reported bandwidth for the entire 10 year period ofstudy so we basically, albeit somewhat artificially, meet this condi-tion.

6 HYUNJIN SEO
Japan will depend upon processes in both countries as wellas possibly similar processes in other countries connecting toJapan and/or Korea through Japan.
The distribution of bandwidth observed in the TeleGeog-raphy data results from the aggregation of these micro-processes. Characteristics of the probability distributions ofthe observed macroscopic events follow from the manner inwhich the sub-processes are aggregated. For example, themicro-processes might be multiplicative in which case wemight expect a lognormal distribution at the macroscopiclevel. Or more simply, the micro-level processes may be ad-ditive. In such a case, the mean effect of each process canbe summed to give a maximum likelihood estimate of thenet result for each country of all those processes. In whatfollows, we will assume additivity.
Under this assumption, we can expect the outcomes willhave a Gaussian distribution with the micro-level mean as theMLE for each country. Suppose, however, that within our184 countries there are some distinct categories of micro-processes that, while Gaussian, have different parameters(mean, variance, and relative weight). Then the overall pro-cess we are observing at the macroscopic level (our data)would result from a weighted mixture of those normal dis-tributions.
The model we will examine has at its core the urn ap-proach to account for preferential attachment but will be sup-plemented by the possibility that some countries will be ableto make sustained efforts to increase (or lose) their share be-yond that predicted by simple preferential attachment. Thiscould be thought of as arguing that a country’s bandwidthwill be the sum of the urn prediction plus the (possibly nega-tive) result of specific policy, human resource, and economicfactors. And, of course, since the sum of probabilities mustsum to 1.0 a country’s bandwidth share may be decrementedby a normalization factor.
If the expected mean effect of all the subprocesses wereequal to zero for all countries, then we simply have prefer-ential attachment as in the basic urn model. Alternatively,if each country’s bandwidth (proportion) were almost com-pletely the result of unique policy effects, then preferentialattachment would play a decreasingly important role overtime. However, if a small, relative to the number of coun-tries, distinct patterns of policy effect can be identified thenthis could produce something similar to convergence clubsof the sort discussed by Galor (1996).
Formally, let f2011 be the overall bandwidth distributionfor 2011, θk be the mean and standard deviation for the forthe kth (in our case) normal mixture distribution and λk be theweight or contribution of the kth distribution to the overallbandwidth distribution we have:
f2011(x) =
K∑k=1
λk f (x; θk) (1)
The result is a basic urn model which would predict that,for example, 2011 share distributions would look very muchlike those in 2002 absent sustained policy interventions.And, to the extent there were deviations, we would inves-tigate whether a parsimonious grouping of countries, basedupon a Gaussian mixture of the form in Equation 1, shedssubstantive light on the deviations. A diagram of the modelis in the Appendix.
Data
The data used in this research consists of country levelinternational bandwidth data as curated by TeleGeography(2012) and covers the period beginning with 2002 and end-ing with 2011. International Internet bandwidth refers to theamount of data that can be transferred over the Internet acrossnational borders in a given amount of time, and thus, foreach direct connection, is an upper bound on direct usablecountry to country Internet traffic flow. Bandwidth amountsreflect the total capacity of the connections each country haswith one another and in that sense are an indicator of a coun-try’s position in the global Internet. This focus on bandwidthamounts could be misleading if countries with larger band-width simply had huge connections with one or two othercountries. However, such is not the case. Correlations be-tween country degree ranking and country bandwidth duringthe period of 2002-2011 show high ranking bandwidth coun-tries tended to also be high ranking degree countries.
Results
The first year or which we could find country level datafor what corresponds to the full set of countries in today’sInternet was 2002. The number of countries with a measureddirect connection to at least one other country was 186 in thatyear and grew to 202 by 2011. We consider the 184 countrieswhich had connections in each of the years. This should nothave much of an effect on our analysis as the excluded coun-tries had very little bandwidth in the years for which theyhad connections. The total bandwidth of the 184 countries inany of the years was never less than 99.9 percent of the totalreported international bandwidth in that year.
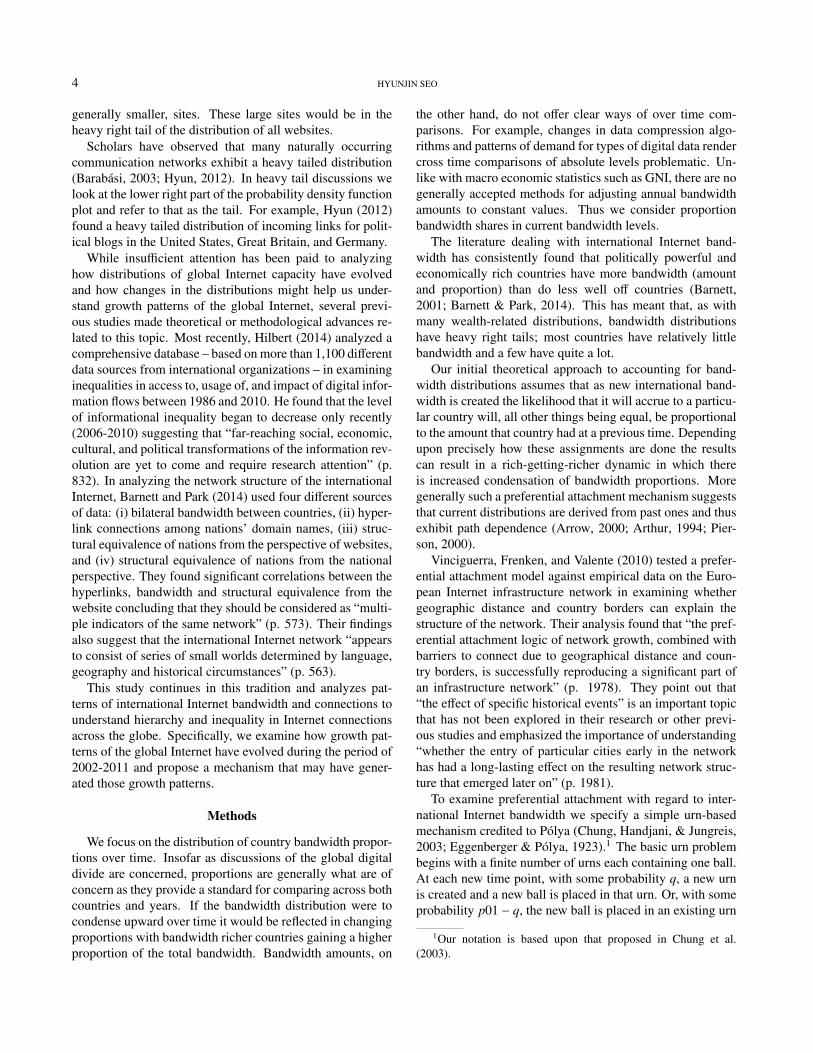
During this period, total international Internet bandwidthgrew from slightly less than one terabit per second (1Tbps)to almost 55Tbps by 2011. Moreover, the growth has beenroughly exponential over the period as shown in Figure 1where bandwidth, plotted on a logarithmic Y axis, appearslinear. The heavy line represents the best (linear) fit giventhe data.
MIXTURE MODEL 7
100
100.5
101
101.5
2002 2004 2006 2008 2010 2012Year
Ban
dwid
th (
Tbp
s)
Figure 1. Total International Internet Bandwidth 2002-2011
Note: Y axis is on a logarithmic scale.
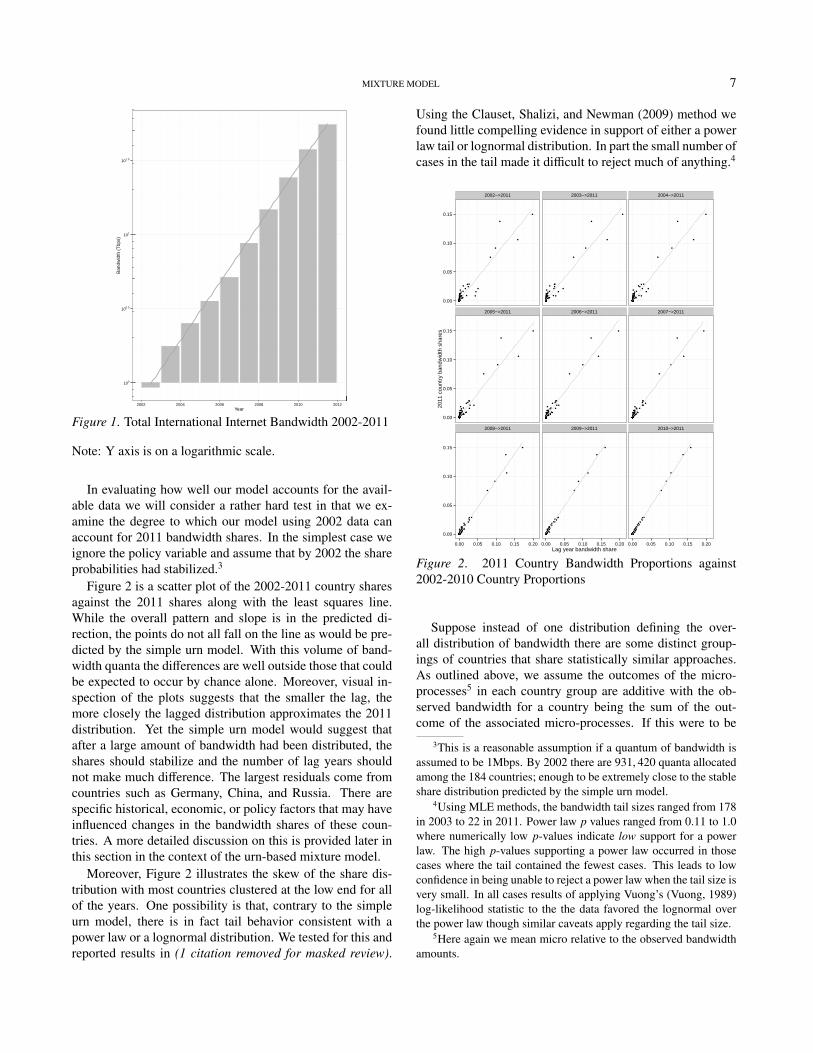
In evaluating how well our model accounts for the avail-able data we will consider a rather hard test in that we ex-amine the degree to which our model using 2002 data canaccount for 2011 bandwidth shares. In the simplest case weignore the policy variable and assume that by 2002 the shareprobabilities had stabilized.3
Figure 2 is a scatter plot of the 2002-2011 country sharesagainst the 2011 shares along with the least squares line.While the overall pattern and slope is in the predicted di-rection, the points do not all fall on the line as would be pre-dicted by the simple urn model. With this volume of band-width quanta the differences are well outside those that couldbe expected to occur by chance alone. Moreover, visual in-spection of the plots suggests that the smaller the lag, themore closely the lagged distribution approximates the 2011distribution. Yet the simple urn model would suggest thatafter a large amount of bandwidth had been distributed, theshares should stabilize and the number of lag years shouldnot make much difference. The largest residuals come fromcountries such as Germany, China, and Russia. There arespecific historical, economic, or policy factors that may haveinfluenced changes in the bandwidth shares of these coun-tries. A more detailed discussion on this is provided later inthis section in the context of the urn-based mixture model.
Moreover, Figure 2 illustrates the skew of the share dis-tribution with most countries clustered at the low end for allof the years. One possibility is that, contrary to the simpleurn model, there is in fact tail behavior consistent with apower law or a lognormal distribution. We tested for this andreported results in (1 citation removed for masked review).
Using the Clauset, Shalizi, and Newman (2009) method wefound little compelling evidence in support of either a powerlaw tail or lognormal distribution. In part the small number ofcases in the tail made it difficult to reject much of anything.4
2002−>2011 2003−>2011 2004−>2011
2005−>2011 2006−>2011 2007−>2011
2008−>2011 2009−>2011 2010−>2011
0.00
0.05
0.10
0.15
0.00
0.05
0.10
0.15
0.00
0.05
0.10
0.15
0.00 0.05 0.10 0.15 0.20 0.00 0.05 0.10 0.15 0.20 0.00 0.05 0.10 0.15 0.20Lag year bandwidth share
2011
cou
ntry
ban
dwid
th s
hare
s
Figure 2. 2011 Country Bandwidth Proportions against2002-2010 Country Proportions
Suppose instead of one distribution defining the over-all distribution of bandwidth there are some distinct group-ings of countries that share statistically similar approaches.As outlined above, we assume the outcomes of the micro-processes5 in each country group are additive with the ob-served bandwidth for a country being the sum of the out-come of the associated micro-processes. If this were to be
3This is a reasonable assumption if a quantum of bandwidth isassumed to be 1Mbps. By 2002 there are 931, 420 quanta allocatedamong the 184 countries; enough to be extremely close to the stableshare distribution predicted by the simple urn model.
4Using MLE methods, the bandwidth tail sizes ranged from 178in 2003 to 22 in 2011. Power law p values ranged from 0.11 to 1.0where numerically low p-values indicate low support for a powerlaw. The high p-values supporting a power law occurred in thosecases where the tail contained the fewest cases. This leads to lowconfidence in being unable to reject a power law when the tail size isvery small. In all cases results of applying Vuong’s (Vuong, 1989)log-likelihood statistic to the the data favored the lognormal overthe power law though similar caveats apply regarding the tail size.
5Here again we mean micro relative to the observed bandwidthamounts.

8 HYUNJIN SEO
the case, the observed distribution would be a mixture of thedistributions for each of the groups and, given the additivityassumption, it is reasonable to view the overall distributionas a mixture of Gaussian distributions. In other words, weposit that each country’s bandwidth at a point in time re-sults from summing the effects of various lower level pol-icy, economic, political, and social processes. We furtherassume that the effects of each of these micro-processes arenormally distributed. If the net effect of summing these pro-cesses is zero, we would have the basic urn model. If, onthe other hand, the summative effect is considerably differentfrom zero, we would expect to see this reflected in patterneddeviations from the urn model for those countries. We termthis a mixture model.
To examine this we used cross-validation as described inShalizi (2013). In our case this involved randomly selectinghalf of the data points in the 2011 bandwidth distribution anditerating through groupings of size two to ten and selectingas K, the number of groups/parameters for which the log-likelihood is smallest, using an Expectation-Maximizationalgorithm (normalmixEM) provided in Benaglia, Chauveau,Hunter, and Young (2009)’s mixtools R package. This re-sulted in seven groups. Figure 3 shows the match betweenthe theoretical cumulative distribution function (as identi-fied in the training) and the empirical 2011 bandwidth dis-tribution. While the fit, even in the tail, looks good, fit-ting 184 points with 21 parameters (7 lambdas, 7 means,and 7 standard deviations) is, of itself, not surprising. How-ever, our goal here is to empirically identify micro-processgroupings which can be used to understand changes in band-width shares over the period. This mixture produces the rightskewed bandwidth distribution without resorting to powerlaws or lognormals.
0.00
0.25
0.50
0.75
1.00
0.00 0.25 0.50 0.75 1.00Theoretical CDF
Em
piric
al C
DF
Figure 3. Theoretical (cross-validated) CDF v. 2011 Empir-ical CDF
Table 1 shows summary statistics for each of the sevenempirically identified groups. In the table the lambda col-
umn contains the weights for each of the distributions (seeEquation 1); they, of course, sum to 1.0. Given both that thebasic urn model predicts stability over time and that it gen-erally takes time for policy effects to be observed, we choseto then evaluate the effect of adding the Gaussian mixturesagainst the 2002 bandwidth data. ∆2011.2002 represents thearithmetic difference between a country’s bandwidth sharein 2011 and that in 2002. It will be positive where shareincreased over the 10 years and negative if it decreased.The mean(∆2011.2002) and var(∆2011.2002) are for each countrygroup. The group percentile means (Pctile Mean) and num-ber of countries (Countries) for each group are also reported.
Table 1Summary Statistics for Country Groups, 2011
Group λ mean(∆2011.2002) var(∆2011.2002) mean(Pctile) Countries1 0.11 -0.0000003 0.0000000 6 232 0.16 0.0000022 0.0000000 20 283 0.16 0.0000252 0.0000000 37 324 0.22 0.0001801 0.0000000 56 385 0.12 0.0011358 0.0000002 72 226 0.21 0.0015709 0.0001274 88 367 0.03 -0.0178492 0.0011056 99 5
Note: ∆2011.2002 refers to difference between 2011bandwidth proportion and that in 2002. Zero values resultfrom rounding.
Figure 4 provides a graphic visualization of the relation-ship between Diff and the 184 countries organized by group.The points on the plot are jittered to reduce over plottingand a local regression (LOESS) curve is drawn to highlightchanges in the data. Recall that the simple urn model wouldpredict that Diff would be 0. That is, the 2011 share wouldbe the same as that in 2002. For countries in Groups 1through 4 this is pretty much the case; for each of thesegroups mean(∆2011.2002) is very close to 0. Groups 1 through4 include 121 of the 184 countries. Groups 5 and 6 show anaverage gain in share and Group 7 a loss. Both Groups 6 and7 have much higher variances than the other groups. Notefrom Table 1 that higher numbered groups contain higherbandwidth percentile countries.

MIXTURE MODEL 9
Points jittered to minimize overplotting
−0.050
−0.025
0.000
0.025
1 2 3 4 5 6 7Group
Ban
dwid
th S
hare
diff
eren
ce: 2
011−
2002
Figure 4. Country Bandwidth Share Differences (∆2011.2002)organized by Group
An interpretation of this is that countries below about the70th percentile have seen little change in bandwidth share.For example, countries in Africa, with the exception ofEgypt, are in Groups 1 through 4 indicating that, on aver-age, they have seen little share growth over the period. Nige-ria, South Africa, and Algeria, three relatively strong Africaneconomies, all saw their 2011 shares virtually identical tothose in 2002. Egypt, in Group 5, did show a slight shareincrease over the period.
Groups 5 and 6 (those above the 70th percentile but belowthe 99th) do show, on average, increased share. These in-clude countries such as China (averaging double-digit growthover the period) and the Russian Federation (whose economygrew seven percent annually between 2000 and 2008) which,during the period, have made concerted efforts to connectmore to the global economy and, importantly, had enjoyedsignificant resource increases permitting them to succeed.The largest share gaining country is Germany (the outlier inGroup 7) which saw its economy rebounding from the costsof unification during this period (Dustmann, Fitzenberger,Schönberg, & Spitz-Oener, 2014).
These gaining countries also benefited by themselves be-ing more economically attractive thus inducing other coun-tries to connect to them thus increasing their bandwidth. Thiscan be seen by looking at the global Internet from a net-work perspective. Russia’s normalized eigenvector central-ity grew from .01 in 2002 to .10 by 2011. China’s went from.06 (2002) to .14 (2011) and Germany’s jumped from .46 in2002 to .94 in 2011. Over the same period, the normalizedeigenvector centrality score for the United States (the biggestGroup 7 loser) dropped from 1.0 in 2002 to .82 in 2011.Moreover, other research (Author, 2015) has shown that ascountries get new bandwidth it tends to be via connectionson the same continent. This favors European countries andreinforces the difficulty in seeing share change in Africa.
More than a decade after its economic reforms in the late1970s and early 1980s, China started investing in Internetuse and development eventually rising to the top of the worldin 2008 in terms of the number of Internet users (Liang &Lu, 2010). Its first international line to the Internet was con-nected in 1994, and these early networks were dedicatedmainly for academic exchange of information. As Chinaquickly realized the importance of the Internet in economicdevelopment, the number of Internet users in the country in-creased exponentially from 2 million in 1998 to 100 mil-lion in 2005 to 650 million in 2014 (Internet World Stats,2014). Its Internet bandwidth amount has increased from20,228 Mbps in 2002 to 2,857,095 Mbps in 2011 for a CAGRof 73 percent over the period. This compares with 52 per-cent CAGR for the U.S. and 102 percent for Chile over thesame period (TeleGeography, 2012). China subsequently en-hanced its control and regulation over Internet infrastructureand censorship over political and social use of the Internet – aphenomenon widely known as the “Great Firewall of China”(Liang & Lu, 2010).
As a major economic hub in Europe, Germany has servedas a main connecting point for fiber-optic networks in Eu-rope and around the world. For example, in 2014 Finlandannounced that it is building a submarine cable at the bot-tom of the Baltic Sea connecting directly to Germany to in-crease available bandwidth between Finland and the rest ofthe European continent (Sverdlik, 2014). Domestically, Ger-many has fueled its continued growth of the Internet with fastbroadband services in big cities and unmetered access prod-ucts (Internet World Stats, 2014). To address the problem ofslower Internet connections outside the big cities, Germanyhas recently adopted Digital Agenda 2014-2017 aimed at ex-panding fast broadband Internet both in rural and urban areasby 2018 (Deutsche Welle, 2014).
Group 6 countries showing a decrease, even as the groupaverage increased, included Ireland, Denmark and South Ko-rea. Interestingly these are all countries which had madeconnectivity a national priority in the late 20th and early 21st
centuries. We may now be seeing a sort of regression effectwhere bandwidth shares of such previously high effort coun-tries are declining a bit.
From the digital divide perspective, most interesting arethe Group 7 countries. These are at the very top of the band-width distribution and, as a group, showed the only averagedrop in share. The richest countries, with the exception ofGermany, lost rather than gained share. That loss, however,was balanced by average gains in Groups 5 and 6.
Average shares for the bandwidth poorest – Groups 1through 4 – remained unchanged and consistent with the ba-sic urn model. The share of total international bandwidthheld by the top one percent of countries decreased from 36percent in 2002 to 29 percent in 2011. The top five percentshare dropped from 84 percent to 69 percent, and the top 10
10 HYUNJIN SEO
percent dropped slightly from 84 percent to 83 percent. Theshare of the top half of countries remained fairly constantmoving from 99.9 percent to 99.7 percent.
Discussion and Conclusion
We adopted a network perspective with country as the unitof analysis from which to examine the evolution of countrylevel international Internet bandwidth over the 2002-2011 in-terval. The distributions were consistently asymmetric witha very heavy right tail. In general, all countries have gottenincreasingly more bandwidth while maintaining shares of to-tal bandwidth in a manner compatible with our preferentialattachment based mixture model. Here mixture model refersto viewing country bandwidth as resulting from a mixtureof Gaussian distributed political, economic, policy, and so-cial micro-processes (Equation 1) with parameters estimatedusing the cross-validation approach described in the previ-ous section. When the net additive effect of these micro-processes is zero, we have the simple urn model. This ap-pears to be descriptive of countries below about the 70th per-centile in bandwidth share. For these countries, as expectedfrom the simple urn model, bandwidth shares remained fairlyconstant over the 2002-2011 period. However, countriesabove the 70th percentile do show considerable deviation aswould be expected from non-zero net effects from the micro-processes. As seen, this mixture model is also capable ofproducing the observed right skewed bandwidth distribution.Finally, it is important to note that our model captures thenotion of bandwidth distributions being generated via a pref-erential attachment mechanism without also implying thatbandwidth be power law distributed. The logic flow behindour mixture model is shown in the Appendix.
More generally, our most robust empirical result is thatthe bandwidth share distributions, and thus bandwidth differ-ences, exhibit considerable path dependence. For most coun-tries, global Internet bandwidth shares have been remarkablysimilar over the period. While it is true that the bandwidthrichest countries have increased their bandwidth over the pe-riod, the bandwidth poorer ones have experienced increasesas well. Though the raw bandwidth gap between the richestcountries and the poorest ones has increased, the proportionof total international bandwidth held by the five bandwidthrichest countries has actually decreased and that of the nexttier, 70th to 97th percentiles, has shown modest increases.In other words, share gaps among the 63 bandwidth richestcountries have narrowed slightly, and shares among the 121bandwidth poorest countries have remained constant over theperiod.
Moreover, while beyond the scope of the research we re-port here, we see some evidence that increased bandwidth isnot simply the result of increased domestic demand but ratherincreases in bandwidth in many cases precede increased de-mand. That is, increasing international bandwidth is an affor-
dance that may help to bring about increased Internet usageat future time points. Build it and they will, with increasedprobability, compute. From the standpoint of our model andgiven the relative rarity of a new country entering into theglobal Internet a key to a bandwidth poor country overcom-ing the inertia of its historical position almost certainly wouldrequire a concerted effort of the sort made by South Koreato not only increase bandwidth but to increase its share ofglobal bandwidth beyond that resulting from preferential at-tachment. On the other hand, as the relative values of infor-mation and knowledge continue to grow, there is risk that to-day’s bandwidth share inequalities will harden into dramaticinformation inequalities separating the bandwidth rich andbandwidth poor countries.
From a policy perspective, our analysis underscores theimportance of carefully specifying the gap being referredto when speaking of the global digital divide. While thisis in part a normative question, it does appear that strate-gies aimed at expanding the lower half of the distribution’sshare of bandwidth will require different measurement met-rics and approaches than might those targeting growing ab-solute gaps at the top end of the distribution given the heavyinertial effect of the 2002 distribution. In particular, countriesin Groups 1 through 4 are precisely the countries that tendto lack the economic and/or political capacity to implementsuccessful policies directed at increasing bandwidth beyondthat expected by preferential attachment. Moreover, whenviewed as a network, it is clear that what one country doesmust be considered within the context of what other countriesare doing. Covariance is a feature of networks. As a conse-quence, policy impacts, especially for the bandwidth smallerones, are somewhat constrained by the policies of others inthe network. For example, Africa countries have remainedamong the least connected and it will be increasingly diffi-cult for them to catch up any time soon if the preferentialattachment component of our model continues to dominatewithin the lower ranked country groupings. That this hasimportant consequences for low bandwidth countries’ politi-cal, economic, and societal developments has been well doc-umented (Oyelaran-Oyeyinka & Adeya, 2004; Roycroft &Anantho, 2003).
As is case with any empirical research, our study is notwithout limitations. First, we relied mainly on one dataset –international Internet bandwidth. While, as discussed above,this is a good measure of international Internet capacity, thistype of research could be enriched by taking into accountother relevant datasets such as mobile communication net-works. Second, our country-level analysis did not considercountry differences in such things as population. For exam-ple, while per-capita analyses would be interesting, our ob-jective in this paper was to examine the global structure ofthe Internet. Third, we focused on structural and distribu-tional elements as they are key to understanding global dig-

MIXTURE MODEL 11
ital divide and also there has been insufficient academic at-tention to this topic. However, analyzing both structural as-pects and more traditional country-specific political and eco-nomic characteristics would be helpful. In particular, focusedcountry-level case studies designed to ascertain whether ourcountry groupings make sense under fine grained examina-tion would be helpful. Further, examining neighborhoodstructures in regions or continents may provide useful infor-mation. Finally, bandwidth research such as ours would ben-efit from being able to make meaningful comparisons of to-tal (as opposed to proportion shares) bandwidth across time.Hilbert and López (2012)’s work is promising here thoughmuch remains to be done before we have a credible way ofadjusting bandwidth to constant levels.
Information technology has reshaped economies and so-cieties around the world. Understanding the distribution andevolution of these changes is important to identifying po-tential problems and opportunities and then developing ap-propriate policies. Our results help in discriminating com-peting theoretical perspectives on the global digital divide.They also sharpen policy discussions related to gaps betweenbandwidth rich and bandwidth poor countries. This studymakes theoretical and methodological contributions relevantto scholars and policymakers working in the area of interna-tional communication networks and the digital divide. In par-ticular, our development of a preferential attachment basedmixture model of bandwidth allocation provides a more nu-anced picture of the digital gaps across the globe and theirimplications for other aspects of society. The approachesused in this study may be applied to studying digital dividewithin a country or society. Future research may also con-sider this interdisciplinary analysis perspective to better un-derstand specific issues in international communication anddigital media-based communication.
AppendixUrn-Based Mixture Model Logic
Figure A1. Urn-Based Mixture Model
References
Andrés, L., Cuberes, D., Diouf, M., & Serebrisky, T. (2010). Thediffusion of the internet: A cross-country analysis. Telecom-munications Policy, 34(5), 323–340.
Arrow, K. J. (2000). Increasing returns: historiographic issuesand path dependence. European Journal of the History ofEconomic Thought, 7(2), 171–180.
Arthur, W. B. (1994). Increasing returns and path dependence inthe economy. University of Michigan Press.
Asia Pacific Economic Cooperation. (2002). New economy inAPEC: Innovations, digital divide, and policy. Asia-PacificEconomic Cooperation (APEC) Secretariat, Singapore.
Barabási, A.-L. (2003). Linked: How everything is connected to ev-erything else and what it means. Penguin Group New York.
Barnett, G. A. (2001). A longitudinal analysis of the internationaltelecommunication network, 1978-1996. American Behav-ioral Scientist, 44(10), 1638–1655.
Barnett, G. A., & Park, H. W. (2005). The structure of interna-tional internet hyperlinks and bilateral bandwidth. Annals ofTelecommunications, 60(9), 1110–1127.
Barnett, G. A., & Park, H. W. (2014). Examining the internationalinternet using multiple measures: new methods for measur-ing the communication base of globalized cyberspace. Qual-ity & Quantity, 48(1), 563–575.
Barnett, G. A., Ruiz, J. B., Hammond, J. R., & Xin, Z. (2013).An examination of the relationship between internationaltelecommunication networks, terrorism and global newscoverage. Social Network Analysis and Mining, 3(3), 721–747.
Benaglia, T., Chauveau, D., Hunter, D. R., & Young, D. (2009).mixtools: An R package for analyzing finite mixture mod-els. Journal of Statistical Software, 32(6), 1–29. Retrievedfrom http://www.jstatsoft.org/v32/i06/
Benkler, Y. (2006). The wealth of networks: how social productiontransforms markets and freedom. New Haven: Yale Univer-sity Press.
Bonfadelli, H. (2002). The internet and knowledge gaps a the-oretical and empirical investigation. European Journal ofcommunication, 17(1), 65–84.
Castells, M. (2011). The rise of the network society: The infor-mation age: Economy, society, and culture (Vol. 1). Wiley-Blackwell.
Chinn, M. D., & Fairlie, R. W. (2006). The determinants of theglobal digital divide: a cross-country analysis of computerand internet penetration. Oxford Economic Papers.
Chinn, M. D., & Fairlie, R. W. (2010). Ict use in the developingworld: an analysis of differences in computer and internetpenetration. Review of International Economics, 18(1), 153–167.
Chung, F., Handjani, S., & Jungreis, D. (2003). Generalizations ofPolya’s urn problem. Annals of combinatorics, 7(2), 141–153.
Clauset, A., Shalizi, C., & Newman, M. (2009). Power-law distri-butions in empirical data. SIAM review, 51(4), 661–703.
Dasgupta, S., Lall, S., & Wheeler, D. (2005). Policy reform, eco-nomic growth and the digital divide. Oxford DevelopmentStudies, 33(2), 229–243.

12 HYUNJIN SEO
Deutsche Welle. (2014). German cabinet adopts "digi-tal agenda" for expanded broadband Internet. Re-trieved from http://www.dw.de/german-cabinet-adopts-digital-agenda-for-expanded-broadband-internet/a-17867699
Dustmann, C., Fitzenberger, B., Schönberg, U., & Spitz-Oener, A.(2014). From sick man of europe to economic superstar:Germany’s resurgent economy. The Journal of EconomicPerspectives, 28(1), 167–188.
Eeckhout, J. (2004). Gibrat’s law for (all) cities. American Eco-nomic Review, 1429–1451.
Eggenberger, F., & Pólya, G. (1923). Über die statistik ver-ketteter vorgänge. ZAMM-Journal of Applied Mathematicsand Mechanics/Zeitschrift für Angewandte Mathematik undMechanik, 3(4), 279–289.
Fink, C., & Kenny, C. J. (2003). W (h) ither the digital divide? info,5(6), 15–24.
Frank, S. A. (2014). How to read probability distributions as state-ments about process. Available at SSRN 2496734.
Galor, O. (1996). Convergence? inferences from theoretical mod-els. The Economic Journal, 1056–1069.
Giddens, A. (1990). The consequences of modernity. Cambridge:Polity.
Guillén, M. F., & Suárez, S. L. (2005). Explaining the global dig-ital divide: Economic, political and sociological drivers ofcross-national internet use. Social Forces, 84(2), 681–708.
Hafner, K., & Lyon, M. (1999). Where wizards stay up late: Theorigins of the Internet. Simon and Schuster.
Hassani, S. N. (2006). Locating digital divides at home, work, andeverywhere else. Poetics, 34(4), 250–272.
Heeks, R., & Kenny, C. J. (2001). Is the internet a technology ofconvergence or divergence? World Bank, Washington, DCProcessed.
Hilbert, M. (2014). Technological information inequality as anincessantly moving target: The redistribution of informa-tion and communication capacities between 1986 and 2010.Journal of the Association for Information Science and Tech-nology, 65(4), 821–835.
Hilbert, M., & López, P. (2011). The world’s technological capacityto store, communicate, and compute information. Science,332(6025), 60–65.
Hilbert, M., & López, P. (2012). How to measure the world’stechnological capacity to communicate, store and computeinformation? part ii: Measurement unit and conclusions. In-ternational Journal of Communication, 6, 936–955.
Howard, P. N. (2010). The digital origins of dictatorship anddemocracy: Information technology and political Islam. Ox-ford Univ Pr on Demand.
Howard, P. N., & Hussain, M. M. (2011). The role of digital media.Journal of Democracy, 22(3), 35–48.
Hyun, K. (2012). Americanization of web-based political commu-nication? a comparative analysis of political blogospheres inthe United States, the United Kingdom, and Germany. Jour-nalism & Mass Communication Quarterly, 89(3), 397–413.
International Telecommunications Union. (2012). Itu measuringthe information society 2012 report.
Internet World Stats. (2014). Internet world stats. Retrieved fromhttp://www.internetworldstats.com
Ioannides, Y. M. (2013). From neighborhoods to nations: The eco-nomics of social interactions. Princeton University Press.
James, J. (2007). From origins to implications: Key aspects inthe debate over the digital divide. Journal of InformationTechnology, 22(3), 284–295.
Jovanovic, B., & Rob, R. (1989). The growth and diffusion ofknowledge. The Review of Economic Studies, 56(4), 569–582.
Kiiski, S., & Pohjola, M. (2002). Cross-country diffusion of the in-ternet. Information Economics and Policy, 14(2), 297–310.
Lee, C., & Chan-Olmsted, S. M. (2004). Competitive advantage ofbroadband internet: a comparative study between south ko-rea and the united states. Telecommunications Policy, 28(9),649–677.
Lee, S., Monge, P., Bar, F., & Matei, S. (2007). The emergence ofclusters in the global telecommunications network. Journalof Communication, 57(3), 415–434.
Liang, B., & Lu, H. (2010). Internet development, censorship, andcyber crimes in china. Journal of Contemporary CriminalJustice, 26(1), 103–120.
Mahmoud, H. (2008). Pólya urn models. CRC press.Manyika, J., & Roxburgh, C. (2011, October). The great trans-
former: The impact of the Internet on economic growth andprosperity (Tech. Rep.). McKinsey Global Institute.
Monge, P., & Contractor, N. (2003). Theories of communicationnetworks. Oxford University Press, USA.
Mossberger, K., Tolbert, C. J., & Hamilton, A. (2012). Broadbandadoption| measuring digital citizenship: Mobile access andbroadband. International Journal of Communication, 6, 37.
Newman, M., Barabási, A.-L., & Watts, D. J. (2006). The structureand dynamics of networks. Princeton University Press.
Norris, P. (2003). Digital divide: Civic engagement, informationpoverty, and the internet worldwide (Vol. 40). Taylor &Francis.
Oyelaran-Oyeyinka, B., & Adeya, C. (2004). Internet access inAfrica: empirical evidence from Kenya and Nigeria. Telem-atics and Informatics, 21(1), 67-81.
Park, H. W., Barnett, G. A., & Chung, C. J. (2011). Structuralchanges in the 2003–2009 global hyperlink network. Globalnetworks, 11(4), 522–542.
Pejovic, V., Johnson, D. L., Zhelva, M., Belding, E., Parks, L., &Van Stam, G. (2012). The bandwidth divide: Obstaclesto efficient broadband adoption in rural sub-saharan africa.International Journal of Communication, 6, 2467–2491.
Pierson, P. (2000). Increasing returns, path dependence, and thestudy of politics. American political science review, 251–267.
Piketty, T. (2014). Capital in the twenty-first century. HarvardUniversity Press.
Quibria, M. G., Ahmed, S. N., Tschang, T., & Reyes-Macasaquit,M.-L. (2003). Digital divide: Determinants and policies withspecial reference to asia. Journal of Asian Economics, 13(6),811–825.
Roycroft, T., & Anantho, S. (2003). Internet subscription in Africa:policy for a dual digital divide. Telecommunications Policy,27(1), 61–74.
Shalizi, C. (2013). Advanced data analysis from an elementarypoint of view. (2013 draft)

MIXTURE MODEL 13
Standage, T. (1998). The Victorian internet: the remarkable storyof the telegraph and the nineteenth century’s online pioneers.Weidenfeld & Nicolson London.
Sverdlik, Y. (2014). Finland building direct subma-rine cable to Germany. Retrieved from http://www.datacenterknowledge.com/archives/2014/12/04/submarine-cable-to-germany-to-boost-finland-internet-bandwidth/
TeleGeography. (2012). Global Internet geography (Tech. Rep.).PriMetrica, Inc.
Van Dijk, J. (2005). The deepening divide: Inequality in the infor-mation society. Sage Publications, Incorporated.
Vinciguerra, S., Frenken, K., & Valente, M. (2010). The geog-raphy of internet infrastructure: an evolutionary simulationapproach based on preferential attachment. Urban Studies,47(9), 1969–1984.
Vuong, Q. H. (1989). Likelihood ratio tests for model selectionand non-nested hypotheses. Econometrica: Journal of theEconometric Society, 307–333.
Wong, P.-K. (2002). Ict production and diffusion in asia digital div-idends or digital divide? Information Economics and Policy,14(2), 167–187.
Wunsch-Vincent, S., & Vickery, G. (2010). The evolution of newsand the internet. OECD.
Yu, L. (2006). Understanding information inequality: Making senseof the literature of the information and digital divides. Jour-nal of Librarianship and Information Science, 38(4), 229–252.
Zenou, Y., & Jackson, M. (2013). Economic analyses of socialnetworks.