a migration signature and plasma biomarker panel for...
TRANSCRIPT

Research Article
A Migration Signature and Plasma Biomarker Panelfor Pancreatic Adenocarcinoma
Seetharaman Balasenthil1, Nanyue Chen1, Steven T. Lott1, Jinyun Chen2, Jennifer Carter3,William E. Grizzle4, Marsha L. Frazier2, Subrata Sen3, and Ann McNeill Killary1
AbstractPancreatic ductal adenocarcinoma is a disease of extremely poor prognosis for which there are no reliable
markers of asymptomatic disease. To identify pancreatic cancer biomarkers, we focused on a genomic
interval proximal to the most common fragile site in the human genome, chromosome 3p12, which
undergoes smoking-related breakage, loss of heterozygosity, and homozygous deletion as an early event in
many epithelial tumors, including pancreatic cancers. Using a functional genomic approach, we identified
a seven-gene panel (TNC, TFPI, TGFBI, SEL-1L, L1CAM, WWTR1, and CDC42BPA) that was differentially
expressed across three different expression platforms, including pancreatic tumor/normal samples. In
addition, Ingenuity Pathways Analysis (IPA) and literature searches indicated that this seven-gene panel
functions in one network associated with cellular movement/morphology/development, indicative of a
"migration signature" of the 3p pathway. We tested whether two secreted proteins from this panel, tenascin
C (TNC) and tissue factor pathway inhibitor (TFPI), could serve as plasma biomarkers. Plasma ELISA assays
for TFPI/TNC resulted in a combined area under the curve (AUC) of 0.88 and, with addition of CA19-9, a
combined AUC for the three-gene panel (TNC/TFPI/CA19-9), of 0.99 with 100% specificity at 90%
sensitivity and 97.22% sensitivity at 90% specificity. Validation studies using TFPI only in a blinded sample
set increased the performance of CA19-9 from an AUC of 0.84 to 0.94 with the two-gene panel. Results
identify a novel 3p pathway–associatedmigration signature and plasma biomarker panel that has utility for
discrimination of pancreatic cancer from normal controls and promise for clinical application. Cancer Prev
Res; 4(1); 137–49. �2010 AACR.
Introduction
Pancreatic cancer is the fourth leading cause of cancer-related mortality in both men and women in the UnitedStates. Estimates suggest that virtually 83% of the morethan 42,470 cases in the United States diagnosed with thedisease will also die from it, making pancreatic cancer themost deadly of cancers when grouped by organ site (1).Biomarkers for the early detection of pancreatic cancer areurgently needed. However, individual molecular bio-markers with high sensitivity and specificity needed for
population-based screening have not been discovered.CA19-9 has been studied extensively and yet has failedto show the desired predictive value necessary for earlydetection and diagnosis (2). Although many high-throughput discovery platforms including proteomic,genomic, and transcriptomic approaches have been uti-lized and biomarker candidates identified, no one plat-form or molecule has been successfully validated in largepopulation screens. As a part of the National CancerInstitute (NCI) Early Detection Research Network(EDRN), our goal is to assemble a panel of blood-basedbiomarker candidates, given that no one biomarker hasyet shown promise for early detection. We hypothesizedthat a panel of early detection biomarkers for pancreaticcancer could be discovered by the identification of theearliest genetic pathways aberrant in smoking-relatedcancers such as lung, renal, and pancreatic cancers. Evi-dence that the driver events in smoking-related cancersremain to be discovered comes from the sequencing ofthe cancer genomes of 24 cases of pancreatic adenocarci-noma (3). Results indicated that although smokers have asignificantly higher number of genetic alterations than dononsmokers, including mutations, homozygous dele-tions, and amplifications, smoking-related genetic altera-tions did not seem to correlate with known driver genes
Authors' Affiliations: Departments of 1Genetics, 2Epidemiology, and3Molecular Pathology, The University of Texas M. D. Anderson CancerCenter, Houston, Texas; and 4The Department of Pathology and TheComprehensive Cancer Center, The University of Alabama, Birmingham,Alabama
Note: Supplementary data for this article are available at Cancer Preven-tion Research Online (http://cancerprevres.aacrjournals.org/).
S. Balasenthil, N. Chen, and S.T. Lott contributed equally to this work.
Corresponding Author: Ann McNeill Killary, Department of Genetics, TheUniversity of Texas M. D. Anderson Cancer Center, Houston, TX 77030.Phone: 713-834-6395; Fax: 713-792-1474; E-mail: [email protected].
doi: 10.1158/1940-6207.CAPR-10-0025
�2010 American Association for Cancer Research.
CancerPreventionResearch
www.aacrjournals.org 137
Research. on April 23, 2019. © 2011 American Association for Cancercancerpreventionresearch.aacrjournals.org Downloaded from
Published OnlineFirst November 11, 2010; DOI: 10.1158/1940-6207.CAPR-10-0025

mutated in pancreatic cancer, including KRAS, p53,CDKN2A/p16, etc., suggesting that the genetic determi-nants of smoking-related tumors are not driven by thesemajor genes (3). Thus, we furthermore hypothesized that,to identify the earliest genetic alterations associated withpancreatic cancer, we must target the most commonintervals of cytogenetic deletion associated with tobaccoexposure, given that these alterations might be shared byboth smoking-related and non–smoking-related pancrea-tic cancer. Loss of chromosome 3p has been documentedas an initiating event in a cytogenetic pathway involved insmoking-related cancers; thus, we chose a functionalgenomic approach to target the genetic pathway deregu-lated by the deletion of the chromosome 3p12 region.This genomic interval is known to undergo loss of het-erozygosity (LOH) and homozygous deletion in smok-ing-related tumors and is proximal to the most commonfragile site in the human genome, FRA3B, which has beenshown to be expressed in active smokers and thought tofacilitate chromosome breakage following carcinogenicexposure from tobacco (4). High-frequency LOH hasbeen observed in the FRA3B region encompassing3p13–3p21 in a variety of epithelial cancers with homo-zygous deletions found proximal to the fragile site inlung, breast, and pancreatic tumors, suggestive that dele-tion of this genetic interval could be an early event in thegenesis of smoking-related cancers (5). Our previousphysical and functional mapping experiments showedthat the introduction of a normal copy of chromosome3p into renal cell carcinoma cell lines via microcell fusionsuppressed tumorigenicity in nude mice in both ortho-tropic and subcutaneous injections (6–8). Fine mappingof suppressed and unsuppressed hybrids localized theNRC-1 tumor suppressor locus to a 4.75-Mb intervalwithin chromosome 3p12 (9). In addition, we previouslydemonstrated high-frequency LOH in distinct intervalsalong 3p in malignant pancreatic islet cell tumors but notin precursor cystic lesions in a kindred with von Hippel–Lindau disease, an autosomal dominant cancer syndromecharacterized by the development of multiple tumortypes, two of which progress to malignancy (renal andpancreas), suggestive that loss of 3p proximal to VHLis requisite for malignant conversion (7). Experimentsreported herein document the utility of a functionalgenomic approach not only to identify 3p12 pathwaygenes differentially expressed in pancreatic tumor/normalsamples, but also to determine their relevance as blood-based pancreatic cancer biomarkers.
Materials and Methods
Patients and clinical samplesEDTA plasma samples from pancreatic adenocarcinoma
cases were obtained from the TEXGEN repository, a TexasMedical Center consortium that houses sera and plasmafrom MD Anderson Cancer Center, Baylor, and TexasChildren’s Hospital. Control plasma was obtained fromindividuals who were screened for different cancers and
were free of malignancy or any benign condition. Forvalidation purposes, a blinded set of EDTA plasma samplesfrom controls and pancreatic adenocarcinoma patientswere also obtained from The University of Alabama(UAB; W.E.G.).
RNA extraction, microarray, and quantitative real-time PCR analyses
Frozen pancreatic tumors and adjacent macroscopicallyand microscopically normal appearing pancreas from thesame patients (matched) were obtained from untreated,retrospective pancreatic adenocarcinoma samples availablefrom the M. D. Anderson Cancer Center tumor bank andour collaborator (MLF). Total RNA was extracted fromthese samples using a miRNeasy Mini Kit (Qiagen). Micro-array hybridization and scanning was done according toAffymetrix protocols. Quantitative real-time PCR (RT-PCR)analysis was carried out as per manufacturer’s protocol(Applied Biosystems), using specific primers. Data wereanalyzed according to the comparative Ctmethod andwerenormalized by glyceraldehyde-3-phosphate dehydrogenaseexpression.
Suppression subtractive hybridization libraryThe suppression subtractive hybridization (SSH) library
was previously constructed using as starting materials forlibrary construction microcell hybrids formed by the intro-duction of defined fragments of a normal chromosome 3pinto a renal cell carcinoma cell line and subsequent assay ofthose microcell hybrids for tumor formation in athymicnude mice (10). We hypothesized that the resultant differ-entially expressed cDNAs obtained from the SSH libraryshould represent genes up- or downregulated by the intro-duction of the NRC-1 tumor suppressor locus and couldrepresent genes in a functional chromosome 3p12 tumorsuppression pathway. Conversely, identification of thispathway could elucidate how loss of this genomic regionand deregulation of this pathway could be involved in theearly stages of pancreatic cancer. We furthermore hypothe-sized that characterization of this library could definegenetic networks in pancreatic cancer that could serve asa source for biomarkers for early detection.
Bioinformatic analysesTo generate the highest quality expression data, the
PDNN (positional-dependent-nearest-neighbor) modelwas chosen to account for existing probe variation inspecific binding with the labeled target material (11).Existing algorithms, such as MAS 5.0, do not take intoaccount probe-specific variation in binding efficiency andcan result in variation in probe signal that vary more than2 orders of magnitude within a single probe set. Probenormalization and summarization was done using thePerfectMatch software suite utilizing the PDNN algorithm(http://bioinformatics.mdanderson.org/software.html).For each probe set, the software outputs both the naturallogarithm transformed expression level and correlationcoefficient between the observed and modeled data. Data
Balasenthil et al.
Cancer Prev Res; 4(1) January 2011 Cancer Prevention Research138
Research. on April 23, 2019. © 2011 American Association for Cancercancerpreventionresearch.aacrjournals.org Downloaded from
Published OnlineFirst November 11, 2010; DOI: 10.1158/1940-6207.CAPR-10-0025
was filtered to identify genes exhibiting 2-fold or greaterchanges in gene expression.
Network and gene ontology analysisSelected genes were investigated for network and gene
functional interrelation by Ingenuity Pathways Analysis(IPA) software (Ingenuity Systems, www.ingenuity.com;ref. 12). IPA scans the set of input genes to identify networksbyusing IngenuityPathwaysKnowledgeBase for interactionsbetween identified "Focus Genes," in our case, the commongenes identified from our pathways approach and knownand hypothetical interacting genes stored in the knowledgebase in IPA software, to generate a set of networks with amaximum network size of 35 genes/proteins. Networks aredisplayed graphically as genes/gene products ("nodes") withthe biological relationships between the nodes ("edges")identified. All edges are from canonical information storedin the Ingenuity Pathways Knowledge Base. In addition, IPAcomputes a score for each network according to the fit of theuser’s set of significant genes. The score indicates the like-
lihood of the Focus Genes in a network from the Ingenuityknowledgebasebeing found togetherdue to randomchance.A score of 3, as the cutoff for identifying gene networks,indicates that there is only a 1/1,000 chance that the focusgenes shown in a network are due to random chance. There-fore, a score of 3 or higher indicates a 99.9% confidence levelto exclude random chance.
TNC-L ELISAPlasma levels of the predominant isoform of tenascin C
(TNC), TNC-large variant (TNC-L), were determined usinga Human Tenascin-C Large (HMV; FNIII-B) ELISA kit (IBL-America), which detects the human TNC high-molecular-weight variant by sandwich ELISA. Samples were diluted100-fold and then incubated in 96-well ELISA plates pre-coated with anti-TNC (4C8MS) antibody (Ab) for 1 hour at37�C. After washing the wells 7 times with wash buffer, ahorseradish peroxidase–conjugated anti-TNC (4F10TT) Abwas added and incubated for 30 minutes at 4�C. Afterwashing the wells 9 times with wash buffer, chromogen
Path designer network 1m
Extracellular space
ComplexLegend
Cytokinel/Growth FactorEnzymeGroup/Complex/OtherGrowth factor
KinasePeptidasePhosphatase
Transcription RegulatorTransporterUnknownRelationshipRelationship
A B
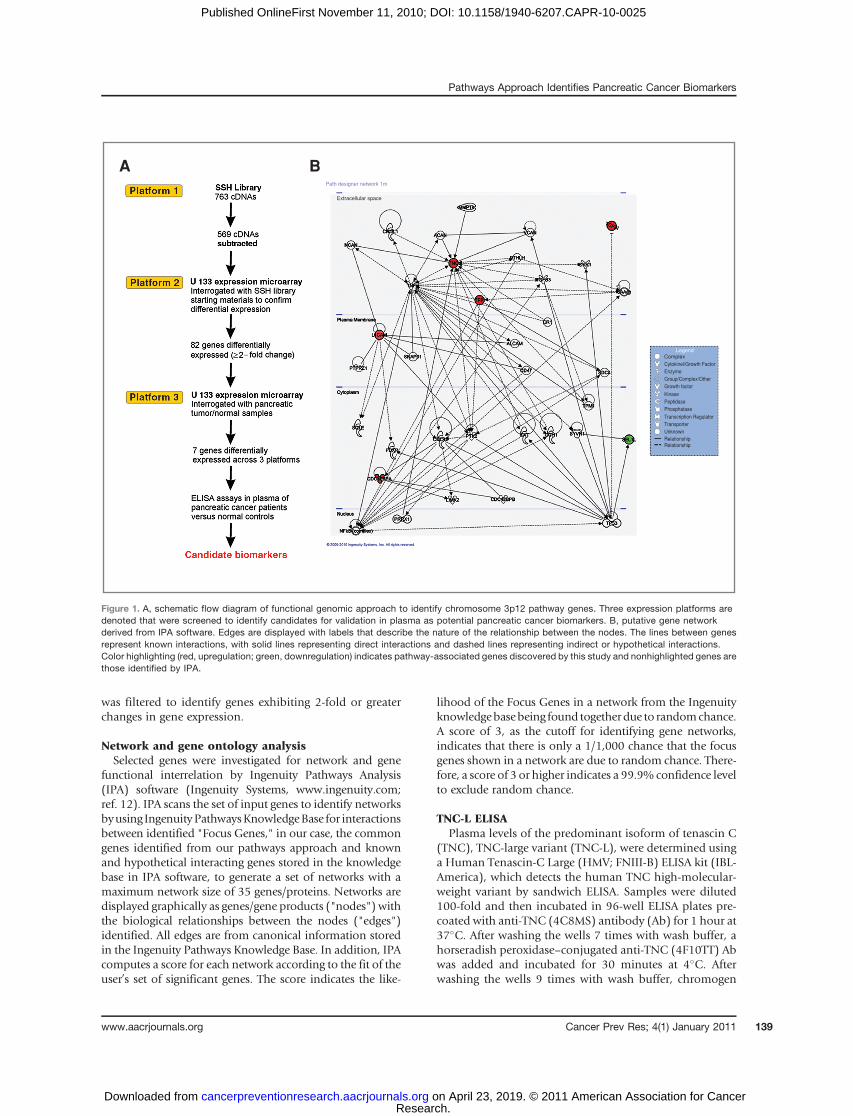
Figure 1. A, schematic flow diagram of functional genomic approach to identify chromosome 3p12 pathway genes. Three expression platforms aredenoted that were screened to identify candidates for validation in plasma as potential pancreatic cancer biomarkers. B, putative gene networkderived from IPA software. Edges are displayed with labels that describe the nature of the relationship between the nodes. The lines between genesrepresent known interactions, with solid lines representing direct interactions and dashed lines representing indirect or hypothetical interactions.Color highlighting (red, upregulation; green, downregulation) indicates pathway-associated genes discovered by this study and nonhighlighted genes arethose identified by IPA.
Pathways Approach Identifies Pancreatic Cancer Biomarkers
www.aacrjournals.org Cancer Prev Res; 4(1) January 2011 139
Research. on April 23, 2019. © 2011 American Association for Cancercancerpreventionresearch.aacrjournals.org Downloaded from
Published OnlineFirst November 11, 2010; DOI: 10.1158/1940-6207.CAPR-10-0025
was added and incubated at room temperature in dark for30 minutes. The reaction was stopped by the addition ofstop solutionand the absorbanceat 450nmwasdeterminedusing an ELISA plate reader (Spectramax Plus384 MicroplateReader; Molecular Devices) within 30 minutes of additionof stop solution, with the correction wavelength set at540 nm. Results were mean absorbance of duplicate wells.
TFPI ELISAPlasma tissue factor pathway inhibitor (TFPI) levels were
determined using a commercially available QuantikineHumanTFPI ELISA kit (DTFP10; R&DSystems, Inc.), whichdetects predominantly free TFPI and a very small percentageof LDL and HDL (low- and high-density lipoprotein)–bound TFPI by sandwich ELISA. The samples were diluted200-fold and then incubated along with an assay diluent in96-well ELISA plates precoated with anti-human TFPImonoclonal Ab for 2 hours at room temperature. Afterwashing the wells 4 times with wash buffer, a horseradishperoxidase–conjugated anti-human TFPI was added andincubated for 1 hour at room temperature. After washingthe wells 4 times with wash buffer, chromogen with sub-stratewas added and incubated at room temperature in darkfor 30minutes. The reactionwas stopped by the addition ofstop solutionand the absorbanceat 450nmwasdeterminedusing an ELISA plate reader (Spectramax Plus384 MicroplateReader; Molecular Devices) within 30 minutes of additionof stop solution, with the correction wavelength set at540 nm. Results were mean absorbance of duplicate wells.
CA19-9 ELISACA19-9 levels were measured in plasma samples (10 mL)
using a commercially available ELISA kit (DRG Interna-tional Inc.) according to manufacturer’s instructions. Tenmicroliters of each sample was incubated along with anassay buffer in 96-well ELISA plates precoated with murinemonoclonal anti-CA19-9 Ab for 90 minutes at 37�C. Afterwashing the wells 5 times with wash buffer, a horseradishperoxidase–conjugated anti-CA19-9 was added and incu-bated for 90minutes at 37�C.Afterwashing thewells 5 timeswith wash buffer, chromogen with substrate was added andincubated at room temperature in dark for 20 minutes. Thereaction was stopped by the addition of stop solution andthe absorbance at 450 nm was determined using an ELISAplate reader (Spectramax Plus384 Microplate Reader; Mole-cular Devices) within 15 minutes of addition of stop solu-tion. Results were mean absorbance of duplicate wells.
For these experiments, we did not assign predeterminedcutoff values to assess the specificity and sensitivity.
StatisticsDifferences in plasma levels between normal and pan-
creatic adenocarcinoma were analyzed using the Student’st test. To provide additional statistical rigor, the Mann–Whitney U test was also used to analyze the differencebetween normal and pancreatic adenocarcinoma samples.Two-sided P < 0.05 values were considered statisticallysignificant. We constructed receiver operating characteristic
(ROC) curves and calculated the area under the curve(AUC) to evaluate the specificity and sensitivity of predict-ing cases and controls by each protein and by the combi-nation of these proteins. All statistical analyses were doneusing the Stata 10.1 (Stata Corporation).
Results
SSH library identifies candidate chromosome 3p12pathway genes
Three different expression platforms were utilized toidentify genes in the chromosome 3p12 pathway to tumor-igenesis in pancreatic cancer (schematically illustrated inFig. 1A). We previously constructed an SSH library using asstarting materials for library construction, microcell hybridclones containing defined fragments of chromosome 3p12that were either suppressed or unsuppressed for tumori-gencity following injection of microcell hybrid clones intoathymic nude mice (10). cDNAs differentially expressedfrom this SSH library should represent genes up- or down-regulated by the 3p12 tumor suppressor locus and, there-fore, represent a 3p12 downstream pathway for biomarkerdiscovery. From the SSH library, 880 partial cDNAs wereobtained that were differentially expressed between sup-pressed and unsuppressed hybrids. PCR products wereobtained from 763 clones (87% of the library) and usedas templates for sequencing. A total of 569 of 763 clones(75%) were identified as subtracted because of the presenceof appropriate adaptors and BLAST searches against theRefSeq database indicated 117 clones had no matches,short or poor quality sequence, or chimerism. The remain-der of the 452 of 763 clones produced 2,297 sequences;however, a number of duplications were present in thelibrary. After filtering for redundancy and for only thosesequences with Entrez Gene matches, 507 Entrez Genematches were obtained (Supplementary Table S1, Supple-mentary Appendix).
Expression profiling validates SSH libraryTo validate differential expression observed in the
sequenced cDNA clones obtained from the SSH library,we utilized a second expression platform. Followinganalysis using the PerfectMatch software, probe sets over-lapping the 507 Entrez Gene sequences from the SSHlibrary were identified on a GeneChip U133 plus 2.0 array(Affymetix, Inc.) and examined for differential expressionby interrogating the array with the starting materials forconstruction of the SSH library, i.e., microcell hybridscontaining fragments of 3p used to construct the SSHlibrary. By screening the same cDNAs identified fromthe SSH library on a commercial array, we were able todirectly compare expression profiles across platformsto identify differentially expressed sequences, which wesubsequently filtered by bioinformatics analyses to iden-tify those genes with expression differences of 2-fold orgreater. Supplementary Table S2 illustrates the 82-genelist of chromosome 3p12 pathways genes identified bythis approach.
Balasenthil et al.
Cancer Prev Res; 4(1) January 2011 Cancer Prevention Research140
Research. on April 23, 2019. © 2011 American Association for Cancercancerpreventionresearch.aacrjournals.org Downloaded from
Published OnlineFirst November 11, 2010; DOI: 10.1158/1940-6207.CAPR-10-0025

Expression analyses of pancreatic tumor/normalsamples provide a third platform to stratify dataTo identify those genes of the 82-gene list that were
relevant to pancreatic cancer, we identified probe sets ona U133A plus 2.0 array corresponding to the 82-gene setand then interrogated the array with pancreatic tumor/normal samples. Frozen tumor and adjacent macroscopi-cally and microscopically normal appearing pancreatictissues from the same patient (matched) were obtainedfrom untreated, retrospective pancreatic adenocarcinomasamples available from the M. D. Anderson Cancer Centertumor bank and our collaborator (MLF). The characteristicsof the patients used for this study are presented in Supple-mentary Table S3. Total RNA from matched tumor/adja-cent normal samples (8 paired samples) was utilized tointerrogate the array and resultant bioinformatics analysisdone to identify differentially expressed sequences acrossall 3 platforms. Bioinformatics analysis involved the stra-tification of the data set by selecting only those genes fromthe 82 gene list that were significantly differentiallyexpressed across all 3 expression platforms resulting in a7 gene set (P < 0.05; Table 1). The 7-gene panel [WWTR1(13, 14), TGFBI (15, 16), TFPI (17, 18), CDC42BPA (19,20), L1CAM (21, 22), TNC (23, 24), and SEL-1L (25, 26)]showed at least 2-fold or greater difference in gene expres-sion and consistently remained as top candidates that weredifferentially expressed across 3 platforms. One gene, SEL-1L, was significantly downregulated in 8 of 8 tumors ascompared with normal adjacent tissue, although the other6 genes were upregulated. Importantly, 5 of 7 genes hadalso been previously published as being differentiallyexpressed by immunohistochemistry (IHC) in pancreatictumor samples. In addition, SEL-1L and TNC were differ-entially expressed by quantitative RT-PCR in 26 matchedpancreatic tumor/normal samples (P ¼ 0.002 andP ¼ 0.038, respectively; Supplementary Table S4).As another validation of our 7-gene biomarker panel, we
conducted in silico analyses of publicly available microarray
data sets from Oncomine (http://www.oncomine.org) todetermine whether the 7 genes identified by our functionalgenomic screenwere also found as differentially expressed inpublished pancreatic tumor /normal expression screens.Representative results of an individual data set (27), inwhichall our genebiomarkers of the 7-genepanel are expressed, arepresent in Supplementary Figure S1. Analysis of the biomar-ker panel showed that the expression of 6 genes (TNC, TFPI,TGFBI, LICAM, CDC42BPA, and WWTR1) was found to besignificantly upregulated in pancreatic cancer when com-paredwithnormalpancreatic tissue (SupplementaryFig. S1).In contrast, SEL-1L was found to be significantly downregu-lated in pancreatic adenocarcinomas compared with thenormal pancreas (Supplementary Fig. S1). Furthermore,we also analyzed the expression of our panel in 3 differentexpressiondata sets obtained frommicrodissectedpancreatictumor/normal samples (28–30). Importantly, althoughnone of the 3 databases listed all 7 genes as differentiallyexpressed, subsetsof eachgenebiomarkerof the7-genepanelwere represented in these data sets as well (SupplementaryFigs. S2 andS3). Thus, in silico analyses confirmedour studiesusing cross-platform functional approaches, although noneof the previously published compendiums of expressionprofiles identified these genes as a panel or studied theirpotential asblood-basedpancreatic cancerbiomarkers. Thus,our functional approach identified a novel panel differen-tially expressed in multiple data sets that hitherto had notbeen studied for blood-based biomarker development.
IPA identifies a single network and migrationsignature for 3p pathway genes
To determine the functional relationships among the7 genes confirmed by our functional genomic pathwaystudies, IPA was queried for known or hypothetical inter-actions among the 7 genes in the panel and also all othergenes in the Ingenuity database. With the exception ofWWTR1/TAZ, which was not present in the IPA database,all the other 6 genes were used as focus genes for IPA.
Table 1. Seven-gene panel of candidate biomarkers identified from screening across 3 expressionplatforms
Symbol Title Major biological functions References
WWTR1/TAZ WW domain containingtranscription regulator 1
Cofactor of transcription, cell migration, EMT 13, 14
TGFBI Transforming growth factor,beta-induced, 68 kDa
Cell adhesion, migration, cell–matrixinteraction
15, 16
TFPI Tissue factor pathway inhibitor Cell adhesion, migration, and proliferation 17, 18CDC42BPA CDC42 binding protein
kinase alpha (DMPK-like)Cell morphogenesis, cell signaling 19, 20
L1CAM L1 cell adhesion molecule Cell morphogenesis, migration, and cellsurvival
21, 22
TNC Tenascin C (hexabrachion) Cell adhesion, migration, proliferation,and angiogenesis
23, 24
SEL-1L Sel-1 suppressor of lin-12-like Negative regulation of colony formation,growth, and invasion; cell–matrix interaction
25, 26
Pathways Approach Identifies Pancreatic Cancer Biomarkers
www.aacrjournals.org Cancer Prev Res; 4(1) January 2011 141
Research. on April 23, 2019. © 2011 American Association for Cancercancerpreventionresearch.aacrjournals.org Downloaded from
Published OnlineFirst November 11, 2010; DOI: 10.1158/1940-6207.CAPR-10-0025

Unsupervised IPA network analysis identified a network of35 genes that included all 6 focus genes and 29 additionalgenes (score ¼ 16; Table 2). The interactive relationshipbetween the genes in the network is shown in Figure 1B.Importantly, all 6 genes were classified into a single net-work related to cellular movement, cell morphology, andcellular development (Table 2). Of the 6 genes, 5 were alsoa part of a network involving cell signaling and cell inter-action (P¼ 7.07E-06 to 3.07E-02) and cell movement (P¼1.38E-04 to 3.51E-02). The extremely low probability ofobtaining this number of differentially expressed mole-cules in one network by chance alone is reflected by theP value for the network (P ¼ 1.0E-16), indicating that thisnetwork is deregulated in a highly significant, nonrandommanner in pancreatic cancer cells. In addition, WWTR1/TAZ has also been reported to function in the regulation ofcell migration in breast cancer (13). Therefore, we concludethat our functional genomic pathway approach has iden-tified a gene signature related to cell movement, morphol-ogy, and organization, suggestive that the loss of the 3p12locus in pancreatic cancer could be related to change in cellmorphology and aberrant migration associated with earlyevents in malignant transformation of pancreatic ductalepithelial cells (Table 2).
TNC and TFPI are candidate plasma biomarkers thatdistinguish pancreatic cancer from normal screeningcontrols
Four of the genes of the 7-gene panel (TGFBI, TFPI,LICAM, and TNC) were also secreted proteins. SandwichELISA assays were then done on 2 of the 4 secreted proteins,TFPI and TNC, for which commercial ELISAs were availableto determine their ability to function as plasma biomarkers.The patient population characteristics used in the presentstudy with respect to age, sex, alcohol intake history, smok-ing history, diabetic history, site of the disease, staging, andsurvival data are presented in Table 3. Results indicated thatindividual plasma TNC-L levels, presented in the form of ascatter plot (Fig. 2A), were significantly different betweenpancreatic cancer patients and normal screening controls inthat the median plasma TNC-L levels was 342.6 pg/mL inpatients with pancreatic adenocarcinoma (n ¼ 36) as com-pared with levels in normal subjects (243.3; n ¼ 19;
Student’s t test, P ¼ 0.0006; Mann–Whitney’s U test, P ¼0.0004). Figure 2B illustrates the ROC curve for TNC. TheAUC was 0.79, with a specificity of 47% at 90% sensitivityand sensitivity of 25% at 90% specificity.
We next extended our study to further validate the signi-ficance of TFPI as a potential plasma biomarker by ELISA.Figure 2Cdepicts the individual plasmaTFPI levels ofnormaland pancreatic cancer patients. Plasma TFPI levels of patientswith pancreatic adenocarcinoma were significantly higherthan normal subjects (Student’s t test, P ¼ 0.0004; Mann–Whitney’s U test, P< 0.0001), with the median plasma TFPIlevel of 27.0 ng/mL in pancreatic adeonocarcinoma patients(n ¼ 36) compared with normal subjects (15.3; n ¼ 19).Figure 2D illustrates the ROC curve which compares theability of plasma TFPI to distinguish between patients withpancreatic cancer andnormal subjects. The AUC for TFPIwas0.87, with a specificity of 63% given 90% sensitivity anda sensitivity of 64% given 90% specificity.
We next tested whether the combination of the 2markersTNC and TFPI could increase sensitivity and specificity fordiscrimination between cancer and normal plasma sam-ples. The combined AUC for both markers was 0.88(Fig. 2E). The combination of markers resulted in a speci-ficity of 63% given 90% sensitivity and a sensitivity of 67%given 90% specificity. These combined results, then, suggestthat the 2-gene panel identified through our functionalgenomic studies has high sensitivity and specificity to dis-criminate tumor and normal samples in the plasma andindicate that these genes are candidate blood-based bio-markers for pancreatic cancer. The diagnostic potential ofcandidate biomarkers TNC and TFPI, relative to and incombination with CA19-9, the standard serum biomarkerfor pancreatic cancer, was determined. Results indicatedthat individual plasmaCA19-9 levels, presented in the formof a scatter plot (Fig. 2F), were significantly differentbetween pancreatic cancer patients and normal screen-ing controls in that the median plasma CA19-9 levels were173U/mL in patients with pancreatic adenocarcinoma (n¼36) as compared with levels in normal subjects (11.9; n ¼19; Student’s t test, P < 0.00001;Mann–Whitney’sU test, P <0.00001). Figure 2G illustrates the ROC curve for CA19-9,and the AUC was 0.93, with a specificity of 94.74% at 90%sensitivity and sensitivity of 91.67% at 90% specificity.
Table 2. Networks identified from IPA
Network Genes in Ingenuity networka Functions Scoreb
1 ACAN, ALCAM, CAT, CD47, CDC42, CDC42BPA, CDC42BPB,CHI3L1, CR1, DKK1, FDXR, GCH1, L1CAM, LIMK2, MMP19,NCAN, NFkB (complex), PRRX1, PTHLH, PTK2, PTPRZ1,SAA@, SDC4, SEL-1L, SNAP91, SQLE, SYVN1, TFPI, TGFB3,TGFBI, TNC, TNF, TP53, TPM1, VCAN
Cellular movement,Cell morphology,Cellular development
16
aGenes in boldface were identified from our functional genomic pathway approach as differentially expressed across 3 platforms asfocus genes; additional genes listed were identified by IPA.b A score >3 is considered significant.
Balasenthil et al.
Cancer Prev Res; 4(1) January 2011 Cancer Prevention Research142
Research. on April 23, 2019. © 2011 American Association for Cancercancerpreventionresearch.aacrjournals.org Downloaded from
Published OnlineFirst November 11, 2010; DOI: 10.1158/1940-6207.CAPR-10-0025
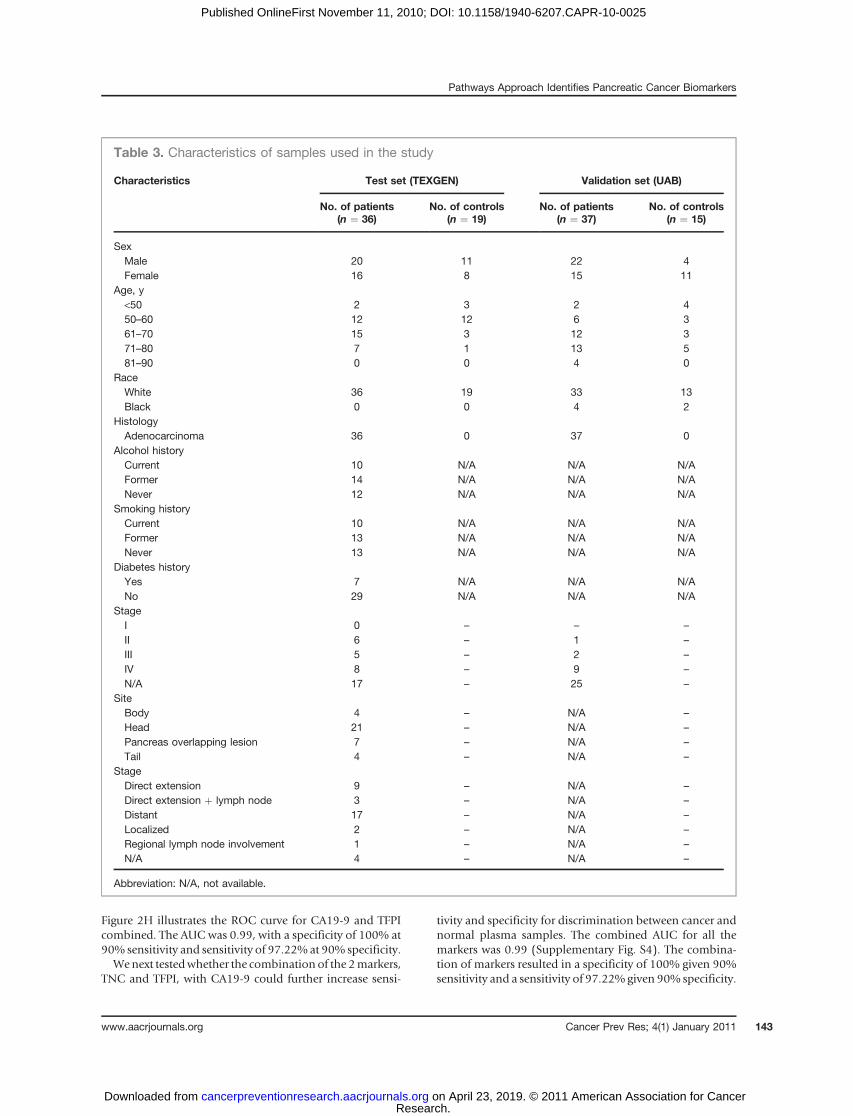
Figure 2H illustrates the ROC curve for CA19-9 and TFPIcombined. The AUC was 0.99, with a specificity of 100% at90% sensitivity and sensitivity of 97.22%at 90% specificity.Wenext testedwhether the combination of the 2markers,
TNC and TFPI, with CA19-9 could further increase sensi-
tivity and specificity for discrimination between cancer andnormal plasma samples. The combined AUC for all themarkers was 0.99 (Supplementary Fig. S4). The combina-tion of markers resulted in a specificity of 100% given 90%sensitivity and a sensitivity of 97.22% given 90% specificity.
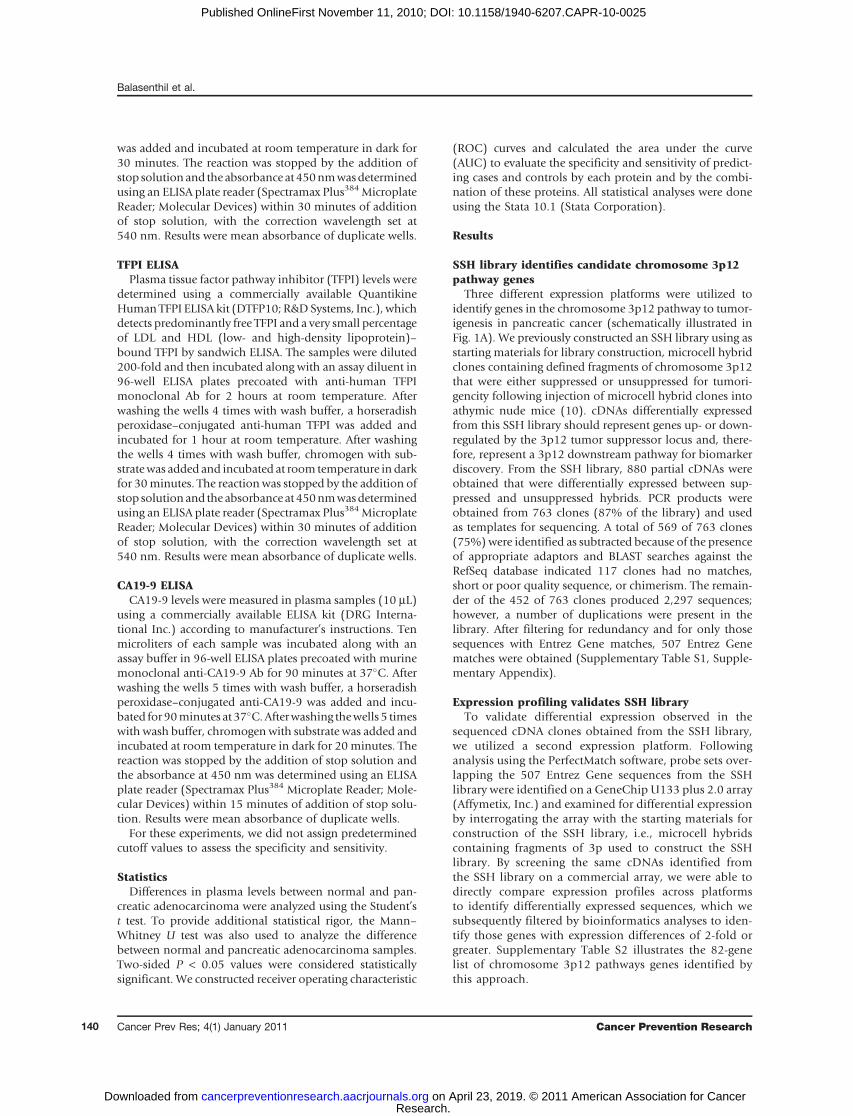
Table 3. Characteristics of samples used in the study
Characteristics Test set (TEXGEN) Validation set (UAB)
No. of patients(n ¼ 36)
No. of controls(n ¼ 19)
No. of patients(n ¼ 37)
No. of controls(n ¼ 15)
SexMale 20 11 22 4Female 16 8 15 11
Age, y<50 2 3 2 450–60 12 12 6 361–70 15 3 12 371–80 7 1 13 581–90 0 0 4 0
RaceWhite 36 19 33 13Black 0 0 4 2
HistologyAdenocarcinoma 36 0 37 0
Alcohol historyCurrent 10 N/A N/A N/AFormer 14 N/A N/A N/ANever 12 N/A N/A N/A
Smoking historyCurrent 10 N/A N/A N/AFormer 13 N/A N/A N/ANever 13 N/A N/A N/A
Diabetes historyYes 7 N/A N/A N/ANo 29 N/A N/A N/A
StageI 0 – – –
II 6 – 1 –
III 5 – 2 –
IV 8 – 9 –
N/A 17 – 25 –
SiteBody 4 – N/A –
Head 21 – N/A –
Pancreas overlapping lesion 7 – N/A –
Tail 4 – N/A –
StageDirect extension 9 – N/A –
Direct extension þ lymph node 3 – N/A –
Distant 17 – N/A –
Localized 2 – N/A –
Regional lymph node involvement 1 – N/A –
N/A 4 – N/A –
Abbreviation: N/A, not available.
Pathways Approach Identifies Pancreatic Cancer Biomarkers
www.aacrjournals.org Cancer Prev Res; 4(1) January 2011 143
Research. on April 23, 2019. © 2011 American Association for Cancercancerpreventionresearch.aacrjournals.org Downloaded from
Published OnlineFirst November 11, 2010; DOI: 10.1158/1940-6207.CAPR-10-0025

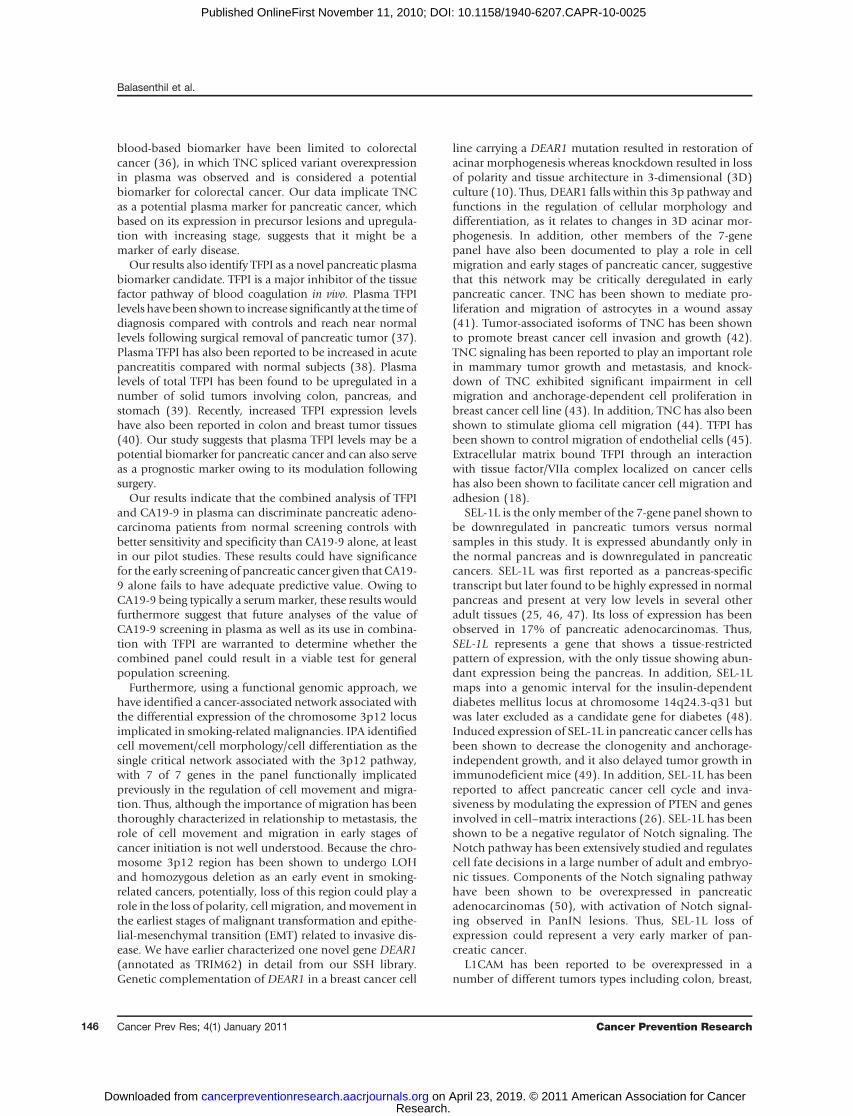
To further strengthen our findings and to validate ourresults in a different sample set, we tested TFPI levels byELISA in plasma samples from normal and pancreaticadenocarcinoma patients collected at the UAB. A descrip-tion of the UAB sample set is given in Table 3. Becausethe addition of TNC did not add significantly to thesensitivity and specificity (Supplementary Fig. S4), weanalyzed only TFPI levels in these samples. Figure 3Adepicts the individual plasma TFPI levels of normal andpancreatic cancer patients. Plasma TFPI levels of patientswith pancreatic adenocarcinoma were significantlyhigher than normal subjects (Student’s t test, P ¼0.000014; Mann–Whitney’s U test, P ¼ 0.0001), withthe median plasma TFPI level of 45.7 ng/mL in pancreaticadeonocarcinoma patients (n ¼ 37) compared with nor-mal subjects (25.6; n ¼ 15). Figure 3B illustrates the ROCcurve to compare the ability of plasma TFPI in distin-guishing between patients with pancreatic cancer andnormal subjects. The AUC for TFPI was 0.87 with aspecificity of 46.67% at 90% sensitivity and 70.27%sensitivity at 90% specificity.
Next, we analyzed CA19-9 by ELISA in these samples.Results indicated that individual plasma CA19-9 levels,presented in the form of a scatter plot (Fig. 3C), weresignificantly different between pancreatic cancer patientsand normal screening controls in that the medianplasma CA19-9 levels was 171.2 U/mL in patients withpancreatic adenocarcinoma (n ¼ 37) as compared withlevels in normal subjects (15.7; n ¼ 15; Student’s t test, P ¼0.0000000400227; Mann–Whitney’s U test, P ¼ 0.0001).Figure 3D illustrates the ROC curve for CA19-9, in whichthe AUC was 0.84, with a specificity of 13.33% at 90%sensitivity and 75.68% sensitivity at 90% specificity. Thecombined AUC for TFPI and CA19-9 was 0.94 (Fig. 3E).The combination of markers resulted in a specificity of86.67% at 90% sensitivity and 83.78% sensitivity at 90%specificity.
Discussion
Attempts to identify pancreatic cancer biomarkers havefailed to produce a single marker with the sensitivity and
A
E F G H
B C D
Figure 2. Candidate biomarkers from functional genomic approach validated in plasma of pancreatic cancer patients versus controls. A, plasma TNC-Lconcentrations of pancreatic carcinoma patients and normal subjects. Line, median plasma TNC level. The difference between normal and pancreaticadenocarcinoma samples is statistically significant (Mann–Whitney's U test, P ¼ 0.0004). B, ROC curve for differentiating normal and pancreaticcarcinoma patients on the basis of the plasma TNC ELISA assay. The AUC was 0.79. The specificity was 47% given 90% sensitivity and the sensitivitywas 25% given 90% specificity; C, plasma TFPI concentrations in pancreatic carcinoma patients and normal subjects. Line, median plasma TFPIlevel. The difference between normal and pancreatic adenocarcinoma samples is statistically significant (Mann–Whitney's U test, P < 0.0001). D, ROCcurve for differentiating normal and pancreatic carcinoma patients on the basis of the plasma TFPI ELISA assay. The AUC was 0.87. The specificitywas 63% given 90% sensitivity and the sensitivity was 64% given 90% specificity; E, ROC curve for differentiating normal and pancreaticcarcinoma patients on the basis of the combinations of 2 markers, plasma TNC and TFPI ELISA. The combined AUC is 0.88. F, plasma CA19-9concentrations of pancreatic carcinoma patients and normal subjects. Line, median plasma CA19-9 level. The difference between normal and pancreaticadenocarcinoma samples is statistically significant (Mann–Whitney's U test, P < 0.00001). G, ROC curve for differentiating normal and pancreaticcarcinoma patients on the basis of plasma CA19-9 ELISA assay. The AUC was 0.93, with a specificity of 94.74% at 90% sensitivity and sensitivityof 91.67% at 90% specificity; H, ROC curve for differentiating normal and pancreatic carcinoma patients on the basis of combinations of 2 markers,plasma CA19-9 and TFPI ELISA. The combined AUC was 0.99.
Balasenthil et al.
Cancer Prev Res; 4(1) January 2011 Cancer Prevention Research144
Research. on April 23, 2019. © 2011 American Association for Cancercancerpreventionresearch.aacrjournals.org Downloaded from
Published OnlineFirst November 11, 2010; DOI: 10.1158/1940-6207.CAPR-10-0025

specificity necessary for population screening. We reasonedthat a targeted strategy to identify differentially expressedgenes related to the earliest cytogenetic aberrations mightbe more successful in developing such biomarkers becausewe would be able to focus on those aberrantly expressedgenes that may be involved in initiating the pathways thatultimately lead to tumorigenesis, invasion, and metastasis.Using 3 different expression platforms, we identified a 7-gene set as being differentially expressed between pancrea-tic cancer and normal samples and from which we havevalidated a subset of markers for differential expression byELISA assays. Our results indicate that we have been able toidentify 2 relevant blood-based biomarker candidates for
pancreatic cancer. Several published reports document thepotential of using immunohistochemical staining of TNC,an extracellular matrix protein, as a potential marker ofearly disease as well as a predictor of poor prognosis inseveral tumor types, including colon, bladder, and pan-creas (31–34). TNC has been shown to be overexpressed inthe stroma by IHC in a variety of different cancers, includ-ing pancreatic cancer (31–33, 35). In addition to stromalexpression, TNC expression increases from low-gradePanIN-1A and -1B intraductal precursor lesions to high-grade PanIN-2 and -3 lesions to invasive lesions, suggestivethat TNC could be an early immunohistochemical markerof disease (31). However, reports of the utility of TNC as a
Figure 3. A, plasma TFPIconcentrations of pancreaticcarcinoma patients and normalsubjects. Line, median plasmaTFPI level. The difference betweennormal and pancreaticadenocarcinoma samples isstatistically significant (Mann–Whitney's U test, P¼ 0.0001). B,ROC curve for differentiatingnormal and pancreatic carcinomapatients on the basis of plasmaTFPI ELISA assay. The AUC was0.87 with a specificity of 46.67%at 90% sensitivity and 70.27%sensitivity at 90% specificity. C,plasma CA19-9 concentrations ofpancreatic carcinoma patientsand normal subjects. Line, medianplasma CA19-9 level. Thedifference between normal andpancreatic adenocarcinomasamples is statistically significant(Mann–Whitney's U test, P¼0.0001). D, ROC curve fordifferentiating normal andpancreatic carcinoma patients onthe basis of plasma CA19-9 ELISAassay. The AUC was 0.84, with aspecificity of 13.33% at 90%sensitivity and 75.68% sensitivityat 90% specificity. E, ROC curvefor differentiating normal andpancreatic carcinoma patients onthe basis of combinations of 2markers, plasma CA19-9 and TFPIELISA. The combined AUC was0.94 and resulted in a specificity of86.67% at 90% sensitivity and83.78% sensitivity at 90%specificity.
A
C D
E
B
Pathways Approach Identifies Pancreatic Cancer Biomarkers
www.aacrjournals.org Cancer Prev Res; 4(1) January 2011 145
Research. on April 23, 2019. © 2011 American Association for Cancercancerpreventionresearch.aacrjournals.org Downloaded from
Published OnlineFirst November 11, 2010; DOI: 10.1158/1940-6207.CAPR-10-0025
blood-based biomarker have been limited to colorectalcancer (36), in which TNC spliced variant overexpressionin plasma was observed and is considered a potentialbiomarker for colorectal cancer. Our data implicate TNCas a potential plasma marker for pancreatic cancer, whichbased on its expression in precursor lesions and upregula-tion with increasing stage, suggests that it might be amarker of early disease.
Our results also identify TFPI as a novel pancreatic plasmabiomarker candidate. TFPI is a major inhibitor of the tissuefactor pathway of blood coagulation in vivo. Plasma TFPIlevels havebeen shown to increase significantly at the timeofdiagnosis compared with controls and reach near normallevels following surgical removal of pancreatic tumor (37).Plasma TFPI has also been reported to be increased in acutepancreatitis compared with normal subjects (38). Plasmalevels of total TFPI has been found to be upregulated in anumber of solid tumors involving colon, pancreas, andstomach (39). Recently, increased TFPI expression levelshave also been reported in colon and breast tumor tissues(40). Our study suggests that plasma TFPI levels may be apotential biomarker for pancreatic cancer and can also serveas a prognostic marker owing to its modulation followingsurgery.
Our results indicate that the combined analysis of TFPIand CA19-9 in plasma can discriminate pancreatic adeno-carcinoma patients from normal screening controls withbetter sensitivity and specificity than CA19-9 alone, at leastin our pilot studies. These results could have significancefor the early screening of pancreatic cancer given that CA19-9 alone fails to have adequate predictive value. Owing toCA19-9 being typically a serummarker, these results wouldfurthermore suggest that future analyses of the value ofCA19-9 screening in plasma as well as its use in combina-tion with TFPI are warranted to determine whether thecombined panel could result in a viable test for generalpopulation screening.
Furthermore, using a functional genomic approach, wehave identified a cancer-associated network associated withthe differential expression of the chromosome 3p12 locusimplicated in smoking-related malignancies. IPA identifiedcell movement/cell morphology/cell differentiation as thesingle critical network associated with the 3p12 pathway,with 7 of 7 genes in the panel functionally implicatedpreviously in the regulation of cell movement and migra-tion. Thus, although the importance of migration has beenthoroughly characterized in relationship to metastasis, therole of cell movement and migration in early stages ofcancer initiation is not well understood. Because the chro-mosome 3p12 region has been shown to undergo LOHand homozygous deletion as an early event in smoking-related cancers, potentially, loss of this region could play arole in the loss of polarity, cell migration, andmovement inthe earliest stages of malignant transformation and epithe-lial-mesenchymal transition (EMT) related to invasive dis-ease. We have earlier characterized one novel gene DEAR1(annotated as TRIM62) in detail from our SSH library.Genetic complementation of DEAR1 in a breast cancer cell
line carrying a DEAR1 mutation resulted in restoration ofacinar morphogenesis whereas knockdown resulted in lossof polarity and tissue architecture in 3-dimensional (3D)culture (10). Thus, DEAR1 falls within this 3p pathway andfunctions in the regulation of cellular morphology anddifferentiation, as it relates to changes in 3D acinar mor-phogenesis. In addition, other members of the 7-genepanel have also been documented to play a role in cellmigration and early stages of pancreatic cancer, suggestivethat this network may be critically deregulated in earlypancreatic cancer. TNC has been shown to mediate pro-liferation and migration of astrocytes in a wound assay(41). Tumor-associated isoforms of TNC has been shownto promote breast cancer cell invasion and growth (42).TNC signaling has been reported to play an important rolein mammary tumor growth and metastasis, and knock-down of TNC exhibited significant impairment in cellmigration and anchorage-dependent cell proliferation inbreast cancer cell line (43). In addition, TNC has also beenshown to stimulate glioma cell migration (44). TFPI hasbeen shown to control migration of endothelial cells (45).Extracellular matrix bound TFPI through an interactionwith tissue factor/VIIa complex localized on cancer cellshas also been shown to facilitate cancer cell migration andadhesion (18).
SEL-1L is the only member of the 7-gene panel shown tobe downregulated in pancreatic tumors versus normalsamples in this study. It is expressed abundantly only inthe normal pancreas and is downregulated in pancreaticcancers. SEL-1L was first reported as a pancreas-specifictranscript but later found to be highly expressed in normalpancreas and present at very low levels in several otheradult tissues (25, 46, 47). Its loss of expression has beenobserved in 17% of pancreatic adenocarcinomas. Thus,SEL-1L represents a gene that shows a tissue-restrictedpattern of expression, with the only tissue showing abun-dant expression being the pancreas. In addition, SEL-1Lmaps into a genomic interval for the insulin-dependentdiabetes mellitus locus at chromosome 14q24.3-q31 butwas later excluded as a candidate gene for diabetes (48).Induced expression of SEL-1L in pancreatic cancer cells hasbeen shown to decrease the clonogenity and anchorage-independent growth, and it also delayed tumor growth inimmunodeficient mice (49). In addition, SEL-1L has beenreported to affect pancreatic cancer cell cycle and inva-siveness by modulating the expression of PTEN and genesinvolved in cell–matrix interactions (26). SEL-1L has beenshown to be a negative regulator of Notch signaling. TheNotch pathway has been extensively studied and regulatescell fate decisions in a large number of adult and embryo-nic tissues. Components of the Notch signaling pathwayhave been shown to be overexpressed in pancreaticadenocarcinomas (50), with activation of Notch signal-ing observed in PanIN lesions. Thus, SEL-1L loss ofexpression could represent a very early marker of pan-creatic cancer.
L1CAM has been reported to be overexpressed in anumber of different tumors types including colon, breast,
Balasenthil et al.
Cancer Prev Res; 4(1) January 2011 Cancer Prevention Research146
Research. on April 23, 2019. © 2011 American Association for Cancercancerpreventionresearch.aacrjournals.org Downloaded from
Published OnlineFirst November 11, 2010; DOI: 10.1158/1940-6207.CAPR-10-0025
and ovarian tumors, melanoma, gliomas, neuroblastomas,and pancreatic neuroendocrine tumors (21). Immunohis-tochemical staining of L1CAM was observed in chronicpancreatitis tissues and was absent in normal pancreatictissues (51). Importantly, L1CAM has been shown to play arole both in migration and in the malignant transforma-tion of pancreatic adenocarcinoma (51). Importantly,upregulation of L1CAM expression by IHC has beenobserved in later stage, high-grade PanIN lesions as com-pared with PanIN-1A/1B lesions that are not thought tohave a high risk for progression to pancreatic cancer,suggestive of the role of L1CAM early in transition topancreatic adenocarcinoma (52). Interestingly, WWTR1/TAZ, a transcription cofactor, was also found to regulate cellmigration and invasion (13, 14). WWTR1 has also beenreported to be amplified in pancreatic cancer cell lines andin pancreatic cancer (53). It was found to play a role in themigration, invasion, and tumorigenesis of breast cancercells (13). TGFBI has been reported to be overexpressed incolon and pancreatic cancer (16, 54). TGFBI is an excretedextracellular matrix protein reported to play a role in cell–matrix regulation as well as cell migration in bone (55). Ithas recently been found as one of a gene panel upregulatedduring hematopoietic stem cell lineages as they dif-ferentiated and became migratory, suggesting a role forTGFBI in stem cell migration between niches (56).CDC42BPA, a protein kinase, has also been implicatedin tumor cell invasion (20) and forms a complex with aleucine-rich adaptor protein, LRAP35a, and MYO18A,shown to play a crucial role in cell protrusion and migra-tion (57). Therefore, all 7 genes in our panel have beenclosely linked functionally to the control of cell migrationin cancer and potentially in the early stages of pancreatictumorigenesis.In addition, 3 of the 7 genes, L1CAM, TGFBI, and
CDC42BPA, identified as most differentially expressed,are mutated in the germline in genetic disorders includingCRASH syndrome, Thiel–Behnke corneal dystrophy, andCrohn’s disease, respectively (58, 59). Given that germlinemutations underlying genetic disorders are very rare, the
finding that our study identified 3 of 7 genes as beingmutated in hereditary diseases indicates the functionalsignificance of this migration pathway in early develop-ment, the deregulation of which could be of critical impor-tance in pancreatic cancer initiation and progression.
In conclusion, we have taken a pathways approach tobiomarker discovery by utilizing 3 different expression-based platforms to identify chromosome 3p12 pathwaygenes differentially expressed between pancreatic tumor/normal samples, which could serve as candidate biomar-kers for the early detection of pancreatic cancer. Biomarkerpanels described herein will be further validated in largercase–control studies with the EDRN of the NCI. Additionalcandidates from the 7-gene list and associated IPA networkmembers should also be investigated for their ability toimprove performance of current panels. Future studies arealso warranted to investigate the role of cell polarity andmigration in the initiation of pancreatic cancer and thepotential for biomarker discovery by a targeted pathwayapproach.
Disclosure of Potential Conflicts of Interest
No potential conflicts of interest were disclosed.
Acknowledgments
We gratefully acknowledge the NCI Early Detection Research Network forsupport and guidance in our ongoing biomarker discovery projects. We arealso grateful to Drs. David Gold and David Stivers, who provided bioinfor-matics support for this project.
Grant Support
This research was supported by grant UO1CA111302 to A.M. Killary from theNational Cancer Institute Early Detection Research Network.
The costs of publication of this article were defrayed in part by thepayment of page charges. This article must therefore be hereby markedadvertisement in accordance with 18 U.S.C. Section 1734 solely to indicatethis fact.
Received February 17, 2010; revised October 27, 2010; accepted October29, 2010; published OnlineFirst November 11, 2010.
References1. Jemal A, Siegel R, Ward E, Hao Y, Xu J, Thun MJ. Cancer Statistics,
2009. CACancer J Clin 2009;59:225–49.2. Kim HR, Lee CH, Kim YW, Han SK, Shim YS, Yim JJ. Increased CA
19–9 level in patients without malignant disease. Clin Chem Lab Med2009;47:750–4.
3. Blackford A, Parmigiani G, Kensler TW, Wolfgang C, Jones S, ZhangX, et al. Genetic mutations associated with cigarette smoking inpancreatic cancer. Cancer Res 2009;69:3681–8.
4. Stein CK, Glover TW, Palmer JL, Glisson BS. Direct correlationbetween FRA3B expression and cigarette smoking. Genes Chromo-somes Cancer 2002;34:333–40.
5. Shridhar R, Shridhar V, Wang X, Paradee W, Dugan M, Sarkar F, et al.Frequent breakpoints in the 3p14.2 fragile site, FRA3B, in pancreatictumors. Cancer Res 1996;56:4347–50.
6. Sanchez Y, El-Naggar A, Pathak S, Killary AM. A tumor sup-pressor locus within 3p14-p12 mediates rapid cell death of
renal cell carcinoma in vivo. Proc Natl Acad Sci USA 1994;91:3383–7.
7. Lott ST, Lovell M, Naylor SL, Killary AM. Physical and functionalmapping of a tumor suppressor locus for renal cell carcinoma withinchromosome 3p12. Cancer Res 1998;58:3533–7.
8. LovellM,LottST,WongP,El-NaggarA,TuckerS,KillaryAM.Thegeneticlocus NRC-1 within chromosome 3p12 mediates tumor suppression inrenal cell carcinoma independently of histological type, tumor micro-environment, and VHL mutation. Cancer Res 1999;59:2182–9.
9. Zhang K, Lott ST, Jin L, Killary AM. Fine mapping of the NRC-1 tumorsuppressor locus within chromosome 3p12. Biochem Biophys ResCommun 2007;360:531–8.
10. Lott ST, Chen N, Chandler DS, Yang Q, Wang L, Rodriguez M, et al.DEAR1 is a dominant regulator of acinar morphogenesis and anindependent predictor of local recurrence-free survival in early-onsetbreast cancer. PLoS Med 2009;6:e1000068.
Pathways Approach Identifies Pancreatic Cancer Biomarkers
www.aacrjournals.org Cancer Prev Res; 4(1) January 2011 147
Research. on April 23, 2019. © 2011 American Association for Cancercancerpreventionresearch.aacrjournals.org Downloaded from
Published OnlineFirst November 11, 2010; DOI: 10.1158/1940-6207.CAPR-10-0025
11. Zhang L, Miles MF, Aldape KD. A model of molecular interactions onshort oligonucleotide microarrays. Nat Biotechnol 2003;21:818–21.
12. Nomura H, Uzawa K, Yamano Y, Fushimi K, Ishigami T, Kato Y, et al.Network-based analysis of calcium-binding protein genes identifiesGrp94 as a target in human oral carcinogenesis. Br J Cancer 2007;97:792–801.
13. Chan SW, Lim CJ, Guo K, Ng CP, Lee I, Hunziker W, et al. A role forTAZ in migration, invasion, and tumorigenesis of breast cancer cells.Cancer Res 2008;68:2592–8.
14. Lei QY, Zhang H, Zhao B, Zha ZY, Bai F, Pei XH, et al. TAZ promotescell proliferation and epithelial-mesenchymal transition and is inhib-ited by the hippo pathway. Mol Cell Biol 2008;28:2426–36.
15. Skonier J, Neubauer M, Madisen L, Bennett K, Plowman GD, PurchioAF. cDNA cloning and sequence analysis of beta ig-h3, a novel geneinduced in a human adenocarcinoma cell line after treatment withtransforming growth factor-beta. DNA Cell Biol 1992;11:511–22.
16. Ma C, Rong Y, Radiloff DR, Datto MB, Centeno B, Bao S, et al. Extra-cellular matrix protein betaig-h3/TGFBI promotes metastasis of coloncancer by enhancing cell extravasation. Genes Dev 2008;22:308–21.
17. Broze GJ Jr., Warren LA, Novotny WF, Higuchi DA, Girard JJ, MiletichJP. The lipoprotein-associated coagulation inhibitor that inhibits thefactor VII-tissue factor complex also inhibits factor Xa: insight into itspossible mechanism of action. Blood 1988;71:335–43.
18. Fischer EG, Riewald M, Huang HY, Miyagi Y, Kubota Y, Mueller BM,et al. Tumor cell adhesion and migration supported by interaction of areceptor-protease complex with its inhibitor. J Clin Invest1999;104:1213–21.
19. Zhao Y, Loyer P, Li H, Valentine V, Kidd V, Kraft AS. Cloning andchromosomal location of a novel member of the myotonic dystrophyfamily of protein kinases. J Biol Chem 1997;272:10013–20.
20. Wilkinson S, Paterson HF, Marshall CJ. Cdc42-MRCK and Rho-ROCK signalling cooperate in myosin phosphorylation and cell inva-sion. Nat Cell Biol 2005;7:255–61.
21. Raveh S, Gavert N, Ben-Ze’ev A. L1 cell adhesion molecule (L1CAM)in invasive tumors. Cancer Lett 2009;282:137–45.
22. Rathjen FG, Schachner M. Immunocytological and biochemical char-acterization of a new neuronal cell surface component (L1 antigen)which is involved in cell adhesion. EMBO J 1984;3:1–10.
23. Chiquet-Ehrismann R, Mackie EJ, Pearson CA, Sakakura T. Tenascin:an extracellular matrix protein involved in tissue interactions duringfetal development and oncogenesis. Cell 1986;47:131–9.
24. Sarkar S, Nuttall RK, Liu S, Edwards DR, Yong VW. Tenascin-Cstimulates glioma cell invasion through matrix metalloproteinase-12. Cancer Res 2006;66:11771–80.
25. Biunno I, Appierto V, CattaneoM, Leone BE, Balzano G, Socci C, et al.Isolation of a pancreas-specific gene located on human chromosome14q31: expression analysis in human pancreatic ductal carcinomas.Genomics 1997;46:284–6.
26. Cattaneo M, Fontanella E, Canton C, Delia D, Biunno I. SEL1L affectshuman pancreatic cancer cell cycle and invasiveness through mod-ulation of PTEN and genes related to cell-matrix interactions. Neo-plasia 2005;7:1030–8.
27. Segara D, Biankin AV, Kench JG, Langusch CC, Dawson AC, SkalickyDA, et al. Expression of HOXB2, a retinoic acid signaling target inpancreatic cancer and pancreatic intraepithelial neoplasia. Clin Can-cer Res 2005;11:3587–96.
28. Logsdon CD, Simeone DM, Binkley C, Arumugam T, Greenson JK,Giordano TJ, et al. Molecular profiling of pancreatic adenocarcinomaand chronic pancreatitis identifies multiple genes differentially regu-lated in pancreatic cancer. Cancer Res 2003;63:2649–57.
29. Buchholz M, Braun M, Heidenblut A, Kestler HA, Kl€oppel G,Schmiegel W, et al. Transcriptome analysis of microdissectedpancreatic intraepithelial neoplastic lesions. Oncogene 2005;24:6626–36.
30. Badea L, Herlea V, Dima SO, Dumitrascu T, Popescu I. Combinedgene expression analysis of whole-tissue and microdissected pan-creatic ductal adenocarcinoma identifies genes specifically overex-pressed in tumor epithelia. Hepatogastroenterology 2008;55:2016–27.
31. Esposito I, Penzel R, Chaib-Harrireche M, Barcena U, Bergmann F,Riedl S, et al. Tenascin C and annexin II expression in the process ofpancreatic carcinogenesis. J Pathol 2006;208:673–85.
32. Faca VM, Song KS, Wang H, Zhang Q, Krasnoselsky AL, NewcombLF, et al. A mouse to human search for plasma proteome changesassociated with pancreatic tumor development. PLoS Med 2008;5:e123.
33. Juuti A, Nordling S, Louhimo J, Lundin J, Haglund C. Tenascin Cexpression is upregulated in pancreatic cancer and correlates withdifferentiation. J Clin Pathol 2004;57:1151–5.
34. Kressner U, Lindmark G, Tomasini-Johansson B, Bergstr€omR, GerdinB, Pa
�hlman L, et al. Stromal tenascin distribution as a prognostic
marker in colorectal cancer. Br J Cancer 1997;76:526–30.35. Brunner A, Mayerl C, Tzankov A, Verdorfer I, Tsch€orner I, Rogatsch H,
et al. Prognostic significance of tenascin-C expression in superficialand invasive bladder cancer. J Clin Pathol 2004;57:927–31.
36. Takeda A, Otani Y, Iseki H, Takeuchi H, Aikawa K, Tabuchi S, et al.Clinical significance of large tenascin-C spliced variant as apotential biomarker for colorectal cancer. World J Surg 2007;31:388–94.
37. Lindahl AK, Odegaard OR, Sandset PM, Harbitz TB. Coagulationinhibition and activation in pancreatic cancer. Changes during pro-gress of disease. Cancer 1992;70:2067–72.
38. Yasuda T, Ueda T, Kamei K, Shinzaki W, Sawa H, Shinzeki M, et al.Plasma tissue factor pathway inhibitor levels in patients with acutepancreatitis. J Gastroenterol 2009;44:1071–9.
39. IversenN, Lindahl AK, AbildgaardU. Elevatedplasma levels of the factorXa-TFPI complex in cancer patients. Thromb Res 2002;105:33–6.
40. Sierko E, Wojtukiewicz MZ, Zimnoch L, Kisiel W. Expression of tissuefactor pathway inhibitor (TFPI) in human breast and colon cancertissue. Thromb Haemost 2010;103:198–204.
41. Nishio T, Kawaguchi S, Yamamoto M, Iseda T, Kawasaki T, Hase T.Tenascin-C regulates proliferation and migration of cultured astro-cytes in a scratch wound assay. Neuroscience 2005;132:87–102.
42. Hancox RA, Allen MD, Holliday DL, Edwards DR, Pennington CJ,Guttery DS, et al. Tumour-associated tenascin-C isoforms promotebreast cancer cell invasion and growth by matrix metalloproteinase-dependent and independent mechanisms. Breast Cancer Res2009;11:R24. [Epub 2009 Apr 30].
43. Calvo A, Catena R, Noble MS, Carbott D, Gil-Bazo I, Gonzalez-Moreno O, et al. Identification of VEGF-regulated genes associatedwith increased lung metastatic potential: functional involvement oftenascin-C in tumor growth and lung metastasis. Oncogene2008;27:5373–84.
44. Sivasankaran B, Degen M, Ghaffari A, Hegi ME, Hamou MF, IonescuMC, et al. Tenascin-C is a novel RBPJkappa-induced target gene forNotch signaling in gliomas. Cancer Res 2009;69:458–65.
45. Provencal M, Michaud M, Beaulieu E, Ratel D, Rivard GE, Gingras D,et al. Tissue factor pathway inhibitor (TFPI) interferes with endothelialcell migration by inhibition of both the Erk pathway and focal adhesionproteins. Thromb Haemost 2008;99:576–85.
46. Harada Y, Ozaki K, Suzuki M, Fujiwara T, Takahashi E, Nakamura Y,et al. Complete cDNA sequence and genomic organization of a humanpancreas-specific gene homologous to Caenorhabditis elegans sel-1.J Hum Genet 1999;44:330–6.
47. Donoviel DB, Donoviel MS, Fan E, Hadjantonakis A, Bernstein A.Cloning and characterization of Sel-1l, a murine homolog of the C.elegans sel-1 gene. Mech Dev 1998;78:203–7.
48. Donoviel DB, Bernstein A. SEL-1L maps to human chromosome 14,near the insulin-dependent diabetes mellitus locus 11. Genomics1999;56:232–3.
49. Cattaneo M, Orlandini S, Beghelli S, Moore PS, Sorio C, Bonora A,et al. SEL1L expression in pancreatic adenocarcinoma parallelsSMAD4 expression and delays tumor growth in vitro and in vivo.Oncogene 2003;22:6359–68.
50. Miyamoto Y, Maitra A, Ghosh B, Zechner U, Argani P, Iacobuzio-Donahue CA, et al. Notch mediates TGF alpha-induced changes inepithelial differentiation during pancreatic tumorigenesis. Cancer Cell2003;3:565–76.
Balasenthil et al.
Cancer Prev Res; 4(1) January 2011 Cancer Prevention Research148
Research. on April 23, 2019. © 2011 American Association for Cancercancerpreventionresearch.aacrjournals.org Downloaded from
Published OnlineFirst November 11, 2010; DOI: 10.1158/1940-6207.CAPR-10-0025

51. Geismann C, Morscheck M, Koch D, Bergmann F, Ungefroren H, ArltA, et al. Up-regulation of L1CAM in pancreatic duct cells is transform-ing growth factor beta1- and slug-dependent: role in malignanttransformation of pancreatic cancer. Cancer Res 2009; 69:4517–26.
52. Bergmann F, Wandschneider F, Sipos B, Moldenhauer G, SchniewindB, Welsch T, et al. Elevated L1CAM expression in precursor lesionsand primary and metastastic tissues of pancreatic ductal adenocar-cinoma. Oncol Rep 2010;24:909–15.
53. Lin L-J, Asaoka Y, Tada M, Sanada M, Nannya Y, Tanaka Y, et al.Integrated analysis of copy number alterations and loss of hetero-zygosity in human pancreatic cancer using a high-resolution, singlenucleotide polymorphism array. Oncology 2008;75:102–12.
54. Schneider D, Kleeff J, Berberat PO, Zhu Z, Korc M, Friess H, et al.Induction and expression of betaig-h3 in pancreatic cancer cells.Biochim Biophys Acta 2002;1588:1–6.
55. Hashimoto K, Noshiro M, Ohno S, Kawamoto T, Satakeda H, Aka-gawa Y, et al. Characterization of a cartilage-derived 66-kDa protein
(RGD-CAP/beta ig-h3) that binds to collagen. Biochim Biophys Acta1997;1355:303–14.
56. Ciriza J, García-Ojeda ME. Expression of migration-related genes isprogressively upregulated in murine lineage-Sca-1þc-Kitþ popula-tion from the fetal to adult stages of development. Stem Cell Res Ther2010;1:14.
57. Tan I, Yong J, Dong JM, Lim L, Leung T. A tripartite complex contain-ing MRCK modulates lamellar actomyosin retrograde flow. Cell2008;135:123–36.
58. Yamasaki M, Thompson P, Lemmon V. CRASH syndrome: mutationsin L1CAM correlate with severity of the disease. Neuropediatrics1997;28:175–8.
59. Pampukha VM, Kravchenko SA, Tereshchenko FA, Livshits LA, Droz-hyna GI. Novel L558P mutation of the TGFBI gene found in Ukrainianfamilies with atypical corneal dystrophy. Ophthalmologica 2009;223:207–14.
Pathways Approach Identifies Pancreatic Cancer Biomarkers
www.aacrjournals.org Cancer Prev Res; 4(1) January 2011 149
Research. on April 23, 2019. © 2011 American Association for Cancercancerpreventionresearch.aacrjournals.org Downloaded from
Published OnlineFirst November 11, 2010; DOI: 10.1158/1940-6207.CAPR-10-0025

2011;4:137-149. Published OnlineFirst November 11, 2010.Cancer Prev Res Seetharaman Balasenthil, Nanyue Chen, Steven T. Lott, et al. AdenocarcinomaA Migration Signature and Plasma Biomarker Panel for Pancreatic
Updated version
10.1158/1940-6207.CAPR-10-0025doi:
Access the most recent version of this article at:
Material
Supplementary
1
http://cancerpreventionresearch.aacrjournals.org/content/suppl/2010/11/15/1940-6207.CAPR-10-0025.DCAccess the most recent supplemental material at:
Cited articles
http://cancerpreventionresearch.aacrjournals.org/content/4/1/137.full#ref-list-1
This article cites 59 articles, 17 of which you can access for free at:
Citing articles
http://cancerpreventionresearch.aacrjournals.org/content/4/1/137.full#related-urls
This article has been cited by 6 HighWire-hosted articles. Access the articles at:
E-mail alerts related to this article or journal.Sign up to receive free email-alerts
Subscriptions
Reprints and
To order reprints of this article or to subscribe to the journal, contact the AACR Publications Department at
Permissions
Rightslink site. Click on "Request Permissions" which will take you to the Copyright Clearance Center's (CCC)
.http://cancerpreventionresearch.aacrjournals.org/content/4/1/137To request permission to re-use all or part of this article, use this link
Research. on April 23, 2019. © 2011 American Association for Cancercancerpreventionresearch.aacrjournals.org Downloaded from
Published OnlineFirst November 11, 2010; DOI: 10.1158/1940-6207.CAPR-10-0025