a microsatellite linkage map of the porcine genome - genetics
TRANSCRIPT

Copyright Q 1994 by the Genetics Society of America
A Microsatellite Linkage Map of the Porcine Genome
Gary A. Rohrer, Leeson J. Alexander, John W. Keele, Tim P. Smith and Craig W. Beattie USDA, ARS, Roman L. Hruska US. Meat Animal Research Center (MARC), Clay Center, Nebraska 68933
Manuscript received August 23, 1993 Accepted for publication September 1 1 , 1993
ABSTRACT We report the most extensive genetic linkage map for a livestock species produced to date. We
have linked 376 microsatellite (MS) loci with seven restriction fragment length polymorphic loci in a backcross reference population. The 383 markers were placed into 24 linkage groups which span 1997 cM. Seven additional MS did not fall into a linkage group. Linkage groups are assigned to 13 autosomes and the X chromosome (haploid n = 19). This map provides the basis for genetic analysis of quantitative inheritance of phenotypic and physiologic traits in swine.
S PECIES-SPECIFIC, high-density linkage maps comprised of highly polymorphic markers are
essential to conduct comprehensive searches for loci that affect phenotype(s) of interest (FRIES 1993). The discovery of microsatellites (MS), abundant, multial- lelic, codominant markers uniformly distributed throughout the genome (LITT and LUTY 1989; WE- BER and MAY 1989; WINTERO, FREDHOLM and THOM- SEN 1992), provided the technology required to rap- idly produce linkage maps useful in identifying seg- regating loci of interest (LUONGO et al. 1993). Since MS are typed by amplifying DNA via the polymerase chain reaction (PCR) and then electrophoresed to separate fragments based on length, the procedure is easily automated (DIETRICH et al. 1992). Microsatel- lites, as sequence tagged sites (STS), are easily distrib- uted anywhere in the world by publishing or submit- ting sequences of primers to public access databases further facilitating map construction.
One focus of genetic efforts to maintain dietary meat as a major protein source centers on identifying markers segregating with rapid lean growth, im- proved reproductive performance and disease resist- ance using a marker-assisted selection strategy. Un- fortunately, current maps of major livestock species are cytogenetic in nature with few MS assignments (FRIES, EGGEN and WOMACK 1993). This has limited identification of loci associated with phenotypic or quantitative traits (GEORGES et al. 1993a, 1993b). Comparative genome mapping (WOMACK 1987; FRIES 1993) has assigned genes (type I markers) selected from human:mouse maps (O’BRIEN et al. 1993) using somatic cell hybrid panels (WOMACK and MOLL 1986) or in situ hybridization (CHOWDHARY et al. 1989). Linkage groups anchored by restriction fragment length polymorphisms (RFLPs) within type I markers are few (FRIES, EGGEN and WOMACK 1993) as they are often uninformative or only slightly polymorphic Genetics 136: 231-245 (January, 1994)
within or between livestock breeds (FRIES 1993). In cattle, only 27% of the mapped type I loci have reported polymorphisms compared with 87% of anon- ymous type I1 markers (FRIES, EGGEN and WOMACK 1993). FRIES, EGGEN and WOMACK (1993) tabulated -350 loci organized into 32 linkage groups that span 13 chromosomes and 26 syntenic groups in cattle (haploid n = 30). Type I markers have now been assigned to 20 of 26 sheep autosomes (haploid n = 27) (ANSARI, PEARCE and MAHER 1993).
An accurate assessment of total cM covered in the swine genome is difficult when only -1 20 markers have been placed in 25 linkage groups (12 chromo- somally assigned) (ANDERSON et al. 1993). Only 38 of 73 MS loci published to date are linked (ANDERSON et al. 1993). The most extensive individual reports are by FREDHOLM et al. (1993), who linked 14 markers into six linkage groups (67 total cM) and ELLEGREN et al. (1 993), who placed 59 (total) markers in 13 linkage groups covering -288 cM. The problem is com- pounded by a lack of markers on 5 of 18 autosomes (ANDERSON et al. 1993).
In spite of the paucity of markers, swine represent a livestock species of choice for mapping quantitative trait loci (QTLs). Global production of pork as a dietary alternative to beef is at an all-time high (Fow- LER 1992). The amount of muscle relative to fat is a heritable trait (WARWICK and LEGATES 1979). For mapping purposes, generation interval is relatively short and progeny number high. As omnivores, with a cardiovascular and gastrointestinal physiology simi- lar to humans, swine also make excellent models for human disease (HODSON 1985). Genetic lines for such diverse human diseases as obesity (MERSMANN, POND and YEN 1982) and cancer (TISSOT, BEATTIE and AMOSS 1987) are readily available for mapping pur- poses.
Our results based on 383 informative DNA markers
232 G. A. Rohrer et al.
WC-ME P 4-
0 0 0
0 0 0 0 0 0 0 0 0 0 -
0 0 0 0 0 0 0 0 0 0 0 0 I
WC-DU WC-FE WC-MI wc
0 0 0 0 0
~
o 0 0 0 0 0 0 0 0 0 0 0 d
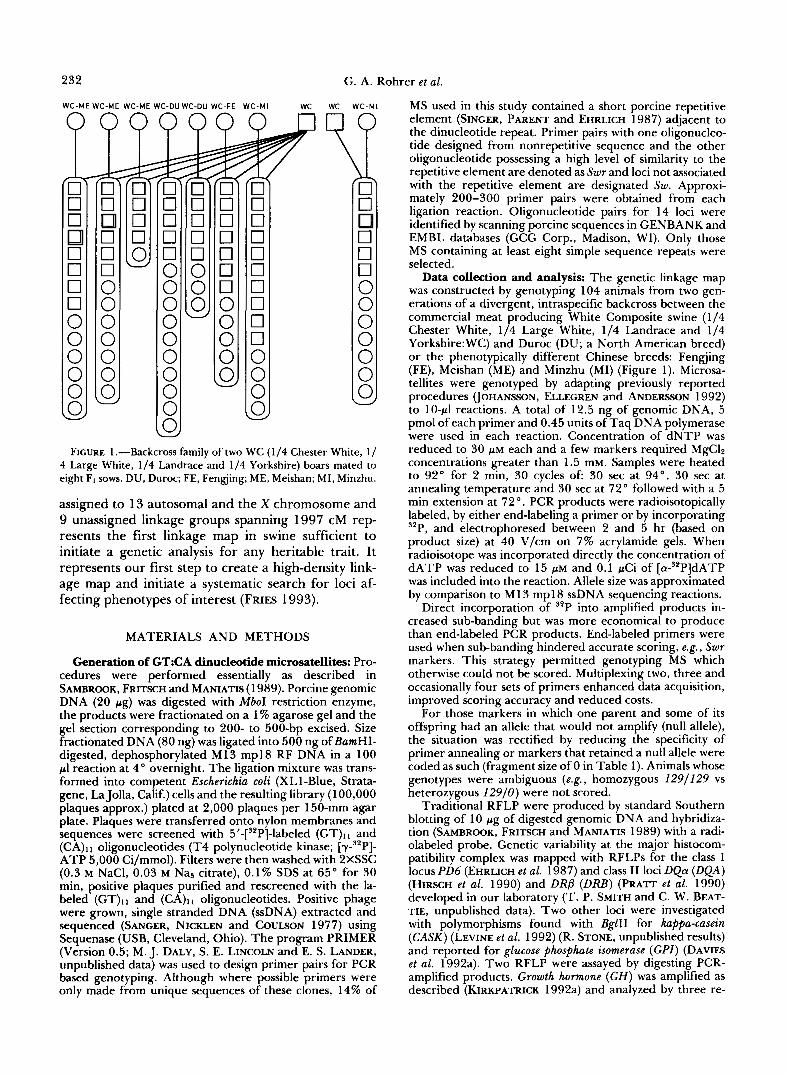
FIGURE 1 .-Backcross family of two WC (1/4 Chester White, 1/ 4 Large White, 1/4 Landrace and 1/4 Yorkshire) boars mated to eight FI sows. DU, Duroc; FE, Fengjing; ME, Meishan; MI, Minzhu.
assigned to 13 autosomal and the X chromosome and 9 unassigned linkage groups spanning 1997 cM rep- resents the first linkage map in swine sufficient to initiate a genetic analysis for any heritable trait. It represents our first step to create a high-density link- age map and initiate a systematic search for loci af- fecting phenotypes of interest (FRIES 1993).
MATERIALS AND METHODS
Generation of GT:CA dinucleotide microsatellites: Pro- cedures were performed essentially as described in SAMBROOK, FRITSCH and MANIATIS (1 989). Porcine genomic DNA (20 rg) was digested with MboI restriction enzyme, the products were fractionated on a 1 % agarose gel and the gel section corresponding to 200- to 500-bp excised. Size fractionated DNA (80 ng) was ligated into 500 ng ofBamHI- digested, dephosphorylated M 13 mpl8 RF DNA in a 100 PI reaction at 4" overnight. The ligation mixture was trans- formed into competent Escherichia coli (XL1-Blue, Strata- gene, La Jolla, Calif.) cells and the resulting library (100,000 plaques approx.) plated at 2,000 plaques per 150-mm agar plate. Plaques were transferred onto nylon membranes and sequences were screened with 5'-[32P]-labeled (GT)II and (CA)I I oligonucleotides (T4 polynucleotide kinase; [Y-'~P]- ATP 5,000 Ci/mmol). Filters were then washed with 2XSSC (0.3 M NaCI, 0.03 M Na3 citrate), 0.1% SDS at 65" for 30 min, positive plaques purified and rescreened with the la- beled (GT)ll and (CA)II oligonucleotides. Positive phage were grown, single stranded DNA (ssDNA) extracted and sequenced (SANGER, NICKLEN and COUUON 1977) using Sequenase (USB, Cleveland, Ohio). The program PRIMER (Version 0.5; M. J. DALY, S. E. LINCOLN and E. S. LANDER, unpublished data) was used to design primer pairs for PCR based genotyping. Although where possible primers were only made from unique sequences of these clones, 14% of
MS used in this study contained a short porcine repetitive element (SINGER, PARENT and EHRLICH 1987) adjacent to the dinucleotide repeat. Primer pairs with one oligonucleo- tide designed from nonrepetitive sequence and the other oligonucleotide possessing a high level of similarity to the repetitive element are denoted as Swr and loci not associated with the repetitive element are designated Sw. Approxi- mately 200-300 primer pairs were obtained from each ligation reaction. Oligonucleotide pairs for 14 loci were identified by scanning porcine sequences in GENBANK and EMBL databases (GCG Corp., Madison, WI). Only those MS containing at least eight simple sequence repeats were selected.
Data collection and analysis: The genetic linkage map was constructed by genotyping 104 animals from two gen- erations of a divergent, intraspecific backcross between the commercial meat producing White Composite swine (1/4 Chester White, 1/4 Large White, 1/4 Landrace and 1/4 Yorkshire:WC) and Duroc (DU; a North American breed) or the phenotypically different Chinese breeds: Fengjing (FE), Meishan (ME) and Minzhu (MI) (Figure 1). Microsa- tellites were genotyped by adapting previously reported procedures (JOHANSSON, ELLECREN and ANDERSON 1992) to 10-pl reactions. A total of 12.5 ng of genomic DNA, 5 pmol of each primer and 0.45 units of Taq DNA polymerase were used in each reaction. Concentration of dNTP was reduced to 30 PM each and a few markers required MgCIz concentrations greater than 1.5 mM. Samples were heated to 92" for 2 min, 30 cycles of: 30 sec at 94", 30 sec at annealing temperature and 30 sec at 72" followed with a 5 min extension at 72 O . PCR products were radioisotopically labeled, by either end-labeling a primer or by incorporating 32P, and electrophoresed between 2 and 5 hr (based on product size) at 40 V/cm on 7% acrylamide gels. When radioisotope was incorporated directly the concentration of dATP was reduced to 15 p~ and 0.1 pCi of [a-"P]dATP was included into the reaction. Allele size was approximated by comparison to M 13 mpl8 ssDNA sequencing reactions.
Direct incorporation of "P into amplified products in- creased sub-banding but was more economical to produce than end-labeled PCR products. End-labeled primers were used when sub-banding hindered accurate scoring, e.g. , Swr markers. This strategy permitted genotyping MS which otherwise could not be scored. Multiplexing two, three and occasionally four sets of primers enhanced data acquisition, improved scoring accuracy and reduced costs.
For those markers in which one parent and some of its offspring had an allele that would not amplify (null allele), the situation was rectified by reducing the specificity of primer annealing or markers that retained a null allele were coded as such (fragment size of 0 in Table 1). Animals whose genotypes were ambiguous (e.g., homozygous 129/129 vs heterozygous 129/0) were not scored.
Traditional RFLP were produced by standard Southern blotting of 10 pg of digested genomic DNA and hybridiza- tion (SAMBROOK, FRITSCH and MANIATIS 1989) with a radi- olabeled probe. Genetic variability at the major histocom- patibility complex was mapped with RFLPs for the class I locus PD6 (EHRLICH et al. 1987) and class I1 loci DQa (DQA) (HIRSCH et al. 1990) and DRP (DRB) (PRATT et al. 1990) developed in our laboratory (T. P. SMITH and C. W. BEAT- TIE, unpublished data). Two other loci were investigated with polymorphisms found with BglII for kappa-casein (CASK) (LEVINE et al. 1992) (R. STONE, unpublished results) and reported for glucose phosphate isomerase (GPI) (DAVIES et al. 1992a). Two RFLP were assayed by digesting PCR- amplified products. Growth hormone ( G H ) was amplified as described (KIRKPATRICK 1992a) and analyzed by three re-
233 Genetic Map of the Pig
TABLE 1
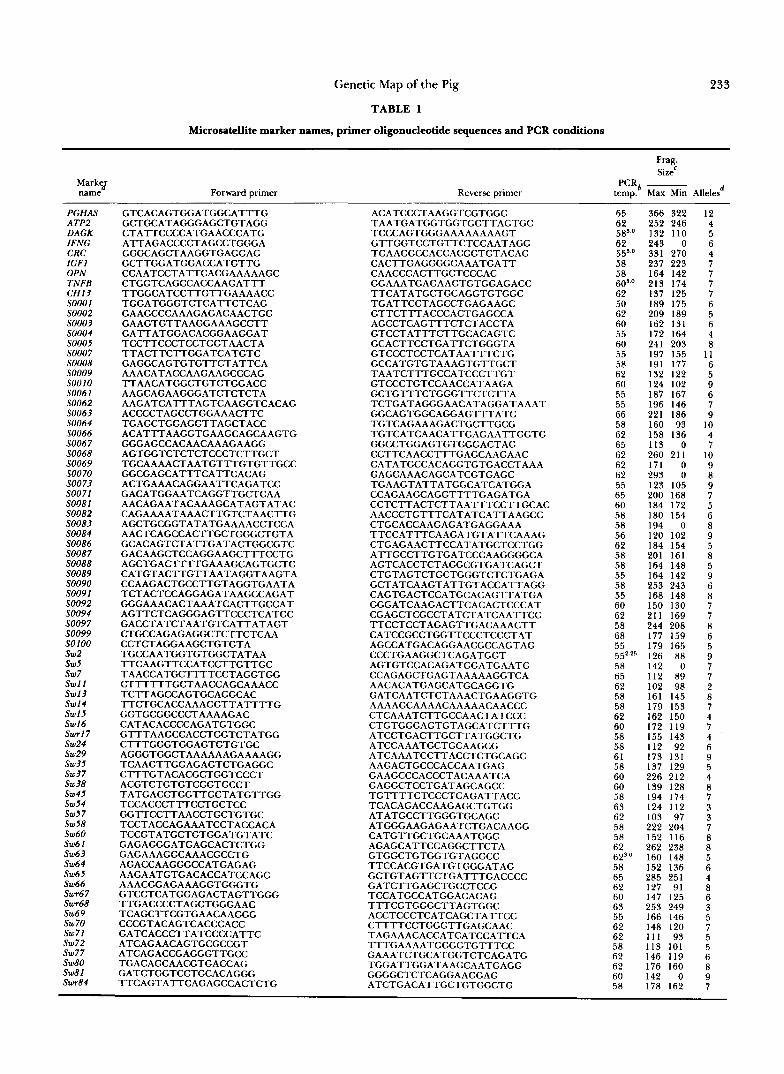
Microsatellite marker names, primer oligonucleotide sequences and PCR conditions
Marky name Forward primer
PGHAS A TP2 DAGK IFNG CRC IGFl OPN TNFB CH13 SOOOl so002 SO003 SO004 SO005 SO007
SO009 SO008
SOOlO SO061 SO062 SO063
SO066 SO064
SO067 SO068 SO069 SO070
SO0 7 I SO073
SO081 SO082 SO083 SO084 SO086 SO087 SO088 SO089 SO090 SO091 SO092 SO094 SO097 SO099 so IO0 sw2 sw5 sw 7 Swl l Swl3
Swl5 Sw14
Sw16 Swrl7 Sw24 Sw29 sw35 sw37 Sw38 sw45 sw54 sw57 Sw58 Sw60 Sw6 I Sw63 Sw64 Sw65
Swr67 Sw66
Swr68 Sw69 Sw70
Sw72 Sw71
sw77 SW80 SW81 Swr84
GTCACAGTGGATGGCATTTG GCTGCATAGGGAGCTGTAGG CTATTCCCCATGAACCCATG ~~~~~~~~~~ ~~~
ATTAGACCCCTAGCCTGGGA
GCTTGGATGGACCATGTTG GGGCAGCTAAGGTGAGGAG
CCAATCCTATTCACGAAAAAGC CTGGTCAGCCACCAAGATTT TTGGCATCCTTGTTGAAAACC TGGATGGGTCTCATTCTCAG GAAGCCCAAAGAGACAACTGC GAAGTGTTAAGGAAAGCCTT GATTATGGACACGGAAGGAT TCCTTCCCTCCTGGTAACTA TTACTTCTTGGATCATGTC GAGGCAGTGTGTTCTATTCA AAACATACCAAGAAGCCCAG TTAACATGGCTGTCTGGACC AAGCAGAAGGGATCTCTCTA AAGATCATTTAGTCAAGGTCACAG ACCCCTAGCCTGGAAACTTC TGAGCTGGAGGTTAGCTACC ACATTTAAGGTGAAGCAGCAAGTG GGGAGCCACAACAAAGAAGG
TGCAAAACTAATGTTTGTGTTGCC AGTGGTCTCTCTCCCTCTTGCT
GGCGAGCATTTCATTCACAG ACTGAAACAGGAATTCAGATCC GACATGGAATCAGGTTGCTCAA AACAGAATACAAAGCATAGTATAC CAGAAAATAAACTTGTCTAACTTG AGCTGCGGTATATGAAAACCTCCA
GCACAGTCTATTGATACTGGCGTC AACTCAGCCACTTGCTGGGCTGTA
GACAAGCTCCAGGAAGCTTTCCTG AGCTGACTTTTGAAAGCAGTGCTC CATGTACTTGTTAATAGGTAAGTA CCAAGACTGCCTTGTAGGTGAATA
GGGAAACACTAAATCACTTGCCAT TCTACTCCAGGAGATAAGCCAGAT
AGTTCTCAGGGAGTTCCCTCATGC GACCTATCTAATGTCATTATAGT CTGCCAGAGAGGCTCTTCTCAA CCTCTAGGAAGCTGTGTA TGCCAATGGTGTGGCTATAA TTCAAGTTCCATCCTTGTTGC TAACCATGCTTTTCCTAGGTGG CTTTTTTGCTAACCAGCAAACC TCTTAGCCAGTGCAGGCAC TTCTGCACCAAAGGTTATTTTG GGTGCGGCCCTAAAAGAC CATACACCCCAGATGTGGC GTTTAAGCCACCTGGTCTATGG CTTTGGGTGGAGTGTGTGC AGGGTGGCTAAAAAAGAAAAGG TCAAGTTGGAGAGTCTGAGGC CTTTGTACACGCTGGTCCCT ACGTCTGTGTCGGTGCCT TATGACCTGGTTGCTATGTTGG TCCACCCTTTCCTGCTCC GGTTCCTTAACCTGCTGTGC TCCTACCAGAAATCCTACCACA
GAGAGGGATGAGCACTCTGG TCCGTATGCTGTGGATGTATC
GAGAAAGGCAAACGCCTG AGACCAAGGGCCATGAGAG
AAACGGAGAAAGGTGGGTG AAGAATGTGACACCATCCAGC
GTCCTCATGGAGACTAGTTGGG TTGACCCCTAGCTGGGAAC TCAGCTTCGTGAACAAGGG CCCGTACAGTCACCCACC GATCACCCTTATCCCCATTC
. -~~ ~ ~
ATCAGAACAGTGCGCCGT ATCAGACCGAGGGTTGCC TGACAGCAACGTGACCAG
Frag. SizeC
PCRb ~
Reverse primer temp. Max Min Allelesd
ACATCCCTAAGGTCGTGGC TAATGATGGTGGTGGTTAGTGC TCCCAGTGGGAAAAAAAAGT GTTGGTCCTGTTCTCCAATAGG TGAAGGCCACCACGGTGTACAG CACTTGAGGGGCAAATGATT CAACCCACTTGCTCCCAC GGAAATGAGAAGTGTGGAGACC TTCATATGCTGCAGGTGTGGC TGATTCCTAGCCTGAGAAGC GTTCTTTACCCACTGAGCCA AGCCTCAGTTTCTCTACCTA GTCCTATTTCTTGCACAGTC GCACTTCCTGATTCTGGGTA GTCCCTCCTCATAATTTCTG GCCATGTGTAAAGTGTTGCT TAATCTTTGCCATCCCTTGT GTCCCTGTCCAACCATAAGA GCTGTTTCTGGGTTCTCTTA TCTGATAGGGAACATAGGATAAAT GGCAGTGGCAGGAGTTTATC TGTCAGAAAGACTGCTTGCG TGTCATCAACATTGAGAATTGGTG GGCCTGGAGTGTGGGACTAG CCTTCAACCTTTGAGCAAGAAC CATATGCCACAGGTGTGACCTAAA GAGCAAACAGCATCGTGAGC
CCAGAAGCAGGTTTTGAGATGA TGAAGTATTATGGCATCATGGA
CCTCTTACTCTTAATTTCCTTGCAC AACCCTGTTTCATATCATTAAGCC CTGCACCAAGAGATGAGGAAA TTCCATTTCAAGATGTATTCAAAG CTGAGAACTTCCATATGCTCCTGG ATTGCCTTGTGATCCCAAGGGGCA AGTCACCTCTAGGCGTGATCAGCT CTGTAGTCTGCTGGGTCTCTGAGA GCTATCAAGTATTGTACCATTAGG CAGTGACTCCATGCACAGTTATGA GGGATCAAGACTTCACACTCCCAT CGAGCTCGCCTATCTATCAATTCC TTCCTCCTAGAGTTGACAAACTT CATCCGCCTGGTTCCCTCCCTAT AGCCATGACAGGAACGCCAGTAG CCCTGAAGGCTCAGATGGT
CCAGAGCTGAGTAAAAAGGTCA AGTGTCCACAGATGGATGAATG
GATCAATCTCTAAACTGAAGGTG AACACATGAGCATGCAGGTG
CTCAAATCTTGCCAACTATCCC AAAAGCAAAACAAAAACAACCC
CTGTGGGAGTGTAGCATCTTTG ATCCTGACTTGCTTATGGCTG ATCCAAATGCTGCAAGCG ATCAAATCCTTACCTCTGCAGC AAGACTGCCCACCAATGAG GAAGCCCACCCTACAAATCA
TGTTTTCTCCCTCAGATTACC GAGGCTCCTGATAGCAGCC
TCACAGACCAAGAGCTGTGG ATATGCCTTGGGTGCAGC ATGGGAAGAGAATCTGACAAGG CATGTTGCTGCAAATGGC AGAGCATTCCAGGCTTCTA GTGGCTGTGGTGTAGGCC TTCCACGTGATGTGGGATAG GCTGTAGTTCTGATTTGACCCC GATCTTGAGCTGCCTCCG TCCATGCCATGGACACAG TTTCGTGGGCTTAGTGGC ACCTCCCTCATCAGCTATTCC CTTTTCCTGGGTTGAGCAAC TAGAAACACCATCATCCATTCA TTTGAAAATGGGGTGTTTCC GAAATCTGCATGGTCTCAGATG TGGATTGGATAAGCAATGAGG GGGGCTCTCAGGAAGGAG ATCTGACATTGCTGTGGCTG
~ ~ ~ ~~~~ ~ ~ ~ ~ ~ ~~~~~~~~~~- ~
65 62 58’.O 62 55”O 58 58
62 60’
50 62 60 55 60 55
62 58
60 55 55 66 58 62 65 62 62 62
65 55
60 58 58 56 62 58 58 55 58
60 55
62
68 58
366 322 12 252 246 4 132 110 5 243 0 6 331 270 4 237 223 7 164 142 7 213 174 7 137 125 7 189 175 6 209 189 5 162 131 6
241 203 8 172 164 4
197 155 11
132 122 5 191 177 6
124 102 9 187 167 6 196 146 7 221 186 9 160 93 10 158 136 4 113 0 7 260 211 10 171 0 9 293 0 8 123 105 9 200 168 7
180 154 6 184 172 5
120 102 9 194 0 8
201 161 8 184 154 5
164 148 5 164 142 9 253 243 6 168 148 8 150 130 7 211 169 7 244 208 8 177 159 6
55 179 165 5 55225 126 88 9 58 142 0 7 65 112 89 7 62 102 98 2 58 161 145 8
62 162 150 4 58 179 153 7
60 172 119 7 58 155 143 4 58 112 92 6 61 173 131 9 58 137 129 5 60 226 212 4 60 139 128 8
63 124 112 3 58 194 174 7
62 103 97 3 58 222 204 7 58 152 116 8 62 262 238 8 62’.O 160 148 5 58 152 136 6
62 127 91 8 65 285 251 4
63 253 249 3 60 147 125 6
62 148 120 7 55 166 146 5
58 113 101 5 62 111 93 5
62 146 119 6 62 176 160 8 60 142 0 9 58 178 162 7
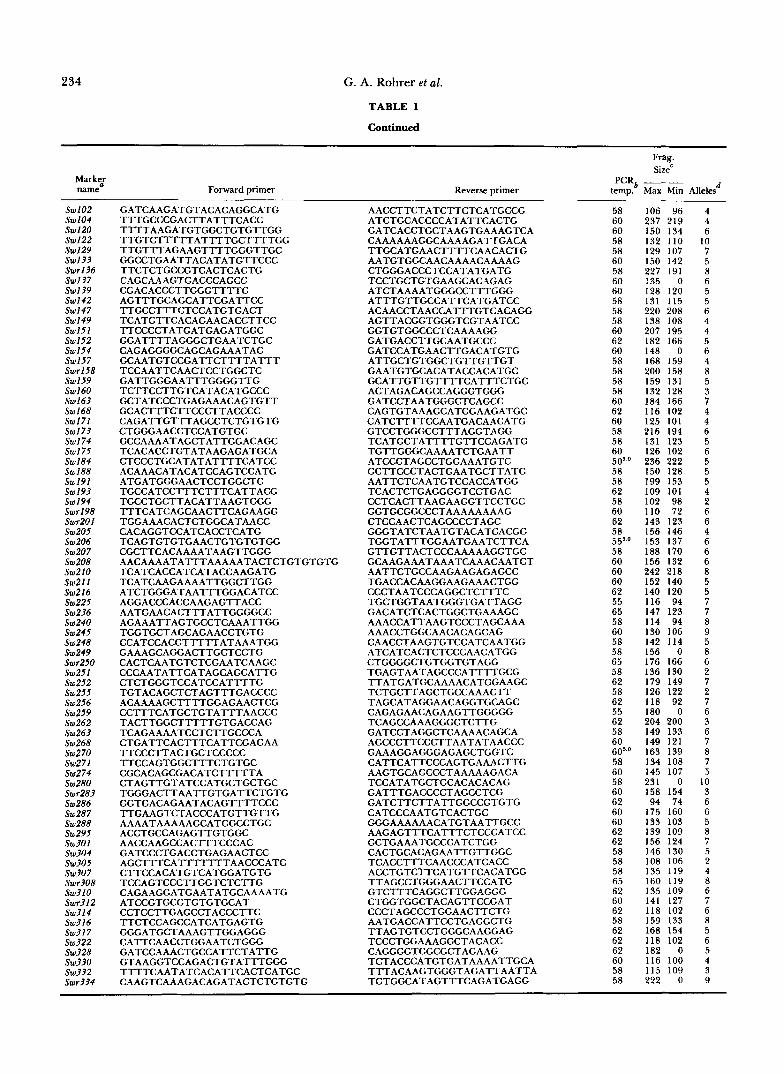
234 G. A. Rohrer et al.
TABLE 1
Continued
Markzr name Forward primer
Swl02 Sw104 sw120
Sw129 sw122
Sw133 Swr136 Sw I 3 7 Sw139 Sw142 Sw147
Sw151 Sw149
Sw152 Sw154 Sw157 Swrl58 Sw159 Sw160 Sw163 Sw 168 sw171 Swl73 Swl74 Swl75
Sw188 Sw184
Sw191 Sw193 Sw194 Swrl98 Swr2Ol Sw205 Sw206 sw207
sw210 Sw208
sw21 I Sw216 Sw225 Sw236 Sw240 Sw245 Sw248 Sw249 Swr250 Sw251 Sw252 Sw255 Sw256 Sw259 Sw262 Sw263 Sw268 sw270 sw271 Sw274 Sw280 Swr283 Sw286 Sw287 Sw288 Sw295 sw301 Sw304 Sw305 SW307 Swr308 SWflO Swr312 Sw314 Sw316 sw317 sw322 Sw328 Sw330 Sw332 Swr334
GATCAAGATGTACACAGGCATG TTTGCCCGACTTATTTCACC TTTTAAGATGTGGCTGTGTTGG TTGTCTTTTTATTTTGCTTTTGG TTGTTTAGAAGTTTTGGGTTGC GGCCTGAATTACATATGTTCCC TTCTCTGCCGTCACTCACTG
CGACACCCTTGGGTTTTG CAGCAAAGTGACCCAGCC
AGTTTGCAGCATTCGATTCC TTGCCTTTCTCCATGTGACT
TTCCCCTATGATGAGATGGC TCATGTTCACAGAACACCTTCC
GGATTTTAGGGCTGAATCTGC CAGAGGGGCAGCAGAAATAC GCAATGTCCGATTCTTTTATTT TCCAATTCAACTCCTGGCTC GATTGGGAATTTGGGGTTG TCTTCCTTGTCATACATGCCC
GCACTTTCTTCCCTTACCCC GCTATCCCTGAGAAACAGTGTT
CTGGGAACCTCCATGTGC CAGATTGTTTAGCCTCTGTGTG
TCACACCTGTATAAGAGATGCA GCCAAAATAGCTATTGGACAGC
CTCCCTGCATATATTTTCATCC ACAAACATACATCCAGTCCATG ATGATGGGAACTCCTGGCTC TGCCATCCTTTCTTTCATTACG TGCCTGCTTACATTAAGTGGG TTTCATCAGCAACTTCAGAAGG TGGAAACACTCTGGCATAACC CACAGGTCCATCACCTCATG TCAGTGTGTGAACTGTGTGTGG CGCTTCACAAAATAAGTTGGG AACAAAATATTTAAAAATACTCTGTGTGTG TCATCACCATCATACCAAGATG TCATCAAGAAAATTGGCTTGG ATCTGGGATAATTTGGACATCC AGGACCCACCAAGAGTTACC AATGAACACTTTATTGGGGCC AGAAATTAGTGCCTCAAATTGG TGGTGCTAGCAGAACCTGTG
GAAAGCAGGACTTGCTCCTG CCATCCACGTTTTTATAAATGG
CACTCAATGTCTCGAATCAAGC CCCAATATTCATAGCAGCATTG
TGTACAGCTCTAGTTTGACCCC CTCTGGGTCCATCCATTTTG
ACAAAAGCTTTTGGAGAACTCG CCTTTCATGCTGTATTTAACCC TACTTGGCTTTTTGTGACCAG TCAGAAAATCCTCTTGCCCA CTGATTCACTTTCATTCGAGAA TTCCCTTACTGCTCCCCC TTCCAGTGGCTTTCTGTGC CGCACAGCGACATCTTTTTA CTAGTTGTATCCATGCTGCTGC TGGGACTTAATTGTGATTCTGTG GGTGACAGAATACAGTTTTCCC TTGAAGTCTACCCATGTTGTTG AAAATAAAAAGCATGGCCTGC ACCTGCCAGAGTTGTGGC AACCAAGCCACTTTCCCAC GATCCCTGACCTGAGAACTCC AGCTTTCATTTTTTTAACCCATC CTTCCACATGTCATGGATGTG TCCAGTCCCTTGGTCTCTTG CAGAAGGATGAATATGCAAAATG ATCCGTGCGTGTGTGCAT CCTCCTTGAGCCTACCCTTC TTCTCCAGCCATCATGAGTG GGGATGCTAAAGTTGGAGGG CATTCAACCTGGAATCTGGG GATCCAAACTGCCATTCTATTG GTAAGGTCCAGACTGTATTTGGG
CAAGTCAAAGACAGATACTCTGTGTG TTTTCAATATCACATTCACTCATGC
Reverse primer PCRb
temp.
AACCTTCTATCTTCTCATGCCG ATCTGCACCCCATATTCACTG GATCACCTGCTAAGTGAAAGTCA CAAAAAAGGCAAAAGATTGACA
AATGTGGCAACAAAACAAAAG ~ ~ ~~~~~
CTGGGACCCTCCATATGATG TCCTGCTGTGAAGCACAGAG ATCTAAAATGGGCCTTTGGG ATTTGTTGCCATTCATGATCC ACAACCTAACCATTTGTCACAGG AGTTACGGTGGGTCGTAATCC GGTGTGGCCCTCAAAAGG GATGACCTTGCAATGCCC GATCCATGAACTTGACATGTG ATTGCTGTGGCTGTTGTTGT GAATGTGCACATACCACATGC GCATTGTTGTTTTCATTTCTGC ACTAGACAGCCAGGGTGGG GATCCTAATGGGCTCAGCC CAGTGTAAAGCATGGAAGATGC CATCTTTTCCAATGACAACATG GTCCTGGGCCTTTAGGTAGG TCATGCTATTTTGTTCCAGATG TGTTGGGCAAAATCTGAATT ATCCCTAGCCTGGAAATGTC GCTTCCCTACTGAATGCTTATG AATTCTCAATGTCCACCATGG TCACTCTGAGGGGTCCTGAC CCTCACTTAAGAAGGTTCCTGC GGTGCGGCCCTAAAAAAAAG
GGGTATCTAATGTACATCACGG CTCCAACTCAGCCCCTAGC
TGGTATTTGGAATGAATCTTCA GTTGTTACTCCCAAAAAGGTGC GCAAGAAATAAATCAAACAATCT AATTCTGCCAAGAAGAGAGCC TGACCACAAGGAAGAAACTGG CCCTAATCCCAGGCTCTTTC TGCTGGTAATGGGTGATTAGG GACATCTCACTGGCTGAAAGC AAACCATTAAGTCCCTAGCAAA AAACCTGGCAACACAGCAG
ATCATCACTCTCCCAACATGG CAACCTAAGTGTCCATCAATGG
CTGGGGCTGTGGTGTAGG TGAGTAATAGCCCATTTTGCG TTATGATGCAAAACATGGAAGC TCTGCTTAGCTGCCAAACTT TAGCATAGGAACAGGTGCAGC CAGAGAACAGAAGTTGGGGG TCAGCCAAAGGGCTCTTG GATCCTAGGCTCAAAACAGCA AGCCCTTCCCTTAATATAACCC GAAAGGAGGGAGAGCTGGTC
AAGTGCAGCCCTAAAAAGACA CATTCATTCCCAGTGAAACTTG
TCCATATGCTGCACACACAG GATTTGACCCCTAGCCTCG GATCTTCTTATTGGCCGTGTG CATCCCAATGTCACTGC GGGAAAAAACATGTAATTGCC AAGAGTTTCATTTCTCCCATCC GCTGAAATGCCCATCTGG CACTGCACAGAATTGTTGGC TCACCTTTCAACCCATCACC ACCTGTCTTCATGTTCACATGG TTAGCCTGGGAACTTCCATG GTCTTTCAGGCTTGGAGGG . ~ ~ ~ "~
CTGGTGGCTACAGTTCCGAT ~~~~~~
CCCTAGCCCTGGAACTTCTG AATGACCATTCCTGAGGCTG TTAGTGTCCTGGGCAAGGAG TCCCTGGAAAGGCTACACC CAGGGGTGGCGCTAGAAG TCTACCCATGTGATAAAATTGCA TTTACAAGTGGGTAGATTAATTA TGTGGCATAGTTTCAGATGAGG
58 60 60 58 58 60
60 58
60 58 58 58 60 62 60 58 58 58 58 60 62 60 58 58 60 50"' 58 58 62 58 60
58 62
553 58 60 60 60 62
65 55
60 58
58 58 65 58 62 58 62 55 62 58 60 603-'
60 58
60 58
62 60 60 62 62 58 58 58 65 62 60 62
62 58
62 62 60 58 58
Frag. SizeC
Max Min
106 96 237 219 150 134 132 110 129 107 150 142 227 191 135 0
131 115 128 120
220 208 138 108 207 195 182 166 148 0
200 158 168 159
159 131
184 166 132 128
116 102
216 194 125 IO1
131 123 126 102 236 222
199 153 150 128
109 101 102 98 110 72 143 123
153 137 156 146
188 170
242 218 156 132
152 140 140 120 116 94 147 123 114 94
142 114 130 106
156 0 176 166 136 130 179 149 126 122 118 92 180 0 204 200 149 133 149 121 163 139 134 108 145 107 231 0 158 154
175 160 94 74
133 103 139 109 156 124 146 130 108 106 135 119 160 119 135 109 141 127 118 102 159 133 168 154 118 102 182 0 116 100 115 109 222 0
Alleles d
4 4
10 6
7 5 8 6 5
6 5
4 4 5 6 4 8 5 3 7 4 4 6 5 6 5 5 5 4
6 2
6 4 6 6 6 8 5 5 7 7 8 9
8 5
6 2
2 7
6 7
3 6 7 8 7
10 5
3 6 6 5 8 7 5
4 2
6 8
7 6 8 5 6 5 4 3 9

Genetic Map of the Pig
TABLE 1
Continued
235
Marky name Forward Drimer Reverse Drimer
Frag. SizeC
temo.) Max Min Allelesd PCR ~
sw335 Swr340 Sw342 sw344 Swr345 sw349 Sw352 sw353 sw354 sw373 sw374 Sw378 Sw382 Swr389 sw395 Sw398 Sw403 Sw413 Sw4 1 9 Sw423 Swr426 Swr428 sw435 Sw436 sw439 sw443 sw444 sw445 Sw446 Sw452 Swr453 Sw458 Sw460 Sw467 Swr468 Sw472 Sw480 Sw482 Swr485 Sw486 Sw487 Sw489 Sw491
Swr493 Sw492
sw497 Sw510 Sw5l I Sw512 Sw520 Sw527 sw539 Sw540 Sw552 sw557 sw575 Sw581 Sw589 Sw590 Sw605 Sw607 Sw6 I7 Sw619
Sw698 Sw632
Swr702 Sw703
sw707 Sw705
Sw709 Sw714 Sw724 Swr726 sw727 Sw730
Swr741 Sw732
sw745 Sw742
sw747
GAGTATGGGGAAAGCCACG CATTGGTGATTTGCATCCC GGGTTCTGTGGTAGTGACTGC AGCTTCGTGTGTGCAGGAG AACAGCTCCGATTCAACCC CCTGTTGTAGGCTCCATGAG GCCCCCATTCTCAATTCAC
TGGCTTCTCAGCCTCCAC CACCCCATGCCTGAATACTG
TTTGCTGCAAAGCAATGTTC AGTAATCCCATCCTCCCCAG ATTATGCACCCCTACTCCCC CTGAGCCACAGAGAGCAGC TTTTTTAGTGTTGCTGTTTTCG TTCCAAGGTTATGGAGATATCC AAGTGCCAATGCTTTGTTCC GTGTATGTTCATGCATGGGTG CAGACACACACCCCAGTGTC AATGGGAAATAGGCTCTAAGCC ACTCAGGTAATGGTAAACTATATATGTGTG CCTACATATGCCGCAGGTG TTCCACGTAGATTTTTGACACG ATCATGTGAGAAAAAGAACATATGTG GGACTTCTAGCCTCCAGAACTG TTCTAGCCTCCAGAACTGAGAA ACAAAGGCCAAGCCACATAC ATAGTTTCGGTTGGCCCAG CCTCCCTGGCACTCATTG GGTTTCCTGTCTGTAAAATGGG ACAGGAAAGTGACCCTGCC TTGAATTTTTTTCATGGAAACC TTATGGTTTCCTTTGCTGTGC ATTGCACACCTATCTCTATGCG TATACCTTTAGCGCCTAGGAGC GCTTTAAAAACCCTCCTGCC AAAATGAACCCTCTCCAGTTTC TGCCTGGAAAAGGTCTGC
CCATTTTCAATTCATGGAAGG GGAGAAAAGAATGATTATGCAAA
GCAAATACTTGGTGGCCG TGAGCACCTCTGCTTGAGTC CAAGTGTGAAATTTGTGCGG TTTAAGCCACTGCACCAGG TCCATCAGCTCACATAGTTAGC ATATTTAACCCATTGCAGCATG TTAGGAACGTCTGGGTTTGG GTTCCCATAAGCTCATCACTCA AAGCAGGAATCCCTGCATC TATAGTGCAGTTATATCTCAATACAAATGG GCCACCGGTGTGACTCTAAA AGCAAGAGCCAGAGCATACC CCCATCCACGCTAAGAAGAG TCAGTGGAGGGCGAATAAAC
TGTCCACTGGTAGATGAATGG AAGAGCCAGATGGGGAGG
CTACAGCCGGTGGCTACAG CCCCAGATTGACTCTAGACTCG TTCAAATCTCACCACCAGTCC ATTTGCTGAGAGATAAGGTGCC AGCCTTCTGTGCAGAAAAGC AGCACCTGGCACAGGATAAC
CACTGGTAAGTATTCACGGTGG CTGGGTTTACAGTGTTCTGCC
ATACAAACCATAGCCATGGACC TGGGTTGAAAGATTTCCCAA
CTGCTGTTTCTGTTTCATCTGC AAGATGAAGCAGGAACTCAAGG
ACGTGCTTTTCTTTGAGCTG CTGAAGTCTTGAGATGAAACGC
TCTCAAGGTCACACAGCAGG ATCTCCTTGTTAGAACTTGTGTGTG TCCTAAAGGACCGAATTTAAAA CACCACAGAGGGAACTCCTC
ACCAAGTGCAGGCTAAATGC ATCTCTCTGGTTTTCAGATTTTAAGG
GCAAATGAATGACCAAAAAGG TGCATTCTGTGTTTTTTTTTGA AATTCTACTTCTGGGGAGAGGG CTGAGTCTTCTGGGAACTTTTC TGGCCCAGGAAGTTTCAG
CCATCAACAAACTGTATGCACC ATGGGCTGGCAGCTACAG TCATCCACAACAGCAGAACC GTAGTGGTCCAAAGAGAGTGCC TACTCAGCCTTAAAAGGAAGGG CTAGGAGTCGGCCCTGAAC GATCAAGCTCCCCTCTTCG ATGTGAAGACTCATGCTTGGG GGTTCTCCAAACAAACATAGCC GGTAGGATTCAATAACACCTGG TGCTCTCCAGCCCTCAAG GATTTCTTCTTTGTTTGTGCCC GAGTGTGTGCAAAGGGGG GTAGGCCAGCAGCCACAG GATCCCTACCTCACACCACA CGGAGGAGAAATAAGGGTAGC GTCTCTGCTTTGCTTGCATG AGGTCCAACCCTCCTGATG TCCCCTCCCTATACATGTGC TTCTTCCACATTATTCCTTGTGG GAGAAGTGGGGAAGGGACTC
TGCAAGAGAACTTCCGGC ACCTGCGTCCTCATGGATAC
CCTCCTCCATCCTCACCATA AATTTTCAATCACTACCACCGG
TCACCAGGTTTCTGGGTTTC CTTAAGCCTCAAGCTAACAGGC CACACACACAAGCAGGTGC ATCCCTGGCTGGGAACTC TGGAACATGATGGAGGATAATG TCTGGACTTGCTGTGACTGTG CCGTTTACTGCAGGGTAACC AATCTCCATGTGCCGCAG CTCAGCCGCTTGGATAACTC TGATTTGACCCTTAGCCTGG TCTGAACACTACAGCCCGC CTTCTCTCCTTGTTGCCCTG CCCAGATGTCGGTTCTTTGT CTAAGCCGCAACAGGAACTC TCCATTTGCTAATAAAGAGCTGA ACACCTCTAAAATGGCAGTGTG CGAAGTGCTAACTATAAGCAGCA CAGGGAACTCCTCATAGTCCC ACCATGACAGGAACTCCGAG CTGCAGCTCCACTTAGACCC TGGGAGCTTCCATGTGTTG ATATTCTGCACTTGCAGCCC CCCAGCCACCAGTCTGAC TCTGACATTAATACAACCACCCC CTTTTCCCAAGTTCACTTAGCA TAACCTGTTGAGCCACAAAAG TCAACGGGAACAACTTGAAG CCAAATCCTGGCAACACAG ACTGATAAGACATGCTGTGTGC CTTTTGAATGTTCTTTTTCCCC AGGAATCCATTCAGCCTGG CATGATGGAGGATAATGTGGG CTCATCAGCAGCAACCACC GCATTGACCAGGGTCAGG
GCAAGAACTGGTTTTCCAGC CCCCAGGTTCTCTGCTCTC
TGTGATGGAGCCTGATAGAGG TATGCTTGTTCTGCATCATCG
GATCCGATTTCAGGCCTTAA GGAGTCAGTACTTTGGCTTGA
TTGCAGCTCCTGTTCAACC CTTGATGGCTTTACTGTTCACC TGTAGAGCATTTCAGAGGAAGC AAAAACGCTAAAGAACAAAGCG AAGGGACAGTGGTAGGCATG GAGATGAATATGGGGAAAATGAAC
TCATATGCCACCGGTGTG TGTGCATTAATGTCCACGTATG
GGCCTGGTTCCATTAGGG GTTACAGGCTGGGAGCAAAG CATTTTCAATTGGATTGGTTTC GTGCCTGTGGCGTAGACC CTTTTGGGAACATTTCTGCC ACAGGGCTGGTAGTGTCCC
58 112 100 58 149 0 55 127 91 55 174 150 55 166 140 62 177 149 55 111 107 58 164 144 60 222 206 55 170 152 62 169 141 60 127 123 65 144 132 62 122 120 55 163 139 55 188 166 55'.5 114 102
174 162 62 55 60 62
60 52
58 58 60 60 58 60 60 51 62 60 55 60 58 60 58 60 50
55 58
60 60 58
60 58
60 58 62 62 60 58 60 55 60 57 60 60 58'.' 58 65 58 58 58 65 58 62 58 58 58 55 58 58 60 55 62 60 58 58
~~
174 154 149 139 202 184 123 0 178 148 162 144 179 161 134 108
203 181 120 92
164 118 97 87
189 173 123 117 199 159 130 114 166 120 111 95
267 257 144 72
119 97 160 138 188 148 174 156 174 154 146 118 194 156 116 94 160 150 205 165 157 129 124 102
150 148 168 128
253 229 146 112 250 240
205 199 157 151
150 138 271 184 131 109 172 152 157 145 147 129 173 157 224 194 160 152 140 126 163 145 101 0 143 127 169 145 166 144 155 125 148 144 137 131 180 168
224 193 144 0
211 137 153 149
4 5
10 6 5 9 3 8 5 6 7 3 3 2 9 6 5
6 5
5 9 7 6 5 5 7
10 11 10
4 5
8 3
7 7
6 3
4 5 6 9 6 3 7 8 9 6 7 7 5 5 2 8 7 3 3 3 6 4 5 3 4 7 6 5 4 7 5 5
4 3
5 7
4 3
4 6 9 7 3

236 G. A. Rohrer et al.
TABLE 1
Continued
Frag. SizeC
Marksr name Forward primer Reverse primer temp. Max Min Allelesd
PCRb ~
Sw748 sw749 Swr750 Sw752 Sw761 Sw763 Sw764
Sw767 Sw766
Sw769 sw775 Sw776 sw779 Sw780 Sw781 Sw782 Swr783 Sw787 Sw790
Sw803 Sw792
Swr8I I Sw813 Sw816 Sw818 Sw824 Sw830 Sw832 Sw833 Sw835 Sw836 Sw839 Sw840 Sw853 Sw855 Sw856 Sw857 Sw859 Sw864 Sw866 Sw871 Sw873 Sw874 Sw878 Sw882 Sw886 Sw902 Sw903 Sw904 Sw905 Sw906 Sw91 I Swr915
Sw917 Sw916
Sw919 Sw920 Swr925 Swr926 sw933 sw935 Sw936 sw937 Sw938 Sw940 Sw940 sw943 sw944 sw949 Swr950 Sw951 Sw952 sw955 sw957 Sw960 Sw962 Sw964 Sw967 Sw969 Sw970
CATACATACACCATGCCCATG TTCCCAAACCAACCAAAGAG CATGGACATTAAAAAAAGTGGTC TCAAGAAATAAGGACAGGAACC CTTTGCTCCCCATTAAGCTG GGGTGCATTGTTCTCATATGG TAGCAGATTGTTTAGCCTCTGTG
TGCGTGACTAGAACCCTGTG AATCAATTGTCTCCACTTCAGG
GGTATGACCAAAAGTCCTGGG TTGCCTTTTAATTTCCCTACTTT TAATCCGTTGCACCCCAG TACATGTGCAGAAAACAGAGCC TCTACCAGCTAAATTGCTCACTG CAACTACGTCCTTCTTTTTGCC TCTTCACATATGAGCACCAACC CATACCTGCACATCTCTTCAGC CTGGAGCAGGAGAAAGTAAGTTC CTGTGGGAGTGTAGCATCTTTG TACTGGGGTGAGCTTGTGTG GGTCACAATTGAGGGCACTC GCGGGTATAGCTCCGATTC AGTTGATTTAAAATGTTGTGCCA TTCCATACGCTGTGCTTCTG TCTGATACCACGAGTATGGCC CTAAACTTTGAATGTCTTGCGTG AAGTACCATGGAGAGGGAAATG ACTATCCTCTTACTCTCCCTGCA CTGACTGTTTTGCTGCAGTG
TCCAGTGACAATGTCAGGTTC TGGCTCAGAGTTTTTCACTCTG
GGAAACCAGGATAACAGGAGG CCTGGAAACAACCTAAGTGTCC CTTTCTTCTGTCTGGGTGTGG TCTCTTTTTCTCAAAACCTGCC
TGAGAGGTCAGTTACAGAAGACC AGGGGGTGGGTGATTGTG
TTCAGTTTTGGTGTAGCCCC TTGCACAGATGCTAATTCTTCC AGTGTGGTGTGTACTGATTTGG ATCCCTGTTTCCTCCACCTC TCCATCTACACTGACCCAAATG AAAAGAACCCAACTACAGCAGC CTGGGAGCACAACAGATAGTG TGGGTCTCCATCATCATGTG AATTGGTTTGTCCAGAATTTGG ATCAGTTGGAAATGATGGCC TTTCTTTGACAGTTGTGCAAGG CCCCTTTCAGAAGAATGAAAA ATCCCAACCTTCTTTCAAAGG GAGGACAATGTGAGAAAAAGAATG CTCAGTTCTTTGGGACTGAACC TTCATGTTTCCCTATTACAGCA GGAGGTGGCAATAACCAGG AATCTTGGAACCTATGGCCC TCCAAAGTCATGAAGATTTATTC CATGGAGCTGAACTTGCAAA AGCTCCAATTTGACCCCAG TAGCAGACCAGAGTTTTTTTGC ACATATACTTCCGACAGCCCC GTGGTGGTTTGCCTCTTATAGC TCTGGAGCTAGCATAAGTGCC GTGGAGAACACCAAATGCG TTATTATTTCCATTGCCATTGG TACCTCTGTGTATGCAGCACG GGCTCCAGTGTACCAGTTCC AGGAGGACTAGAGCGCCTG CTCCAGTTCATTTGCAGTTCC TGAGCAATGAGTTCAATGCC CTCCATGTGCTGCAGGTG . -. . - -. . . . . - . . - .
TTTCACAACTCTGGCACCAG ~~~~~~~~~~~
AACGGGCACCTGCTGTATAG CTGCTCAAAGTTTATCTTCCCC AGGAAGTGAGCTCAGAAAGTGC TCTATGAGCCATGCTATGAACG TGAATCTCAAGCAGTAGAGCAC GTGGTTCCTCTATGCAGAGTCC AGCAGACTGTTCATCTGTTCAG AGCCTGGAACATTTTTGAGTG AGTGGGCAAACCAATAATGC
TTTGCCCACAGAAATGTTTAC AGGAACTTGCCAAAATCACG GGAACCTCCATGTGCCTG CTACCTTCCCATTTGATGCTG TCTAGCAAATGTCTGAGATGCC TGCTCTAGCAACACACACCC AAGCATCTTTTCTAAGCACAACA AATTCTGCCTTGTTCCAAAGG TCACGCAGAACGTTTCAGAC TCTGCTATGTGGGAAGAATGC TGATGGAACATGATGGAGGA CCATATGCCACAGTTTCGG TGTTGGCTCCACTTCTTCAC TAGGACCTGGAATATACTCCCTG GATCCTTGGTCTGGAAACTTG CGGAACAAGAGGAAGTGAGTG GCAGCTATAGCTCCGATTGG GGACAGTTACAGACAGAAGAAGG CATACACCCCAGATGTGGC
TCCCAAGCAACAGAAGTGC TTCCCTCCTCTCCTCTTTCC
TCCTAAACCTGCTTATGCAATT AATATTTCAAAAAAAGGAATGCG
TTTAATCTGTTGAGCCATCCG AGGATTAGGAGGGTCTTCAAGG
ACCAAAGCCTCGTTTCAAGA ACATGGTTCCAAAGACCTGTG TAGCCTGGGAATGTCCATATG TCCACTGAGGTCTCTCACTCTC CAGAGGTTTACCAAGTTTTGGC TTAGTCACTCTTTTGGAGCCTC TAACCCACTGTACCACCAAGG TTCCACATTAGTTCCGGGAC GGGAAAATAGCCTCCACCTC GGGAAACTGCTTTTACTCCAC AACTTCCCCATGCTGCTG GATCCTCCTCCAAATCCCAT CAGGTGTGGCCCTAAAAAGG TTAAGACTGTCTTGGGCATTCC CATGCAGGGAAAGGAGAGAG AATTAAAGCCATTCACTGGGG ACAGTAGCCAAGATATGGAAGC TTTATGAGGGTATCCTGACACC CAAGCAATCAATTCCTTAAGGG TTTTCCGGGGAAACAGAAC GATCATTCCCATTTGTTGAATT CTTGCCTCAAAGAGTTGTAAGG TGAACTACAGCAGCGACCTG CCTAGTGGCCAACACCAAGT TCCAGTGGCAGAACAACATG TTTTTTCCTGTGATTAGAACTCTTAGG CATCTGTGGAAAAAAAAAGCC GCTATAGCTCCAATTCGACCC CTGCCCAGGCTGTTTAAGAG CCAACAAATTTCAATCAAGTTG TCACAGACCTAAATGTAAGAGCT ATCAAGCCCAACTTAAGAATACA
TTGACCCCTAACCTGGGAG CTCCAAATTTCTTTGCTCAAGG
AAGAGCTTGGTGAATTGAGAGC ATATAAGGGAAAATAATCTGAAAGAGTATG GTGCAAGTACACATGCAGGG TGGAACTTTGAACCTGACACC CACTTATGATGGAACATGATGG TGAGCATCTCATTCCGTGTC TGTTTTCCCAGCTCTATCCG AGAGAGGCCAAGAATAGAACCC TCTTCATGTATCACAACCCTGC TCGTTGGTGAAGGCATCC CCAAACACTCCCCTGCAC GATCGTGCCCAAATGGAC GATCATTTCTGCTGCACAGC GTCACTCCACTCTGTCTTTCCC ATGGACAAGCTTGGTTTTCC AGTGGCGCCAACATTAATTC TCAAGATGCCCACTCACCTC ATGTGATGAAACATGATGGAGG
TTTCAATTGGTTCCTGTGTCC GGGGCAGCTGAAAAGTCC
GTCTGCCACAAGCTGACTGA
50 58 58 60 60 62 60 60 60 60 58
62 58
62 62 60 62 60 62 62 58 58 58 60 58 58 62 62 60 60 58 62 55 62 58 62 58 60 60 60 60 60 60 60 58 58 60 58 60 60 55 60 60 60 58 58 60 62 65 60 58
58 58
58 58 60 62 58 58 62 58 59 65 58 58 60 58
60 58
58
193 179 113 107 147 140 124 108 161 149
128 112 187 171
164 142 137 0 139 106 176 170 117 88 107 103 136 116 198 123 99 89
186 0 161 153 172 118 156 140 104 96 183 167 110 0
179 126 177 147
179 163
243 227 189 179
183 171 240 218 153 135 166 144 137 121 101 89 146 128 200 160 159 145 123 85 178 168 185 146 126 102
219 191 140 134
120 101 135 119
203 195 174 142
201 195 179 163
184 158 151 125
173 151 157 139 142 136 137 117 132 87 150 142 148 123 115 111 133 97 203 195 112 94 226 214 157 147 157 0 144 136 132 118 166 164 204 178 163 145 136 124 149 143 113 103 157 113 182 152 160 130 248 220 114 95
375 227 140 120
6 4 5 6 6 4 7 6 5 7 3 7 3 7 8 4 4 5 7 4 3 4 4
9 7
6 4 4 5 8 6 6 5 5
10 3
7 4 6 4 5 4 8 3 4 8 6 4 5 6 7 7 6 4
11 5
4 8 2 5 5
6 6
4 5 4 2 2 8 8 5 4 5 9 4 5 5 7 6 6

Genetic Map of the Pig
TABLE I
Continued
237
Frag. SizeC
Marky name
PCRb ~
Forward primer Reverse primer temp. Max Min Alleles d
sw973 sw974 sw977 Swr978 Sw980 Sw983 Sw986 Swr987 Sw989
SwrlOO sw995
Swr1004 Swr1008 SwrlO2l Sw 1026 Sw1027 Sw1030 Sw1031 Sw1032 Sw1038 Sw1041 Swr1042 Sw1045 Sw1053 Sw1055 Sw1057 Sw1059 Sw1065 Sw1066
Sw1070 Sw1067
Sw1071 Sw1073 Sw1080 Sw1081 Sw1082 Sw1083 Sw1085 Sw1089 Sw1092 Sw1094 SwrllOl SwllO5 Sw1108 SwrlllO Swllll Swrll12 Swrlll3 Sw1117 Sw1118 Swlll9 Swrll20 Swll22 Swll23 Swl125 Swll29 Swll34 Swl135 sw1200 sw1201 sw1202 Sw1204 SwrlZlO Swrl211 Swr1218 Sw1262 Sw1263
CACAGTTTGCATTGTGGGTC GGTGAAGTTTTTGCTTTGAACC GATCAAGGTGAGTCTGACATTAA CCCGGTGATGTCAAGTGAC CTTCAGTGTAGTCCAAGTGGC GCAGTCCCACTCTTAGGTATATATCC AGGAAGCAAAATCTTAAGAGGC TTGTTATGCCTACCTGTGTTGG CTCATTAATTTAATTGAGTGAGTGTG
CAAGGAGTATCTTTCTCACAGCA TTAAGCACTTCATGGAGCTTTG
TGGGAACACCTGCTTCATTC ACAGCCACCAACAGTGTTTG CGCCACAAGTGAACTCC TGGAGAGGCAATGCTGTATG AGCAACCTGAGCCACAGTG AACTGGGGAAGTAGAAGAGCG ATCACCCAGACAAAACAATCTC ATTGGGTGGACTGATATGGT
ATCAGAAAATGGTCAACAGTTCA CAGTCTCTGAACACAGTTCTTTCA
TCAAACTCACATCTTTGCGTG GGTTTTATCTTTTTCCACAAAGG CCCACCCACTGACTCCTG CTCTTCGCTGTTGCTAACCC TCCCCTGTTGTACAGATTGATG TCTCATGGCCAATCTTTCAC TGTAGTGATGTGTCAGCACAGG GCAGGATGAACCACCCTG
CTTGCAGCATCACTCTTAGGC TGCTGGCCAGTGACTCTG
GGGTGCAGCCCTAGAAAAG AGTGCTGATATCAAGCACAAGC
GGGAAATTTGGATTTGAAATTG AAACTGTAGAACCAGCTGGAGC ATTTGTGAGATAGGCTTGGTGT CCTTGCTGGCCTCCTAAC CAGGCTCCCTGACTTCAGAC TTTTCCCCTTCACTCACCC CCTGCTATGTCTTATTGGGAGG GATCATGGTGTACCATCCTTTATA AACTTCCATATGCCACAGGTG TTCAATTCAAAGAAGTGTTTGTG GTCTTCTTCACACGGAAATGC GATCTGATGGATTCTATTTTGTGTG AGGTCCTACTGTCCATCACAGG CTGGGTTTTGTTTCTGTTTTTG ATGGAACCTGGGTTGCTTC AGGGCCATAACTTGGAATCC ATCACCCTTCACTCAGAAATCC CAACCTCAAAAATGGAGAAAGG CAAATGGAACCCATTACAGTCC TCCCATTTTACAAGAAAAAGGTG
TAGATGTATATACTTCCATGTGTG GAGTCTGCCTGCATTGTGAA
TAAGTTTAGGTGCCTCATTTGATTT GATCATATGAGGAAAAGAATGTGT
TAAGTTTAGGTGCCTCATTTGATTT AATGCAAGTGATATAAGAGCTTTTGG CCAACCAACCAACAGAAAAC TAGAGATGGTTGAGGAAAAGGC ATTTTGAACATGAGTAATTCCGTG GGATGGGAACTCCCAAGATA TAGACCCTCCTCTGTTCTTTCC TGTGACTATGGCATAGGCTCC TTGGGGCTCACAAAGTCAC AGATGAAACTGACATCTTCTGCC
TAGGGGGCCCGTAAAGTC GAAAGAAATCCAAATCCAAACC CGTCACAAGTGCAGCCTTTA CATATGCCGCAAGTGCAG GATGTTTTGCTGATAGGAAGGG ATAATGCTGCTATGAACACTGTAGTG GGTGAGCCAGGAACAAGTATG CTCCATATGCCACAGGTGTG CCCGTGGTTCTGACTGAACT
CTGGGAACTTCCATAAGCCA CATAATGGAAATACCGGGTCC
TCCATATGCCCCAAGTGTG GAACTTCCATATGCTGCAAGTG CCGCGGGTCCAGCTATAG GTATTTCACCTGCAGCTCCC GGAACTTCCACACGCCAC TCATCTCATGCCTGTGTCTAAA TATGTCAACCCCAAACCCC GATCTATAAAGTGTAAATTGTGTGTG
GGAGAATTCCCAAAGTTAATAGG GCTGTTGGTGAGAGTCAATCC
GCCTGGGAACCTCCTATACC GTGAGCCCAGCCTCAAAG TGTCGGGGAGTAGACTCAGG CACTTGTCCCAGGCTTGG TCCAATTCCAAGTTCCACTAGC CCTCCAACCTTCAGTTCAGC TCAGGATGACCTAACCACCC CTCTTGAGGCAACCTGCTG
TCTATGTGCCTTGGAGTGAGG CCGGGGGATTAAACAAAAAG
TCACTTCCCACCCCTTACAC TCAGTACAGATTTGTTTCCCCC TCCCTGTCACTGTAACTTGCC GACCCTGTAGCATTAGGACTGG CTCACCACCTCCTCCTTCAC CATACTCCAAAATTTCTATGTTGA TAGGTCCATCCATGTTTCTGC GATCAAAGTCCCTTACTCCGG GATCCTGCATTGCCAAGG ATTCTTGATGTTGGTACATGGTG GGTCCTCCTCAGAAAGTCCC GGTCGATGATGCTCACACC CCCCACCTCACACATACATG AGATGCGGCTCCAATCTG
TGGCTTGGGAACTTCCATAC GAAGCAGAGTTGGCTTACAGTG
TGCAGCTCTGATTGCGTC AAAAACAAAAAAGACCCCTGTG GTCTGTGCCTATGCATGCAC GTTCTTGCGGTGTTTGGC ACTCCTAGCCCAGGAGCTTC ACTGACATCCTCCCAGCCTA TCTGTCTTTGTTTCTGTCTGTCTT ATGTTGAGCTCTTAATTTTATACA CACAGGGGGAACACCTTAAT GAAAACTCTCTTAGTTTCTTTATGCAA GAAAACTCTCTTAGTTTCTTTATGCAA GGTGGTTTTGGCTCCAATTG CGGCACTGGTAACTCCAATT ATGTATCCGGGTCCCTTTTC TGATGCTCTTGTTTTCTGTATGTG AAGAAAATATCTCAAGCCAAGGA CATATGCTGTGGGAATGGC GCCTATTCAGAAATGTTCCTGG TTGGTAATTTCCGTATGCTGC GATCAAGGAAATAACACTGCTGT
58 58 58 62 55 60 58 58 55
58 58
60 62 60 60 60 58 58 58
58 58
60 55 60 60 58 60 60 62
60 60
62 62 60 65 65 60 60 58 58 58 62 60 60 60
60 65
60 58 62 60 62 62
60 57
58 58 60 60 58 58
60 58
62 58 60 55
183 171 166 126 104 96 150 122 132 0 121 95 164 150 115 93 135 105
125 0 164 150
167 147 255 203 115 93 118 97 159 133 145 137 117 93 171 153 159 137 103 95 107 93 148 144 116 114
188 150 97 91
215 133 124 120 199 161 175 144 206 168 152 126 166 150 189 187 152 126 107 89 147 117 135 117
314 224 182 142
150 142 170 122 139 105 143 131 194 0 181 165 107 101 166 150 178 157 188 170 160 144
135 119 173 144
178 152 141 117 155 127 146 134 192 180
212 200 158 130
132 124 114 0 142 130 85 81
199 174 147 127 165 151
3 9 4
9 5
5 5 6 7 6 4 5 9 4 6 9 3 4 3
5 4
6
2 3
4 7
11 3 8
8 7
6 5 2 6 5 5 3 7 8 4 9 8 4 7 6 4 4
5 5
7 6 5 6
10 6 5 7 8 4 3 4 3 4 8 3 5
Markers SOXXX were produced at European laboratories with numbers SO00140073 contributed by FREDHOLM et al. (1993), numbers SOO8ZSOZOO were contributed by L. ANDERSON and colleagues (ELLERGREN et al. 1993; JOHNASSON, ELLEGREN and ANDERSON 1992). CHZ3 is from DAVIFS et al. (1992b). Primers for markers from structural genes were developed in our laboratory from GenBank sequences. Marker names beginning with Sw and Swr were developed in our laboratory.
The PCR profiles are described in the text. The values refer to the annealing temperature and the superscripts refer to the [MgC12] (millimolar) when it was not 1.5 mM.
Allele sizes were determined in relation to a sequencing ladder of M 13mp18 and should be considered approximate. The number 0 ref rs to alleles that would not amplify in some animals.
E The number of alleles (including null alleles) that were observed in this study.

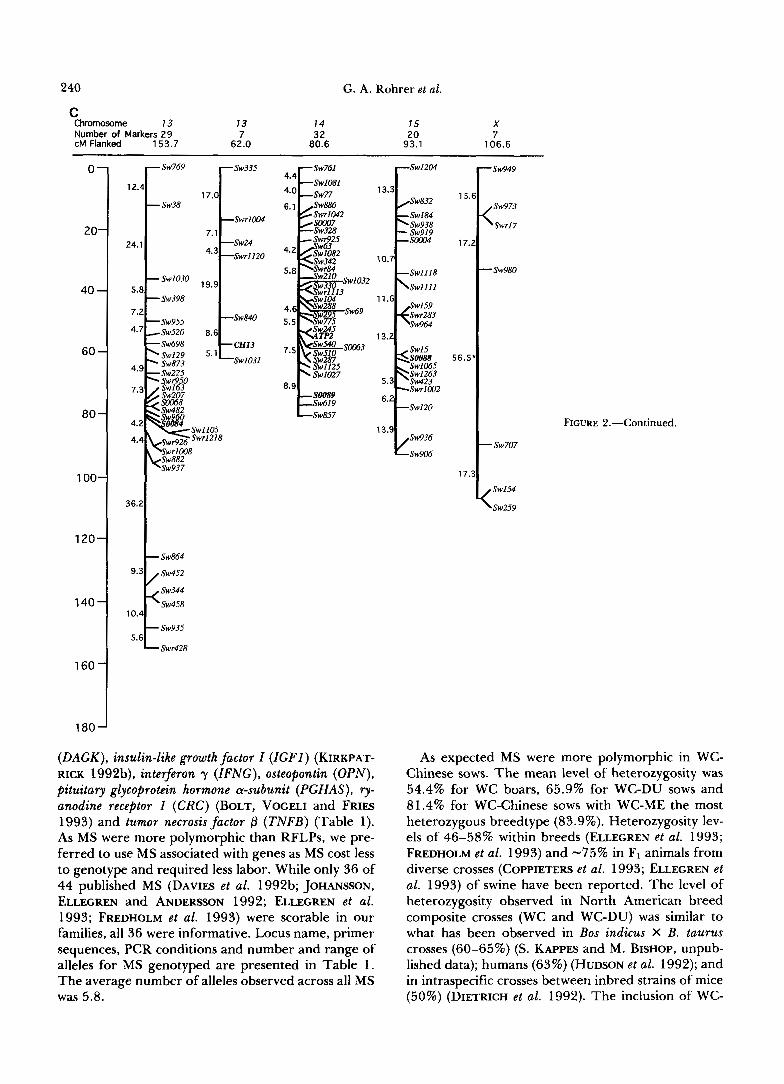
238 G. A. Rohrer et al.
A Chromosome 1 2 3 4 5 Number of Markers 26 17 29 cM Flanked 151.3 92.0 146.5 166.8 111.0
28 26
0
2(
40
60
8C
1 oc
120
140
160
180
-sw7os
\sw373
17.6
5.6 /SwIO92
"sw974
"sw803
Sw970 \SW74.5
Sw157 4.4 'sw6s 5, -Swr7M
"sw307
13.2
" S w 8 0
23.8
"sw3OI "sw78I - Sw952 "sw1I23
10.3 'pGHAs
" sow8
19.8
"sW64
"swI37
"swr485
"sw552
4.8
6.2
6.3
-sw39s
22.3
" S o o I O 5'6
x S w r 3 8 9 Sw14 ' Sw766 lo.' Sw776
&oosl Swr468
11.3 "sw1201 "sw240
9.2 - sw.57.5
"swr783 5.7
9.2 -Sw2.56
Sw2 74
17.
Sw833
19.
23.6
Sw2.51 5. soloo 4.
Sw1978
9.
4.6 4.7
Sw236 Sw271
1 6.
0.4 Sw14.2 10.
10.4
4.6
10.8 28. sw349
Sw.590
1 2.
striction enzymes (ApaI, HaeII and Mspl) (KIRKPATRICK 1992a; LARSEN and NIELSEN 1993). Apolipoprotein B (APOB) was amplified using primers 3 and 7 (in KAISER et al. 1993) and digested with HincII. Another fragment was amplified with primers 2 and 6 (in KAISER et al. 1993), digested with Hind111 and found to be monomorphic.
Genotypic data were independently scored and entered into the database by two individuals. Software was developed (D. BEHRENS, J. WRAY and G. A. ROHRER, unpublished data) to compare scores, verify data in concordance and report discrepancies. Discrepancies were either resolved by the scoring individuals or data eliminated from the analyses. All linkage computations were performed using CRIMAP 2.4 (GREEN, FALLS and CROOKS 1990) linkage analysis software on a DEC 5000/25 work station and based on sex- averaged recombination rates (except for markers exhibit- ing X-linked inheritance). The two sire and eight dam ped- igree structure (Figure 1) prompted the selection of CRI- MAP 2.4 over available software packages for linkage anal-
9.
(Sw489 5w480 r swr453
5.8
5w191
22.7
5w310 sw1.52
sw12oo Swr426
5w986
sw99.5
-sw 1089 SwrI I I2
5w378 "Sw286 "sw.512 -Sw270 14.7 eE "Sw.589 5w%7
FIGURE 2.-Porcine genetic link- age map. Individual chromosomes are represented by vertical lines. The chromosome number, where known, or linkage group is indicated above together with the number of markers and length in sex-averaged Kosambi centimorgans. The interval between markers is shown on the left side when 4 cM or greater. One pair of linked markers (Swr68/Sw983) are not shown as no recombinants were observed. *The 56.5-cM interval on the X chromosome was not signifi- cant.
P M 7 ,Sw818 -sw44.5
'5w58 --soo97
"Sw8.56
yses. After preliminary alignment, the CHROMPIC option in CRIMAP along with software developed on site were used to identify unlikely double crossovers (those that occur within a 40-cM region) present in the data. Data contribut- ing to these double crossovers were reanalyzed to determine their validity by rerunning the PCR reactions and blindly scoring the results. The number of errors remaining in these data should be negligible based on the error checking system implemented.
RESULTS
Genotyping: A two generation reference popula- tion with eight full-sib families and 94 progeny was developed with two WC boars and eight F1 sows. Two F1 sows were WC-DU and six F1 females (one WC-FE, two WC-MI and three WC-ME) were produced by crossing boars from one of three Chinese breeds: FE,

Genetic Map of the Pig
B Chmmcscme 6 7 8 9 12 Number of Markers 30 20 32 15 11
cM Flanked 120.8 96.9 127.7 1 1 3.8 93.2
239
0- "sw824
11.4 "swr726
20-
40 -
- sw122 "sw1129
60 - -< Swl93 \Sw133
sw782 ' CRC 0'3 GPI
Sw855
80 - 0.0
4'4 "sw492 "sw1067
8.1 " s w 8 7
100- 22.9
, Sw1038
120- 2 S W l l ~ Sw1057
140
1 6 0 1
1 80
"so064
26.0
4S -PD6
24.9
+I083 "Sw632
4.3 -Sw252
7.4 Sw147 d Sw263 ,sw304 "sw3s2
"..OS9
sw211 33,
Swr7SO
g
9 . 2 L OPN
ME or MI with WC sows. The two DU-WC sows had litters of 15 and eight piglets; one FE-WC sow had a litter of 12; three ME-WC had litters of 14, 13 and 5; and two MI-WC sows had litters of 14 and 13. One boar sired seven of the eight litters with 81 progeny, while the other boar sired one litter (dam was MI-WC) of 13 piglets (Figure 1). The cross between North American and Chinese pigs was an attempt to design the most genetically and phenotypically diverse intraspecific cross possible in swine. The genetic di- versity present in this population will increase type I marker polymorphism and facilitate development of comparative maps.
Our strategy to screen recombinant M13 swine genomic clones for GT:CA dinucleotide MS resulted in 0.24% of all recombinant M13 clones yielding
-sw749
- Swl74
"sw989
"Sw866 cSwr915
-sw944
<pg; :sw539 WW779 - Sw5lI "5w54
- SW940
Swr250
"sw911
" G H
0.5 "sw957
10.9 "so083
21.2
"sw874
9.1 "Smo
12.2
"sw467
0.0 "5w60
10.7
4.9 "swrlO21
-sw6os
FIGURE 2.-Continued.
primer sequences. Eighty-five percent of all primer pairs amplified locus specific products. Only 3% (1 1/ 349) of MS developed from our M13 libraries were monomorphic in our families. Forty-nine of the 338 MS markers (14%) developed in our laboratory were adjacent to a short repetitive element (SINGER, PARENT and EHRLICH 1987) (designated Swr; Table 1). These markers were similarly informative.
We were unable to amplify specific products from three loci (apolipoprotein A I , follistatin and inhibin B (bksubunit) of 14 MS adjacent to, or within, porcine coding sequences obtained by screening the GenBank and EMBL databases. Three loci were monomorphic (interleukin la, growth hormone and apolipoprotein C3) leaving eight (73%) informative loci for analyses: cal- cium activated ATPase (ATP2) , diacylglycerol kinase
240 G. A. Rohrer et al.
C Chromosome 13 73 14 15 X Number of Markers 29
62.0 7 32 20 7
cM Flanked 153.7 80.6 93.1 106.6
0-
20-
40 -
60 -
80 -
100-
120-
140-
160-
180-
- Sw769 sw335
12.4 17.0 - Sw38
Swrloo4
7.1 24.1
- Sw1030 5.0 19.9 - Sw398
7.2
4.7 ,Sw520 0.6
4.9 Sw873 Sw129 5.1
Sw1031 ” S w 2 2 5 . Sur950
Sw1125 Sw287
Sw1027
5w12w
13.3 5w832
5w184 5w938 5w919
10.7
S w l l l l
13.2
Sw1065 Sw1263
Swr1002
5w120 6.2
13.9 5w936
5w906
Sw864
sw344
Sw458 10.4
5.6 sw935
Swr428
( D A M ) , insulin-like growth factor Z (ZGFI) (KIRKPAT- RICK 1992b), interferon y (IFNG), osteopontin (OPN), pituitary glycoprotein hormone a-subunit (PGHAS), 9- anodine receptor 1 (CRC) (BOLT, VOCELI and FRIES 1993) and tumor necrosis factor p (TNFB) (Table 1). As MS were more polymorphic than RFLPs, we pre- ferred to use MS associated with genes as MS cost less to genotype and required less labor. While only 36 of 44 published MS (DAVIES et al. 1992b; JOHANSSON, ELLEGREN and ANDERSON 1992; ELLECREN et al. 1993; FREDHOLM et al. 1993) were scorable in our families, all 36 were informative. Locus name, primer sequences, PCR conditions and number and range of alleles for MS genotyped are presented in Table 1 . The average number of alleles observed across all MS was 5.8.
1 5
17
56.
17
-sw949
,sw973
~ w r ~ 7
- Sw980
FIGURE 2.-Continued.
- Sw707
, Sw154
‘Sw259
As expected MS were more polymorphic in WC- Chinese sows. The mean level of heterozygosity was 54.4% for WC boars, 65.9% for WC-DU sows and 81.4% for WC-Chinese sows with WC-ME the most heterozygous breedtype (83.9%). Heterozygosity lev- els of 46-58% within breeds (ELLEGREN et al. 1993; FREDHOLM et al. 1993) and -75% in F1 animals from diverse crosses (COPPIETERS et al. 1993; ELLECREN et al. 1993) of swine have been reported. The level of heterozygosity observed in North American breed composite crosses (WC and WC-DU) was similar to what has been observed in Bos indicus X B. taurus crosses (60-65%) (S. KAPPES and M. BISHOP, unpub- lished data); humans (63%) (HUDSON et al. 1992); and in intraspecific crosses between inbred strains of mice (50%) (DIETRICH et al. 1992). The inclusion of WC-

Genetic Map of the Pig
D Linkage group J M U R V Number of Markers 1 2 16 12 3 3 cM Flanked 65.8 104.3 50.3 18.6 7.3
24 1
0 -
20.
40 -
60.
80,
100.
120-
Sw813
sw742 5.1
17.1
sw419
13.1
Sw382
sw557
Sw262 6.2
"sw830 4'3
9.2 "Swr136
"sw249 4 ~ 7 6 7
4.0 "sw443
19.4
-97
15.7
-173
8.1 "SO070
7.9 Swr334
/ Swla41 S W ~ I S B - ~wr198
18.4
s m 9
Swr811 sw435
8.7
9.7 Sw151
H T 2
swr3oB
swr345
ll.o[m2 l o . l [
Sw787 sw764
Chinese sows accelerated the development of the map as they were nearly as informative as interspecific hybrid mice (90%) (DIETRICH et al. 1992).
Only seven RFLPs with previously reported, readily scorable polymorphisms and chromosomally assigned were mapped. All RFLPs developed in our laboratory (analysis of the SLA cluster will be reported elsewhere) for class I ( P D 6 ) (EHRLICH et al. 1987) and class I1 DQA (HIRSCH et al. 1990) and DRB (PRATT et al. 1990) major histocompatibility loci were informative. Only one band per allele was observed for class I PD6 (EHRLICH et al. 1987) and class I1 DQA (HIRSCH et al. 1990) and no more than two bands per allele were found for class I1 DRB (PRATT et al. 1990). Restricting probes to regions of genes with low levels of interlocus homology eliminated multilocus hybridization and en- sured the observed genetic variability was confined to a single locus. Two alleles of CASK (LEVINE et al. 1992) also segregated in the population. Glucose phos- phate isomerase (GPI) was the most informative RFLP (nine alleles present) as the probe sequence is adjacent to an intronic variable number tandem repeat (VNTR) (DAVIES et al. 1992a).
Two additional RFLPs were characterized in re- striction endonuclease-digested PCR-amplified prod- ucts. Three restriction enzymes were used for G H to maximize the number of informative meioses for this
FIGURE 2.-Continued.
locus (KIRKPATRICK 1992a; LARSEN and NIELSEN 1993). When analyzed as a single locus for the linkage study, no recombinants were detected within the hap- lotype. Two alleles for APOB were detected in our reference population with HincII (KAISER et al. 1993).
Linkage analyses: Markers were placed into puta- tive linkage groups based on two-point linkage esti- mates (LOD > 3.0). Each set of markers was then aligned based on the linear order that maximized the log likelihood (LOD) from multiple-point linkage analyses. All intervals greater than 20 cM were tested for significance by comparing the LOD of the initial analysis (LOD") with the LOD holding the recombi- nation rate of the large interval to 0.5 LOD DO.^). Linkage groups were separated by multipoint analysis using CRIMAP 2.4 if the difference (LODM - LO DO.^) was less than 3.0, thus eliminating spurious two-point linkages. The average number of coinformative meioses observed between all pairs of markers was 73 (range 0-188). As only 60 coinformative meioses are required to detect linkage between markers 20 cM apart with a power of 90% (J. KEELE, unpublished data), most intervals between markers flanking 20 cM or less should be detected. The overall power of detecting linkage was reduced because only two gen- erations of animals were available and without grand- parental data the phase of linked markers had to be computed.

242 G . A. Rohrer et al.
Linkage analyses identified 23 autosomal and one X chromosomal linkage groups. Idiograms of each linkage group are presented in Figure 2 and distances between markers are proportional to the sex-averaged rate of recombination. One pair of linked markers (Swr68/Sw983) is not presented in Figure 2 as no recombinants were observed. Markers are aligned in the order that maximized the LOD. However, marker order within 5-cM intervals should be considered ten- tative until additional linkage has been established. Linkage group orientation with respect to the cen- tromere and telomere was arbitrary as polymorphic markers physically assigned to chromosomes are cur- rently minimal in the porcine map. The 383 linked markers covered 1997 cM. The average distance be- tween adjacent markers ( n = 362 intervals) was 5.5 cM. Sixty-three percent of all intervals were less than or equal to 5.0 cM while only 3.6% of the intervals were greater than 20.0 cM. Individual linkage groups had between two and 32 markers (mean 16) and spanned from 0 to 167 cM (mean 79.5 cM). An additional seven MS were unlinked in the final anal- yses (Swll , Swr67, Sw413, Sw491, Sw943, SO061 and S0099).
Twenty-seven previously assigned polymorphic loci (20 MS and seven RFLP; Table 2) were incorporated into linkage groups anchored to 13 autosomal chro- mosomes (Figure 2). Five anchor loci are located on chromosome 7 and four on chromosome 6 with the remaining 11 chromosomes having between one and three anchors each. Kappa-casein was assigned to chro- mosome 8 based on the close linkage of the four casein genes (asI-casein, as2-casein, P- casein and K-casein) in cattle (FERRETTI, LEONE and SCARAMELLA 1990; THREADGILL and WOMACK 1990) and sheep (LEVEZIEL et al. 1991) and the physical assignment of as]-, as2- and P-casein to porcine chromosome 8 (ARCHIBALD et al. 1992). Fourteen linkage groups contained anchor loci. We assigned linkage groups to chromosomes when at least one member of the group had been directly or indirectly assigned to a chromo- some (Table 2). Two linkage groups were assigned to chromosome 13. All five anchor loci for chromosome 7 were members of the same linkage group and all four anchors on chromosome 6 were within one link- age group. The same was true for anchors assigned to chromosome 4 , 8 and 12. No linkage group could be established for chromosomes 10, 1 1 , 16, 17 and 18. Informative markers for chromosomes 1 0 , l l and 16 have recently been developed but have yet to be published (B. CHOWDHARY, personal communication). Chromosomes 17 and 18 remain bereft of markers (ANDERSSON et al. 1993). Four randomly generated markers (Sw154, Sw259, Sw707 and Sw980) exhibited X-linked inheritance in every animal in our reference population and were assumed to be located on the X
chromosome. One of these X-linked markers (Sw980) was not significantly linked to the other three (Figure 2). However, Sw980 was linked to three other markers exhibiting autosomal inheritance. Presumably, Swrl7, Sw949 and Sw973 are located on the pseudoautosomal region of the X and Y chromosomes. We were unable to assign nine linkage groups containing 54 MS markers to chromosomes. As additional markers for chromosomes 10, 1 1 , 16-18 are developed and re- ported, it is likely that the larger unassigned linkage groups (J, M and U) will be placed on some of these chromosomes.
Our results provide the first assignment of four structural genes and 13 published MS (JOHANSSON, ELLECREN and ANDERSON 1992; ELLECREN et al. 1993; FREDHOLM et al. 1993) to autosomal chromo- somes in the porcine genome. Diacylglycerol kinase (DAGK) and IGFl are assigned to chromosome 5 , PGHAS is assigned to chromosome 1 and OPN to chromosome 8. Marker SO008 is assigned to chromo- some 1 , SO010 to chromosome 2, markers S0002, SO094 and SO100 to chromosome 3, SO001 and SO097 to chromosome 4 , SO005 and SO092 to chromosome 5 , SO066 to chromosome 7 , SO007 and SO063 to chromosome 14, and SO004 to chromosome 15. We were also able to assign four previously published linkage groups to chromosomes. The linkage group of SO007 and SO072 (FREDHOLM et al. 1993) (also reported as U6: ANDERSON et al. 1993) is assigned to chromosome 14. Linkage groups X, XI and XI1 (U9) (ANDERSON et al. 1993) established in ELLECREN et al. (1993) are assigned to chromosomes 4 , 5 and 3, respectively.
Coverage of the genome: While the exact size of the porcine genome remains unknown, the presence of only seven unlinked markers in our analyses initially suggests that the 1997 cM reported here covers a majority of the genome. Our results also indicate that there are at least 20 cM between groups that are currently unlinked but located on the same chromo- some, e.g., chromosome 13 had two linkage groups detected. There were five more linkage groups than chromosomes identified in this study (24 linkage groups; n = 19). As the unlinked MS are located on chromosomes for which we have other markers, the porcine genome is clearly greater than the 1997 cM reported here; however, if microsatellites are ran- domly distributed then our data suggest the porcine genome is approximately 2300 cM u. W. KEELE, unpublished data). Based on length of metaphase chromosomes (ANDERSON et al. 1993), our linkage groups for chromosomes 2, 3, 5 , 6 , 7 , 14 , 15 and X are not complete. Large gaps are also present in linkage groups, particularly on chromosomes 1 , 7 , 9 and 13. Marker distribution in the present study was similar to that expected if MS are distributed uni-

Genetic Map of the Pig 243
TABLE 2
References and chromosomal assignments for anchor loci
Type of Type of Locus name marker Chromosome assignment Reference
SO082 MS 1 LG ELLECREN et al. (1 993) SO091 MS 2 LG ELLECREN et al. (1993) APOB RFLP 3 IS SARMIENTO and KADAVIL ( 1993)
S0067, SO073 MS 4 LG FREDHOLM et al. (1993) IFNG MS 5 IS JOHANSSON et al. (1993) S0003, SO087 MS 6 LC FREDHOLM et al. (1992)
ELLECREN et al. (1 993) RYR MS 6 IS HARBITZ et al. (1990) GPl RFLP 6 IS DAVIES et al. (1 988)
SOLINAS et al. (1992a)
CHOWDHARY et al. (1989) YERLE et al. (1 990)
SO064 MS 7 LC FREDHOLM et al. (1993) TFNB MS 7 IS CHARDON et al. ( 199 1)
SOLINAS et al. (1 992b) PD6, DQA, DRB RFLP 7 IS GEFFROTIN et al. (1 984)
RABIN et al. (1 985) ECHARD et al. (1986)
S0069, SO086 MS 8 LC FREDHOLM et al. (1 993) ELLECREN et al. (1 993)
CASK RFLP 8 SA See text SO081 MS 9 LG ELLECREN et al. (1 993) S0083, SO090 MS 12 LC ELLECREN et al. (1993) GH RFLP 12 IS THOMSEN et al. (1 990)
SO084 MS 13 LC ELLECREN et al. (1 993) CH13 MS 13 CS DAVIES et al. (1992b) S0089, ATP2 MS 14 LG ELLECREN et al. ( 1 993) SO088 MS 15 LG ELLECREN et al. (1993)
Assignment abbreviations are as follows: LC, linkage analysis; IS, in situ hybridization; CS, chromosomal specific library.
YERLE et al. (1 993)
formly and selected randomly from the genome (WIN- TERO, FREDHOLM and THOMSEN 1992; DIETRICH el al. 1992). As more informative MS derived from cosmid or lambda genomic clones are placed on the linkage and physical maps, MS distribution as well as genomic coverage can be more accurately assessed.
DISCUSSION
We have integrated 334 newly identified MS with 34 MS previously reported, eight MS and seven RFLP associated with type I markers into a skeletal genetic linkage map of the porcine genome. Although com- parisons between current linkage results and those previously published are difficult due to the absence of blood typing or serum protein analyses in our study, we were able to compare six intervals in five linkage groups (chromosomes 5, 6, 7, 12 and 14) where iden- tical markers were used (ELLECREN et al. 1993). Six interval distances were comparable including the dis- tance between the CRC (RYRI) or malignant hyper- thermia locus and SO087 (chromosome 6 ) (ELLEGREN et al. 1993). In five additional linkage groups interval distance between identical markers was significantly greater in the present study when compared with that
reported by FREDHOLM et al. (1993) in a smaller pedigree. The accuracy of marker interval and order will be enhanced as similar sets of markers including erythrocyte antigens and serum proteins are screened across several reference populations.
As the porcine physical map develops, new assign- ments of genes to chromosomal locations will improve the comparative map between the human, mouse and swine genomes. Our strategy to reduce the random- ness of saturating the porcine genome with type I1 markers is to place more type I markers from estab- lished syntenic groups (O’BRIEN et al. 1993) in our linkage map and assign porcine cosmid clones contain- ing informative MS by in si tu hybridization through collaborative efforts. As MS are developed that an- chor centromeric and telomeric regions, additional randomly generated MS can be rapidly included into the linkage map, expanding genomic coverage and marker density. A combination of approaches by groups mapping the swine genome should rapidly place a significant number of linked markers on the map. Continued searching of databases will provide type 11 markers, close to or within type I loci. This overall strategy should provide a saturated linkage

244 G. A. Rohrer et al.
map while yielding a sufficient number of dually mapped loci to accurately assess genomic coverage and chromosomal orientation of linkage groups (FREDHOLM et al. 1993).
In summary, the number of MS markers linked in the present swine genetic map will allow us and other investigators to initiate a concerted effort to identify markers which can be used in MAS and provide the frame work for identifying gene(s) that contribute to production efficiency.
The authors wish to acknowledge the contribution of D. B. LASTER whose vision and energy made this effort possible. Thanks to J. WRAY, D. BEHRENS, M. BISHOP, S. KAPPES, R. STONE and S. SUNDEN for helpful discussions, K. SIMMERMAN, R. GODTEL, C. MAHAFFEY and R. SAMSON for technical assistance, S. KLUVER for manuscript preparation, and the MARC swine crew for outstanding husbandry. Special thanks to M. FREDHOLM and L. ANDERSON for providing primer pairs prior to publication.
Mention of a trade name, proprietary product or specific equip- ment does not constitute a guarantee or warranty by the USDA and does not imply approval to the exclusion of other products that may be suitable.
LITERATURE CITED
ANDERSSON, L., A. L. ARCHIBALD, J. GELLIN and L. B. SCHOOK, 1993 1st pig gene mapping workshop (PGMl), August 7, 1992, Interlaken, Switzerland. Anim. Genet. 2 4 205-216.
ANSARI, H. A,, P. D. PEARCE and D. W. MAHER, 1993 Regional assignment of anchored reference loci to sheep chromosomes. Proceedings 8th North American Colloquium on Domestic Animal Cytogenetics and Gene Mapping 8: 59-6 1.
ARCHIBALD, A. L., J. F. BROWN, C. S. HALEY, M. FREDHOLM, A. K. WINTERO, et al., 1992 Linkage mapping in the domestic pig (Sus scrofa). Anim. Genet. 23: 88.
BOLT, R., P. V ~ E L I and R. FRIES, 1993 A polymorphic micro- satellite at the RYRZ locus in swine. Anim. Genet. 24: 72.
CHARDON, P., M. NUNES, F. DEZEURE, D. ANDRES-CARA and M. VAIMAN, 199 1 Mapping the genetic organization of the TNF genes in the swine MHC. Immunogenetics 3 4 257-260.
CHOWDHARY, B. P., I . HARBITZ, A. MAKINEN, W. DAVIES and I. GUSTAVSSON, 1989 Localization of the glucose phosphate iso- merase gene to the p12-q21 segment of chromosome 6 in pig by in situ hybridization. Hereditas 111: 73-78.
COPPIETERS, W., A. VAN DE WEGHE, L. PEELMAN, A. DEPICKER, A. VAN ZEVEREN and Y. BOUQUET, 1993 Characterization of porcine polymorphic microsatellite loci. Anim. Genet. 2 4
DAVIES, W., I. HARBITZ, R. FRIES, G. STRANZINGER and J. HAUGE, 1988 Porcine malignant hyperthermia carrier detection and chromosomal assignment using a linked probe. Anim. Genet.
DAVIES, W., S. KRAN, T . KRISTENSEN and 1. HARBITZ, 1992a Characterization of a porcine variable number tandem repeat sequence specific for the glucose phosphate isomerase locus. Anim. Genet. 23: 437-442.
DAVIES, W., B. HOYHEIM, B. CHAPUT, G . FRELAT and A. KEISERUD, 199% Rapid isolation of porcine chromosome 13 specific microsatellites. Anim. Genet. 23: 90-91.
DIETRICH, W., H. KATZ, S. E. LINCOLN, H. SHIN, J. FRIEDMAN, et al . , 1992 A genetic map of the mouse suitable for typing intraspecific crosses. Genetics 131: 423-447.
ECHARD, G., M. YERLE, J. GELLIN, M. DALENS and M. GILLOIS, 1986 Assignment of the major histocompatibility complex to the p14-q12 region of chromosome 7 in the pig (Sus scrofa
163-170.
1 9 203-212.
domestica L . ) by in situ hybridization. Cytogenet. Cell Genet.
EHRLICH, R., R. LIFSHITZ, M. D. PESCOVITZ, S. RUDIKOFF and D. S. SINGER, 1987 Tissue specific expression and structure of a divergent member of a class I MHC gene family. J. Immunol. 139: 593-602.
ELLEGREN, H., M. JOHANSSON, B. P. CHOWDHARY, S. MARKLUND, D. RUYTER, et a l . , 1993 Assignment of 20 microsatellite mark- ers to the porcine linkage map. Genomics 16: 431-439.
FERRETTI, L., P. LEONE and V. SGARAMELLA, 1990 Long range restriction analysis of the bovine casein genes. Nucleic Acids Res. 18: 6829-6833.
FOWLER, T., 1992 Pigmeat: situation and outlook. Pig News and Information 13: 87N-89N.
FREDHOLM, M., A. K. WINTERO, K. CHRISTENSEN, B. KRISTENSEN, P. B. NIELSEN, et al . , 1993 Characterization of 24 porcine (dA-dC),-(dT-dG), microsatellites: genotyping of unrelated an- imals from four breeds and linkage studies. Mamm. Genome
FRIES, R., 1993 Mapping the bovine genome: methodological aspects and strategy. Anim. Genet. 2 4 11 1-1 16.
FRIES, R., A. EGCEN and J. E. WOMACK, 1993 The bovine genome map. Mamm. Genome 4: 405-428.
GEFFROTIN, C., P. POPESCU, E. CRIBIU, J. BOSCHER, C. RENARD, et al., 1984 Assignment of MHC in swine to chromosome 7 by in situ hybridization and serological typing. Ann. Genet. 27:
GEORGES, M., R. DRINKWATER, T . KING, A. MISHRA, S. S. MOORE, et al., 1993a Microsatellite mapping of a gene affecting horn development in Bos Taurus. Nat. Genet. 4: 206-210.
GEORGES, M., A. B. DIETZ, A. MISHRA, D. NIELSEN, L. S. SARGEANT, et al., 1993b Microsatellite mapping of the gene causing Weaver disease in cattle will allow the study of an associated quantitative trait locus. Proc. Natl. Acad. Sci. 9 0 1058-1062.
GREEN, P., K. FALLS and S. CROOKS, 1990 Documentation for CRI- MAP, version 2.4. Washington University School of Medicine, St. Louis.
HARBITZ, I . , B. P. CHOWDHARY, P. D. THOMSEN, W. DAVIES, U. KAUFMANN, et al., 1990 Assignment of the porcine calcium release channel gene, a candidate for the malignant hyperther- mia locus to the 6plI-q21 segment of chromosome 6. Ge- nomics 8: 243-248.
HIRSCH, F., D. H. SACHS, K. GUSTAFSSON, K. PRATT, S. GERMANA, et al., 1990 Class 11 genes of miniature swine 111. Character- ization of an expressed pig class 11 gene homologous to HLA- DQA. Immunogenetics 31: 52-56.
HODSON, C. J., 1985 The pig as a model for studying kidney disease in man, pp. 1691-1709 in Swine in Biomedical Research, edited by M. C. TUMBELSON. Plenum Publishing, New York.
HUDSON, T. J., M. ENGELSTEIN, M. K. LEE, E. C. Ho, M. J. RUBENFIELD, et al., 1992 Isolation and chromosomal assign- ment of 100 highly informative human simple sequence repeat polymorphisms. Genomics 13: 622-629.
JOHANSSON, M., H. ELLEGREN and L. ANDERSON, 1992 Cloning and characterization of highly polymorphic porcine microsa- tellites. J. Hered. 83: 196-198.
JOHANSSON, M., B. CHOWDHARY, F. Gu, H. ELLEGREN, 1. GUSTAVS- SON, et al., 1993 Genetic analysis of the gene for porcine submaxillary gland mucin: physical assignment of the MUC and interferon y genes to chromosome 5. J. Hered. 84: 259- 262.
KAISER, M. E., D. N. NEVIN, S. L. STURLEY, C. PURTELL and A. D. ATTIE, 1993 Determination of pig apolipoprottin B genotype by gene amplification and restriction fragment length poly- morphism analysis. Anim. Genet. 2 4 117-120.
KIRKPATRICK, B. W., 1992a Hue11 and MspI polymorphisms are detected in the second intron of the porcine growth hormone gene. Anim. Genet. 23: 180-181.
KIRKPATRICK, B. W., 1992b Identification of a conserved micro-
41: 126-128.
4: 187-192.
213-219.

Genetic Map of the Pig 245
satellite site in the porcine and bovine insulin-likegrowth factor- 1 gene 5’ flank. Anim. Genet. 23: 543-548.
LARSEN, N. J., and V. H. NIELSEN, 1993 ApaI and CfoI polymor- phisms in the porcine growth hormone gene. Anim. Genet. 2 4 71.
LEVEZIEL, H., L. METENIER, G. GUERIN, P. CULLEN, C. PROVOT, et a l . , 199 1 Restriction fragment length polymorphism of ovine casein genes: close linkage between the as,-, as2-, p- and K-casein loci. Anim. Genet. 22: 1-10.
LEVINE, W. B., L. J. ALEXANDER, G. E. HOGANSON and C. W. BEATTIE, 1992 Cloning and sequencing of the porcine K-casein cDNA. Anim. Genet. 23: 361-363.
LITT, M., and J. A. LUTY, 1989 A hypervariable microsatellite revealed by in vitro amplification of a dinucleotide repeat within the cardiac muscle actin gene. Am. J. Hum. Genet. 4 4
LUONCO, C., K. A. COULD, L. Su, K. W. KINZLER, B. VOGELSTEIN, et a l . , 1993 Mapping of multiple intestinal neoplasia (Min) to proximal chromosome 18 of the mouse. Genomics 1 5 3-8.
MERSMANN, H. J., W. G. POND and J. T . YEN, 1982 Plasma glucose, insulin and lipids during growth of genetically lean and obese swine. Growth 4 6 189-198.
O’BRIEN, S. J., J. E. WOMACK, L. A. LYONS, K. J. MOORE, N. A. JENKINS, et a l . , 1993 Anchor reference loci for comparative genome mapping in mammals. Nat. Genet. 3: 103-1 12.
PRATT, K., D. H. SACHS, S. GERMANA, M. EL-GAMIL, F. HIRSCH, et a l . , 1990 Class I1 genes of miniature swine 11. Molecular identification and characterization of B(@) genes from the SLA haplotype. Immunogenetics 31: 1-6.
RABIN, M., R. FRIES, D. SINGER and F. H. RUDDLE, 1985 Assignment of the porcine major histocompatibility complex to chromosome 7 by in situ hybridization. Cytogenet. Cell Genet. 39: 206-209.
SAMBROOK, J., E. F. FRITSCH and T. MANIATIS, 1989 Molecular Cloning: A Laboratory Manual, Ed. 2. Cold Spring Harbor Laboratory, Cold Spring Harbor, N.Y.
SANCER, F., S. NICKLEN and A. R. COULSON, 1977 DNA sequenc- ing with chain-terminating inhibitors. Proc. Natl. Acad. Sci.
SARMIENTO, U. M., and K. KADAVIL, 1993 Mapping of the porcine apolipoprotein B (APOB) gene to chromosome 3 by fluorescence in situ hybridization. Mamm. Genome 4: 66-67.
397-401.
74: 5463-5467.
SINGER, D. S., L. J. PARENT and R. EHRLICH, 1987 Identification and DNA sequence of an interspersed repetitive DNA element in the genome of miniature swine. Nucleic Acids Res. 1 5 2780.
SOLINAS, S., J. HASLER-RAPACZ, N. MAEDA, J. R A P A C Z ~ ~ ~ R. FRIES, 1992a Assignment of the pig apolipoprotein B locus (APOB) to chromosome region 3q24-qter. Anim. Genet. 23: 71-75.
SOLINAS, S., U. PAULI, P. KUHNERT, E. PETERHANS and R. FRIES, 1992b Assignment of the porcine tumor necrosis factor alpha and beta genes to the chromosome region 7pl I-ql 1 by in situ hybridization. Anim. Genet. 23: 267-271.
THOMSEN, P. D., M. FREDHOLM, K. CHRISTENSEN and M. SCHWERIN, 1990 Assignment of the porcine growth hormone gene to chromosome 12. Cytogenet. Cell Genet. 54: 92-94.
THREADGILL, D. W., and J. E. WOMACK, 1990 Genomic analysis of the major bovine milk protein genes. Nucleic Acids Res. 18: 6935-6942.
TISSOT, R. G., C. W. BEATTIE and M. S. AMOSS, JR., 1987 Inheritance of Sinclair swine cutaneous malignant mel- anoma. Cancer Res. 47: 5542-5545.
WARWICK, E. J., and J. E. LEGATES, 1979 Improving swine, p. 467 in Breeding and Improvement of Farm Animals, Ed. 7. McGraw-Hill, New York.
WEBER, J. L., and P. E. MAY, 1989 Abundant class of human DNA polymorphisms which can be typed using the polymerase chain reaction. Am. J. Hum. Genet. 44. 388-396.
WINTERO, A. K., M. FREDHOLM and P. D. THOMSEN, 1992 Variable (dG-dT). . (dC-dA), sequences in the porcine genome. Genomics 12: 281-288.
WOMACK, J. E., 1987 Comparative genome mapping: A valuable new tool for mammalian developmental studies. Dev. Genet.
WOMACK, J. E., and Y. D. MOLL, 1986 A gene map of the cow: conservation of linkage with mouse and man. J. Hered. 77:
YERLE, M., J. GELLIN, M. DALENS and 0. GALLMAN, 1990 Localization on pig chromosome 6 of markers GPl , APOE and EN01 carried by human chromosomes 1 and 19 using in situ hybridization. Cytogenet. Cell Genet. 54: 86-91.
YERLE, M., Y. LAHBIB-MANSAIS, P. D. THOMSEN and J. GELLIN, 1993 Localization of the porcine growth hormone gene to chromosome 12p1.21Ap1.5. Anim. Genet. 24: 129-131.
8: 281-293.
2-7.
Communicating editor: N. A. JENKINS