a methodology to explore empirical evidence for a macro
TRANSCRIPT

A Methodology to Explore Empirical Evidence for a Macro
Cognitive Architecture of Expertise
by
Nathan Nagy
A thesis submitted to the Faculty of Graduate and Postdoctoral Affairs in
partial fulfillment of the requirements for the degree of
Masters of Cognitive Science
In
Cognitive Science
Carleton University
Ottawa, Ontario
© 2017, Nathan Nagy
ii
Abstract
The thesis investigated if the SGOMS architecture is the default structure for processing
expert knowledge. We compared an SGOMS model implemented in ACT-R to a model
using ACT-R alone. The task had no interruptions but the SGOMS/ACT-R model had
processes to deal with interruptions. As result, the SGOMS/ACT-R model predicted
slower processing times than the ACT-R alone model, which did not have these extra
processes. The task was a well-practiced memory game. The results showed that, although
the perceptual motor strategies of the two participants were very different, their cognitive
processing for most of the task was virtually identical and in line with the SGOMS
predictions. Overall, the results suggest that people use the SGOMS mechanisms by
default but can deliberately train themselves to avoid some SGOMS mechanisms for at
least some parts of the task.

iii
Acknowledgements
I would first like to thank my committee members for a great defense and making it
possible. I would also like to thank my supervisor for being a great wealth of knowledge
who I learned a great deal from. I am deeply grateful for the incredible support from my
lab mates: Katie Dudzik, Korey MacDougall, Fraydon Karimi, David Leibowitz, Sterling
Somers, and Matthew Martin. It has been incredible experience working with you guys
and you have made my time around the lab an enjoyable experience. Finally, I would
specially like to thank my parents and my two older sisters for helping me get through
completing my master’s degree. Your ongoing support had made this possible.

iv
Table of Contents
Abstract………………………………………………………………………………......ii
Acknowledgments……………………………………………………………………… iii
Table of Contents…………………….…………………………………………………..iv
List of Illustrations…….……………………..…………………………………………..iv
List of Appendices…………………………..…………………………………………….iv
1 Chapter: Introduction to SGOMS quantitative Validation……………………….9
1.1 Overview……………………………………………………………………......9
1.2 The Reductionist Problem………………………………………………………9
1.3 Cognitive Architecture………………………………………………………….11
1.4 Newell’s Levels and Micro and Macro Cognition………………….…..…..…..12
1.5 GOMS Components………………………………………………….…….…...13
1.6 Types of GOMS Modeling Systems………………………………….…….…..15
1.7 GOMS Literature…………………………………………………….…….…...17
1.8 Social-technical GOMS Theory……………………………………….….……..22
1.9 Mico-Strategies……………………………………………………….….……...26
1.10 The Multi Architecture Analysis……………………………………………….28
2 Chapter: Procedure…………………………………………………………………31
2.1 Procedure Overview………………………………………………………..….31
2.2 Participants……………………………………………………………..….…..31
2.3 Experimental Display………………………………………………………….32
2.4 Method……………….…………………………………………………….…32
3 Chapter: Results and Discussion……………………………………………..……40
4 Chapter: General Discussion………………………………………………………49

v
List of Tables
Table 1 Planning unit structures in Chapter 2……………………………………….…37
Table 2 Response categories descriptions in Chapter 3……………………………..…39
Table 3 Removed Trials Chapter 3…………………….….……………………….......41
Table 4 Reported Variance of Response Categories in Chapter 3……….……….….……45

vi
List of Figures
Figure 1 LPZH Unit Task in Chapter 2……………….……………….…………………33
Figure 2 CHBQ Unit Task in Chapter 2…..………………………….……………..…...34
Figure 3 PMDF Unit Task in Chapter 2……………….....………………………………35
Figure 4 Removed Trials Chapter 3………………..……………………………......…...42
Figure 5 Motor/Perceptual Adjustment in Chapter 3………...…………..………………44
Figure 6 Human and Model Results in Chapter 3………………………..………………46

vii
List of Appendixes
Appendix A. Experimental Flow Diagrams of the Task…………………………………57
Appendix B. Experimental Flow Diagrams Illustrating Response Categories…….…….58
Appendix C. Experiment Stimuli Example……………………………………..………..65

8
Chapter 1
Introduction to SGOMS Quantitative Validation
1.1 Overview
The goal of the current study is to develop an approach to gather empirical
evidence for a macro architecture (theory of real-world, complex behaviour) of general
expert cognition. In this study, the macro architecture or computational theory of expert
behaviour SGOMS (West, & Nagy, 2007) was used to build a model of an agent
performing an experimental paradigm "Alphabet Expert Task”, a task that was devised to
probe the relationship between expert micro and macro-cognition. This model was built
on top of an ACT-R (Anderson, 1996) micro-cognition architecture allowing for process
time predictions that were compared to the human participants that also performed the
experimental expert task. The proposed methodology will test assumptions of SGOMS
architectures and can bring new insight into expert cognition at the micro and macro
cognitive levels.
1.2 The Reductionist Problem
Traditional methods often try to dissect expert behaviour, or any other complex
human behaviour in natural environments, into domain-specific lab-based sub-tasks in an
effort to gain insight into the cognition of experts (Klein et al., 2003). There is doubt,
however, that this domain-specific approach can lead to a holistic explanation of
expertise in the real world (see, Klein et al., 2003, Newell, 1973).
9
‘Micro-cognition’ consists of psychological experiments where one or a few
variables are manipulated at a time. ‘Macro-cognition’ refers to complex and highly
dynamic aspects of cognition that occur in real world tasks (Klein 2003; West et al,
2013). A relatively common study of expert micro-cognition is of domain-specific tasks
of chess. Chess pieces could be set on a game board randomly or in a deterministic
configuration that could occur in an actual game. The aim of either such experimental
conditions would be to examine the memory property of categorizing pieces of
information together into a single meaningful element (Ericsson, 2006). Another
example of a lab condition would be for the expert to be shown a sensible chess piece
arrangement and measure the time it takes the expert to count unimportant pieces to
explore expert process speed (e.g. Grabner, Neubauer, & Stern, 2006). To explore the
depth of search of an expert, an additional experimental lab approach would be to
employ talk out loud protocol. After the expert moves a chess piece, they are asked to
say all the other potential moves that they were thinking of doing. These traditional lab-
based approaches are contrary to a naturalistic method for examining macro-cognition
such as unobtrusively observing chess masters playing an actual game (Ericsson, 2006).
In his famous paper You Can’t Play 20 Questions with Nature and Win (1973),
Newell observed that when researchers discovered a new phenomenon or factor of a
phenomenon, they would create a flow model to explain the result of their experiment. In
his view, these flow models were overly focused on the psychological phenomenon or
research paradigm at hand, he did not see how these multiple models could be reconciled

10
in a general model of human cognition. He questioned this approach to studying the
mind, making the argument that constantly “discovering” new phenomena without
integrating how each works with the rest of human cognition will not bring the field any
closer to completely understanding the human mind and in fact, possibly new
psychological findings just serve to add more confusion to the understanding of the
general workings of the human mind. He claims intuitively that cognitive psychology
should aim to be able to explain why a person did a certain action in a real life situation
and that the research approach currently being practiced was not bringing the field closer
to such a predictive capability. To capture the fuller dynamics of cognition, Newell
championed a methodology of computational cognitive architectures.
1.3 Cognitive Architecture
A cognitive architecture can be thought of as a framework or set of building blocks
from which to create a cognitive model or psychologically plausible artificial
intelligence. A cognitive architecture is a theory of cognition and is constructed on
assumptions based on facts discovered from psychological literature (Anderson, 2007). A
model built with a cognitive architecture is “constricted” by the assumptions of that
architecture. For instance, a visual recognition model could be constricted by built in
limits in the architecture such as holding a maximum of five items simultaneously in
visual memory or as only being able to make a judgment every 50 milliseconds.
11
The descriptive nature of models built with a cognitive architecture such as ACT-
R, SOAR, or EPIC are process-based in that they are concerned with how human
performance happens. They describe human performance directly resulting from
psychological mechanisms, processes, and knowledge structures. Computational models
constructed with cognitive architectures such as ACT-R, when given exact
environmental contexts, make exact predictions of the cognitive processes for an
agent/human to produce a behaviour. This is in contrast to "product models" such as
typical flow models of psychological theories that do not commit to mechanical
processes and only serve as a functional explanation of a given phenomenon. The
behavioural predictions that product models generate, such as response time to particular
stimuli, do not directly relate to cognitive processes (Sun, Ron, 2008/ 2009).
1.4 Newell’s Level’s and Micro and Macro-cognition Architectures
The concept of cognitive architectures is based on Newell’s system levels of
cognition. Newell's ‘system levels’ is sometimes even referred to as "The Classical
Cognitive Architecture" (Newell, 1990). He indirectly mentioned the concept in You
Can't Play 20 Question with Nature and Win but also goes into further detail in other
publications (see, Newell, 1990). The system levels ascend from the starting lowest level
with most directly physically realized biological structures to higher levels relating to
larger scale cognition such as decision making, and reasoning. The levels are hierarchical
in that each level is comprised of or directly built from the level beneath it. Accordingly,
a given level has larger components than the level beneath it. In terms of time scale,

12
higher level components will have larger durations than the components of the levels
beneath them. A major difference of Newell’s system levels versus many other theories
of lenses of analysis of cognition (e.g., Marr’s Tri level hypothesis; Marr, 1977) is that
each level is a real entity in the world. An example of this in a comparative field is how
molecules, cells, and tissues are all considered real entities in biology.
West & MacDougal (2014) noted that Newell's system levels provide a framework
for conceiving how to resolve the scaling problem between micro and macro-cognition.
Micro-cognition and macro-cognition can both be considered distinct levels. The macro
cognitive level would be located above the micro-cognition level and as such, would be
built directly from the micro cognitive level. In terms of application, this theoretical
conceptualization provides a powerful direction of research, not just in forming models
to conceptualize complex expert tasks, but also in terms of predictive ability. It suggests
that time predictions for macro-cognition of a task can be derived from the micro-
cognition making up that task. In order to make an accurate time prediction however, the
organization of micro-cognition directed by the macro-cognition level would need to be
considered.
1.5 GOMS Components
SGOMS is based on GOMS (Goals, Operators, Methods, Selection Rules; Card,
Moran, & Newell, 1983). Sections 1.4 to 1.6 review GOMS before explaining SGOMS.
There are different implementations of GOMS wherein the exact nature of GOMS
components may differ when it comes to modeling user interaction with an interface and

13
in terms of coding the model. These are the components of GOMS theory generally
understood from Card et al., (1983).
1.5.1 Goals
Goals are not usually explicitly represented in the model, however, they are
actualized through the hierarchical structure of a GOMS model. To the modeller, a goal
is a state of affairs to be achieved through the set of available methods available to the
user.
1.5.2 Operators
Operators are defined by their duration and function and are the most elementary
units of user behavior in a model. Often they are implemented by the modeller as simple
actions such as key presses or as directing gaze at text on a screen. The execution of an
operator is necessary to change any aspect of the user cognitive state or to change the
state of the environment. In the initial GOMS modeling systems, operators occur in serial
order. This allows researchers to most easily conceptualize the user interface interaction.
CPM GOMS extends this modeling approach by introducing multiple parallel tracks of
operators occurring in serial order to allow analysis of parallel actions of an agent (see,
section 1.6.2 for more detail).
1.5.3 Methods
A method represents the procedure to accomplish a goal. Methods consist of a set
of operators or in some cases just one operator. The operators in a method are usually
executed consecutively, occurring always in the same order.

14
1.5.4 Selection Rules
Selection Rules are if-then rules to direct the action of the user based on the current
environmental state.
1.5.5 Unit Tasks
Unit tasks comprise a set of methods and/or operators. Unlike methods, the
methods and operators in a unit task are not activated consecutively but by if-then rules.
Unit tasks are constructed for optimized performance of the user on a task. The
size of a unit task (amount of methods contained in it) is a balance of being large enough
for it to be efficient and not too large to overwhelm the cognitive system.
1.6 Types of GOMS Modeling Systems
1.6.1 KLM – GOMS
The Keystroke-Level Model presented by Card et al., (1983) is the simplest type of
GOMS modeling system. Each operator represents a keystroke action such as pressing
the spacebar during a typing task. Methods would be limited to a sequence of keystroke
level primitive operators. Another limitation is that operators can only occur serially and
not in parallel. This limitation allows for the researcher to simply total the execution time
of each operator to get a prediction of execution time of the task. There is also the term
CMN (Card, Moran, Newell) GOMS used in the literature which relates to using the
general modeling method of KLM GOMS but does not adhere specifically to each
operator representing a keystroke but allows the modeller to decide on the specificity of
the operators in order to fulfill different modeling purposes.

15
1.6.2 CPM – GOMS
CPM-GOMS allows parallel actions. When modeling a task with CPM-GOMS the
researchers can develop a multi-track chart with each track consisting of a serial set of
methods. The tracks can be based on cognitive assumptions of multi model processing
(auditory, motor cortex, etc.) or basic physical realities such as having a separate track to
follow each hand. Through multiple serial streams of operators and methods, CPM –
GOMS is able to represent a parallel task that is still easy for designers to conceptualize
(Gray, John, & Atwood, 1993).
1.6.3 NGOMSL
The aim of Natural GOMS Language (NGOMSL; Kieras, 1996) was to develop a
high-level language or pseudo computer code so that all GOMS models going forward
could have consistently defined semantics. The NGOMSL modeling process has a top-
down nature, in which the modeller conducts breadth-first expansion of a user's top-level
goals into methods until the methods contain only primitive operators. NGOMSL, unlike
other GOMS modeling systems, can make learning predictions of a user using a new
interface by comparing the operators of an interface the user is already an expert at using
with the methods, unit tasks, and operators of the new interface. Learning rate prediction
of NGOMSL is based on the assumption that the user would reuse unit tasks, operators,
and methods from previously learned interfaces instead of having to relearn them again
for the new interface.
16
1.7 GOMS Literature
1.7.1 Use of GOMS modeling
Since the introduction of GOMS theory by Card et al., in 1983, researchers have
found many uses for the GOMS modeling process. Card et al., (1983) advocated for
GOMS modeling to be used to evaluate the procedural efficiency of user displays, and
more importantly, to employ GOMS modeling during the actual design process.
Oyewole, S. A., & Haight, J. M. (2011) noted that users may have difficulty
navigating a website due to the complicated organization of information and complex
procedures necessary for the user to get to certain information. They demonstrated that
GOMS theory could be used to better design sites that allowed users to get to desired
information more efficiently. The authors employed the CMN GOMS model to
determine optimal paths to information on a website. CMN GOMS’ time prediction
capabilities could guide design by comparing execution time of a user getting to certain
information across different web designs.
Gray, W. D., John, B. E., and Atwood, M. E. (1993) demonstrated the value of
GOMS modeling in user interface design in a study comparing an old telephone operator
interface to a new interface. Despite the new interface seeming to be better designed by
being optimized to have fewer keystrokes and a newer "user friendly" graphical interface,
CPM-GOMS models predicted that the older interface was more efficient, a result which
was supported by human data. The value of the GOMS model in this study was its
capability to holistically capture the task and illustrated that users had less opportunity to
multi-task than they did with the old interface, which would have been completely
missed by an HCI heuristic evaluation.

17
In addition to the established uses of GOMS theory for usability analysis and to
guide the interface design process, it could be used to develop effective product help
documentation. Elkerton, J., & Palmiter, S. (1991) compared help manuals designed by
using a GOMS model compared to original help manuals developed by Apple Corp.
Participants using manuals developed using GOMS models were significantly faster at
using an interface than the participants using the original help manuals. The participants
using the GOMS model also, later on, were significantly better at memory retrieval of
how to do certain functions, whereas users of the original manual appeared to memorize
instead where they could find the instructions of how to do what they desired to
accomplish in the manual.
GOMS modeling could also be used as a methodology to explore other
psychological topics than just user interface interaction such as differences in cognition
of older and younger adults (see, Jastrzembski, & Charness, 2007) and potentially
bringing further understanding of and remediation of cognitive disabilities (Chikhaoui, &
Pigot, 2010).
GOMS modeling methodology also has the potential to bring new insight to other
fields such as religious studies. There are various visualization techniques to represent
the Islamic Qur’an atlas and history. Raja-Yusof, R., Akmal, J., and Jomhari, N. (2013)
developed KLM-GOMS models for two different visual techniques and the models were
used to make the prediction for which visualization technique would result in a user
getting to certain information the quickest. The researchers deemed precise time
predictions not necessary or relevant for their purpose. This line of research may help

18
religious scholars pick the best informational representation structure to understand the
Qur’an.
1.7.2 Additional Frameworks, Guides, and Theoretical Discussion
A popular trend amongst researchers in the GOMS literature is to develop their
own GOMS modeling notation framework and automated compilers (see John, Prevas,
Salvucci, & Koedinger, 2004; Kieras, 1996; Kieras, Wood, Abotel, & Hornof, 1995;
Kieras 1999; St. Amant, & Ritter, 2005; Christou, Ritter, & Jacob, 2012; Gil, & Kaber,
2012; Beard, Smith, & Denelsbeck, 1996; MacDougall, Martin, Nagy, & West, 2015).
Throughout the GOMS literature there have been several guides to inform a
researcher in selecting the correct GOMS modeling system (see, John, & Kieras, 1996),
aid in the understanding of GOMS theory, and how to model a task with various GOMS
modeling systems (see, John, & Kieras, 1996b; Kieras, D. E. 1996). There have been
several theoretical discussions comparing workload and cost of GOMS modeling
compared to user task analysis (see, Gray, John, & Atwood, M. E. 1993; Card at al.,
1983; Oyewole, S. A., & Haight, J. M. 2011), various cognitive attributes and
implications of GOMS theory (see, Card at al., 1983; St. Amant, & Ritter 2005; John,
Vera, & Newell, 1994; West, & Nagy, 2007; West, & Pronovost, 2009; MacDougall,
West, & Hancock, 2012), and the possibility of extending GOMS past its typical uses
(John, 1990; Kieras, D. &Santoro, 2004; West, & Nagy, 2007; MacDougall, Martin,
Nagy, & West, 2015).

19
1.7.3 GOMS Model Validation (Comparing to Human Data)
A few studies have validated GOMS models developed to make predictions of
human performance of various tasks. These studies compared a GOMS model to human
data that was collected.
A study by Gray et al., (1993) compared an old telephone operator interface to a
new interface. The CPM-GOMS models that they developed predicted that the older
interface was more efficient than the new interface. The researchers decided to compare
the predicted task time of the model to the actual task time averaged across a four month
period of telephone operators on the job. The telephone operators using the new
interface were significantly slower than operators using the older interface when it came
to any of the set tasks they did in a work shift.
Chikhaoui, and Pigot (2010) developed a GOMS model, an ACT-R model, and a
Fitt’s law cognitive model of a smart home control interface specially designed for users
with cognitive disabilities. GOMS task time prediction, albeit also the other two models,
closely matched the average time of participants to complete the tasks.
1.7.4 GOMS and Interruptions
Card & Newell (1983) also suggested the idea that GOMS modeling could be
used to model how a person would recover or restart a task from an interruption. Studies
have demonstrated that GOMS hierarchy structure is also highly capable of predicting
interruption cost and workloads.
Iqbal, Adamczyk, Zheng, & Bailey, 2005, explored the use of a GOMS model for
the best or least disruptive time to interrupt a computer user. They made separate GOMS

20
models for tasks they had participants perform such as route planning, or document
editing. At various points of the task, the participant received a signal to stop the current
task they were performing and switch to another task. Through the measure of pupil
dilation, they found "work load" to be greater when a disruption occurred within a task
boundary versus outside task boundaries. They also found that an interruption occurring
"higher" in the GOMS model (e.g. between unit tasks) resulted in lower work load than
interruptions that occurred lower in the GOMS model (e.g. between operators).
Iqal & Bailey, 2004 performed a similar study into the resumption lag of the
primary task. They, too, found interruption cost (longer resumption lag) was greater
when the interruption occurred within a task boundary than outside a task boundary and
interruption cost was greater for “lower down” task boundaries than higher task
boundaries.
1.7.5 GOMS limitations
There are studies where GOMS model predictions do not compare well to human
data. John, Vera, and Newell (1994) were interested in modeling users playing a video
game. They developed two GOMS models of two different grain sizes: one with high-
level function operators (for example jump, duck, move forward), and a second with low-
level key-stroke, or in this case, control button pressing operators. The researchers
compared the video player actions to the operators that would be activated under the
same game play conditions in both models. The human gameplay fit the high-level
GOMS model well while only fitting the low-level model about half the time. The
success of the high-level model and the lack of success of the lower level model

21
illustrates the fact that there needs to be more known about, in cognition, what is an
actual operator.
Similarly, Kieras, D, & Santoro, P. (2004) attempted to construct a GOMS model
of team work that was not successful. The researchers argued that GOMS can scale up
well to model team work but needs a working memory and interpretability constructs for
a GOMS model to better predict behavior of members in a team.
1.8 Social-technical GOMS Theory
1.8.1 Overview
West and Nagy (2007) applied GOMS theory to a naturalistic task of a Nortel
Informational technologist doing their normal daily job tasks. In this study, they found
that GOMS theory dealt poorly with or was completely incapable of handling frequent
interruptions, task switching, and re-planning in naturalistic tasks. This is not completely
unpredicted as Card, & Newell (1983) cautioned that GOMS is only meant for modeling
solitary, non-interrupted expert tasks since the design of GOMS is too brittle to handle
qualities of expert real world tasks such as interruptions and re-plaining.
The original implantation of GOMS can handle routine interruptions through the
if-then structure of Unit tasks. Consider an example of a sandwich store employee
performing their job. A routine interruption for the employee would be running out of
lettuce while in the process of making a sandwich. While in the unit task of making a
sandwich, there can be a simple if-then rule (or production) that states:

22
If there is no lettuce in bin when grabbing lettuce to place on sandwich,
go in the back fridge to get lettuce to fill lettuce bin
then continue placing items on sandwich
As the example demonstrates, a routine interruption such as running out of lettuce
is very straightforward in terms of the agent detecting the environmental condition and it
just needs to respond with one inserted simple operation to resolve the issue (i.e., get
more lettuce from the fridge in the back).
An example of a non-routine interruption would be if a customer in the store
suddenly started choking on their food while the employee was making a sandwich. For
the employee to resolve the problem, they would have to enact multiple procedures
dependent on various environmental contexts that cannot be captured simply by an "if-
then" rule.
How traditional GOMS models complexity in general is to have selection rules
with long trees implementing cascading if-then rules. Right away, one can easily imagine
how cumbersome this approach would be in attempting to model a task past a certain
level of complexity. Also inherent in how a GOMS model is devised, a selection rule
needs an exact environmental context to select a production. Real world experts can
respond to situations with arbitrarily various environmental contexts and with excessive
departures from the normal environment. It stands to reason that a selection method that
does not specifically search for a direct match of environmental context but for a
production mostly closely matching the environmental context would best suit the
dynamic nature of an expert responding to a real world task.
23
The basic GOMS modeling approach also makes the assumption of high
restriction of cognitive reuse of productions (see, NGOMSL; Kieras, 1996). What I mean
by cognitive reuse in the human mind is that memory structures in various types of
memory, such as procedural memory, are similar to functional programming. Instead of
two similar complex memory structures being completely unique from each other, both
memory structures can call the same lower level memory structure.
It is very intuitive that the employee would stop the sub task of making a
sandwich and not resume the task of sandwich making until the customer choking
problem has been resolved. Non-routine interruptions could be eloquently accounted for
computationally with GOMS general approach but would require implementation of a
more developed control structure to switch unit tasks which is not part of the current
GOMS modeling system. To resolve these issues, West & Nagy (2007) developed social-
technique components to add to GOMS theory which consisted of modifying unit tasks
and introducing a cognitive control structure called “planning units”.
In SGOMS theory, unit tasks are modified to be isolated "islands" of work
(MacDougall, West, & Hancock 2012). They are unlikely to be interrupted due to how
they are optimally sized for environmental conditions: The unit tasks for highly
demanding chaotic environments are shorter than are unit tasks for less chaotic
environments where interruptions are less likely to occur. Units executed in less chaotic,
low demand environments can afford longer unit tasks as there is a lower risk of being
interrupted (West & Pronovost, 2009).

24
Planning units are higher level control structures which consist of a set of unit tasks
contextually dependent on the environment to activate. Unit tasks are mediated between
micro and macro-cognition while planning units mediate between macro-cognition and
the environment. Planning units also differ pivotally from unit tasks in that planning units
are capable of being interrupted and switched out for a more suitable planning unit for
the current environmental conditions (West & Pronovost, 2009).
1.8.2 Further SGOMS Works and Various Research Methodologies
Somers and West (2011) developed two initial stage SGOMS models built on top
of ACT-R, one a relatively simple model of the performance of a sandwich shop worker,
and the other, a more complex model of a professional airplane flight pilot’s
performance. This research established evidence for the validation of SGOMS in two
ways. First, they were trying to see if building SGOMS models of expert tasks that
properly captures the expert performance was not overly problematic. Second, with the
commercial airplane model, they consulted professional pilots as to whether the model
they developed properly captured pilot performance.
MacDougall, Martin, Nagy, and West (2015) conducted research on expert video
game players. A descriptive annotation method was developed and used to compare
video recordings of video game experts to the developed SGOMS model. The annotation
method involved multiple descriptive real-time tracks with tracks corresponding to the
top two levels of SGOMS (Planning Units, and Unit Tasks), a track devoted to the
environmental contexts in which the planning Units and Unit tasks were occurring, and a

25
track recording any instances where the expert player did not match the model. This
annotation methodology was used to describe how well the expert player performance
fits the model but this approach also yielded additional interesting insights such as the
frequency with which planning units and unit tasks occurred, and at what points of video
game play the various planning units and unit tasks were most likely to occur.
The current research aims to develop a research methodology for the purpose of
further exploring expert macro-cognition through an empirical measure of reaction times
and error rates. In order to do so, I employ the methodology of Gray & Boehm-Davis
(2000) of micro-strategy analysis.
1.9 Micro-strategies
Newell also notes the importance of understanding "methods." In the context of
You Can’t Play 20 Questions with Nature and Win (1973), the methods were the
different strategies for using our cognitive, perceptual, and motor systems to perform
tasks in Cognitive Psychology experiments. For example, if a person needs to respond to
a stimulus by typing a two letter code, they could use one finger, one finger on each
hand, or two fingers on the same hand if the letters were close together. If they know
what code to type, they only need to see that a stimulus appears, they do not have to wait
to fully recognize it before responding. However, some people might wait to fully
register the identity of the stimulus before responding. Newell’s point was that we should
not average across different strategies as it produces meaningless numbers that do not
accurately reflect the operation of the underlying cognitive system.

26
The concept of methods has a long history in human factors (Meyer, & Kieras,
1997). However, the term "methods" is best known as a part of the GOMS modeling
system (Card, Moran, & Newell, 1883). Methods, in the GOMS modeling system, is a
way to achieve a specific sub-goal in a task. The GOMS approach assumes that
perceptual and motor actions can be described as distinct, independent operators.
Methods are comprised of operators executed in serial, or in parallel (CPM GOMS), to
accomplish a sub-goal. Methods are specific to the interface and the task. They are
learned and assumed to be reused (see, NLGOMS). For example, it is generally assumed
that people use the same method for clicking an icon each time (parameterized to suit the
particular instance by considering factors such as distance, target size, etc). Therefore, for
experienced users operating simple interfaces, there will only be a limited number of
methods that could reasonably be used (Newell, 1973; Card et al., 1983; Gray & Boehm-
Davis, 2000).
The term ‘templates’ is used to describe common ways of organizing and
interleaving operators to create CPM GOMS models (see Gray, John, & Atwood, 1993;
John, 1990, 1996). Gray et al (2000) also used the term ‘micro-strategies’ to describe
what appears to be the same thing as templates. However, as Vera et al. (2005) point out,
Gray & Boehm-Davis's (2000) work on this concept elevates it from a descriptive tool in
CPM GOMS (templates), to an actual theory of how the cognitive system interacts with
the environment (micro-strategies). Vera et al. (2005) also suggest using smaller units,
called Architectural Process Cascades, for describing these interactions.

27
1.10 The Multi Architecture Analysis
The development of cognitive architectures generally has focused on being able to
create models reproducing a vast array of psychological experimental tasks (Anderson,
2007). Little consideration has gone into cognitive architectures’ suitability for studying
macro-cognition and whether an additional theoretical framework would be needed. With
only GOMS assumption of cognitive reuse (see, NLGOMS) and the logic presented by
Newell's system levels, an instance of macro-cognition should be able to create a model
with a micro-cognition focused architecture but there may be nuances of the macro
behaviour that require an additional level of structure not currently present in cognitive
architectures. SGOMS presents a template meant to be built on top of a micro
architecture as a way to organize productions (i.e., Planning Units, Unit Tasks, Methods,
Operators) to facilitate characteristics of expert macro behaviour such as swift handling
of re-planning, interruptions, and task switching.
The SGOMS template is a product of additional theoretical assumptions of macro-
cognition not present in micro cognitive models resulting in further constrictions to the
modeling of an agent doing a particular task. With the use of an SGOMS architecture
fully integrated with an ACT-R (or any other micro cognitive architecture) model, it
should be possible to conduct a research methodology to empirically explore evidence
for or against the existence of expert macro-cognition structure. It also may be possible
to examine the relationship between the two levels of cognition. To achieve these
research aims, this research employs a methodology of devising a task to best observe
possible effects of macro architecture, develop a model of the task, and compare the
model to human performance.

28
One procedure to achieve this research objective is to compare each individual
expert performance to an SGOMS/ACT-R model consisting of the micro-strategies that
the participant employed (just as the bracketing of micro-strategies approach by Gray, &
Boehm-Davis; 2000). At certain points of a task, the SGOMS/ACT-R model will predict
the occurrence of processes required for the implementation of the macro structure in
addition to the processes required for the sub-tasks performed in isolation.
This procedure would be deployed against a complex task where variations of
micro-strategies across experts can be high. With deep consideration in task design, the
current study should only need to compare each participant’s data to one variant of an
SGOMS model, as micro-strategies are controlled for through a simple task design where
the required participant's actions are constant.
This research also looks at the two primary ways that planning units can be
organized in SGOMS. The experimental task involved participants performing a set of
planning units that were always a particular order of unit tasks, and also a set of planning
units where the unit tasks did not occur in a set order that could be anticipated by the
participant but were cued by the environment. These two types of planning units being
examined correspond to ordered planning units and situated planning units.
To get a clear understanding of the interaction of micro and macro-cognition the
experimental task was also devised so it was possible to create the macro-micro model
(i.e., SGOMS Act-r model) and a plausible pure micro-cognition model of how human
experts could potentially perform the same task. Results from both models that were
created were compared to the participants' data to clearly present the effect of the macro
architecture. The pure micro-cognition model was named the “optimal” model as it

29
predicted the fastest performance for the given task by not containing the additional
processes/productions or "overhead" of the macro-cognition model to manage planning
units and unit tasks. The optimal model is essentially "flat" in that no hieratical structure
was used to organize the micro-cognition involved in the task and in SGOMS/GOMS
terms the task was modelled as one large unit task. As such, it does not need these extra
productions to operate.
A hypothetical claim that the presented methodology attempts to examine is
whether people have a strong tendency to use macro cognitive structures to deal with
various types of complex tasks. If true, participants will perform more in line with the
SGOMS model predictions than the optimal model predictions. It may seem counter-
intuitive that expert participants will perform more in line with the predictions of the less
efficient SGOMS/Act-r model; however, the hypothesis is made based on the premise
that with only the optimal model organization of micro-cognition, the task will require
more effort and take longer to learn since participants cannot efficiently reuse already
learned unit tasks. It would also be too brittle to deal with most real world tasks that
involve non-routine interruptions and re-planning.

30
Chapter 2
Procedure
2.1 Procedure Overview
An experimental task named “Alphabet Expert Task” was developed to be
compared to an SGOMS/ACT-r model and the optimal ACT-R model. This task was
designed so that the effects directly resulting from the macro architecture are clearly
observable. The task consisted of seeing messages on a computer screen and typing in
responses as quickly as possible.
The key elements for this type of experiment are (1) having a very simple response
pattern so that the perceptual/motor micro -strategies can be isolated, (2) having pre-
existing models representing contrasting options for understanding the task, (3) a highly
detailed, model comparison analysis of the results, and (4) an analysis based on the
results of individual participants.
2.2 Participants
Similar to Experiment 1 in Gray, & Boehm-Davis (2000), two participants took
part in the study. Two researchers involved in this study including myself (P2) and
another graduate student (P1) volunteered for this study. At the time they were
completing Master degrees in Cognitive Science at Carleton University. Neither had
experience with the SGOMS ACT-R model at the time of testing. P1 was an experienced
video game player while P2 was not.

31
2.3 Experimental Display
The experimental interface ran in the Python 2.7.8 interpreter for the Microsoft
Windows operating system. For every trial, a four letter text appeared with text under it
stating "Enter response here:" The participant typed a two letter response and then hit
enter. Pressing the enter key initiated the next trial with either a one second delay or no
delay depending on what stage of the experiment the participant was in. If the participant
entered an incorrect response to the four letter code, an error message would appear
stating the correct two letter response for the displayed code. The interface recorded the
response entered, RT, and error rate. For the purpose of analysis, the program also
recorded the planning unit and unit task the participant was in when entering a response.
2.4 Method
To limit the variations in methods and unit tasks the experimental task was kept as
simple as possible. A task called the Alphabet Expert was designed to limit response
method variability and maximize observability of unit task and planning unit structures.
In terms of the general experiment, on each trial participants were presented with a four
letter code and had to respond with the appropriate two letter code. Therefore, every trial
was exactly the same in terms of response actions. In some trials the task involved a
simple response where participants knew what code followed another, in other trials the
task involved a type of choice response where the participants needed to perceive the
message cue to know which code to respond with. These two conditions were the same
as the two conditions in the first experiment in Experiment 1 in Gray, & Boehm-Davis

32
(2000). Under these conditions, Gray, & Boehm-Davis (2000) found that individual
participants used the same micro-strategies.
The learning procedure was as follows. In the first learning stage, participants
learned three different unit tasks. These were learned separately and presented with one-
second intervals between responses within each unit task. Participants practiced until
they were satisfied that they had attained their best speed and accuracy. To do this,
participants trained at home on their laptop computers. Participants then proceeded to the
second stage of the learning procedure where the unit tasks were organized into two
ordered planning units and one situated planning unit (unit task order presented in Table
1).
2.4.1 Unit Task Training
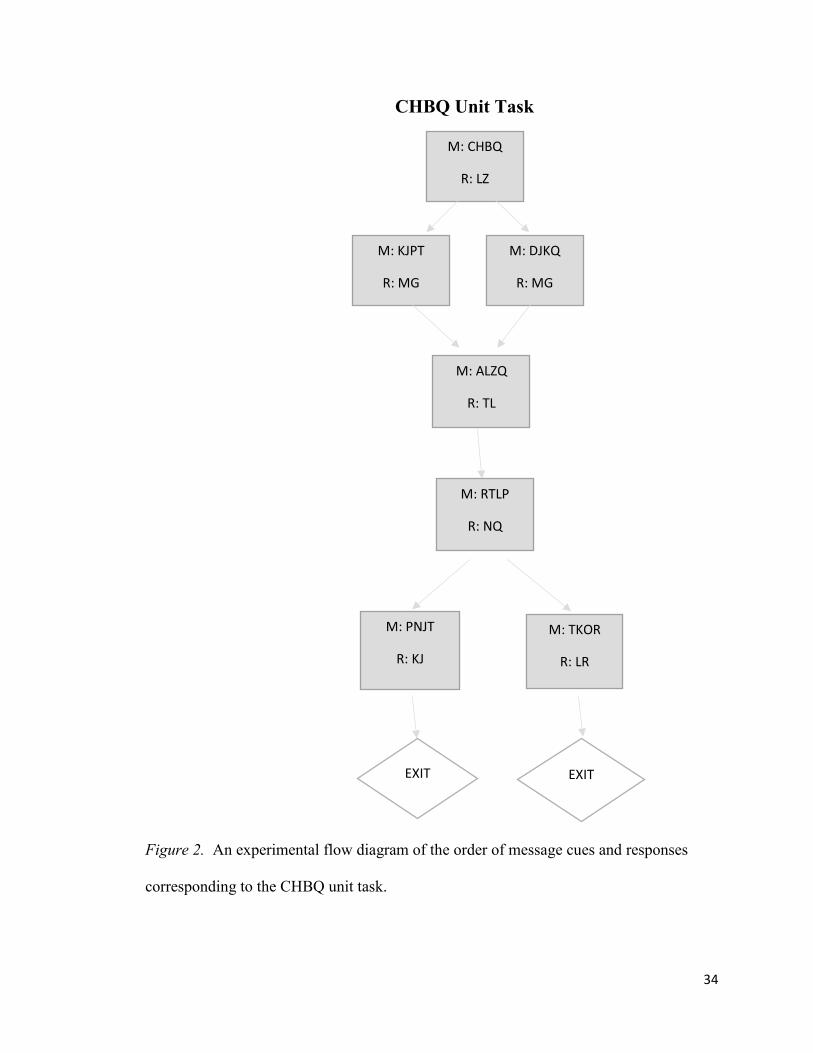
Figure 1, Figure 2, and Figure 3 show the structure of each of three unit tasks that
were indicated by the interface display messages “LPZH”, “CHBQ”, and “PMDF” The
participants were offered diagrams of the unit tasks to first review (same as the ones
shown below) and the experimental interface to train with. Initially, when practicing the
unit tasks with the interface, participants were allowed to have the diagrams for
references until the participant felt that they had memorized each of the responses to the
messages in the unit task and the unit task structure in general.
The participant initiated a training session by indicating to the interface which unit
task they would like to train with. The interface repeated that unit task until the
participant decided to end the training session. There was no limit on the number of
sessions the participant was allowed to perform.

33
LPZH Unit Task
Figure 1.An experimental flow diagram of the order of message cues and responses
corresponding to the LPZH unit task. "M" in diagram indicates message that is displayed
to participant and "R" indicates the response the participant is to enter when they see the
particular message. Arrows indicated what messages will occur next. The diamonds with
the word “exit” indicate the end of the unit task or sequence of messages.
M: LPZH
R: PY
M: JMLT
R: AR
M: PMZR
R: LQ
M: TPRZ
R: BK
M: YKAF
R: AP
M: LJKP
R: BK
EXIT EXIT EXIT
34
CHBQ Unit Task
Figure 2. An experimental flow diagram of the order of message cues and responses
corresponding to the CHBQ unit task.
M: CHBQ
R: LZ
M: KJPT
R: MG
M: DJKQ
R: MG
M: ALZQ
R: TL
M: RTLP
R: NQ
M: PNJT
R: KJ
M: TKOR
R: LR
EXIT EXIT

35
PMDF Unit Task
Figure 3. An experimental flow diagram of the order of message cues and responses
corresponding to the PMDF unit task.
2.4.2 Planning Unit Training
In the next stage of the training, participants memorized three planning units. Each
planning unit was cued by a four-letter code and each was composed of the three unit
tasks. Two of the planning units were ordered planning units, with the unit tasks in
different orders. The third planning unit was a situated planning unit that used a random
set of three unit tasks. Table 1 shows the different planning units.
For the ordered planning units, when participants were cued with the code for the
planning unit, they needed to recall the first unit task and type in a code to begin it. When
that unit task was finished, the code for the planning unit was presented again and
participants had to type in the code for the next unit task, and so on until the planning
unit was finished. For the situated planning unit participants were cued with a code
indicating the situated planning unit. They responded to this with the code "XK" to start
the situated planning unit. Then participants were cued by a code for the beginning of a
unit task. After completing the unit task they were again presented with the code for the
M: PMDF
R: RK
EXIT

36
situated planning unit and they again entered the appropriate response. After this, the cue
for the next unit task was presented. This pattern was then repeated a third time. The
order of unit tasks in a situated planning unit was always random.
Just as at the unit task training stage, participants practiced on their laptops at home
until they were satisfied they were doing the task as quickly and accurately as possible.
The experiment interface continuously repeated the same planning unit until the
participant decided to end the session and there was no limit on the number of sessions
the participant could train. For the next stage of training, the planning unit training was
repeated but with the one second interval between trials removed, so when examining
RT, time associated with cognitive processes was not masked. The participants practiced
until the individual was satisfied that they were performing as quickly and accurately as
they possibly could train up to.

37
Table 1.
Planning unit structures. The question marks indicates unit task being randomly selected.
Planning Unit Unit Task order
Ordered Planning Unit 1
(Cue: AAAA)
LPZH
CHBQ
PMDF
Ordered Planning Unit 2
(Cue: BBBB)
CHBQ
PMDF
LPZH
Situated Planning Unit 3
(Cue: XXXX)
Unit Task ?
Unit Task ?
Unit Task ?
2.4.3 Final Task Training and Completion
Finally, the participants trained for the complete task (see Appendix A and
Appendix C for more detail). The final training sessions and experimental sessions used
for final analysis consisted of 12 planning units (four of ordered Planning Unit 1, four of
ordered Planning Unit 2, and Four of situated Planning Unit 3) occurring in random
order. During the final training session, the participants were again free to train as many
sessions as they felt necessary until they were achieving their best performance on the

38
task. Once the training was complete, the data from four experimental sessions (48
Planning Units per participant) was collected for the data analysis presented below.
2.4.4 The models
The SGOMS ACT-R model was developed using Python ACT-R (Stewart, &
West, 2006). It was created by writing the code for the unit tasks, the planning units, and
the perceptual/motor methods, and inserting them into the SGOMS ACT-R template.
The micro-cognitive Optimal model worked in the following way: the code for the
current planning unit was stored in the imaginal buffer and the production representing
the correct response was selected by matching with this information and the current code,
which was in the visual buffer. The perceptual/motor methods were the same as the
SGOMS model.

39
Chapter 3
Results and Discussion
The trials were divided into different response categories corresponding to different
predictions of the SGOMS architecture allowing RT averages to be calculated for each
participant in comparison to the models of the experiment. The response categories and
their description are listed in Table 2 (See Appendix B for further detail).
Table 2.
Response categories descriptions
Term Description
Unknown Mid
UT
A response to codes in the middle of a unit task that is not
known until the code is perceived. This includes any code that
cannot be anticipated by the participant that is not the first code
(“LPZH, “CHPQ” or “PMDF”) of the unit task.
Known Mid UT
A response in the middle of a unit task that is determined by the
previous response. This includes any code that can be
anticipated by the participant that is not the first code (“LPZH,
“CHPQ” or “PMDF”) of the unit task.
Unknown PU-O
Start
The response to the code to begin an ordered planning unit. Due
to Planning Units being selected randomly, this response cannot
be determined by the previous response.
Known PU-O
Mid
The response to the code to begin the second or third unit task in
an ordered planning unit. This response can be determined by

40
the previous response since the previous response was the last
response to the last unit task.
Known PU-S
Mid
The response to the code to begin the second or third unit task in
an unordered planning unit. This response can be determined by
the previous response since the previous response was the last
response to the last unit task.
Known First UT
The response to the first code to a unit task in an ordered
planning unit. This response can be determined by the previous
response since the previous response was the cue for the Unit
Task.
Unknown First
UT
The response to the first code to a unit task in a situated
planning unit. This response cannot be determined by the
previous response since a Unit Task randomly occurs after the
participants enter in the response "XK".
Unknown PU-S
Start
The response to the code to begin a situated planning unit. Due
to Planning Units being selected randomly, this response cannot
be determined by the previous response.
In SGOMS, an action occurring inside a unit task occurs as it would in the optimal
ACT-R model in that there is no macro cognitive overhead. These response categories
were labeled Unknown Unit Task Middle (Unknown Mid UT) and Known Unit Task
Middle (Known Mid UT), where Known refers to conditions in which the participant
knew the next response based on the last response, and Unknown refers to conditions in
which the participant had to read the new code to know the right response. In terms of

41
data cleaning, trials with an error were removed for each participant. Trials that occurred
after an error trial were deemed unusable since the participant's cognitive processes of
these responses may not relate to the theoretical response category of the trial. A
participant might be responding to the error message rather than resuming the expert
routine or be in a reorientation process to figure out where they were in the task. Often
participants would make several errors in a row resulting in only one additional trial
having to be removed for multiple error trials. Trials with RTs more than two standard
deviations (SD) from the response category mean for the participant were removed as
well. In total, 7.99 percent of trials were removed for P1 and 10.86 percent of trials were
removed for P2 (see Table 3). A full break down of trials removed across response
category is displayed for both participants in Figure 4.
Table 3.
Percent of trials removed for the entire task of each participant broken down by:
incorrect responses (Error), responses to error messages (Error Message), and RTs
more than two SDs from the response category mean for the participant (Outlier Count)
P1 P2
Error 2.28% 3.55%
Error Message 2.05% 1.77%
Outlier Count 3.65% 5.43%
Total 7.99% 10.86%

42
Figure 4. Bar graphs displaying the amount of trials removed for each response category
of P1 top and P2 bottom. The amount removed is displayed as a percentage of the
amount of trials for each response category
0
10
20
30
40
50
60
Unknownmid ut
Known MidUT
Uknown PU-O Start
Known PU-O Middle
Known PU-SMid
Known FirstUT
UnknownFirst UT
Unkown PU-S Start
Per
cent
of
Tri
als
Rem
oved
Response Categories
P1 Removed Trials (Proportion)
Error Error Message Outlier Count
0
10
20
30
40
50
60
70
UnknownMid UT
Known MidUT
UnknownPU-O Start
Known PU-O Mid
Known PU-S Mid
Known FirstUT
UnknownFirst UT
UnknownPU-S Start
Per
cent
of
Tri
als
Rem
oved
Response Categories
P2 Removed Trials (Proportion)
Error Error Message Outlier Count

43
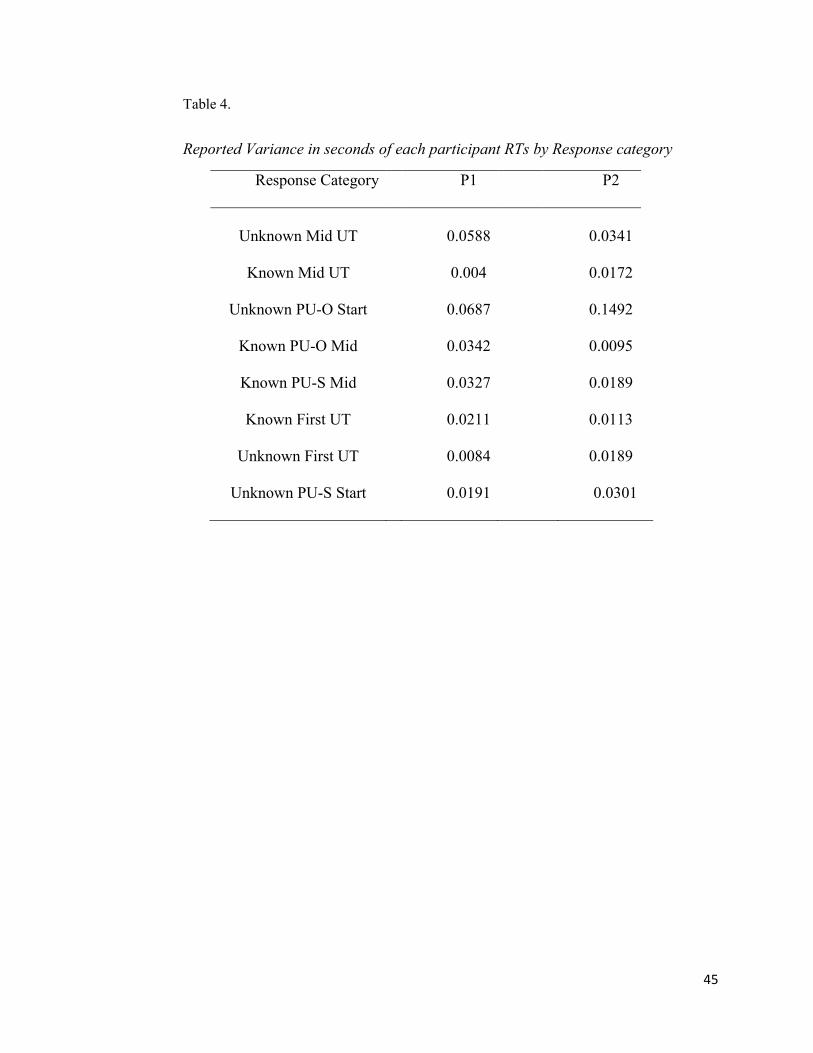
SGOMS is not a theory on perceptual or motor function so it was attempted to
isolate and remove differences amongst participants in RT produced from those effects.
Both models assumed for known mid response as a single perceptual/motor method
where the participant entered the next response as fast as possible. For the unknown
middle response, the models assumed the participants used two perceptual/motor
methods, the first to identify the code and the second to enter the response. The RTs for
these two conditions appear to be consistent (see table 4 for reported variance). These two
conditions formed the baseline for equalizing the results. P1's RTs were considerably
faster than P2, in part because P1 used two hands to type and P2 used one, but also
possibly because P1 was an avid video game player and P2 was not. The RTs were
normalized by subtracting the difference between P1's average RT and P2's average RT
from P2's average score for both conditions ( -0.46 s adjustment for unknown mid ut, and
-0.25 s adjustment for Known mid ut). This same adjustment was applied to all of the
other conditions according to whether the response was known or unknown (see Figure
5).

44
Figure 5. A bar graph displaying RT means of the response categories for both
participants used to calculate two adjustments to P2’s reported RT means of all response
categories
For the SGOMS model and the Optimal model, P1's average times across these
conditions were used as perceptual/motor method time estimates across all other
conditions for both models. With the methods determined, the only difference between
the two models was the number of productions which were determined prior to the
experiment being conducted. The additional productions are associated with the
additional processes required to manage the macro architecture.
45
Table 4.
Reported Variance in seconds of each participant RTs by Response category
Response Category P1 P2
Unknown Mid UT
0.0588
0.0341
Known Mid UT 0.004
0.0172
Unknown PU-O Start 0.0687
0.1492
Known PU-O Mid 0.0342
0.0095
Known PU-S Mid 0.0327
0.0189
Known First UT 0.0211
0.0113
Unknown First UT 0.0084
0.0189
Unknown PU-S Start 0.0191
0.0301

46
Figure 6. A bar graph displaying mean RT measured (in seconds) of response
categories corresponding to the SGOMS ACT-R model. Error bars are of 0.05
confidence intervals.
As shown in Figure 6, the response categories related to the ordered planning units
for P2 and P1 were the same and not significantly different from the SGOMS model for
all but one response category (Known First Unit Task) where P2 matched the
SGOMS model and P1 matched the optimal model. For the response categories related
to the situated planning units, the differences between P2 and P1 were greater. P2 was
similar to the SGOMS model. In two cases, there was a significant difference between P2
and the SGOMS model (Unkown First UT and Unkown PU-S Start) but his results were
still closer to the SGOMS model than the optimal model.
0 0.1 0.2 0.3 0.4 0.5 0.6 0.7 0.8 0.9 1 1.1 1.2 1.3 1.4
Unknown Mid UT
Known Mid UT
Unkown PU-O Start
Known PU-O Mid
Known PU-S Mid
Known First UT
Unknown First UT
Unkown PU-S Start
Response Time (in Seconds)
Res
pnse
Cat
egory
Participant and Model Results
P1
P2
SGOMS
Optimal

47
P1 matched the SGOMS model in some cases and the optimal model in other cases.
In two cases P1 was significantly faster than the optimal model by a small amount
(again, these were Unkown First UT and Unkown PU-S Start). P1 reported
experimenting with different strategies to speed up the task. His pattern of results
indicated that he had managed to eliminate the extra SGOMS processes for some parts of
the task. P1's extra fast response times occurred in response to the code to begin the
situated planning unit and for the first response for each unit task in the situated planning
unit. Perhaps his extra fast times here is due to the fact that he was particularly focused
on speeding up this part of the task. However, P1's RTs to the signal to begin the second
and third unit tasks within the situated planning unit were as predicted by the SGOMS
model (Known PU-S Mid),
Based on self-reports and consistent with his background as an avid video game
player, P1 may have been attempting to reorganize his understanding of the task so that
actions were faster. P2 also reported trying out different strategies. Both P2 and P1
focused their strategic thinking mainly on the situated planning unit. This is also where
the significant differences occurred. This may indicate that situated planning units are
easier or a more obvious candidate for optimization. As noted above, SGOMS does not
claim that people cannot learn the optimal way to do a task. Its stance is that this is not
very common or effective for most real-world tasks, and therefore not the default starting
point.

48
Chapter 4
General Discussion
The results appear to support the theory that macro level factors systematically
shape micro-cognition execution in the manner predicted by a model specified by
SGOMS macro-architecture. The SGOMS model provides a good fit for P2 for five of
six the predictive response categories and three of the six response categories for P1. For
the categories where P1 did not match the SGOMS model, the Optimal model provided a
reasonable fit. The pattern of results from the explorative project suggests that people use
SGOMS architecture as a default system. After considerable amount of practice, they
may switch to a more efficient cognitive structure without the unnecessary macro level
overhead, if the task can be performed without interruptions. The switching of strategies
could be potentially understood by the Lebiere and Best’s (2009) strategy evolution and
strategy discovery levels. The findings are limited by the small sample size of the study.
A direction of future research could be further examination of the effect video
game playing experience has on mastering this task with a larger sample size. It will be
interesting to see if the pattern of results of transitioning from SGOMS to a more
efficient cognitive structure is produced by all participants with extensive video game
playing experience, and whether this pattern is limited to experienced video game players
or is also produced by some of the non-extensively experienced video game participants.
Inexperienced video game players might not switch to the more efficient cognitive
structure since they would have minimum experience with tasks where interruptions do
not occur.

49
References
Anderson, J. R. (1996). ACT: A simple theory of complex cognition. American
Psychologist, 51(4), 355.
Anderson, J. R., Kushmerick, N., & Lebiere, C. (1993). Navigation and conflict
resolution. Rules of the Mind, 93-116.
Anderson, J. R. (2007) How Can the Human Mind Occur in the Physical Universe? New
York: Oxford University Press.
Beard, D. V., Smith, D. K., & Denelsbeck, K. M. (1996). Quick and dirty GOMS: A case
study of computed tomography interpretation. Human-Computer Interaction,
11(2), 157-180. Retrieved from
http://search.proquest.com/docview/57403135?accountid=9894
Berg, G. A. (2000). Human-computer interaction (HCI) in educational environments:
Implications of understanding computers as media. Journal of Educational
Multimedia and Hypermedia, 9(4), 349-370. Retrieved from
http://search.proquest.com/docview/62242506?accountid=9894
Card, S. K., Moran, T. P., & Newell, A. (1983). The psychology of human-computer
interaction. Mahwah, NJ: Erlbaum.
Chikhaoui, B., & Pigot, H. (2010). Towards analytical evaluation of human machine
interfaces developed in the context of smart homes. Interacting with Computers,
22(6), 449-464. doi:http://dx.doi.org/10.1016/j.intcom.2010.08.003

50
Christou, G., Ritter, F. E., & Jacob, R. J. K. (2012). Codein—A new notation for GOMS
to handle evaluations of reality-based interaction style interfaces. International
Journal of Human-Computer Interaction, 28(3), 189-201.
doi:http://dx.doi.org/10.1080/10447318.2011.581893
Elkerton, J., & Palmiter, S. (1991). Designing help using the GOMS model: An
information retrieval evaluation. Human Factors, 33, 185-204.
Ericsson, A. K. (2006). Protocol Analysis and Expert Thought: Concurrent
Verbalizations of Thinking during Experts Performance on Representative Tasks.
In The Cambridge Handbook of Expertise and Expert Performance. Cambridge
University Press.
Gil, G., & Kaber, D. B. (2012). An accessible cognitive modeling tool for evaluation of
pilot–automation interaction. The International Journal of Aviation Psychology,
22(4), 319-342. doi:http://dx.doi.org/10.1080/10508414.2012.718236
Grabner, R. H., Neubauer, A. C. & Stern, E. (2006) Superior impact and neural
efficiency: the impact of intelligence and expertise, Brain Research Bulletin, 69,
422–439.
Gray, W. D., & Boehm-Davis, D. A. (2000). Milliseconds matter: An introduction to
microstrategies and to their use in describing and predicting interactive behavior.
Journal of Experimental Psychology: Applied, 6(4), 322-335. doi:10.1037//1076-
898x.6.4.322

51
Gray, W. D., John, B. E., & Atwood, M. E. (1993). Project Ernestine: Validating a
GOMS analysis for predicting and explaining real-world task performance.
Human-Computer Interaction, 8, 237–309.
Iqbal, S. T., Adamczyk, P. D., Zheng, X., & Bailey, B. P. (2005). Towards an index of
opportunity: Understanding changes in mental workload during task execution.
Paper presented at the SIGCHI Conference on Human Factors in Computing
Systems (CHI ‘02), Minneapolis, MN.
Iqbal, S. T., Bailey, B. P. (2005). Investigating the Effectiveness of Mental Workload as
a Predictor of Opportune Moments for Interruption. Poster presented at the SIGCHI
Conference on Human Factors in Computing Systems (CHI ‘02), Minneapolis,
MN.
Jastrzembski, T. S., & Charness, N. (2007). The model human processor and the older
adult: Parameter estimation and validation within a mobile phone task. Journal of
Experimental Psychology: Applied, 13(4), 224-248.
doi:http://dx.doi.org/10.1037/1076-898X.13.4.224
John, B. (1990). Extensions of GOMS analyses to expert performance requiring
perception of dynamic visual and auditory information. Proceedings of CHI 199
(pp. 107–115). New York: Association for Computing Machinery.
John, B. E., & Kieras, D. E. (1996). Using GOMS for user interface design and
evaluation: Which technique? ACM Transactions on Computer-Human Interaction,
3(4), 287-319.
52
John, B. E., & Kieras, D. E. (1996b). The GOMS family of user interface analysis
techniques: Comparison and contrast. ACM Transactions on Computer-Human
Interaction, 3, 320–351.
John, B. E., Vera, A. H., & Newell, A. (1994). Towards real-time GOMS: A model of
expert behaviour in a highly interactive task. Behaviour & Information Technology,
13(4), 255-267. Retrieved from:
http://search.proquest.com/docview/618608239?accountid=9894
John, B., Prevas, K., Salvucci, D., & Koedinger, K. (2004). Predictive Human
Performance Modeling Made Easy. In Proceedings of CHI 2004. New York:
ACM.
Kieras, D. Santoro, & T. P. Computational GOMS modeling of a complex team task:
Lessons learned. Proceedings of the SIGCHI conference on Human factors in
computing systems, Vienna, Austria (2004), 97-104.
Kieras, D. E. (1996). Guide to GOMS model usability evaluations using NGOMSL. In M.
Helander & T. Landauer (Eds.), The handbook of human-computer interaction (2nd
ed., pp. 733–766). Amsterdam: North-Holland.
Kieras, D. E. (1999) A guide to model usability evaluation using GOMSL and GLEAN3.
Retrieved January 20, 2004, from
ftp://www.eecs.umich.edu/people/kieras/GOMS/GOMSL_Guide.pdf
Kieras, D.E., Wood, S.D., Abotel, K., & Hornof, A. (1995). GLEAN: A Computer-
Based Tool for Rapid GOMS Model Usability Evaluation of User Interface

53
Designs. In Proceeding of UIST, 1995, Pittsburgh, PA, USA, November 14-17,
1995. New York: ACM. pp. 91-100.
Klein, G., Ross, K. G., Moon, B. M., Klein, D. E., Hoffman,R. R., & Hollnagel, E.
(2003). Macrocognition. Intelligent Systems, IEEE, 18(3), 81-85.
Langley, P., Laird, J. E., & Rogers, S. (2009). Cognitive architectures: Research issues
and challenges. Cognitive Systems Research, 10(2), 141-160. DOI:
10.1016/j.cogsys.2006.07.004
Lebiere, C., & Best, B. J. (2009). From Microcognition to Macrocognition:
Architectural Support for Adversarial Behavior. Journal of Cognitive Engineering
and Decision Making. 55, 3(2): 176193.
MacDougall, W. K., Martin, M., Nagy, N. C, & West, R. L. (2015). A method for
building models of expert cognition in naturalistic environments. In Proceedings of
the International Conference on Cognitive Modeling 2015 (pp. 25–30).
MacDougall, W., West, R., & Hancock, E. (2012). Modeling Multi-Agent Chaos: Killing
Aliens and Managing Difficult People. Proceedings of the Thirty-sixth Annual
Conference of the Cognitive Science Society (pp. 2603-2608). Hillsdale, NJ:
Lawrence Erlbaum Associates.
Marr, D., & Poggio, T. (1977). From understanding computation to understanding neural
circuitry. Neurosciences Research Program Bulletin, 15, 470- 488.

54
Meyer, D. E., & Kieras, D. E. (1997). A computational theory of executive control
processes and human multiple-task processes and human multiple-task
performance: Part 1. Basic Mechanisms. Psychological Review, 104, 3-65.
Newell, A. (1973). You can’t play 20 questions with nature and win: Projective
comments on the papers of this symposium. In Visual Information Processing.
Academic Press.
Newell, A. (1990). Unified theories of cognition. Cambridge, MA: Harvard University
Press.
Oyewole, S. A., & Haight, J. M. (2011). Determination of optimal paths to task goals
using expert system based on GOMS model. Computers in Human Behavior,
27(2), 823-833. doi:http://dx.doi.org/10.1016/j.chb.2010.11.007
Raja-Yusof, R., Akmal, J., & Jomhari, N. (2013). Information visualization techniques
for presenting Qur’an histories and atlas. Multicultural Education and Technology,
7(4), 301-316. doi:http://dx.doi.org/10.1108/METJ-03-2013-0011
St. Amant, R., & Ritter, F. E. (2005). Automated GOMS to ACT-R model generation.
Submitted to the International Conference on Cognitive Modeling. Mahwah, NJ:
Lawrence Erlbaum
Stewart, T.C. & West, R. L. (2006) Deconstructing ACT-R. 7th International Conference
on Cognitive Modelling. Trieste, Italy
Sun, R. (2009). Theoretical status of computational cognitive modeling. Cognitive
Systems Research, 10(2), 124-140. doi:10.1016/j.cogsys.2008.07.002

55
Sun, Ron. “Introduction to Computational Cognitive Modeling”. In The Cambridge
Handbook of Computational Psychology, edited by Ron Sun, 3-20. New York:
Cambridge University Press, 2008.
Taatgen, N. A., & Anderson, J. R. (2008). Constraints in Cognitive Architectures. The
Cambridge Handbook of Computational Psychology, 170-186.
doi:10.1017/cbo9780511816772.009
West, R. & MacDougall, K. (2014). The Macro-Architecture Hypothesis: A Theoretical
Framework for Integrated Cognition. In Proceedings of AAAI Fall Symposium
Series, North America.
West, R. L., Hancock, E., Somers, S., MacDougall, K. & Jeanson, F. (2013). the Macro
Architecture Hypothesis: Applications to Modeling Teamwork, Conflict
Resolution, and Literary Analysis. Proceedings of the 12th International Conference
on Cognitive Modelling. Cognitive Engineering and Decision Making, 1(2), 186-
211.
West, R. L., & Nagy, G. (2007). Using GOMS for modeling routine tasks within
complex sociotechnical systems: Connecting macrocognitive models to
microcognition. Journal of Cognitive Engineering and Decision Making, 1(2),
186–211 doi:http://dx.doi.org/10.1518/155534307X232848
West, R. L., & Pronovost, S. (2009). Modeling SGOMS in ACT-R: Linking macro- and
microcognition. Journal of Cognitive Engineering and Decision Making, 3(2), 194-
207. doi:http://dx.doi.org/10.1518/155534309X441853

56
Appendix A – Experimental Flow Diagrams of the Task
An Experimental flow diagram of the two Order Planning Units and the Situated
Planning Unit in the experiment. The Order Planning Units consisted of a set order of
three Unit Tasks while the Situated Planning Unit consisted of the random Unit tasks
indicated by the question marks. The orange boxes display the cues indicating the start of
a new Planning Unit or a new Unit Task. Planning Units were selected randomly during
the task.

57
Appendix B - Experimental Flow Diagrams Illustrating Response
Categories
An experimental flow diagram of the LPZH Unit Task used as an example to illustrate
the response categories Unknown Mid UT and Known Mid UT. Responses circled by
blue squares correspond to the Unknown mid UT response category and the response
circled by the orange square correspond to the Known mid UT response category.

58
An experimental flow diagram of the two Order Planning Units in the experiment
used as an example to illustrate the response category Unknown PU-O Start. This
response category corresponded to responses to the code to begin an ordered
planning unit.

59
An experimental flow diagram of the two order Planning Units in the experiment used as
an example to illustrate the response category known PU-O Mid. This response category
corresponded to responses to the code to begin the second or third unit task in an ordered
planning unit.
60
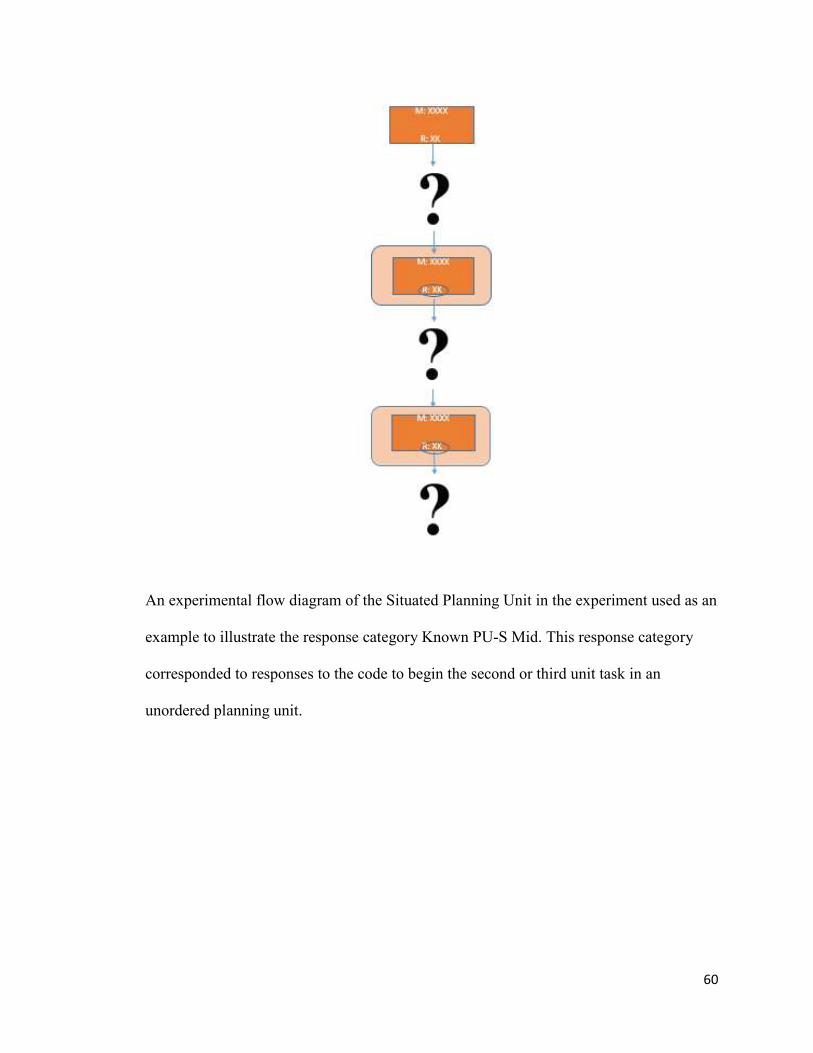
An experimental flow diagram of the Situated Planning Unit in the experiment used as an
example to illustrate the response category Known PU-S Mid. This response category
corresponded to responses to the code to begin the second or third unit task in an
unordered planning unit.

61
An experimental flow diagram of the two order Planning Units in the experiment used as
an example to illustrate the response category Known first UT. This response category
corresponded to responses to the first code to a unit task in an ordered planning unit.

62
An experimental flow diagram of the Situated Planning Units in the experiment used as
an example to illustrate the response category Unknown first UT. This response category
corresponded to responses to the first code to a unit task in a situated planning unit.

63
An experimental flow diagram of the Situated Planning Units in the experiment used as
an example to illustrate the response category Unknown PU-S Start. This response
category corresponded to responses to the code to begin a situated planning unit.

64
Appendix C – Experiment Stimuli Example
AAAA
Enter response here: LP
LPZH
Enter response here: PY
PMZQ
Enter response here: LQ
YKAF
Enter response here: AP
AAAA
Enter response here: CH
CHBQ
Enter Response here: LZ
An example of stimuli for Order Planning unit 1 presented on the experimental display.
The participant would see the cue “AAAA” indicating the start of Order Planning unit 1
to which they would type the response “LP”. Immediately upon entering the response,
the first cue of the first Unit Task of the Planning Unit would be displayed to the
participant and they respond to that cue. The participant completes the rest of the Unit
Task w after which they will then see “AAAA” again, indicating the start of the second
Unit Task. The participant completes the second Unit Task and the pattern is repeated a
third time. After completing the third Unit Task the Planning Unit will be complete.