a methodology for radical innovation · innovation aimed at sustainable energy generation. the...
TRANSCRIPT

A Methodology for Radical Innovation
– illustrated by application to a radical Civil Engineering structure
by
Cobus van Dyk
Dissertation presented for the degree of Doctor of Philosophy at
Stellenbosch University
Department of Civil Engineering, University of Stellenbosch
Private Bag X1, 7602 Matieland, South Africa
Promoters: Professor G.P.A.G. Van Zijl Professor J.V. Retief Professor Emeritus G. De Wet
December 2008


Declaration By submitting this dissertation electronically, I declare that the entirety of the work contained
therein is my own, original work, that I am the owner of the copyright thereof (unless to the
extent explicitly otherwise stated) and that I have not previously in its entirety or in part
submitted it for obtaining any qualification.
Date: 26 November 2008
Copyright © 2008 Stellenbosch University
All rights reserved


Abstract
A Methodology for Radical Innovation – illustrated by application to a radical Civil Engineering structure
Cobus van Dyk
Department of Civil Engineering
University of Stellenbosch Private Bag X1, 7602 Matieland, South Africa
November 2008
Radical, far-beyond-the-norm innovation engages unknown developmental frontiers outside the
familiar fields of standardised practice, requiring new and broad perspectives. This implies
significant uncertainty during problem solution – the more radical, the greater the uncertainty. No
systematic procedures for managing radical innovation exist. Research managers agree that
traditional, standardised innovation approaches do not provide sufficient support for managers to
cope with the degree of functional uncertainty typical of radical innovations. An efficient approach
for delimiting and describing its uncertainties and managing the development process during the
radical innovation process is sought. This thesis synthesizes a methodology for radical innovation
from Systems Engineering and Management of Technology theory. Its application in a case study
illustrates how it facilitates efficient strategic decision-making during radical innovation.
Systems Engineering, by its comprehensive perspective, provides a valuable non-intuitive
framework from which required radical innovation functionalities and uncertainties are identified,
delimited, characterised and developed. Management of Technology concerns the core theory of
technology; its perspective on technology provides the radical innovation process with a means of
characterising and delimiting status, potential and uncertainty of functional, technological elements
in the system.
The resulting Radical Innovation Methodology is verified through application to an emerging
renewable energy concept, the Solar Chimney Power Plant, which responds to a demand for
innovation aimed at sustainable energy generation. The radically tall chimney structure required by
the plant, proposed to stand 1,500 meter tall, serves as a fitting case for illustrating the methodology.
Addressing and solving of challenges and uncertainties related to the radically tall structure and
associated costs are required toward competence of this concept in a global energy market.

Samevatting
`n Metodologie vir Radikale Innovasie
– geïllustreer deur toepassing op `n radikale Siviele Ingenieurs struktuur
Cobus van Dyk
Department van Siviele Ingenieurswese Universiteit van Stellenbosch
Privaatsak X1, 7602 Matieland, Suid Afrika
November 2008
Radikale, ver-buite-die-norm innovasie benader onbekende ontwikkelingsgrense wat buite die
bekende velde wat gestandaardiseerde praktyk bied val; dit benodig nuwe en breë perspektiewe.
Radikale innovasie gaan gepaard met toenemende onsekerheid gedurende problem-oplossing – hoe
meer radikaal, hoe groter die onsekerheid. Daar bestaan geen sistematiese prosedure vir die bestuur
van radikale innovasie nie. Navorsingsbestuurders stem saam dat tradisionele, gestandardiseerde
innovasie-benaderings nie voldoende ondersteuning aan bestuur voorsien om die graad van tipiese
funksionele onsekerhede van radikale innovasie te hanteer nie. `n Effektiewe benadering om
onsekerhede af te baken en te beskryf asook om die ontwikkelingsproses tydens die radikale
innovasie proses te bestuur word benodig. Hierdie tesis sintetiseer `n metodologie vir radikale
innovasie vanuit stelselsingenieurswese- en tegnologiebestuurteorie. Die toepassing daarvan op `n
gevallestudie illustreer hoe dit doeltreffende, strategiese besluitneming tydens radikale innovasie
fasiliteer.
Stelselsingenieurswese voorsien `n waardevolle nie-intuïtiewe raamwerk deur sy omvattende
perspektief vanwaar vereisde radikale innovasie funksionaliteite asook onsekerhede geïdentifiseer,
afgebaken, gekarakteriseer en ontwikkel kan word. Tegnologiebestuur is bemoeid met die kern-
teorie van tegnologie. Die perspektief op tegnologie voorsien tydens die proses van radikale
innovasie `n wyse tot karakterisering en afbakening van tegnologiese status, potensiaal en
onsekerheid van funksionele tegniese elemente in die stelsel.
Die hieropvolgende Radikale Innovasie Metodologie word geverifieer deur die toepassing daarvan
op `n ontluikende hernubare energie konsep, naamlik die Sonskoorsteen Kragstasie, in antwoord op
`n behoefte vir innovasie vir volhoubare energie-opwekking. Die kragstasie benodig `n radikaal hoë
skoorsteen struktuur, van `n voorgestelde 1,500-meter-hoogte, wat `n gepaste geval ter illustrasie

van die metodologie bied. Adressering en oplossing van die uitdagings en onsekerhede verwant aan
die radikaal-hoë struktuur en gepaardgaande kostes word benodig met die oog op bevoegdheid van
die konsep in `n globale energiemark.

To Jesus Christ, thank you… for thesis blueprints, for guidance, for assistance, for back up, for
space, for quietness, for friendship, for grace, for office-window views on Simonsberg sunrise and
sunset, for the people along this journey. Bless them. This thesis and everything I learnt I present to
You… You are the best thing that has ever happened to me.
I owe so much to my parents, especially my dad, Louis van Dyk, for subtle (often unknowing!)
inspiration toward systems oriented thinking – the symphony regarded as Systems Engineering; also
for speedy proofreading and editing. Thank you, Dad and Mom, for always keeping me in your
prayers.
To my friends and fellow pilgrims: thank you for your believing in me, and for your support
during ups and also downs. To Dr. Annie van der Westhuizen, thanks for PhD inspirations, and
indeed, “it is the glory of God to conceal a matter, and it is the glory of kings to find out a matter”.
Thanks to Fred May for inspiration to pursue the PhD. Thank you also to my girlfriend, Ruzelda, for
your continual support.
Last but not the least I thank Pronutro and ACE mieliepap for their unwavering support.


Acknowledgements
Honour is due to whom honour is due: I am tremendously indebted to Prof. Gideon P.A.G. van
Zijl for his gentle but definingly directive input toward inception of this study; also for his
motivation and academic career insight along the way. Prof. Johan V. Retief provided critical input
for definition of the thesis concept, breakdown and logical flow. He was always readily available for
think-tanks, co-brooding and advice, sometimes in spite of illness. Prof. Emeritus Gideon de Wet
provided decisive background, insight and encouragement in the form of tutoring and guidance
toward the emergence and formulation of this thesis. It was wonderful working with you all.
My PhD colleagues from the Solar Chimney Power Plant (SCPP) research group, Dr. Thomas P.
Fluri and Dr. Hannes P. Pretorius: thank you for many good laughs, dreams, patience and friendship
throughout this journey.
To the Solar Chimney Power Plant Research Group students at the US-ISE, thank you for your
contributions to the SCPP project: Michael Lumby, Eliz-Mari Lourens, Lisa Alberti-du Toit, Tian
Nel, Jean-Pierre Rousseau, Elsje Fraser and especially my good friend, Diplom-Ing. Michael Lorek.
Further, thanks to Diplom-Ing. Harald Schindelin at BUW.
Prof. D.G. Kröger inspired the engagement in the subject of the Solar Chimney Power Plant
development. He and Prof. T.W. von Backström provided an excellent thermo-flow basis from
which the structural development of the chimney could proceed. Thank you for your opportune
availability.
With much gratitude I thank our extremely approachable German counterparts, Prof. Dr.-Ing
Reinhard Harte, Prof. Dr.-Ing Dr.-Ing E.h. Wilfried B. Krätzig, Prof. Emeritus Dr.-Ing Hans-Jürgen
Niemann, Dr.-Ing Matthias Andres and Dr.-Ing Ralph Wörmann. Your theoretical competence in the
theory of structures is always inspiring. Thank you, Reinhard, for the opportunity to study at your
department at the Bergische Universität Wuppertal.
My gratitude to the following colleagues: for practical insight and advice I thank Prof. Jan A.
Wium and Dr. Philippe Maincon, for the SCPP thermo-flow calculations I thank Prof. Marco A. dos
Santos Bernardes and for PhD related advice I thank Dr. Billy P. Boshoff, Dr. Celeste Barnardo and
Dr. Trevor Haas. Lastly, for support during the completion of this dissertation I extend thanks to my
colleagues at UWP Consulting (Pty) Ltd, specifically Mr. Craig Northwood and Mr. Stephen
Richter.

Volkswagen Stiftung provided extensive financial support for the research leading to this
dissertation. Thank you for making this research possible.

xiii
Contents
TITLE PAGE i
DECLARATION iii
ABSTRACT v
SAMEVATTING vii
ACKNOWLEDGEMENTS xi
CONTENTS xiii
LIST OF FIGURES xix
LIST OF TABLES xxii
GENERAL INFORMATION AND ABBREVIATIONS xxiii
CHAPTER 1
INTRODUCTION 1
1.1 INTRODUCING RADICAL INNOVATION 1 1.1.1 Innovation and radical innovation defined 1 1.1.2 Difficulties in managing radical innovation 3
1.2 THESIS STATEMENT: A METHODOLOGY FOR RADICAL INNOVATION 4
1.3 MOTIVATION 5 1.3.1 A systematic approach for the management of radical innovations 5 1.3.2 Technological insight into radical innovation decision-making 7 1.3.3 Sustainable technological innovation 7 1.3.4 The Solar Chimney Power Plant 8
1.4 THESIS DELIVERABLES 9
1.5 THESIS DEVELOPMENT AND DISSERTATION LAYOUT 10 1.5.1 PART I: Formulation of the Radical Innovation Methodology 10 1.5.2 PART II: Application of Radical Innovation Methodology on the Solar Chimney Power Plant chimney
structure 10
1.6 THESIS SCOPE 11 1.6.1 Applicability of the Radical Innovation Methodology 11 1.6.2 Depth engaged in Systems Engineering and Management of Technology 12 1.6.3 Structural Engineering scope 13
PART I DEVELOPMENT OF
THE RADICAL INNOVATION METHODOLOGY
CHAPTER 2
A VIEW FROM SYSTEMS ENGINEERING 17
2.1 DEFINITION OF SYSTEMS ENGINEERING 17
2.2 SYSTEMS HIERARCHY 18

xiv
2.3 A SYSTEMS PERSPECTIVE ON THE CHALLENGE OF RADICAL INNOVATION 19
2.4 SYSTEMS HIERARCHY BREAKDOWN, FUNCTIONAL ALLOCATION AND FAILURE MODE
IDENTIFICATION 20 2.4.1 Systems hierarchy breakdown 20 2.4.2 Failure modes and their relation to functionality 20 2.4.3 Functional allocation 21 2.4.4 Linking failure modes and functionality to technology 21
2.5 FURTHER SYSTEMS ENGINEERING CONCEPTS 22 2.5.1 System baseline and the Ideal Final Result 22 2.5.2 Performance criteria 24 2.5.3 The complexity of radical innovations 25
2.6 SYSTEMS ANALYSIS PROCESS – A MODEL FOR INNOVATION 26
2.6.1 Innovation models 26 2.6.2 The systems analysis process 27
2.7 CONCLUSION 28
CHAPTER 3
MANAGEMENT OF TECHNOLOGY: APPROACH AND TOOLS 29
3.1 DEFINITION OF TECHNOLOGY 29
3.2 MANAGEMENT OF TECHNOLOGY BACKGROUND 30 3.2.1 Technology theory 30 3.2.2 The value of technology theory for radical innovation 30
3.3 TECHNOLOGY ASSESSMENT 32 3.3.1 Technology characteristics 32 3.3.2 Classification of technology 33
3.4 TECHNOLOGY SCAN 34
3.5 TECHNOLOGY ROADMAPPING 35
3.6 TECHNOLOGY FORESIGHT 36
3.7 TECHNOLOGY TREND IDENTIFICATION 36 3.7.1 Technology trend curves 37 3.7.2 Cascade of Technological Trends 39
3.8 STRATEGISING TECHNOLOGY DEVELOPMENT 40 3.8.1 Strategy maps 40 3.8.2 Research and development risk 41
3.9 CONCLUSION 42
CHAPTER 4
THE RADICAL INNOVATION METHODOLOGY 45
4.1 FORMULATION OF THE RADICAL INNOVATION METHODOLOGY 45 4.1.1 Set up of reference case 46 4.1.2 System breakdown and identification of technologies 47 4.1.3 Evaluation and comparison of alternatives 47 4.1.4 Technology assessment, trend identification and research and development risk 50 4.1.5 Technology strategy formulation 51

xv
4.2 RADICAL INNOVATION METHODOLOGY DYNAMICS 52 4.2.1 Insight, not rules 52 4.2.2 Repetition and iteration of the Radical Innovation Methodology 52 4.2.3 Educated guessing in radical innovations 52 4.2.4 Generic applicability of the Radical Innovation Methodology 53
4.3 CRITICAL ROLE-PLAYERS DURING THE RADICAL INNOVATION METHODOLOGY 53 4.3.1 The role of the technology manager 53 4.3.2 The role of the board 54 4.3.3 The role of the technology expert 55
4.4 CONCLUSION 55
PART II VALIDATION OF THE RADICAL INNOVATION METHODOLOGY –
APPLICATION TO THE SOLAR CHIMNEY POWER PLANT CHIMNE Y STRUCTURE
CHAPTER 5
SOLAR CHIMNEY POWER PLANT CHIMNEY BACKGROUND, CONCE PT AND SHORTCOMINGS 59
5.1 A CONTEMPORARY CONTEXT FOR RADICAL INNOVATION 60 5.1.1 Climate change and global energy trends 60 5.1.2 South African energy and renewable energy trends 62 5.1.3 An incentive for radical renewable energy technology innovation 64
5.2 THE SOLAR CHIMNEY POWER PLANT CHIMNEY REFERENCE CASE 64 5.2.1 Chimney operating principle and required dimensions 65 5.2.2 Reference case set up 66
5.3 DEFINITION THE SOLAR CHIMNEY POWER PLANT CHIMNEY DEVELOPMENT AS RADICAL
INNOVATION 71 5.3.1 Structural challenges 73 5.3.2 Cost requirements 76
5.4 CONCLUSION ON SOLAR CHIMNEY POWER PLANT CHIMNEY BACKGROUND, CONCEPT AND
SHORTCOMINGS 77
CHAPTER 6
TECHNOLOGY IDENTIFICATION IN THE SOLAR CHIMNEY POWE R PLANT CHIMNEY 79
6.1 FUNCTIONAL BREAKDOWN OF THE SOLAR CHIMNEY POWER PLANT CHIMNEY 79 6.1.1 Chimney foundation functionality 81 6.1.2 Chimney-to-foundation transfer functionality 81 6.1.3 Chimney tube functionality 81
6.2 FAILURE MODE IDENTIFICATION 82 6.2.1 Material failure modes 82 6.2.2 Action-based failure cause 83

xvi
6.3 TECHNOLOGY SCAN FOR MITIGATIVE, AMENDING AND OPTIMISING MEASURES 84 6.3.1 Longitudinal stiffening 85 6.3.2 Circumferential stiffening 85 6.3.3 External damping system 86 6.3.4 Manipulation of wind–structure interaction 87 6.3.5 Improvement of material characteristics 87 6.3.6 Directional design 88
6.4 INTEGRATION OF FUNCTIONALITIES INTO A TECHNOLOGY TREE 89
6.5 LIST OF IDENTIFIED TECHNOLOGIES 90
6.6 CONCLUSION ON SOLAR CHIMNEY POWER PLANT TECHNOLOGY IDENTIFICATION 92
CHAPTER 7
EVALUATION OF POTENTIAL IMPACT OF TECHNOLOGIES ON T HE SOLAR CHIMNEY POWER PLANT CHIMNEY SYSTEM 93
7.1 FORMULATION OF ALTERNATIVES 94 7.1.1 Wind velocity extrapolation model 94 7.1.2 Wind direction variations over chimney height 95 7.1.3 Applicability of prescribed critical buckling factor to the Solar Chimney Power Plant chimney 95 7.1.4 Cross wind force spectrum 96 7.1.5 Flaring of chimney exit geometry 97 7.1.6 Chimney inner surface friction 97 7.1.7 Circumferential stiffener concept 97 7.1.8 Improved material performance 98 7.1.9 Cable support adding longitudinal stiffness 100 7.1.10 Parabolic hyperboloid geometry 101 7.1.11 Increased chimney diameter 102 7.1.12 Number of circumferential stiffeners 102 7.1.13 Wall thickness variation 103 7.1.14 External damping devices 104 7.1.15 Wind-structure interaction manipulation 104 7.1.16 Directional design 107 7.1.17 Increased chimney height 108 7.1.18 Terrain surface roughness 109
7.2 EVALUATION MODEL AND CHOICE OF CRITERIA 110 7.2.1 Background on choice of criteria 110 7.2.2 Re-articulation of user requirements in the choice of evaluation criteria for Solar Chimney Power Plant
chimney 111
7.3 SYSTEM PERFORMANCE EVALUATION 114 7.3.1 Levelised Electricity Cost performance chart 115 7.3.2 Buckling performance chart 116 7.3.3 Dynamic response performance chart 117 7.3.4 Relative performance and contradictions 118 7.3.5 Technology growth 120
7.4 IDENTIFICATION OF CRITICAL TECHNOLOGIES 123
7.5 CONCLUDING DISCUSSION 124 7.5.1 Technologies for consideration during further Radical Innovation Methodology phases 124 7.5.2 Discussion of model, data quality and visualisation 124
xvii
CHAPTER 8
TECHNOLOGY ASSESSMENT, TREND IDENTIFICATION AND RES EARCH AND DEVELOPMENT RISK OF CRITICAL SOLAR CHIMNEY POWER PLANT CHIMNEY TECHN OLOGIES 127
8.1 CHARACTERISATION OF TECHNOLOGIES 127
8.2 TECHNOLOGY TAXONOMY 131 8.2.1 Level 2 – foundation and chimney-to-foundation transfer systems 131 8.2.2 Level 2 – chimney tube system 131
8.3 IDENTIFICATION OF TRENDS 133 8.3.1 Solar Chimney Power Plant system 135 8.3.2 Parabolic hyperboloid geometry 137 8.3.3 Wall thickness re-configuration 137 8.3.4 Elastic modulus 138 8.3.5 Wind velocity extrapolation profile 141 8.3.6 Circumferential stiffener concept 144 8.3.7 Cable staying 148 8.3.8 External damping 150 8.3.9 Directional wind design 152 8.3.10 Solar Chimney Power Plant chimney research at the University of Stellenbosch - ISE: Cascade of Technological
Trends 154
8.4 DETERMINATION OF RESEARCH AND DEVELOPMENT RISK 155
8.5 CONCLUSION 157
CHAPTER 9
TECHNOLOGY STRATEGY 159
9.1 VISUALISATION OF RESULTS 160 9.1.1 Information fields 160 9.1.2 Results from Technological Position Analysis 161 9.1.3 Discussion on Technology Position Analysis 165
9.2 TECHNOLOGICAL DEVELOPMENT PRIORITIES 166 9.2.1 Technology assessment based priorities 166 9.2.2 Technology Position Analysis based priorities 168 9.2.3 Other insights and priorities 168
9.3 CONCLUDING THE RADICAL INNOVATION METHODOLOGY APPLICATION 171 9.3.1 Specific priorities 171 9.3.2 General priorities 172
CHAPTER 10
CONCLUSION 173
10.1 SUMMARY OF BACKGROUND AND MOTIVATION AND THE THESIS STATEMENT 173
10.2 RESOLUTION OF THE THESIS 174 10.2.1 Part I: synthesis of the Radical Innovation Methodology 174 10.2.2 Part II: validation of the Radical Innovation Methodology 175 10.2.3 The value of a Radical Innovation Methodology 177

xviii
10.3 RECOMMENDATIONS AND SUGGESTIONS 178 10.3.1 General Radical Innovation Methodology recommendations 178 10.3.2 Solar Chimney Power Plant recommendations 179
EPILOGUE 181
REFERENCES 183
APPENDIX A: FINITE ELEMENT ANALYSES
APPENDIX B: WIND MODEL USED ON SCPP CHIMNEY
APPENDIX C: STRUCTURAL PERFORMANCE EVALUATION MODEL
APPENDIX D: SCPP CHIMNEY COST MODEL
APPENDIX E: SCPP SYSTEM ENERGY YIELD
APPENDIX F: UPPER BOUNDARY LAYER WIND DATA FROM THE SOUTH AFRICAN WEATHER BUREAU
APPENDIX G: CALCULATIONS FOR EVALUATION OF SCPP CHIMNEY SYSTEM PERFORMANCE
APPENDIX H: CRITICAL EVALUATION OF US SCPP R&D
APPENDIX I: MODEL OF SYNTHESISED TOP TECHNOLOGIES

xix
List of figures
Figure description Page #
Figure 1-1. An artistic representation of the SCPP. 9
Figure 2-1. General systems hierarchy. 18
Figure 2-2. The difference between radical and incremental innovation from a SE perspective. 19
Figure 2-3. The link between R&D theme, functionality breakdown and core technology identification. 22
Figure 2-4. The systems analysis process. 27
Figure 3-1. Technology growth curves of each system functionality provide information on its growth
potential. 31
Figure 3-2. Nine Cell Technologies Functional Classification Matrix. 34
Figure 3-3. Typical shape and phases of the technology S-curve. 37
Figure 3-4. Substitution of material platform technologies in integrated circuits. 39
Figure 3-5. Cascade of Technological Trends. 40
Figure 3-6. A strategy map depicting technological position. 41
Figure 4-1. Graphical representation of the RIM. 46
Figure 4-2. Intercommunication between functional allocation, failure mode identification and technology
scan. 48
Figure 5-1. Annual investment in renewable energy capacity (excluding large hydro), 1995-2007. 62
Figure 5-2. Global solar radiation. 63
Figure 5-3. Schematic representation of the SCPP. 65
Figure 5-4. Annual energy production by the SCPP for various plant configurations. 66
Figure 5-5. a) Dimensioned illustration of the chimney. b) transfer-to-foundation system. c) chimney cylinder
depicted in blue construction lines. 72
Figure 6-1. Subsystems of the SCPP system (denoted by blocks) and of the chimney system (denoted by
circles). 80
Figure 6-2. Parabolic hyperboloid geometry incorporated into the SCPP chimney. 86
xx
Figure 6-3. a) Systems for the manipulation of vortex induced vibration and b) an example of helical strakes
wrapped around the upper third of a chimney stack in transit 87
Figure 6-4. A wind rose can display statistical data of prevailing wind directions and speeds over several
years. 88
Figure 6-5. SCPP chimney system functional technology tree. 89
Figure 7-1: Cable stayed transmission tower at the Olympics stadium in Berlin. 100
Figure 7-2. The FEM mesh for analysis of the SCPP chimney incorporating parabolic hyperboloid geometry.
102
Figure 7-3. a) Dimensions and wall thickness of a173.2 meter tall cooling tower. b) The reference case (blue
dashed line) and the investigated wall thickness (red solid line) configurations. 103
Figure 7-4. a) A forest of Saguaro cacti. b) a cactus depicting cavities on the circumference. 105
Figure 7-5. External pressure coefficients at various wind velocities for a) smooth cylinders and b) ribbed
cylinders. 106
Figure 7-6. Net circumferential pressure distribution without and with incorporation of Saguaro geometry.
107
Figure 7-7. An example of directional design. 108
Figure 7-8. Decrease in wind velocity profile due to lower surface roughness. 109
Figure 7-9. Normalized LEC performance for various alternatives. 116
Figure 7-10. Normalized buckling performance for various alternatives. 117
Figure 7-11. Normalized dynamic response performance for various alternatives. 118
Figure 7-12. Combination of the LEC and buckling charts to provide a perspective on overall performance.
119
Figure 7-13. Vector approach portraying technology growth: buckling against LEC. 121
Figure 7-14. Vector approach portraying technology growth: dynamic response against LEC. 121
Figure 7-15. Vector approach portraying technology growth: buckling against dynamic response. 122
Figure 8-1. Technology S-curve displaying rankings. 134
Figure 8-2. Number of SCPP publications. 135
Figure 8-3. Extrapolation trend based on the tallest man-made structures over the past 150 years. 136
Figure 8-4. A linear trend fit to cooling tower (parabolic hyperboloid shaped) height increase over time. 138
Figure 8-5. A view on developments in concrete strength. 139
Figure 8-6. An extrapolation of the Gardner-formulation indicates a potential trend in future elasticity moduli
growth. 140

xxi
Figure 8-7. Schematic view of a downburst depicts the thunderstorm profile in compared to a frontal profile.
142
Figure 8-8. Thunderstorm related publications over time. 143
Figure 8-9. Circumferential stiffening rings in cooling towers. 145
Figure 8-10. Bamboo revealing internal stiffening structures. 146
Figure 8-11. Typical bicycle wheels. 146
Figure 8-12. Spoked wheel concept visible at chimney tip. 147
Figure 8-13. Spanning cables concept. 148
Figure 8-14. a) An example of a tuned mass damper as implemented in the b) super tall Taipei 101 building.
150
Figure 8-15. Involvement in cascade levels over the 7 year US-ISE research program. 155
Figure 9-1. Qualitative portrayal of quadrants in the Technological Position Map. 162
Figure 9-2. Technological Position Map for displaying LEC performance against R&D risk. 163
Figure 9-3. Technological Position Map for displaying buckling performance against R&D risk. 164
Figure 9-4. Technological Position Map for displaying dynamic response performance against R&D risk. 165

xxii
List of tables
Table description Page #
Table 1-1. Characteristics of incremental and radical innovation. 2
Table 2-1. Typical criteria at various life-cycle phases. 25
Table 3-1. Framework of Basic Features. 33
Table 3-2. Definition of R&D risk. 43
Table 6-1. Material failure modes. 83
Table 6-2. Failure modes from an action perspective. 84
Table 6-3. List of technologies. 91
Table 7-1. Change of evaluation model with life cycle phase. 111
Table 8-1. Framework of Basic Features for the SCPP chimney. 128
Table 8-2. Nine Cell Technology Functional Classification Matrix classifying the SCPP chimney systems to
the fourth level. 133
Table 8-3. Key for technology trend status ranks. 134
Table 8-4. Value allocation for R&D risk of system technologies. 156
Table 9-1. Research priorities based on Technology Position Analysis. 169

xxiii
General information and abbreviations
General
A laminated bookmark is provided with the dissertation. This bookmark holds integral
information conveyed throughout the dissertation and could aid the reader in following the thesis
argument, development and validation. The laminated bookmark should be located in the plastic
sleeve inside the back cover of the dissertation. It contains:
• summarised information on the content and flow of the document (with specific reference
to chapters)
• the thesis statement and Radical Innovation Methodology diagram
• the “ideal” performance requirements for the Chimney, which may prove handy especially
in the more technical chapters of Part II.
Lists of the figures and tables follow at the end of this document, after the references.
References used in the Appendices that were not referenced in the main body of the dissertation
are referenced after each Appendix.
Digital versions of this dissertation with the referenced articles and calculation and modeling
files are available from the author.
“He”, “his”, “him”, “man” and “mankind” are in this dissertation used in referring to both the
male and female person.
Abbreviations
- RIM Radical Innovation Methodology
- SE Systems Engineering
- MCDM Multi-criteria decision-making
- TRIZ Theory for Inventive Problem Solving (translated from Russian)
- MOT Management of Technology
- STA Strategic Technology Analysis
- IFR Ideal Final Result
- SCPP Solar Chimney Power Plant

xxiv
- GHG Greenhouse Gas
- US University of Stellenbosch
- US-ISE University of Stellenbosch Institute for Structural Engineering
- BUW Bergische Universität Wuppertal
- BUW SDT Bergische Universität Wuppertal Statik und Dynamik der Tragwerke
- SBP Schlaich Bergermann und Partner Consulting Engineers
- SA South Africa
- m meter (unit of length)
- m2 meter square (unit of area)
- m3 meter cube (unit of volume)
- m/s meter per second (unit of velocity)
- rad/s radians per second (unit of angular velocity)
- m/s2 meter per second square (unit of acceleration)
- kg/m3 kilogram per cubic meter (unit of density)
- N.m Newton meter (unit of a structural moment)
- Pa Pascal (unit of pressure in Newton per meter square), Giga-Pascal (GPa)
being one thousand million Pascal.
- Hz Hertz (unit of frequency measured in revolutions per second)
- MW megawatt (unit of power of one million watts)
- kWh kilowatt-hour (unit of work done by a power of one thousand watts for one
hour)
- GWh/y gigawatt-hour per year (unit of work done by a power of one thousand
million watts for one hour over the duration of a year)
- LEC levelised electricity cost (investment, operations and maintenance cost per
kilowatt-hour of electricity produced over the project lifetime)
- R Rand (South African monetary unit)
- $ Dollar (United States of America monetary unit)
- Bn Billion (a thousand million)
- Mn Million
1
CHAPTER 1
INTRODUCTION
Mankind is surrounded by problems – sources of difficulty that challenge the standards and
liberties that he values. Problems need resolution to ensure man’s survival, safety, health and
security; successfully resolving a problem earns man these securities. If he can overcome it in a
revolutionary or breakthrough – in a radical – way his greater success earns him favour over
competitors, challenges and problems.
A radical striving “far beyond the norm” [Webster 2008] characteristically engages unknown
frontiers and new sets of values, standards and perspectives, implying increased uncertaintyi – the
more radical, the greater the uncertainty – and unpredictable progress during problem solution. This
thesis investigates the systematising of radical innovation to understand and manage its
uncertainties, leading to more efficient innovation.
1.1 Introducing radical innovation
1.1.1 Innovation and radical innovation defined
Due to equal competence of companies in the management of operations, human
resources, marketing and strategy, corporate focus recently shifted to the key to their
competitive advantage: innovation [Harrison and Samson 2002]. An innovation presents a
solution to a problem by realising a product from its creative invention all the way to market
inception [Stefik and Stefik 2004].
While incremental innovation involves the exploitation of existing functional,
parametrically-defined capabilities within the context of a familiar field, radicalii innovation
“changes the game” by providing significantly more favourable functional definition that i Uncertainty, in this thesis, refers to the undefined, qualified or quantified probability of achieving a preferred outcome. ii Several texts investigate characteristics of disruptive (relative to the current market state) technologies. Disruptive technologies are characterised by high innovation uncertainties, with potential transforming change of the product/market economy. Sustaining technologies support competitive advantage through relative, incremental developments with the aim of enlarging market share. Explanatory texts include Walsh [2004] and Kostoff et al. [2004].

2
transforms the existing technological and product feature range, customer–supplier
relationships and marketplace economies [Harrison and Samson 2002, Leiffer et al. 2000].
Table 1-1 provides a comparison between the characteristics and terms typically encountered
in incremental and radical innovation.
Table 1-1. Characteristics of incremental and radical innovation.
Incremental innovation Radical innovation
Exploit the existing Explore the potential
Familiar field, smaller uncertainties Unfamiliar field, significant uncertainties
Parametrically defined Functionally defined
Novel implementation of codified/standard practice
Absence of codified/standard practice
Dramatic results Transforming results
Clear terms, goals, business plan, financial projection, funding
Uncertain terms, sporadic project termination/revival, change of priorities/champions, multi-disciplinary, multi-criteria uncertainty
Goal: product Goal: diminish uncertainties to justify further investment
In some cases, the impact of incremental innovation may appear dramatic being
characterised by novel implementation of codified design practice through interpretation and
manipulation from scientific first principles, thus achieving dramatically improved designs
within a specific, familiar field. A distinction is made, however, between dramatic
incremental innovation and radical innovation. Radical innovation is required in the absence
of sufficient codified design practice at one or more lower levels in a system. Therefore, it
requires innovation outside the familiar realms of standardised, formalised theory and
practice by identifying, re-interpreting and addressing the basic system functionality that
requires solution. With radical innovation a major breakthrough in one or more governing
parameters is sought in an exploring manner through extensive familiarisation with the root
of the problem in a possibly unknown context. Cross-disciplinary perspectives often need to
be introduced in order to identify and characterise these roots and sources of uncertainty in
the radical problem [Stefik and Stefik 2004]. As technological capability is progressively

3
acquired and developed, the limiting factors and uncertainties diminish to a point of
acceptability with regard to general engineering practice. This definition of radical
innovation is central to the development of the subject of this thesis.
Examples of historical radical innovations are the use of steam to propel ships hereby
substituting sails, turbines substituting piston engines to generate power, the substitution of
vacuum tubes with transistors, the Internet and the Apollo Space Project, each disrupting
normative technological standards [Christensen and Bower 1996] by introducing
revolutionary performance standards.
Pure radical and incremental innovation are considered to be extremes, incremental
innovation being the case where the radical characteristics of the innovation are diminished
to a state of manageability by standardised design methods.
1.1.2 Difficulties in managing radical innovation
Although executives of established companies acknowledge that radical innovation is
critical in providing them with long-term renewal and growth, their successful development
and deployment of radical innovations remain unpredictable and fuzzy [Leiffer et al. 2000].
In contrast to incremental innovation, which is characterised by short-term, clearly defined,
parametrical processes with committed funding and development teams, radical innovation is
characterised by high degrees of multi-disciplinary and multi-level technical, market,
resource and organisational uncertainty and unpredictability. Its time frames are long-term
with sporadic project terminations and revivals, nonlinear recycling of the response to
previous setbacks and stochastic change of priorities and champions, thereby creating a mix
of accelerating and retarding factors [Leiffer et al. 2000].
The all encompassing goals of the radical innovation project are to overcome project
discontinuities and progressively reduce the non-empirical, non-intuitive uncertainties
through their sufficient characterisation in order to attract investors for the next phase of the
innovation life cycle. This cannot be achieved by mere parameterised design and relevant
organisational support, which is the subject of incremental innovation. The reduction of
uncertainty is not predictably progressive or sequential; its degree may fluctuate throughout
the project.
Due to the lack of understanding of the processes through which radical innovation
emerges, executives either choose to disengage radical innovation or make autocratic strategy

4
decisions based on knowledge of mainstream business, expecting to see specific project
goals, early market research results and detailed financial projections. Alternatively they
settle as “fast followers” of radical concepts rather than actively manage its innovation
[Leiffer et al. 2000]. The need for a systematic approach to managing the uncertainties in
radical innovation is evident.
1.2 Thesis statement: a methodology for radical innovation
Radical innovation can be better managed and its behaviour more surely predicted, the more
thorough its uncertainties are delimited and characterised. Adequate competencies to identify and
track these uncertainties are crucial. The thesis statement is formulated: Radical innovation can
be systematised through the synthesis of existing theory to form a basis for strategic decision-
making.
Two scientific fields, Systems Engineering and Management of Technology, are engaged for
its potential contribution to the synthesis of a systematic approach aiding radical innovation.
Systems Engineering (SE) involves interdisciplinary technical effort to transform a
requirement into a synthesised solution of subsystems and components [(based on) INCOSE
1998]. SE, by its comprehensive nature, could provide valuable insight into the required radical
innovation functionalities resulting in a systematic, non-intuitive framework within which
uncertainties and deficiencies can be identified, delimited, characterised and developed.
Technology is a widely abused term summoning images of high-tech gadgets or only
perceived as the “grey mist floating” behind a company’siii product portfolio [Ford and Saren
1996]. Broadly defined, it is the mechanism through which mankind leverage its efforts to
improve its quality of life [Harrison and Samson 2002]. Its scientific comprehension could
unlock insight into the building blocks of engineering endeavour. Management of Technology
(MOT) concerns the core theory of technology and its dynamics, innovation, project
management and policy in an ethical, environmental, economical and political context [Van Wyk
2004a, Steele 1989]. Its perspective on addressing functionality and managing technological
iii Although Management of Technology (MOT) generally applies with reference to a company (due to the relevance of MOT for managing the unit of an engineering company’s enterprise – technology), this dissertation uses “company” only to the extent that it is a facility implementing MOT; the principles and methods proposed in this dissertation apply to the generic facility requiring radical innovation. In a similar fashion the term “board” or “board of a company”, throughout this dissertation, refers to the final decision making authority of the company or facility implementing MOT.

5
potential could provide the radical innovation process with a means of characterising and
delimiting status, potential and uncertainty of system elements.
1.3 Motivation
1.3.1 A systematic approach for the management of radical innovations
Several texts focus on the subject of radical innovation, gaining insight from
characteristics, challenges and strategies perceived in several radical innovation case studies
[Grulke 2001, Stefik and Stefik 2004, Leiffer et al. 2000] or addressing organisational
competencies required to cultivate radical innovation [Leiffer et al. 2000]. No systematic
approach, tying together these fragmented insights and tools in order to address the radical
problem, is presented. Technology roadmaps for managing the identification and/or
development of disruptive technologies (refer to Footnote ii in Section 1.1.1) were compiled
[Gerdsri and Kocaoglu 2003, Vojak and Chambers 2004, Walsh 2004, Kostoff et al. 2004]
and draw mainly on business, managerial and MOT insights to formulate perspectives and
methodologies to identify and develop or manage against potentially disruptive technologies.
The only resources toward managing the erratic, uncertain characteristics of radical
innovation (stated in Section 1.1.2) are commercially driven or vague and fragmented
approaches to solving the radical problem. Their systematising could improve the
management of radical innovation through the quantification of uncertainty, resulting in a
higher success rate in realising radical innovations.
Extending project management to radical innovation management
Global competition over the past decades drove firms to compile a comprehensive
incremental innovation project management knowledge base whereby systematic
management tools enable project teams to move complex innovation along efficiently.
On this basis, firms have become adept at continual improvement, operating on the
premise that future results can be predicted through experiential trends with uncertainty
being the exception on a well-defined development path. This body of knowledge is not
adequate for the management of the degrees of multi-level uncertainty encountered in
radical innovation [Leiffer et al. 2000]. No method systematically addressing the
technical challenges associated with radical innovation exists. In order to radically

6
innovate, new approaches and tools must redefine the traditional project management
toolbox.
Synthesis of SE and MOT approaches
Comprehensive radical innovation processes presumably exist in the mind-and-
method of technology management experts. Formalised theory, however, only contains
elements toward a common radical innovation methodology. SE offers systems
breakdown and analysis methods to identify gaps in the radical innovation system. MOT
provides technology assessment, trend identification and strategy formulation.
SE system innovation engages radical innovation with reluctance because
uncertainties at subsystem levels perpetuate to unmanageable uncertainty at higher
system levels. Sherwin and Isenson [1966], when investigating the role of technological
innovation in the successful acquisition of weapon systems for the United States military,
supports this assertion when observing that project failure is almost imminent when lower
level technologies are still developed during synthesis of a higher level system.
Standardised practice for synthesis at upper systems levels is not geared to
accommodate the uncertainties perpetuating from lower levels, thus the definition of
radical innovation (Section 1.1.1) as innovation focussing on basic functionality,
operating outside familiar practice. Mitigation of uncertainties through addressing these
lower levels in the system calls for the identification and addressing of the required
functionality or technology – mere novel interpretation of standard practice will not
suffice. The field of MOT is concerned with the management of these functionalities or
technologies. A focussed attempt to direct the many strategic approaches and tools of
MOT to be applied in the management of the development of the sought technologies,
may reduce uncertainty to more manageable proportions.
Further, although detailed knowledge is limited at early, conceptual phases of the
innovation life cycle, important decisions typically committing up to 75% (based on
standardised, non-radical SE theory) of projected total life-cycle cost must be made with
changes during later life cycle phases having adverse implications on project cost
[Blanchard and Fabrycky 2006].
This thesis proposes a synthesis of SE and MOT theories into a generic systematic
radical innovation methodology. It proposes the furtherance of SE, aiming to manage the

7
radical innovation problem identified by Sherwin (high uncertainty in user systems due to
perpetuated lower level uncertainty), by extending high level system performance
measurement and strategy formulation to incorporate quantitative low-level technological
evaluation, assessment and research and development (R&D). This is achieved through
the application of MOT methods during the decision-making process.
1.3.2 Technological insight into radical innovation decision-making
The quantification of the impact of technological improvements on multi-disciplinary
criteria (in order to make informed decisions) remains a complex task for the technology
manager. By adhering to a technology-based perspective, the decision-maker gains insight
into the characteristics of the systems that form the company products, and into the maturity
of these units with consequent identification of uncertainties, improvement potential, trends
and barriers. The vessels – technologies – harnessing overall system advance are thus
understood more thoroughly. In this way the technology manager is equipped to vouch for
the development progress, direction and deadlines enabling rational radical innovation
decision-making at an executive level. Although boardroom decisions on radical innovation
are generally made on the grounds of strategic business sense, the proximity of the
technological insight enables decision-making based on the status of technological elements
of the company product portfolio.
1.3.3 Sustainable technological innovation
The almost unrestrained rise of technological enterprise in the 20th century had an
immense – and largely unsustainable – impact on the social, economical and ecological
environment [Stern 2006]. Consumerist values justified this short-term rise in the name of
progress and achievement of market share. While, from an economic and marketing
perspective, these endeavours were very successful, they are catastrophic failures when
viewed in a broader, sustainable context [Van Wyk 2004b, Stegall 2006], for instance where
health and environmental interaction is concerned [Ford and Saren 1996]. Post-millennial
man is now faced with the task of taking responsibility for these catastrophic impacts,
cultivating a long-term perspective in an attitude of custodianship [Stefik and Stefik 2004].
The solution lies with harnessing technological power and impact by a sustainable
approach. In order for technology to be managed efficiently, engineering perspective should

8
widen to view companies and projects as socio-technical systems, responsive to the broader
environment [Harrison and Samson 2002]. The containment process may require radical
technological intervention in several spheres of society, economy and ecology, demanding
the fast-tracking of radical technological solutions for circumvention of the numerous global
crises, such as adverse climate change, water scarcity, sanitation, malnutrition, famine and
energy requirements, to name a few [Lomborg 2005]. Procedures that could guide this
radical innovation, proposed by this thesis, are emerging with the rise of sustainability and
systems sciences, providing holistic approaches toward sustainable solutions.
1.3.4 The Solar Chimney Power Plant
The methodology developed for this thesis responds to a demand that is representative of
the great need for sustainable solutions: that of the development of the Solar Chimney Power
Plant (SCPP), and more specifically its 1,500 meter tall chimney structure, until feasibility is
proven. The second part of this dissertation focuses on the application of the developed
methodology on the radical innovation of this chimney; hence, a brief summary of its
context, principle of operation and challenges is appropriate to illustrate its contribution to
motivation for this research.
When engaging the subject of the SCPP one is struck not only by conceptual simplicity
and a hope for a sustainable solution through emission free energy generation that is not
dependant on water availability, but also by the sheer reality of the challenges of realising a
chimney structure of more than twice the height (proposed) of the tallest structures in the
world.
A SCPP, illustrated in Figure 1-1, consists of a transparent circular solar collector
supported relatively low above the ground surface and a tall chimney central to the collector.
Turbo-generators are located at its base. Solar radiation penetrates the collector roof and
heats the ground beneath, which in turn heats the adjacent air causing it to rise through the
chimney, driving the turbine and consequently generating electricity [Pretorius et al. 2004].
An economy of scale applies to the SCPP; the energy output of the power plant increases
exponentially with increase in collector and chimney size. A 1,500 meter tall chimney yields
almost three times more energy annually than a 750 meter tall chimney [Schlaich 1995],
forming the basis for insistence from proponents of the SCPP technology in Southern Africa
for the immediate realisation of a 1,500 meter structure [Stinnes 2004]. Realisation of this

9
structure holds a key to the market feasibility of the SCPP but the challenges and
uncertainties presented by its structural and economic realisation qualify it as a radical
innovation, sufficient to serve as a case for illustrating the validity of the methodology
proposed in this thesis. The need for a technology development strategy to scale from known
science to the unknown realm of this envisaged mega-structure – its radical innovation – is
evident.
1.4 Thesis deliverables
A systemised, methodological approach to managing radical innovation is presented.
A secondary objective comprises the set up of an innovation strategy for improvement of the
performance of the SCPP chimney structure.
Figure 1-1. An artistic representation of the SCPP [Schlaich 1995].

10
1.5 Thesis development and dissertation layout
The dissertation commences with the formulation of the methodology presented as the
argument of the thesis, the Radical Innovation Methodology (RIM), reported in the first part of
the document, which is subsequently, in the second part of the document, applied to the problem
of the SCPP chimney structure radical innovation.
1.5.1 PART I: Formulation of the Radical Innovation Methodology
The first part of the dissertation deals with the development and formulation of the RIM
theory. Chapter 2 investigates SE in serving as a comprehensive perspective on a radical
innovation: mapping its critical uncertainties in a broader context while breaking it down into
its essential functional elements. Chapter 3 investigates MOT as a means of describing and
delimiting uncertainty, corresponding to required levels of functionality, through the
determination of technological characteristics, maturity and R&D risk. Chapter 4 reports the
synthesis of the identified theories into a methodology, thereby formulating the RIM.
1.5.2 PART II: Application of Radical Innovation Methodology on the Solar Chimney
Power Plant chimney structure
In the second part of the dissertation the validation of the proposed RIM theory is
presented: the RIM is applied on the SCPP chimney structure, a technology demanding
radical intervention to innovate it up to a state of market feasibility. Chapter 5 introduces the
SCPP project as a response to market requirements, sets up a chimney reference case for
subsequent use as subject for the RIM application and identifies the required performance of
the chimney system to reach market satisfaction. In Chapter 6 the chimney system is broken
down into its intrinsic technological elements in order to acquire a functional and
technological perspective on the chimney. In Chapter 7 evaluation of the system performance
response to augmentation or introduction of individual technologies is performed to identify
critical technologies whilst the characteristics, maturity and R&D risk of the critical
technologies are assessed in Chapter 8. Chapter 9 concludes part II of the dissertation with a
summary of the findings of the previous chapters and subsequent strategy formulation.
The dissertation concludes in Chapter 10 with a summary of the thesis. The contribution
of the thesis to the scientific context is verified and recommendations for furtherance of the
research are made. The validation of the RIM by means of application on the SCPP chimney
11
is summarised. Finally, the convergence of the improved chimney system performance, as it
emerges from the first iteration application of the RIM, to the required performance is
recorded in an epilogue.
1.6 Thesis scope
1.6.1 Applicability of the Radical Innovation Methodology
The RIM provides a basis for radical technological innovation from which organisational
competencies required for management of the innovation life-cycle and product diffusion can
be interpreted. These aspects are not specifically addressed in this thesis.
Phase-independent RIM application
The principles and logical structure contained in the RIM are applicable throughout
the various phases of the radical innovation life cycle, iteratively diminishing uncertainty
to a functional, reliable, efficient solution. Although performance criteria may change or
become more detailed with project progress [Harrison and Samson 2002], the proof of the
thesis is not limited by the phase-dependent characteristics of innovation evolution and
technology adoption life cycles. Additional readings describing the phases of innovations
include Geoffrey A. Moore’s Crossing the chasm [Moore 1991] and Everett Rogers’
Diffusion of innovations, 5th edition [Rogers 2003].
RIM iterations
The RIM can be implemented iteratively up to a state where standard incremental
innovation is sufficient for its furtherance, thereby incorporating updated requirement
specifications and technical data to refine results and diminish uncertainty onto
technological feasibility. In applying the RIM on the SCPP chimney innovation,
however, only a single iteration is needed to illustrate the validity of the RIM as a
systematising approach delivering information of strategic value.
RIM applicability on technical uncertainty
Radical innovation is often defined and the management thereof grasped through
comprehension of the uncertainties it presents. Technical uncertainties are related to the

12
integrity and accuracy of the underlying scientific knowledge and technical specifications
of the product and its manufacturing, maintainability, etc. Market uncertainties focus on
customer needs existing in customer-product relations and distribution. Organisational
uncertainties, stemming from conflicts between the mainstream organisation and the
radical innovation team, include issues related to the project team competencies and
management support and expectations. Resource uncertainties include the availability or
acquisition of budget and competencies [Leiffer et al. 2000], as well as the source of the
development incentive, varying from market-driven to ecologically, macro-economically,
socially or politically driven [Ford and Saren 1996]. Although the creation of radical
innovation-friendly organisational competencies and business models are critical for
cultivating radical innovation, this thesis is concerned mainly with the resolution of
technical uncertainties. However, the RIM identifies distinct roles for the technology
manager, strategist and expert – these are individually reported. In the application of the
RIM on the SCPP chimney innovation all of these roles are enacted. Additional reading
discussing organisational topics and competencies include Richard Leiffer et al.’s
Radical innovation – how mature companies can outsmart upstarts [Leiffer et al. 2000]
and Mark and Barbara Stefik’s Breakthrough – stories and strategies of radical
innovation [Stefik and Stefik 2004].
1.6.2 Depth engaged in Systems Engineering and Management of Technology
The fields of SE and MOT could contribute a wide range of tools and approaches to
expand and extend the RIM. Engineered systems are composed of various interacting
resources, e.g. human resources, information, software, materials, equipment, facilities and
finances acting over the whole life cycle from conceptualisation through detail design,
construction and operation to decommissioning phases. This thesis is only concerned with
the synthesis of the basic framework of the RIM and its subsequent application on the set up
of a research strategy for the SCPP chimney structure as a validating study. It considers only
SE and MOT resources that contribute to the synthesis of a generic formulation of the RIM
and, furthermore, those that contribute to the early conceptual phase at which the
development of the chimney currently lies. This phase only requires consideration of extreme
action configurations as concerns the extreme loading state of structures at fully operational

13
state, as is typical during Structural Engineering designs. Subsequent life cycle analyses
could present a comprehensive approach to the broader SE and MOT resources.
1.6.3 Structural Engineering scope
Although its principles are applicable to any radical innovation, this thesis implements
the RIM only in a Structural Engineering context. It concerns a reinforced concrete concept
[Schlaich Bergermann und Partner 2004, Van Dyk 2004] as it is currently defined for a SCPP
chimney conceptual solution. Thus, in order to better illustrate the application of the RIM,
the scientific context is kept within familiar boundaries (with the exception of less familiar
technologies that could be identified during application of the RIM). Thereby this research
can utilise the familiar expertise and resources of global and South African (SA) academy
and industry in the reinforced concrete field.
The Radical Innovation Methodology might be applicable to resolution of an increasing number
of mankind’s radical innovation challenges, managing also those technical problems that go “far
beyond the norm”.

14

PART I
DEVELOPMENT OF
THE RADICAL INNOVATION METHODOLOGY

16
17
CHAPTER 2
A VIEW FROM SYSTEMS
ENGINEERING
Systems Engineering (SE) concerns the application of engineering toward the solution of a
complete problem in its full environment by systematic assembly of subsystems and components in
the context of the lifetime use of the system [ICHNET 2007]. This panoptic view on engineering
development could provide a perspective on radical innovation from which the radical problem and
the source of its uncertainty and required functionality is located, delimited and characterised – the
SE concepts required to support this statement are discussed in this chapter. The innovation
methodology that serves as blueprint on which the RIM is based is chosen from SE theory and is
introduced here.
2.1 Definition of Systems Engineering
Engineering is concerned with the economical use of limited resources for the benefit of
people, satisfying user requirements; to determine how the physical factors can be altered to
create the most utility at the least cost. An engineer is forced to create artefacts using incomplete
knowledge [Harvey 2007], or uncertainty. SE, with “system” defined as an assemblage of
functionally related subsystems and components forming a complex, useful whole, involves the
interdisciplinary approach governing the total technical effort over the life cycle of the system
required to transform user requirements into a system solution [INCOSE 1998]. This definition is
chosen from several others because of its inclination to the idea-creation to market-inception
definition of innovation. Furthermore, it emphasises the complex, multi-disciplinary and multi-
criteria approach needed to understand radical innovation – and the formulation of the RIM.
Blanchard and Fabrycky [2006] defines SE as “good engineering” with emphasis on
• a top-down approach viewing a system as a whole comprising of various components,

18
• more complete effort to initially define system requirements, in an interdisciplinary
(multi-perspective) development approach and
• life-cycle orientation whereby all phases from system functional requirements
determination, conceptualisation, design and development, production, distribution,
operation, maintenance and disposal are adhered to during decision-making.
Benefits associated with the implementation of SE principles and tools involve the
comprehensive and diffused characterisation of market requirements and consequent system
development throughout the system life cycle. These result in reduction of system life cycle cost
and acquisition time of risk mitigating technologies.
2.2 Systems hierarchy
Systems are composed of interrelated components (functional parts), attributes (properties of
the components) and relationships (links between components and attributes). A user system is a
set of these components interrelated toward a common objective. A system hierarchy breaks the
system down from the user system level into smaller subsystems or components through as many
levels as are needed to fully describe the system functionality (Figure 2-1 shows a general
systems hierarchy down to the lowest level – that of materials). Each level describes the system
in more detail. The lower of two systems in a hierarchy is called a subsystem.
USER SYSTEM PRODUCT SYSTEM SUBSYSTEM COMPONENT
MATERIAL
Figure 2-1. General systems hierarchy.
A systems view on development provides a systematic perspective on all facets of the system
and those surrounding it in order to identify and delimit critical areas, for subsequent outsourced
development. For example, a naval ship (product systemi) consists of several subsystems like
hull, propulsion, weapons and command and control, which in turn consist of various sub-sub-
systems (e.g. command and control consists of communication, radar, sonar, action information,
etc.).
i A product system is a user system excluding logistical support, personnel, etc.

19
SE is concerned with the synthesis and integration of existing components into higher-level
systems and not with their individual development; components are perceived as “black boxes”
and should not still be developed during synthesis of the product system (refer to Chapter 1,
Section 1.3.1, second subheading).
A systems breakdown is the process of dissecting and delimiting the system into its essential
sub-systems and components for focused synthesis and R&D purposes.
2.3 A systems perspective on the challenge of radical innovation
When a high degree of uncertainty relative to standard design context is encountered at sub-
system levels, the augmented uncertainty at user system level make for unmanageable levels of
uncertainty (Section 1.3.1) – this states the challenge of radical innovation in SE terms. Figure 2-
2 illustrates this in a hypothetical systems hierarchy. Synthesis of a product system incorporates
a component that is still under significant development and hence still contains significant
uncertainty. Activity concerned only in a single cell (in Figure 2-2) constitutes incremental
innovation (a familiar, standardised design environment, portrayed by the small arrows within a
single box in Figure 2-2). The uncertainties in lower levels propagate to unmanageable degrees
of uncertainty in the higher system levels. Radical innovation occurs across system hierarchy
levels thereby incurring great uncertainties due to venturing outside standardised design
environments.
Figure 2-2. The difference between radical and incremental innovation from a SE perspective.

20
A systems perspective on radical innovation could provide a framework from which the
extent and delimiting of uncertainty are determined. The developer could isolate the source of
uncertainty in terms of the systems level, life-cycle phase and scientific field it originates. He
could then decide, based on the perceived risks of the specific development up to sufficient
certainty, whether to focus on in-house development, technology acquisition (transfer from
external sources) or the termination of research.
2.4 Systems hierarchy breakdown, functional allocation and failure mode
identification
The systems hierarchy breakdown, failure mode identification and functional allocation are
performed to logically determine which technologies are present in a system. These perspectives
are implemented and integrated to ensure that all critical user-required and failure mitigating
functionalities are incorporated in the user system.
2.4.1 Systems hierarchy breakdown
The hierarchical breakdown of a system into its essential functional components provides
top-down insight into each functional part. All functional modeling commences by
formulating the overall system function. By breaking the overall system function into small,
readily diffusable sub-functions, the form of the system follows from the assembly of all sub-
function solutions [Tumer and Stone 2001]. It is hard for a manager to decide at what level of
detail such analyses must be carried out and could lead to a listing and evaluation of every
functionality in the system. Rather, the aim is to obtain an understanding of the overall
system and of the critical developmental issues, functionalities and uncertainties presented
[Ford and Saren 1996].
2.4.2 Failure modes and their relation to functionality
A failure mode is any manner in which a system element fails to accomplish its objective
[INCOSE 1998]. Blanchard, when defining failure from a systems perspective, states that a
failure has occurred any time the system, on any level of the system, is not functioning
properly – failure occurs, therefore, due to the absence of function [Blanchard and Fabrycky
2006]. These absent functionalities can be identified in a comprehensive method and

21
framework within the defined systems hierarchy. The identification of failure modes and
their root causes, provide important direction to the functionality that needs to be addressed
in the system synthesis. It is therefore essential to identify as many as possible critical failure
modes in a system.
While regarding prior knowledge and experience as essential input, several tools toward
failure mode identification exist, including Failure Mode Effect and Criticality Analysis
(FMECA) and Failure Tree Analysis (FTA) [Blanchard and Fabrycky 2006].
2.4.3 Functional allocation
A function is a specific action necessary to achieve an objective. Functional allocation
forms part of the determination of system requirements which adheres to user requirements
through technical responses and design attributes stating “how” the user specified “what” is
satisfied [Blanchard and Fabrycky 2006]. The functional description of a system serves as a
basis for identification of the technological functionalities required in the system for it to
accomplish its objectives; design synthesis can be aimed at specifically addressing these
requirements. The uncertainties in lower levels perpetuating to higher levels could be
engaged through the determination and allocation of functionality at positions of uncertainty
in the system, and not through the limiting procedures of standardised design practice.
During functional allocation, the requirements are diffused from user system level as far
down the hierarchical structure as is deemed necessary to assign critical input design criteria
for the essential elements of the system. Functional allocation presents a description of the
functionalities of the system to establish a functional performance baseline in terms of user
requirements for subsequent design and support activities [Blanchard and Fabrycky 2006].
2.4.4 Linking failure modes and functionality to technology
The fundamental definition of technology as created competence [Van Wyk 2000]
predicates a positive link between the functionalities of a system and the technologies
bringing into being (creating) the qualities in a system that enables it to fulfil its objectives
(competence). Functionality states what is required; technology determines how the
requirement can be addressed.
Samsung Advanced Institute of Technology (SAIT) determines R&D themes (see Figure
2-3) in response to identified failure modes in a technology performance specification phase.

22
These themes are addressed through a technology tree that stipulates technology flow from
the R&D theme to systematically deploy the key functions, thereby implementing
corresponding core technological solutions [Cheong 2006].
Figure 2-3. The link between R&D theme, functionality breakdown and core technology
identification [Cheong 2006].
2.5 Further Systems Engineering concepts
This section introduces SE concepts that may prove helpful in understanding of further
aspects and approaches surrounding the development of the RIM.
2.5.1 System baseline and the Ideal Final Result
A baseline (section 2.4.3) against which a given alternative or design can be evaluated, is
established early in the development process, typically specifying the functional
requirements that the system must perform in order to satisfy user requirements. Baselines
are expressed in terms of technical performance measures that are defined as goals for each
appropriate system level [Blanchard and Fabrycky 2006]. In radical innovations the user-
required baselines might be far from currently achievable technology performance, the
technological limit representing a metric that has to be surpassed to obtain breakthrough.
At this stage, the introduction of the Ideal Final Result (IFR), a lateral, non-incremental
approach to problem solving, is apt. IFR directs the technology developer to the raison d'être
of technological endeavour – the solution of an identified need – as opposed to mere
incremental improvement for gaining market share, thus encouraging non-standardised,

23
problem oriented thinking [Shirwaiker and Okudan 2006]. The IFR is defined as the
“absolutely best solution of a problem under the given conditions” [Savransky 2000].
Technological contradictions are that which inhibit technological innovation. Ideality, on
the other hand, presents the notion that a contradiction (e.g. transport from point A to point B
uses too much fuel due to work performed to move weight) can be opposed by an ideal
solution (that of using less fuel, through, for instance, significant decrease of the transporter
weight). While envisaging the IFR as a reverse engineering approach, investigating solutions
starting from the IFR and reversing to currently feasible capabilities, may direct radical
innovation strategy from its current inadequate status, toward an acceptable solution. This
could possibly gaining technological performance ‘distance’ further than incremental thought
and methods would allow.
In this thesis IFR is interpreted as the license to conduct what is termed virtual probing. It
may be beneficial to, for the purpose of understanding the impact of a future technology
improvement, perform a virtual probe [Van Dyk 2006] where technologies are allowed to be
augmented outside the extent of their physical limits (as currently perceived) by assuming a
‘what if’ stance to their performance improvement. Probe is defined as the “enquiry into
unfamiliar or questionable activities” [Webster 2008]; virtual probe then essentially
constitutes the artificial augmenting of technological capability. Through the virtual
augmenting of technological parameters or concepts vital insight into system performance
response can be gained. This lateral approach, thinking ‘outside the box’, creates opportunity
for radical innovations to materialise; incremental innovation practice would outlaw this
radically innovative approach on the basis of its higher risks, greater expense and non-
compliance to standardised design limits. It may be argued that moving outside physical
technological limits is unprofitable (because it is perceived as being unrealistic) but the IFR
concept supports the notion of looking toward the preferred solution, rather than the realistic
solution in order to proceed with development in a way better directed to the optimal
solution.

24
2.5.2 Performance criteria
Choosing performance criteria for radical innovations
User defined requirements form the base from which criteria for system evaluation is
identified. System performance evaluation must address all the governing facets that
pertain to the performance of the system. System performance evaluators often measure
radical innovations with the same criteria used to assess incremental innovations, leading
to autocratic decisions based on mainstream business principles or idealistic numbers
based on questionable assumptions [Leiffer et al. 2000]. Initial decisions about growth
opportunity promised through the realisation of a radical innovation must be based on the
deliverable benefits of the innovation and on market size if the envisioned benefits are
delivered.
Identification and breakdown of criteria
The first formal evaluation of a radical innovation generally takes place when the
project applies for funding. Initial evaluation must determine whether there is enough
promise to warrant the next step by the investor [Leiffer et al. 2000]; the criteria chosen
for the evaluation of radical innovations must capture the contribution of envisioned
technological benefits and market impact sufficiently to convince potential investors to
invest in the next development phase.
As innovation evolves along its life cycle, more detailed investigation and certainty is
required; similarly the criteria on which a system is evaluated incorporate more detail
with increasing system depth. Table 2-1 illustrates this point by depicting typical criteria
at pre-construction phases of a project. In radical innovations the earliest developmental
phases may include a broader-than-standard range of criteria due to the fact that the
conceptual ‘feasibility’ must be proven to potential investors in light of the sought
functionality amongst uncertain multi-disciplinary surroundings. This entails
comprehensive investigation into new functional (technological) or scientific fields with
their own sets of governing criteria.
A perspective on the breakdown of functional performance evaluation criteria which
aid the choice of criteria, is based on work by Fusfeld [1978]. Primary criteria pertain to
the fulfilment of a system’s primary purpose. The secondary criteria pertain to the
establishment of structure and containment to enable the system to perform its primary
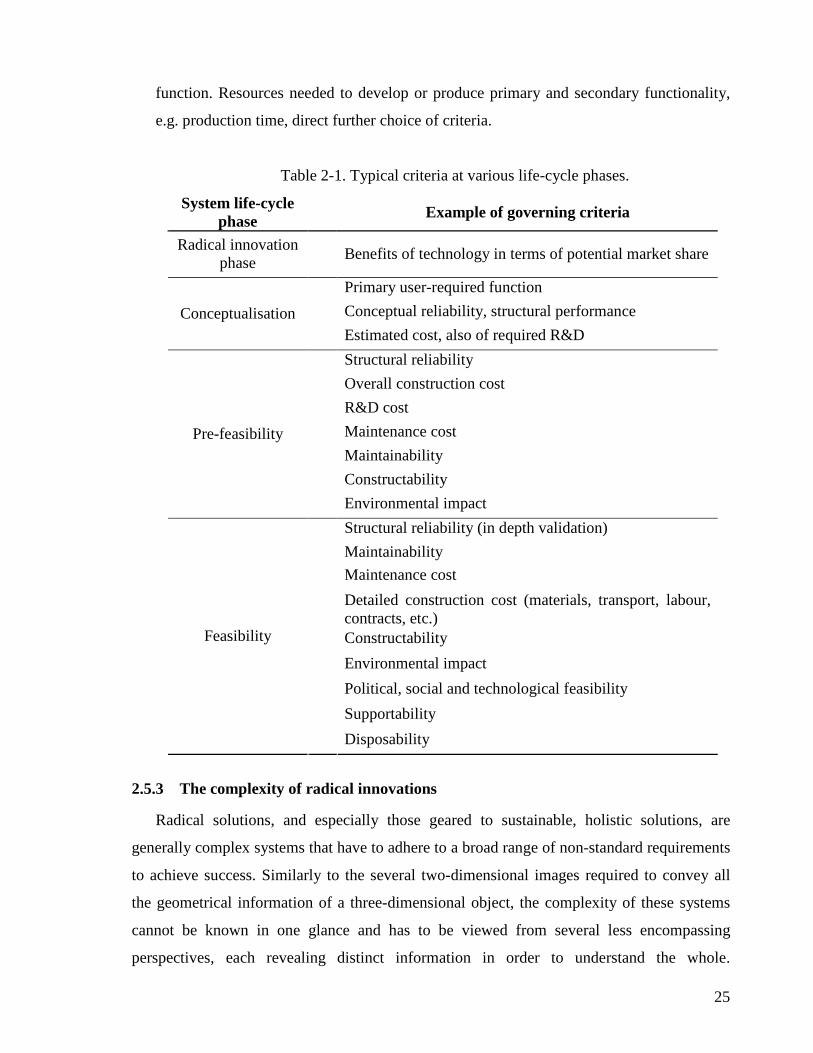
25
function. Resources needed to develop or produce primary and secondary functionality,
e.g. production time, direct further choice of criteria.
Table 2-1. Typical criteria at various life-cycle phases.
System life-cycle phase
Example of governing criteria
Radical innovation phase
Benefits of technology in terms of potential market share
Primary user-required function
Conceptual reliability, structural performance Conceptualisation
Estimated cost, also of required R&D
Structural reliability
Overall construction cost
R&D cost
Maintenance cost
Maintainability
Constructability
Pre-feasibility
Environmental impact
Structural reliability (in depth validation)
Maintainability
Maintenance cost
Detailed construction cost (materials, transport, labour, contracts, etc.)
Constructability
Environmental impact
Political, social and technological feasibility
Supportability
Feasibility
Disposability
2.5.3 The complexity of radical innovations
Radical solutions, and especially those geared to sustainable, holistic solutions, are
generally complex systems that have to adhere to a broad range of non-standard requirements
to achieve success. Similarly to the several two-dimensional images required to convey all
the geometrical information of a three-dimensional object, the complexity of these systems
cannot be known in one glance and has to be viewed from several less encompassing
perspectives, each revealing distinct information in order to understand the whole.

26
Furthermore, because non-standard perspectives may be unfamiliar, the impact of
developments in the system could be non-intuitive requiring significant familiarisation and
modeling efforts. Solutions may also emerge from unpredicted, unfamiliar sources.
An active approach must be adopted to incorporate, within managed resource
expenditure, all perspectives that could contribute critical impacts on the system state;
standard criteria cannot merely be assumed because they do not necessarily provide
prominence to critical areas of the system.
In order to accommodate decision-making where multiple criteria are concerned, Multi-
criteria decision-making methods can be utilised to view the impact of technological change
on the attractiveness of a system; an overview of these methods is provided by
Triantaphyllou in Multi-criteria decision making: an operations research approach
[Triantaphyllou et al. 1998].
2.6 Systems analysis process – a model for innovation
Successful technological innovation requires the innovation process to be well managed.
Attempts to model innovation reveal it to be very complex. No model appears to be
representative for utilisation as a general model of innovation, failing to recognise the
cumulative, complex and often disorderly nature of innovation. One report, focusing on technical
and market competencies of a firm, states that half the respondents used for its study did not have
a formal process for assessing the strategic value of an innovation to their businesses [Harrison
and Samson 2002].
2.6.1 Innovation models
Several models attempt to identify characteristics that define innovation – organisational
and technical attributes that require cultivation to differentiate core technical capabilities and
market insight toward effective innovation. Innovation models attempt to capture the
following two traits, depending on their application [Harrison and Samson 2002]:
• sequential linear activity with functional responsibility stages defining distinct points
for decision-making during the innovation process, and
• a conversion process from technological opportunity to marketplace needs.

27
2.6.2 The systems analysis process
The innovation model chosen as representative of the basic steps of technical innovation
on which the RIM is based is provided by standard SE theory in the systems analysis process,
shown in Figure 2-4. The principles and procedure for analysis of system solution
alternatives, presented by the systems analysis process, provides systematic steps to
determine system performance in terms of specified user requirements. These steps may
prove to be useful in radical innovation for the evaluation of system performance.
Figure 2-4. The systems analysis process [based on Blanchard and Fabrycky 2006].
The model starts with the evaluation of user requirements (1)ii. Market requirements and
uncertainties must be understood and diffused to direct technical development. The analysis
approach (2) continues the process with comprehensive problem definition, specific goal
analysis and the proposal of feasible alternatives. Evaluation criteria (3) are set up and
variable risks and uncertainties identified. Evaluation techniques (4) involve the choice of the
appropriate evaluation and simulation techniques. The evaluation model is set up (5)
followed by the collection and processing of data (6). Alternatives are evaluated (7) by way
of an evaluation model and these results are analysed and interpreted (8) with reference to
recommendations, possible trade-offs and strategic risk and uncertainty. Decisions are made
and strategy formulated (9) governing appropriate consequent action (10). Note that
ii Number of block in Figure 2-4.
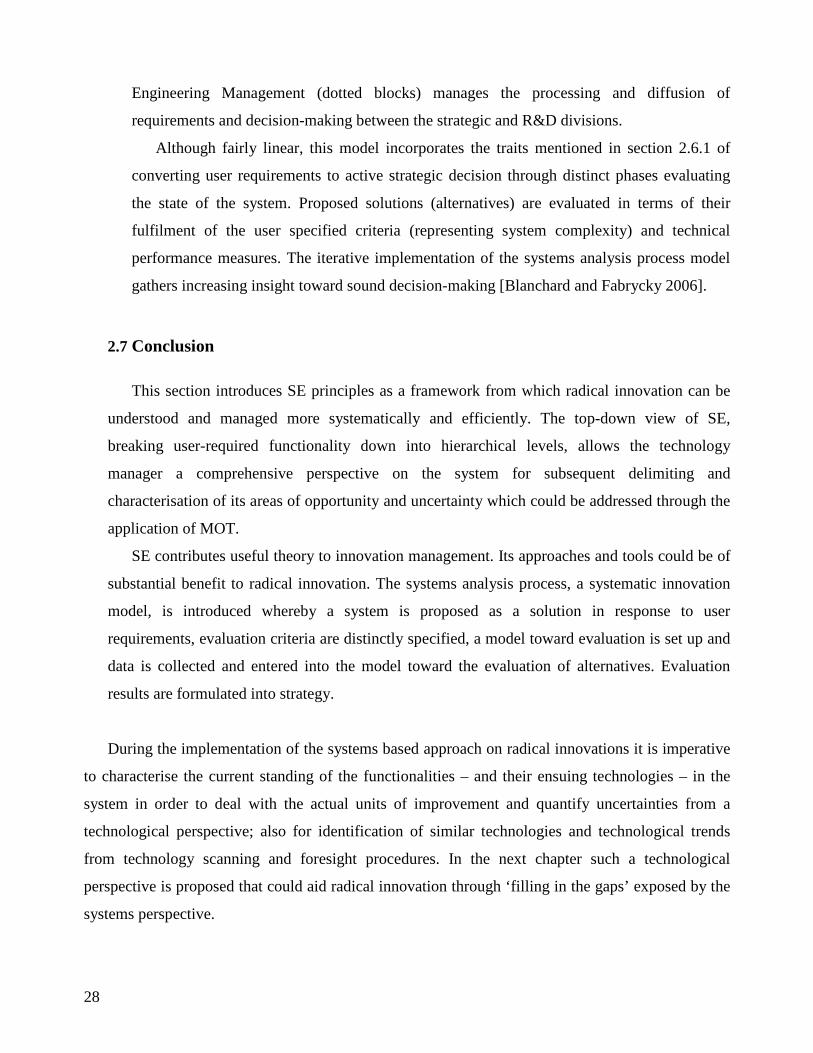
28
Engineering Management (dotted blocks) manages the processing and diffusion of
requirements and decision-making between the strategic and R&D divisions.
Although fairly linear, this model incorporates the traits mentioned in section 2.6.1 of
converting user requirements to active strategic decision through distinct phases evaluating
the state of the system. Proposed solutions (alternatives) are evaluated in terms of their
fulfilment of the user specified criteria (representing system complexity) and technical
performance measures. The iterative implementation of the systems analysis process model
gathers increasing insight toward sound decision-making [Blanchard and Fabrycky 2006].
2.7 Conclusion
This section introduces SE principles as a framework from which radical innovation can be
understood and managed more systematically and efficiently. The top-down view of SE,
breaking user-required functionality down into hierarchical levels, allows the technology
manager a comprehensive perspective on the system for subsequent delimiting and
characterisation of its areas of opportunity and uncertainty which could be addressed through the
application of MOT.
SE contributes useful theory to innovation management. Its approaches and tools could be of
substantial benefit to radical innovation. The systems analysis process, a systematic innovation
model, is introduced whereby a system is proposed as a solution in response to user
requirements, evaluation criteria are distinctly specified, a model toward evaluation is set up and
data is collected and entered into the model toward the evaluation of alternatives. Evaluation
results are formulated into strategy.
During the implementation of the systems based approach on radical innovations it is imperative
to characterise the current standing of the functionalities – and their ensuing technologies – in the
system in order to deal with the actual units of improvement and quantify uncertainties from a
technological perspective; also for identification of similar technologies and technological trends
from technology scanning and foresight procedures. In the next chapter such a technological
perspective is proposed that could aid radical innovation through ‘filling in the gaps’ exposed by the
systems perspective.

29
CHAPTER 3
MANAGEMENT OF TECHNOLOGY:
APPROACH AND TOOLS
SE provides a logical framework and procedure to delimit and identify functionality and
associated uncertainty in the radical innovation. In this chapter Management of Technology (MOT)
theory is investigated for its potential contribution in describing these technical uncertainties through
the determination of technology characteristics and maturity.
The chapter commences with a definition of technology and background on MOT. Subsequently
MOT approaches and tools for technological assessment, scan, foresight, trend identification and
strategising are investigated.
3.1 Definition of technology
The word “technology” is a widely abused term usually summoning images of high-tech
gadgets when in reality it is the building blocks of engineering endeavour – the “major stimulus
for change in society” [Twiss 1992] – and the mechanism by which mankind leverage its efforts
to improve his quality of life [Harrison and Samson 2002]. It is not the “grey mist floating”
behind the products of a company [Ford and Saren 1996]. Insight into technologies could add
vital insight into the elementary subsystems comprising the user system. Rather than
characterising the whole through a semi-empirical approach, a technological perspective is the
“most potent ingredient” for understanding and advancing the capabilities of systems [Blanchard
and Fabrycky 2006]. A fundamental definition of technology describes it as “created
competence” [Van Wyk 2000] (mentioned in section 2.4.4), i.e. bringing into existence a
competence toward a set of inherent qualities that interacts in a wider socio-economical
environment [Harrison and Samson 2002].
Technology can be characterised as a unit of analysis in measuring progress of a company,
serving as a basis for strategy development by evaluating overall technological position and

30
performance. This comprehension of technology could prove critical in conditions of
unpredictable technological change and uncertainty [Ford and Saren 1996] as typically
encountered in radical innovations.
3.2 Management of Technology background
Management of Technology (MOT) concerns the core theory of technology and its
engineering dynamics, innovation, project management and policy in an ethical, environmental,
economical and political context [Van Wyk 2004a, Steele 1989]. Its approach and tools aim to
provide companies and researchers with a handle on their technology portfolio in order to grasp
their standing relative to competitors and manage technology as their primary assets [Harrison
and Samson 2002]. Its perspective on technology could provide the radical innovation process
with a means of characterising and delimiting technological status, potential and uncertainty.
3.2.1 Technology theory
Apart from the organisational competencies sought through MOT, proponents of its
theory believe that formulation of a fundamental structure for technology theory could
greatly improve understanding, management and implementation of this all-important
commodity, forming a framework against which all the details of an individual technology
can be mapped. Classification and characterisation would prevent corporate managers from
being blindsided by new technology and enable them to systematically map their
technological environment and predict definitive developments [Van Wyk 2004a].
Although technology has not undergone that profound comprehensive classifying
simplification that marks the development of most fields of knowledge as they grow toward
maturity (e.g. Chemistry’s periodic table of chemical elements), recent decades saw renewed
focus toward this goal with the definition of key concepts and frameworks clarifying
technological thought [Van Wyk 2004a].
3.2.2 The value of technology theory for radical innovation
The application of SE on the radical innovation problem yields a comprehensive
perspective on the system for delimiting, and subsequent characterisation, of areas of
opportunity and uncertainty. The assessment of technologies in a system engages the actual

31
units of improvement – functionalities, the system’s building blocks – and quantifies
uncertainties and opportunity for improvement as seen from a technological perspective.
Figure 3-1 illustrates this point through an example of a system hierarchy depicting
hypothetical technological information (the graph in each box display typical technology
growth curves; these are elaborated later in this chapter) on the functional (i.e. technological
– refer to Section 2.4.4) breakdown of each level with the large arrows indicating more
potential for growth. Regions promising large potential for growth based on their
technological maturity, for instance the graph on the right at subsystem level, can be isolated
for specific R&D focus.
Figure 3-1. Technology growth curves of system functionality at various levels provide
information on its growth potential.
Technology characterisation and classification qualifies the current technological
standing contributing technological insight from which technology development can be
managed efficiently. Similar technologies can be identified from technology scanning
procedures for potential acquisition. Technology trend identification and foresight provide
systematic attempts to predict the growth of technology.
This chapter continues by providing approaches and tools focused on the gain of
technological insight. Although the field of MOT covers a wide range of organisational and

32
managerial approaches, only theory that is deemed directly applicable to the development of
the RIM is included in this thesis.
3.3 Technology assessment
Technology assessment deals with the characterisation and classification of technology, i.e.
the description of distinctive, differentiating features. Technology assessment as defined by Ford
and Saren [1996] provides a qualitative base from which to concentrate on strategising
technological R&D. It concerns the circumscription, characterisation, completion and
classification of a technology portfolio, the determination of technology origin, maturity and
company competence, and the performance of the company to manage, exploit and acquire
technologies.
Strategic Technology Analysis (STA) is a recent initiative proposing distinct tools based on
technology theory, aimed at assessing technologies and technology fields. Technologies are
interpreted through several frameworks on the grounds of their intrinsic characteristics. A
technology is proposed as an entity, i.e. dissectible and distinguishable, having internal features
[Van Wyk 2004a]. This implies a possibility for its analysis. The technology features and
frameworks presented by STA are introduced here to classify and characterise technologies.
3.3.1 Technology characteristics
Technologies can be grouped in terms of inherent characteristics or internal potency.
Dissection of a technological entity and identification of its unique features give rise to the
formulation of the Framework of Basic Features (Table 3-1) with seven distinctive
technology character traits identified and accompanied by a practical question [Van Wyk
2004a]. The Framework provides and enforces a comprehensive perspective on the
technologies in a system to also identify the non-intuitive features. The Framework is
typically used to structure technological presentation and propose a common frame of
reference and terminology, as well as communication, for specialists presenting to non-
specialists. The Framework also provides the starting point from which other frameworks in
the STA are approached.

33
Table 3-1. Framework of Basic Features [Van Wyk 2004a].
Characteristic Question
Function What does the entity do?
Principle of operation How does it do it?
Performance How well does it do it?
Structure How is the entity composed?
Fit What is the hierarchical position?
Material What is the entity made of?
Size How large is the entity?
The theory of inventive problem solving [Altshuller et al. 2001] is a methodology for
generating innovations. It also defines typical characteristics that describe the physical state
of a technical system. When solving technical problems these characteristics help identify the
technical contradictions residing in the problem. Being intrinsically focused on problem
solving, its list of typical technology characteristics is of a more practical nature than the
mere identification of basic features by the Framework of Basic Features, investigating also
the technological environment to identify solutions.
3.3.2 Classification of technology
Technology taxonomies provide a logical information framework whereby all kinds of
information from definition, capabilities and material properties to typical modeling are
organised and made accessible [IMTI 2003]. The relative potency of technologies in the
system are grasped and placed within the greater context of technologies in the technological
landscape in order to identify similar technologies to be assessed for potential acquisition.
Medical [Evans 2005] and manufacturing technology [IMTI 2003] are fields where
progress was made toward setting up comprehensive technology taxonomies focusing on
creating a technological information base capturing and exploiting knowledge, experience
and data to provide “access to the right information at the right time at the right place”
[IMTI 2003].
In investigating taxonomical characteristics of general technology the following is
identified: the three fundamental aspects of physical reality can be classified as matter,

34
energy or information which is handled in one of three modes, namely process, transport and
storage. All technologies can thus be connected in terms of their basic function and presented
in a coherent matrix called the Nine Cell Technology Functional Classification Matrix
(Figure 3-2) [Van Wyk 2004a]. The figure contains examples of technologies fitting the nine
categories, for example, DVD technology storing information (bottom right cell in Figure 3-
2).
Figure 3-2. Nine Cell Technology Functional Classification Matrix [Van Wyk 2004a].
3.4 Technology scan
Technology acquisition is the process of identifying beneficial technologies outside the
company’s portfolio and its transferral, insertion and integration in the company [Ford and Saren
1996]. Technology scan involves the familiarisation of the technical system with its broader
technological environment, or technology landscape, through an understanding of the
characterisation and classification of internal (to the system) and external technologies. The
market relevance of internal technologies is assessed and similar technologies identified from the
landscape for acquisition of their relevant elements. The applicable technology landscape,
containing knowledge relevant or peripheral and lateral to the subject (constituted by the sum of
expert knowledge, journals, conference proceedings, etc.), is scanned for identification of
technologies that could fulfil the functionalities specified by the system functional architecture.
Furthermore, the identification and acquisition of an emerging technology that fulfills the same
functionality of a mature enabling technology can provide significant competitive advantage.
Technology scan involves the meeting of cross-disciplinary experts each contributing from
his field of knowledge, “challenging and stretching conventional thinking” on the best solution
and practice [Floyd 1997]. The scan must not be limited to familiar or developing technologies

35
and must include competitor and untried technology alternatives. A scan could also look to
nature for acquisition of its tried-and-proven ‘technological’ solutions [Stefik and Stefik 2004].
The complex, multi-disciplinary nature of radical innovations could make technology scan an
integral stage toward the solution of the radical problem – looking outside the constraints of
conventional design. Radical innovation would typically require a more extensive technology
scan in an attempt to investigate all potential contributing technological avenues.
3.5 Technology roadmapping
Technology roadmapping provides structured, flexible techniques for planning technology
development support and long-range technology strategy. Its efficacy in recent years has led to a
wide range of definitions and purposes of and for roadmaps, exploring and communicating the
relationships between evolving and developing markets, products and technologies over time
[Walsh 2004, Phaal et al. 2004]. The impact of technological and market changes can be
anticipated in terms of potential threats and opportunities [Phaal et al. 2004] and strategy can be
formulated proactively.
Technology roadmapping entails approaches and a broad spectrum of tools to aid in the
identification, selection and development of technological alternatives to satisfy a set of product
needs [Walsh 2004]. A team of experts are co-opted for organising and presenting the critical
technology-planning information to make and leverage informed investment decisions. Needs
are identified and addressed through technologies that, upon investigation, are found to be
critical to the realisation of required performance targets. Development of these technologies up
to the sought performance targets can be specifically managed and its time frames calculated.
The extent of the knowledge base serving technology roadmaps is vast; texts providing
introductory reading on the evolution and current status of technology roadmaps include [Phaal
et al. 2004, Phaal and Muller 2008, Walsh 2004].
Roadmaps are concerned with mapping the uncertainties of the “future” – vision, goals and
potential change. Threats and opportunities may be radical or disruptive, in nature; a legitimate
concern about many roadmap formats is that they are biased in favour of the preconceived,
preferred development route. Healthy roadmapping should accommodate potentially disruptive
uncertainties [Phaal and Muller 2008]. Some efforts have been made to expand the applicability
of roadmaps to cover longer periods of development, reaching into higher levels of uncertainty

36
and absence of knowledge base. Gerdsri and Kocaoglu [2003], Vojak and Chambers [2004],
Walsh [2004] and Kostoff et al. [2004] characterise the developmental phenomena typical of
roadmaps for disruptive technologies. These draw mainly on business, managerial and MOT
insights to formulate perspectives and methodologies to identify and develop or manage against
potentially disruptive technologies. Their results serve as useful parallel reference for the
independent study performed for the proof of the thesis subject in this dissertation, aimed at
drawing on existing, fundamental bodies of knowledge.
The successful implementation of technology roadmapping as a managerial tool has brought
about the creation and acceptance of similar techniques such as technology foresight and
forecasting as well as data scanning [Walsh 2004].
3.6 Technology foresight
Where the technology scan and roadmapping approaches provide insight in the current and
preferred technology states, technology foresight, defined as a systematic attempt to look into the
future of technology, society and the economy, could extend it by identifying trends and
predicting social, economic and environmental niches for pro-active technology strategy. The
long-term nature of some systems, e.g. most civil engineering projects and large facilities such as
ships or aeroplanes, leave them particularly vulnerable to uncertainties arising from unforeseen
changes [Ford and Saren 1996]. Technology foresight is an expert-based approach to developing
medium to long-term strategy by extrapolation of existing patterns to minimise risk during long-
term project planning.
Technology foresight suits the characteristics of radical innovation well, explicitly
recognising that the future is uncertain and that seriously disruptive events can and will happen.
Practical benefits of deploying foresight approaches are the receptiveness and response to signals
of change and better judgement for resource allocation [Johnston 2003].
3.7 Technology trend identification
The value of a technology can be related to a combination of its performance improvement
and an assessment of its maturity and the risk associated with R&D up to the required
performance level. A new, emerging technology holds great potential simultaneously with

37
significant uncertainty with regard to its actual development up to profitable status while, on the
other hand, a mature technology presents low risk solutions with lower return on investment.
Technology trend curves and the Cascade of Technological Trends are tools included in STA in
order to evaluate technology maturity toward strategy formulation [Van Wyk 2004a].
3.7.1 Technology trend curves
The technology S-curve and other technology trend curves
Various types of visualisations are used to describe technological trends. Curves
depicting change of technological parameters relative to resource expenditure are used to
portray change in characteristics of relevant metrics of performance [Van Wyk 2004a].
The technology S-curve [Abernathy and Utterback 1978] depicted in Figure 3-3
displays a typical growth phenomenon in technology.
Figure 3-3. Typical shape and phases of the technology S-curve [Abernathy and
Utterback 1978].
The emergence phase of a technology is characterised by a low gradient performance
increase relative to resource expenditure implying high risk, high return R&D
investment. Higher gradient performance increase presents a growth phase, with
subsequent decreasing performance increments signifying the maturing phase where
R&D investment is of fairly low risk with low return on investment. During the aging

38
phase, technology becomes obsolete, nearing the breakthrough zone (also known as a
technology threshold [Ford and Saren 1996]) which is a physical or socio-economical
barrier to technology performance growth. At this phase there is a strong incentive for
advancing R&D into unchartered territory [Van Wyk 2004a] to develop radical,
disruptive technologies for better performance solutions [Ford and Saren 1996,
Christensen 1992]. SE defines factors that stand in the way of attaining objectives as
limiting factors. Location of limiting factors enable the identification of factors that can
be altered to make progress possible, referred to as strategic factors [Blanchard and
Fabrycky 2006], these becoming critical focus areas in the development process.
The actual shape of S-curves is seldom as elegant as portrayed in Figure 3-3. Periods
of continuous incremental change are often interspersed by shorter periods of radical
discontinuities [Ford and Saren 1996]. Radical innovation technology growth curves are
particularly spread with starts and stops, detours and waxing and waning of funding
[Leiffer et al. 2000], requiring vision, endurance and patience during strategic decision-
making.
Other technological trend curves include size and cost curves depicting improvements
in specified parameters (e.g. the increase of the capacity of a computer CPU over time).
Substitution or diffusion curves [Christensen 1992] (see Figure 3-4, depicting substitution
of material platform technologies used in integrated circuits over time [Bowden 2004])
describe the pattern in which an existing technology is disrupted and replaced by a new
technology. Early scanning for and acquisition of substitute technology is needed when
technologies near maturity and obsolescence to assure timely succession of next
generation technology.
Parameters to be used as performance criteria include technological performance
capabilities (storage density, reliability, capacity, etc.) of the trend-assessed technology or
the number of publications or patents filed within a particular technological field.
Although the latter methods have drawbacks due to varying publication quality, research
focus, differing national patent laws and secrecy, the method does have the advantage of
simplicity [Savransky 2000].

39
Figure 3-4. Substitution of material platform technologies in integrated circuits
[Bowden 2004].
Subjectivity of trends
Technological growth is easily manipulated by factors that are not technical in nature
but responds to non-technical, firm specific, political, social or economical pressure
[Christensen 1992]. The immense impetus that political purpose and military endeavour
provided to the radical scaling of technologies during the Apollo space project [Murray
and Bly Cox 1989] and the two world wars is evident through the incredible range and
depth of innovation following these events [Comstock and Lockney 2007].
3.7.2 Cascade of Technological Trends
Technological change occurs in distinct cascades and could therefore identify the current
level of technological development and predict the typical future focus for technology R&D.
Five cascade levels are observed in the Cascade of Technological Trends (Figure 3-5) [Van
Wyk 2004a] providing insight into the level of development of a technology. At Level 1
material function and structure are the main parameters of change. Level 2 improves
structure, principle of operation and size. Level 3 accounts for improved performance and
Level 4 for decrease in cost and improvement in safety and health issues and environmental
impact. Level 5 investigates technology substitution and diffusion into its relevant markets.

40
Figure 3-5. Cascade of Technological Trends [Van Wyk 2004a].
3.8 Strategising technology development
Technology strategy connects business goals to market requirements through consideration
of technological prowess [Harrison and Samson 2002]. Throughout the technology identification,
assessment, scan, foresight and trend identification phases, a foundation of insight into the
current and potential technology position is gained, differentiating it from a wider technology
landscape. This equips the technology manager for pro-active response to changes in the
technology landscape enabling pro-active shifts with regard to technology strategy.
The field of MOT contains approaches and techniques to assist in the formulation of
technology strategy. These include the setting up of R&D roadmaps [Harrison and Samson 2002]
and technology R&D risk assessment.
3.8.1 Strategy maps
Strategy maps are used to visualise technological data for the formulation of strategy,
examining the interactions and balances between perspectives for each alternative in a given
scenario [Yu 2005]. Consider as an example Technological Position Analysis which is a tool
to determine which technologies are in a position to make critical contributions to improving
system performance and market satisfaction [Clausing 2001]. Figure 3-6 portrays an example
of a Technological Position Analysis map displaying customer satisfaction against
technological strength with subsequent technological priorities. The high satisfaction–high

41
strength areas describe a company’s core competency (Technologies T2 and T3 are
developing toward that area, their small size indicating emerging and growing technologies
while T1 is mature, moving away from core influence because of displacement by succession
technologies).
Figure 3-6. A strategy map depicting technological position [adapted from Clausing
2001].
Many other strategy techniques and tools exist in managerial theory. A useful initial
reading elaborating on strategising techniques and tools is provided by the text Strategic
management of technology and innovation, 4th edition [Burgelman et al. 2004]. Technology
roadmapping (discussed in Section 3.5) contributes a further knowledge base on the spectrum
of technology strategy visualisation methods [Walsh 2004, Phaal et al. 2006].
3.8.2 Research and development risk
Technology trend curves suggest the depth of R&D resource allocation needed to realise
the augmented level of performance, or the technology identified for introduction to the
system. These requirements vary with technology, depending on the nature of the

42
improvisation. For example, an emerging trend in material characteristics may require a
R&D drive toward in-depth understanding of general material behaviour and phenomena
necessitating large R&D input, while the acquisition of a familiar, mature technology in the
system may merely require an interfacing design. The risk associated with the development
of an individual technology must be determined before the formulation of technology
strategy. Its qualification aims to describe one aspect of radical innovation uncertainty: that
of R&D risk [Goforth 1999].
Experts in the field under consideration should be involved in determining R&D risk
associated with developing technological ability up to the required level. With limited
information available on the possibility of reaching the required technological performance
levels, forecasting methods like the Delphi method, limit analysis and trend correlation can
be introduced toward the allocation of these risk levels. The Delphi Method is an established,
systematic interactive forecasting method that recognises the value of expert opinion,
experience and intuition and allows using the limited information available, when conclusive
scientific knowledge is lacking [Wikipedia 1 2007]. Limit analysis relates the proximity of
current performance status to an absolute limit; in trend correlation one technology is a
precursor to another and therefore predicts its arrival [Meredith and Mantel 1995].
Table 3-2 is presented to distinguish five levels of R&D risk. R&D risk is defined as the
probability of R&D not achieving the results aimed for; low R&D risk indicates a higher
probability of achieving preferred results; high R&D risk may require major input before
achieving good results. In radical innovation the risks of achieving user-required goals are
typically high and demands patience from the innovator.
3.9 Conclusion
MOT theory and tools are introduced to expand the framework presented by SE through
viewing technology as the functional elements of engineering endeavour. Uncertainties, as are
typically associated with radical innovation, are characterised by gaining insight into
technological attributes and maturity thus providing insight toward well founded strategy
formulation. Several MOT tools are introduced to characterise and classify technologies in order
to determine their position in the technology landscape. A technology scan familiarises the
current system with its technological environment and surrounding landscape. Technology
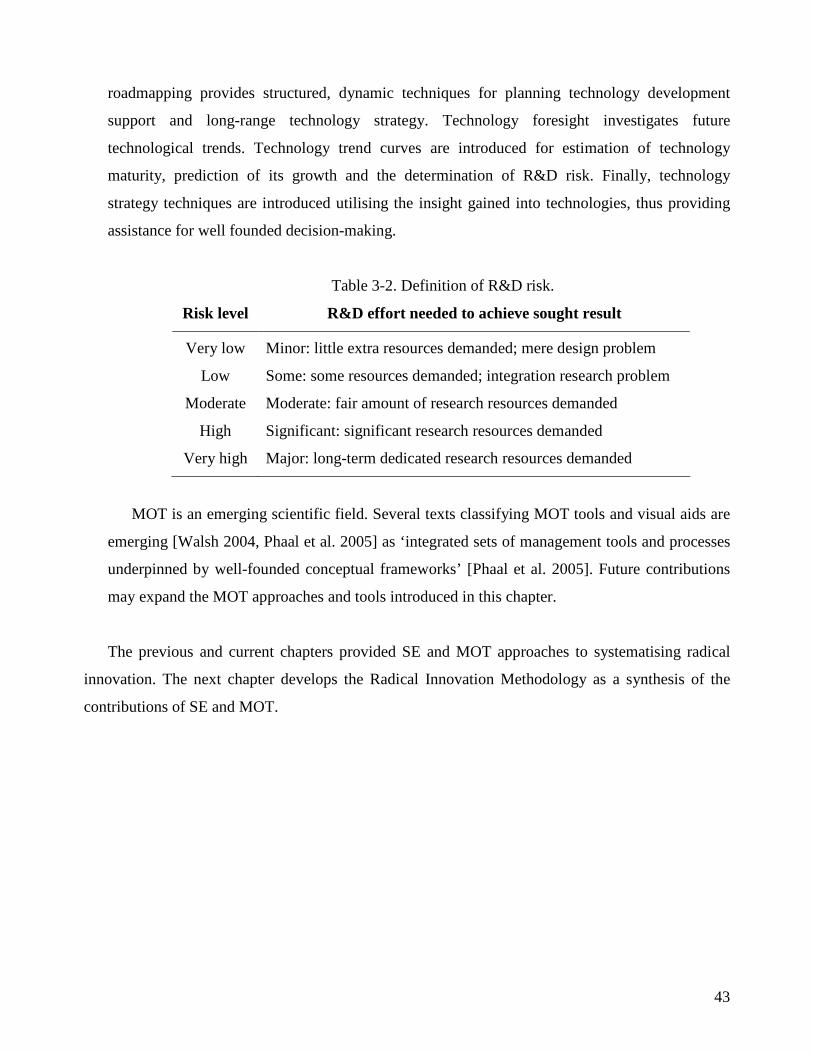
43
roadmapping provides structured, dynamic techniques for planning technology development
support and long-range technology strategy. Technology foresight investigates future
technological trends. Technology trend curves are introduced for estimation of technology
maturity, prediction of its growth and the determination of R&D risk. Finally, technology
strategy techniques are introduced utilising the insight gained into technologies, thus providing
assistance for well founded decision-making.
Table 3-2. Definition of R&D risk.
Risk level R&D effort needed to achieve sought result
Very low Minor: little extra resources demanded; mere design problem
Low Some: some resources demanded; integration research problem
Moderate Moderate: fair amount of research resources demanded
High Significant: significant research resources demanded
Very high Major: long-term dedicated research resources demanded
MOT is an emerging scientific field. Several texts classifying MOT tools and visual aids are
emerging [Walsh 2004, Phaal et al. 2005] as ‘integrated sets of management tools and processes
underpinned by well-founded conceptual frameworks’ [Phaal et al. 2005]. Future contributions
may expand the MOT approaches and tools introduced in this chapter.
The previous and current chapters provided SE and MOT approaches to systematising radical
innovation. The next chapter develops the Radical Innovation Methodology as a synthesis of the
contributions of SE and MOT.

44

45
CHAPTER 4
THE RADICAL INNOVATION
METHODOLOGY
This chapter proposes a generic formulation of the RIM. The argument for “systematising radical
innovation through synthesis of existing theory into a basis for strategic decision-making” (thesis
statement from section 1.2) to form a pragmatic methodology is given in this chapter. The
uncertainties in radical innovation are comprehended using SE principles; required functionalities
are identified and their uncertainties characterised through the description of technological building
blocks using MOT insight. The RIM is formulated as this argument. Each phase is introduced and
discussed through a breakdown of the principles and typical tools contributing to its procedure.
Reference to the organisational roles required for execution of the RIM is provided.
[Note: Where the RIM development refers to previous sections, reference is provided in
brackets. The subsections of section 4.1 are denoted according to the five primary phases of the
RIM, e.g. block 1 in Figure 4-1 is discussed in section 4.1.1, block 2 in section 4.1.2, etc.]
4.1 Formulation of the Radical Innovation Methodology
The RIM is graphically represented in Figure 4-1. The colour codes depict source theory as
follows: red blocks are derived specifically from the systems analysis process, orange blocks are
derived from SE theory while blue blocks are derived from MOT theory.
The central row depicts the primary phases of the RIM of setting up a reference case (marked
with a “1” in Figure 4-1) which is subsequently broken down into its functional systems
hierarchy to identify technological elements (2) deployed in the system. These technologies are
independently augmented or introduced to form alternatives for evaluation of their impact on
system performance (3). Critical technologies are isolated for subsequent assessment of their
characteristics, trends and R&D risk (4), thus to provide information to, in conjunction with the
information on potential performance impact, set up a strategy (5) toward realising the radical
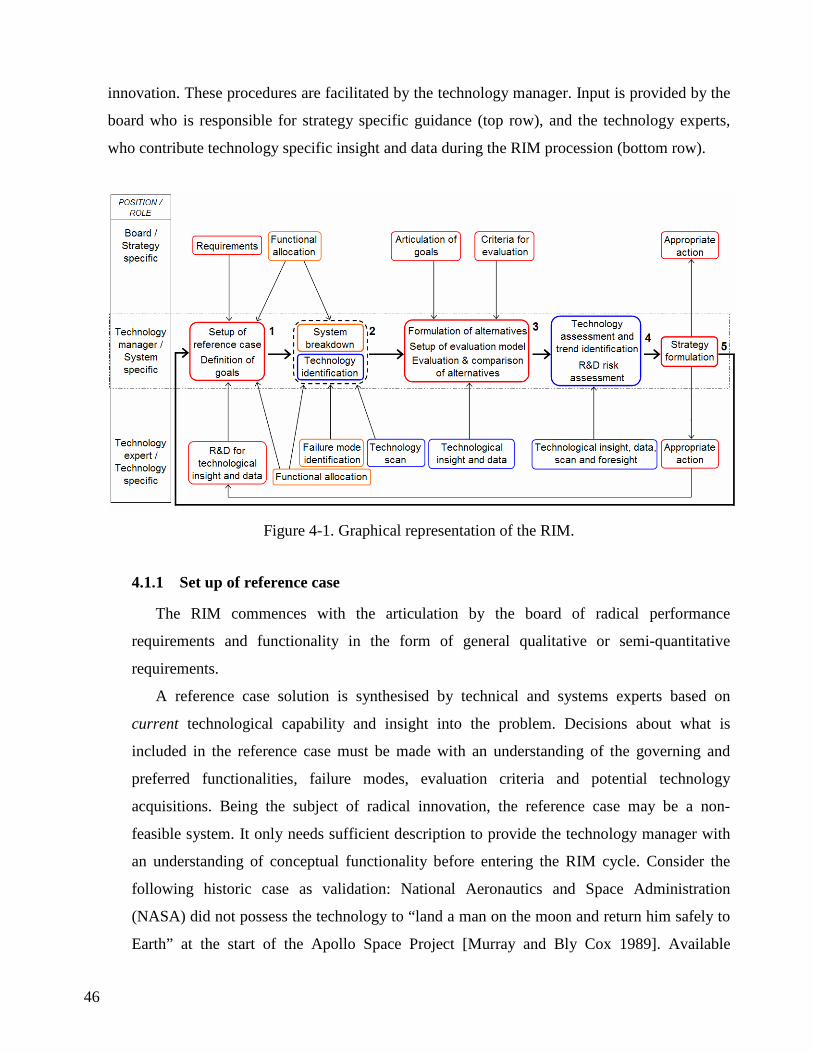
46
innovation. These procedures are facilitated by the technology manager. Input is provided by the
board who is responsible for strategy specific guidance (top row), and the technology experts,
who contribute technology specific insight and data during the RIM procession (bottom row).
Figure 4-1. Graphical representation of the RIM.
4.1.1 Set up of reference case
The RIM commences with the articulation by the board of radical performance
requirements and functionality in the form of general qualitative or semi-quantitative
requirements.
A reference case solution is synthesised by technical and systems experts based on
current technological capability and insight into the problem. Decisions about what is
included in the reference case must be made with an understanding of the governing and
preferred functionalities, failure modes, evaluation criteria and potential technology
acquisitions. Being the subject of radical innovation, the reference case may be a non-
feasible system. It only needs sufficient description to provide the technology manager with
an understanding of conceptual functionality before entering the RIM cycle. Consider the
following historic case as validation: National Aeronautics and Space Administration
(NASA) did not possess the technology to “land a man on the moon and return him safely to
Earth” at the start of the Apollo Space Project [Murray and Bly Cox 1989]. Available

47
technological capability was synthesised into an altogether insufficient system in terms of the
project objectives; the system was sufficient to identify critical functionality requirements
that were subsequently developed to realise the radical objective.
All subsequent development in the current RIM iteration is performed in relation to this
reference case.
4.1.2 System breakdown and identification of technologies
The technology identification phase provides the critical shift in R&D focus from
parametrical, optimising design improvement – as is typical of incremental and dramatic
innovation – to the functional perspective that is essential for solution of radical innovations.
The technology identification phase of the RIM involves the breakdown of the reference case
into its systems hierarchy (section 2.4) as far down the levels as is deemed necessary to
reveal its intrinsic functional components. This functional breakdown asks the questions:
what functionalities are required of the system and subsystems and how do they achieve these
functionalities. Generally, functionalities to resist, mitigate or circumvent extreme actions at
any given phase throughout the system life cycle are required. Failure mode identification
provides the system breakdown with a comprehensive list from which insufficiencies in the
design can be identified and addressed through added functionality. Technology scanning
(section 3.4) identifies technologies that adhere to allocated functionality and mitigate
identified failure modes.
An iterative procedure with communication between the functional allocation, failure
mode analysis and technology scanning is required to define all functional elements of a
complete system hierarchy (section 2.4.4); Figure 4-2 illustrates this relationship toward re-
articulating the reference case from a technology perspective – a technology tree portraying
the company technologies in order for them to identify and understand technology flow and
pro-actively develop R&D roadmaps.
4.1.3 Evaluation and comparison of alternatives
Formulation of alternative solutions
The RIM evaluation and comparison phase determines the potential of technologies
to impact system performance. Alternative solutions do not constitute mere design
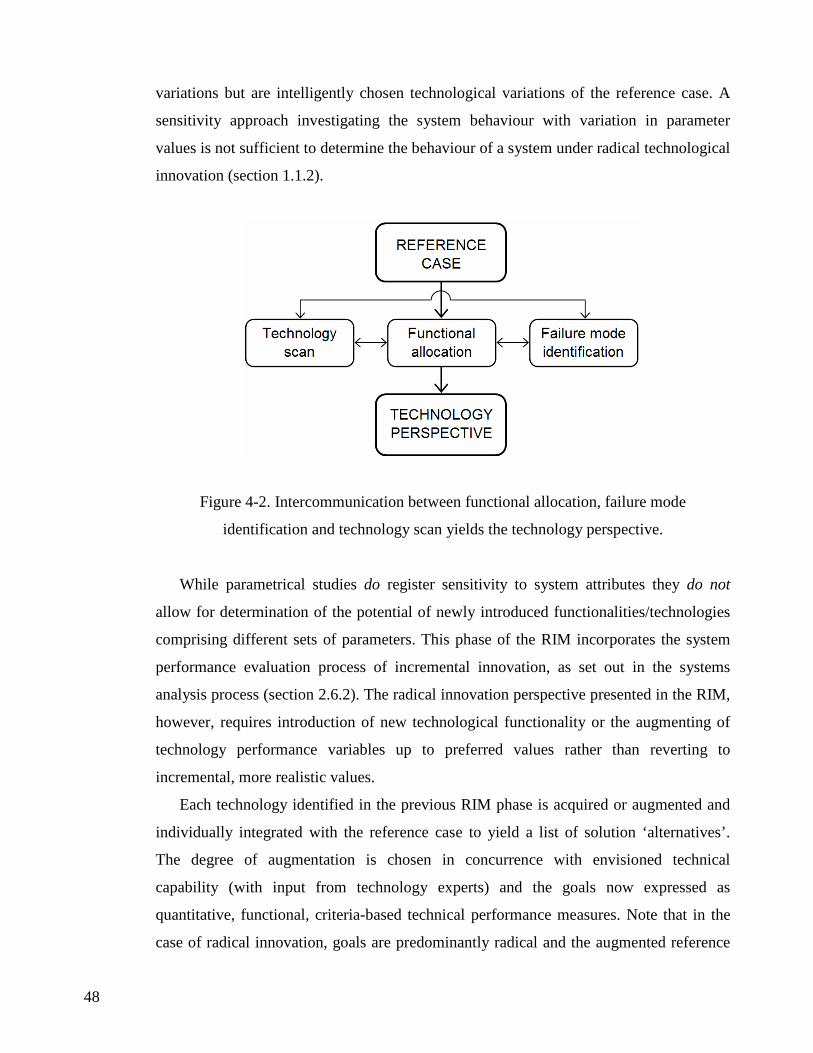
48
variations but are intelligently chosen technological variations of the reference case. A
sensitivity approach investigating the system behaviour with variation in parameter
values is not sufficient to determine the behaviour of a system under radical technological
innovation (section 1.1.2).
Figure 4-2. Intercommunication between functional allocation, failure mode
identification and technology scan yields the technology perspective.
While parametrical studies do register sensitivity to system attributes they do not
allow for determination of the potential of newly introduced functionalities/technologies
comprising different sets of parameters. This phase of the RIM incorporates the system
performance evaluation process of incremental innovation, as set out in the systems
analysis process (section 2.6.2). The radical innovation perspective presented in the RIM,
however, requires introduction of new technological functionality or the augmenting of
technology performance variables up to preferred values rather than reverting to
incremental, more realistic values.
Each technology identified in the previous RIM phase is acquired or augmented and
individually integrated with the reference case to yield a list of solution ‘alternatives’.
The degree of augmentation is chosen in concurrence with envisioned technical
capability (with input from technology experts) and the goals now expressed as
quantitative, functional, criteria-based technical performance measures. Note that in the
case of radical innovation, goals are predominantly radical and the augmented reference

49
case may not readily attain to it. In the case of the technology being new to the system
(i.e. not a parametrical augmentation) the impact of its addition to the system is studied.
Technologies may be augmented by the virtual probing principle – the preferred
outcome – (refer to section 2.5.1), not being realistic by normative performance
standards. This provides insight on how a system responds if a technology could reach
the virtually augmented state of performance. Technology trend analysis could
subsequently comment on the realism of the particular virtual probing.
Set up of evaluation model
An evaluation model is set up in response to evaluation criteria specified by the
board, making sure that all significant performance attributes of the system are
accommodated (section 2.5.2). In radical innovation the model must remain flexible as
knowledge of governing functionalities, failure modes and performance criteria
introduced in new technologies may shift the focus of the problem solution. Where the
evaluation model of incremental innovation evaluates performance in terms of standard
limit state equations, radical innovation requires a more accommodating model in case
technologies from differing fields, with differing governing parameters and equations, are
presented. Decisions during radical innovation should be based on the envisaged benefits
of the preferred state of performance of the technology and the potential resulting market
size.
Multi-criteria decision-making methods (briefly mentioned in section 2.5.3) could
provide decision-making models that capture overall performance trends in response to
technological changes.
Evaluation and comparison of results
Data is gathered to determine the response of each augmented/introduced
technological alternative to the various criteria. It is entered into the evaluation model and
alternatives are evaluated and compared. Alternatives that hold the most potential are
identified, distinguishing the technology portfolio into a spectrum ranging from core to
peripheral technologies. Strategically critical technologies are separated for entrance into
the technology assessment and trend identification phase. Note that although this filtering
to identify critical alternatives could be implemented to maximise resources the entire

50
technology portfolio must be considered during strategy formulation and further
iterations because of the possible change of governing aspects of the concept.
The radicality and magnitude of technological endeavour required to achieve user
defined goals can be grasped during this phase by keeping the radical requirements and
goals in mind. Progress can be measured against these requirements.
4.1.4 Technology assessment, trend identification and research and development risk
This phase of the RIM provides approaches and tools for handling the functional
uncertainties identified in the technology identification phase. In incremental innovation
codified procedure and field theory provide sufficient insight for the development process;
radical innovation does not have this luxury – the uncertainties are functional in nature and
not necessarily parametrical. Technologies identified to hold significant potential to improve
system performance are assessed in terms of their technological attributes and growth trends;
technology trends are also identified to establish growth tendencies and maturity of the
technology. The R&D risk associated with development of an individual technology must be
assessed before the formulation of technology strategy.
Technology characterisation and classification
The critical technologies are characterised (section 3.3.1) and classified (section
3.3.2) with the aid of the MOT tools to gain insight into the inherent attributes of internal
technologies and their relative proximity to other technologies in the technology
landscape. Technology scanning could identify similar technologies; their benefit and
acquisition must be considered (section 3.4).
Technology trend identification
Technology trends are investigated to determine which technologies promise the most
potential for increasing system performance. A technology that is emerging or growing
contains inherent potential and must be distinguished from mature or aging technologies
that do not promise significant breakthrough contributions (section 3.6.1). If technologies
that are critical to the system are mature the prospect of scanning for younger substitution
technologies could be considered.
Technology foresight methods aid technology trend identification; it could be
particularly integral in radical innovations by aiming to predict future trends, thus pro-
51
actively, strategically engaging future problems with radical solutions (section 3.5).
Foresight by multi-disciplinary experts could qualify the probability of a technology
actually growing at the determined direction and rate.
The Cascade of Technological Trends determines the current level of development of
a technology, furthering the technology trend information by predicting the typical future
focus for technology R&D.
R&D risk assessment estimates the risk associated with R&D to bring technologies to
required performance levels.
4.1.5 Technology strategy formulation
The strategy phase of the RIM considers all alternative evaluation data and technological
knowledge from the previous RIM phases. Where, during incremental innovation, strategic
decisions are made with business sense based on insight into financial models, R&D risk
models and short to medium terms time frames, radical innovation decision-making utilises
SE and MOT insight gained during the previous chapters. This provides knowledge and
insight into potential performance improvement of the system as well as into the potential of
realising required technological performance levels.
Knowledge of the impact of technologies on system performance combines with
knowledge of the potential for and probability of technological improvement to integrate into
a knowledge basis for strategising an optimised radical innovation R&D roadmap. The
functional, technology-based perspective on radical innovation guides board decisions
through a systems perspective and insight into the potential of the technology portfolio.
Consequent technology priorities are articulated to the R&D facilities of the company
through re-allocation and prioritisation of resources for further R&D and subsequent re-
introduction to the system (section 3.7).
During the formulation of technology strategy, interaction with several non-technical
parties, such as financial executives or investors, require efficient communication of
technological information. This can be achieved through the active visualisation of results
(section 3.7) and use of common terminology (section 3.3.1) for their comprehension of
technology-based business or problem solving potential.

52
4.2 Radical Innovation Methodology dynamics
4.2.1 Insight, not rules
The RIM does not propose a series of rules to be followed painstakingly in order to
determine the optimal radical innovation R&D path, but should primarily be used as a means
of gaining insight into the system and potential for its improvement. The methodology can be
customised or re-configured to be optimally applicable to specific radical innovation projects.
The RIM does not necessarily result in discrete results and strategy, merely providing insight
into system technologies; technologies can often be obscure or indefinable.
4.2.2 Repetition and iteration of the Radical Innovation Methodology
The RIM approach and principles, being generically applicable, could be repeated or
incorporated in the radical innovation design process as often as is deemed necessary,
refining the solution and subsequent strategy with every iteration. As uncertainty diminishes
more detailed functionalities, corresponding technologies and criteria are sought [Blanchard
and Fabrycky 2006] up to the stage where the R&D is manageable through established
incremental innovation frameworks.
Iterative implementation of the RIM approach makes for an improved understanding with
each cycle. The insight in one RIM iteration may spark insight in other aspects of the system
– in complex systems, where technologies form part of an integrated whole, understanding
one technology brings forth understanding of another.
During radical innovation, funding has to be justified and secured for the next iteration
development cycle. The RIM could be applied to strategically motivate such project funding.
4.2.3 Educated guessing in radical innovations
Resources for technological R&D are limited; hence, conclusive information on radical
innovation issues is not always available. In radical innovations, where ideas may be too
radical to be acceptable in standard academic publications, one sometimes has to resort to
expert opinion and intuition to gather data on a technological subject. This may be
unpublished, unofficial information.

53
4.2.4 Generic applicability of the Radical Innovation Methodology
The RIM, being defined as a generic methodology, could be customised for numerous
other radical innovations, for example linking a computer and a human brain or even a
managerial challenge like HIV/AIDS management efficiency. The functional, problem-
solving perspective on innovations, proposed by the RIM, takes a step back to identify the
problem-system or the system of which the problem forms a part. Gaps and uncertainties are
delimited from the functional systems breakdown and functions required for addressing these
gaps are stated, answering “what” nature of functionalities are required to ensure success.
The impact of augmented or ideal performance improvement of the uncertainty is evaluated
to identify critical elements in the system. These elements are characterised and classified in
terms of broader, related elements. They can be assessed in terms of their potential for
realising the sought improvement by investigating the potential of developing their current
state up to the sought, preferred state. Strategy is formulated by integrating the ideal
improvement measures and the potential of realising these ideals; a priority list of critical
technologies is set up. Resources are re-allocated to address the development of critical
functionalities.
The author is of the opinion that the functionality perspective proposed by the RIM could
encourage decision-makers faced with any radical challenges to rethink problem solution
from a functional, problem-solving focussed perspective. This could replace the incremental,
relative perspectives that results in incremental, relative results that are often used during
innovation.
4.3 Critical role-players during the Radical Innovation Methodology
Technology managers, the company board and technology expert roles are differentiated in
this section to illustrate their critical interaction during the RIM. Figure 4-1 depicts these three
levels as differentiating technology managing (systems oriented (central row)), board (strategy
related (top row)) and technology expert (technological detail related (bottom row)) events.
4.3.1 The role of the technology manager
The technology manager facilitates the five core phases of the RIM as they are stipulated
in the introduction to section 4.1. His main role in the RIM entails establishing a systems

54
perspective on the innovation in order to identify functional gaps; and the subsequent
investigation toward filling in these gaps through application of MOT. The technology
manager is not an expert in any specific technological field; his expertise lies with the
technology management processes, having a perspective on understanding systems and
overviews. Note that the technology manager is not necessarily the project champion, i.e. the
person responsible for commitment and drive to realise radical solutions, but merely
facilitates the RIM. The technology manager is trained in MOT methods thus performing the
assessment and trend identification phases of the RIM in conjunction with experts. A
summary of all relevant technological information can be compiled containing visualisations
for presenting information. This provides the board with a comprehensive systems and
technological perspective on radical innovations; hence efficient strategy can be formulated.
The technology manager possesses skills that enable the gathering of data concerning the
phases of the RIM. He must know to ask the board and technology experts questions that are
strategically aimed at acquiring adequate, relevant, useful data for efficient incorporation into
the RIM phases to highlight critical aspects and issues of the radical innovation.
The extensive focus on and use of tools available to the technology manager may hinder
the flow of the RIM while essential, governing technological characteristics still run the risk
of passing by undefined, uncomprehended or un-recognised. The focus of the technology
manager must rather be to aim to understand the system and the synthesis of its technologies
through the optimal implementation of appropriate techniques and tools. The technology
manager must consult expert knowledge instead of aiming to understand every technical
aspect of the radical innovation; expert insight remains the most invaluable and efficient
source of technological and systems comprehension.
The board trusts the technology manager to diffuse the company strategy into R&D
priorities [Roussel et al. 1991]. Technology experts work closely with the technology
manager, trusting him to represent their capabilities and the technology development status in
the boardroom.
4.3.2 The role of the board
The board is responsible to deliver the requirements baseline for reference case synthesis.
These requirements provide insight in the functionalities and technical performance measures
needed to realise the radical innovation. Furthermore, it provides information on the

55
evaluation criteria as specified by the user for incorporation in the evaluation model. Upon
receiving information on technology evaluation, comparison, assessment, trend and R&D
risk, the board plays an integral role in the formulation of strategy, aligning technology
potential with the priorities of the company. Resources are then re-allocated according to
technological priorities.
4.3.3 The role of the technology expert
The technology expert serves the technology manager and the radical innovation with
specific technical insight and contribution. R&D is performed to formulate a representative
reference case. Close conference with the technology manager is critical in order to
incorporate all governing facets for user satisfaction as specified by the board. Functionality
and failure mode information is provided for the setting up of the systems hierarchy and
technology tree. Further, the proximity of the technology expert to the technology field and
peripheral landscape leaves him the best equipped to perform a technology scan in search of
similar or substitute technological solutions. During the technology assessment and trend
identification phase, the technology manager and expert collaborates to gather data for the
description of each critical technology. R&D risk is described by the expert in the particular
technology. After strategy formulation the technology expert receives and diffuses the re-
allocation of resources and R&D focus, developing technologies toward an improved next
iteration reference case.
4.4 Conclusion
This chapter introduces and formulates the RIM, concluding Part I of the dissertation. It
distinctly discusses each phase of the RIM showing how it applies to systematising radical
innovation and characterisation of its uncertainties and required functionalities. Technology
managers, the company board and technology expert roles are differentiated, illustrating their
critical interaction.
A theoretical solution to the argument of the thesis as stated in section 1.2 is formulated. A
systematic approach to form a basis for strategic decision-making in radical innovation is
synthesised from established SE and MOT theory.

56
Part II of the dissertation commences in the next chapter. It aims to provide validation of the
premise of the RIM through its application on the Solar Chimney Power Plant chimney structure,
i.e. to formulate R&D strategy for radical innovation of the chimney toward realisation.

PART II
VALIDATION OF
THE RADICAL INNOVATION METHODOLOGY –
APPLICATION TO THE SOLAR CHIMNEY POWER
PLANT CHIMNEY STRUCTURE

58

59
CHAPTER 5
SOLAR CHIMNEY POWER PLANT
CHIMNEY BACKGROUND, CONCEPT
AND SHORTCOMINGS
"Therein is the tragedy. Each man is locked
into a system that compels him to increase his
herd without limit—in a world that is limited.”
- Garrett Hardin
With the turn of the millennium mankind is faced with immense challenges. Global crises range
from famine and water shortage to sanitation and pandemics to energy wars. Climate change – a
major 21st century global challenge – is the term circumscribing the actions and symptoms of a
planet in disequilibrium. The actions: significant irregularities in global and local climate patterns.
The symptoms: tremendous economic loss [Stern 2006], famine and human death. The cause: non-
sustainable development [IEA 2003].
But every challenge presents an opportunity. Mankind must think outside the confines of
incremental, relative, standardised problem solution; he must radically innovate. Massive
breakthroughs should be realised in order to stand up to these challenges, to present pro-active,
outside-the-box, sustainable solutions to relieving misery, preserving Earth and saving human lives.
This chapter proposes the Solar Chimney Power Plant (SCPP) as one potential solution – a
technology for generating clean electricity. The SCPP comprises a solar collector, turbines and a
chimney of significant dimensions; only with an economy of scale may the plant achieve current
market competitive costs. The proposed height for the chimney of 1,500 meters, places it far outside
current Structural Engineering norms. Radical innovation is required.
The chapter commences with a formulation of the incentive for clean energy generation,
stipulating the requirements for a solution. The SCPP is introduced as a potential solution and a
conceptual design within constraints of current engineering knowledge and capabilities – but with
significant uncertainties – is proposed as a reference case for application of the RIM. Uncertainties

60
in the design and theoretical background are identified and related to the ideal solution, hereby
grasping the extent of the required innovation.
5.1 A contemporary context for radical innovation
The following section provides the context from which the drive for greatly improved system
functionality (standard or non-standard and radical) ensues. Global and South African incentives
for the innovation of clean energy technologies form the context from which requirements for its
efficient innovation are formulated. These create a favourable environment for radical
innovation.
5.1.1 Climate change and global energy trends
Climate change and the demise of oil
The global phenomenon of climate change, said to be caused partially by excess
Greenhouse gasi (GHG) emissions from human activity [IEA 2003], is causing an
increasing number of irregularities in climate patterns leading to various adverse effects
including human death, famine and immense economic loss [Stern 2006]. Critics of
climate change ascribe its phenomena to the fluctuations that are perceivable throughout
Earth’s history [An Inconvenient Truth 2006]. Whichever way, mankind is to pursue a
sustainable relationship with his surroundings – erratic consummation of the Earth’s
resources is not sustainable and cannot be pursued as standard behaviour [(based on)
Hardin 1968]. Various mitigative measures including policy adaptation, realisation of
economic mechanisms and public awareness aim to reverse the adverse impact of human
activity.
An associated shock to global economies is the actual diminishing of oil resources as
predicted in literature [Grove 1974, Deffeyes 2005], believed to be a driving force behind
soaring, fluctuating prices of oil markets over the past yearsii [Renewable Energy World
2007]. The world is “addicted to” [US State of the Nation address, 2006] a resource that
is, almost daily, becoming more expensive. i Greenhouse gases are components of the atmosphere that contribute to the “greenhouse effect”. An excess of these gases is the main activator of adverse climate change [IEA 2003]. ii During the final stages of compiling this document (early 2008) the oil price in the United States had risen to more than five times its value at beginning 2002.

61
Sustainable energy generation and clean energy ethics
Climate change and ramping oil prices are gradually shifting the focus of global
planners and technologists toward more efficient, conserving, sustainable ways of
generating and managing energy [Deffeyes 2005]. Furthermore, poverty stricken
countries lack domestic energy generation while energy supplicating technologies are key
to their upliftment from the “trenches” of limited access to economic opportunity,
education, information and healthier livelihoods [United Nations 2005, Schlaich 1999].
Dealing with energy in a sustainable manner testifies of a long-term, stewarding
relationship with the Earth – a truly sustainable approach toward maintaining ourselves,
our neighbours and our surroundings.
Growth in the renewable energy industry
Environmentally aware energy markets are desperate for sustainable, economically
viable energy solutions but economic inertia strain the immediate inception of renewable
energy technologies. The cheapiii energy technologies generally have high pollution
levels while clean energy technologies are generally expensive. In spite of their relatively
high costs several clean energy technologies are emerging through a global energy
“market pull” due to increasing environmental awareness. Increasingly large investments
for capacity installation, R&D to decrease the cost of clean energy technology and
formulation of supporting policies are observed globally. More than $66Bn was invested
in 2007 in new renewable energy capacity worldwide (see Figure 5-1), up from $30Bn in
2004 [Renewable Energy World 2007]. Proponents of solar thermal electric technologies
predict around 300% decrease in generation cost within the next 15 years. Half the cost
reductions are based on performance R&D but the other half is attainable through
scaling-up to larger plant sizes and volume production effects [Pitz-Paal et al. 2003;
Schlaich 1999; Mail and Guardian 2008a]. This can boost renewable energy technologies
to a state of competitiveness with conventional energy generation technologies.
iii Note that the cost of conventional energy production appears low because it seldom incorporates consequential life cycle costs such as pollution and environmental degradation; more realistic, long-term models include these costs yielding higher values.
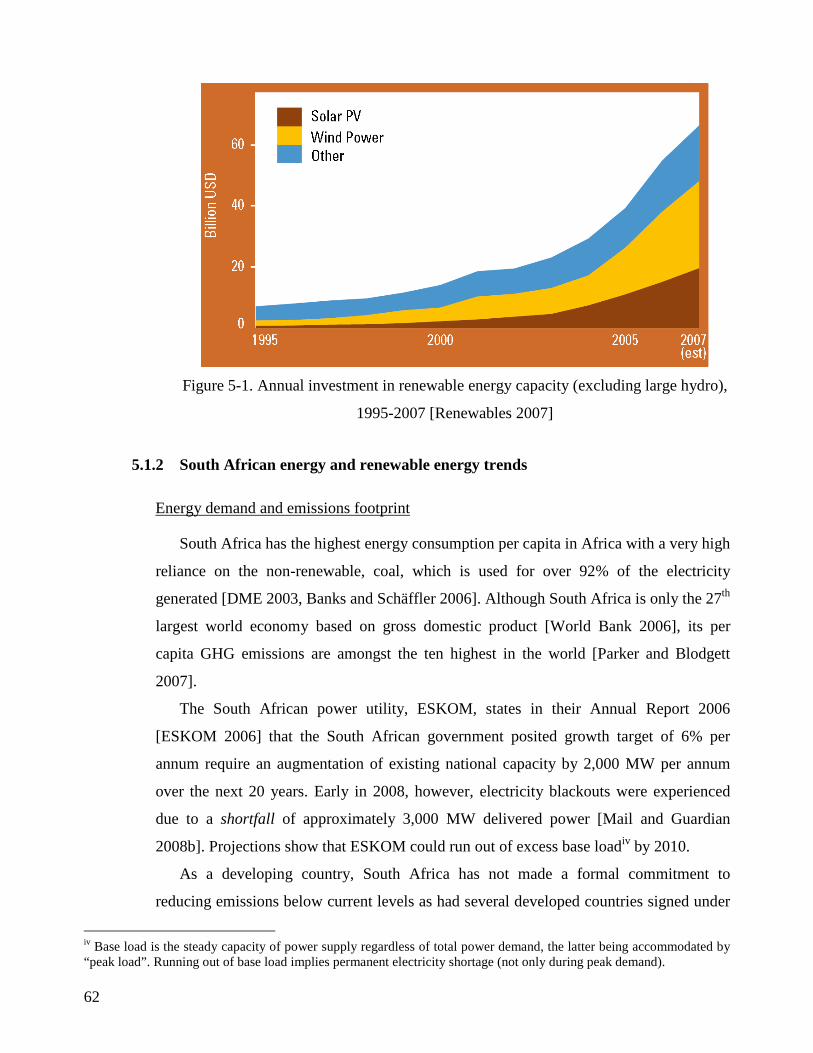
62
Figure 5-1. Annual investment in renewable energy capacity (excluding large hydro),
1995-2007 [Renewables 2007]
5.1.2 South African energy and renewable energy trends
Energy demand and emissions footprint
South Africa has the highest energy consumption per capita in Africa with a very high
reliance on the non-renewable, coal, which is used for over 92% of the electricity
generated [DME 2003, Banks and Schäffler 2006]. Although South Africa is only the 27th
largest world economy based on gross domestic product [World Bank 2006], its per
capita GHG emissions are amongst the ten highest in the world [Parker and Blodgett
2007].
The South African power utility, ESKOM, states in their Annual Report 2006
[ESKOM 2006] that the South African government posited growth target of 6% per
annum require an augmentation of existing national capacity by 2,000 MW per annum
over the next 20 years. Early in 2008, however, electricity blackouts were experienced
due to a shortfall of approximately 3,000 MW delivered power [Mail and Guardian
2008b]. Projections show that ESKOM could run out of excess base loadiv by 2010.
As a developing country, South Africa has not made a formal commitment to
reducing emissions below current levels as had several developed countries signed under
iv Base load is the steady capacity of power supply regardless of total power demand, the latter being accommodated by “peak load”. Running out of base load implies permanent electricity shortage (not only during peak demand).

63
the Kyoto Protocol [UNFCCC 2003]. It is anticipated that pressure from governments,
civil society and consumers of South African goods will grow and persuade South Africa
to commit to GHG reduction targets inducing economic incentive to invest in clean
energy technologies. Together with energy shortages this challenge presents significant
opportunities for energy diversification through the implementation of renewable energy
technologies.
South African renewable energy resource, industry and targets
South African wave and wind energy resources are moderate compared to the best
sites in the world while the solar resource in the north western regions of the country rank
amongst the highest in the world [DME 2003] (Figure 5-2). Although solar energy
currently contributes insignificantly to the national electricity pool one South African
energy scenario predicts solar thermal electric technologies to contribute almost 25% of
the domestic energy generation pool by 2050 [Banks and Schäffler 2006].
In anticipation of pressure on the national power generation capability and the global
push toward clean energies, the South African government set a target of 10,000 GWh of
electricity to be produced by renewable energy by 2013 [DME 2003] including the
installation of solar thermal electrical power plants with a total capacity of 300 MW
[NER 2004].
Figure 5-2. Global solar radiation [Solar Millennium 2004].
64
5.1.3 An incentive for radical renewable energy technology innovation
These ethical and economical issues (discussed in sections 5.1.1 and 5.1.2) are creating
incentive for ventures outside normative design. Familiar, incremental innovation practice is
found limiting or depleted – inadequate to provide the measure of change required to mitigate
ensuing challenges. It does not deliver a sufficient approach for managing progress to
accommodate the developmental jumps demanded to mitigate the challenges. Engaging
radical innovation, with its higher threshold of uncertainty, can be motivated more easily.
Uncertainties that were previously perceived as intolerable are now engaged, being motivated
by the greater return on investment (or even necessity) that the realisation of radical
innovations promise.
Pressure to generate clean energy and the global oil-based energy crisis presents
unprecedented opportunities for the development of alternative energy generation
technologies. Clean, non oil-using, cost-effective solutions are sought. Where, previously,
extensive innovation of these “new” functionalities was overlooked in the light of
economical performance, the drive for their realisation can now be justified.
Significant political and economical drives for clean energy innovation are currently
present in most countries, also South Africa, cultivating environments for radical innovation.
The global renewable energy industry is expectant for radical breakthroughs to “change the
game” (refer to section 1.1.1) of the global energy industry in the next decades.
The RIM is applied on one such a radical clean energy concept – the SCPP. A systematic
approach to the radical innovation is needed to overcome its immense structural and costing
challenges. This may elevate the concept to a prime candidate for harnessing the clean
energy provided by the sun.
5.2 The Solar Chimney Power Plant chimney reference case
The SCPP is a solar power plant that produces clean energy and does not need a continuous
supply of cooling water [Schlaich 1995] making it a unique “cluster” energy generation
technology since solar radiation rich regions often suffer from water shortage. It could contribute
to mitigation of the climate change crisis if developed up to a state of structural integrity and
financial feasibility.

65
5.2.1 Chimney operating principle and required dimensions
A SCPP system, illustrated schematically in Figure 5-3, consists of a transparent circular
collector system, typically from glass or plastic, supported relatively low above the ground
surface. Central to the collector is a tall chimney system with a power conversion unit located
at its base. Solar radiation penetrates the collector roof and heats the ground beneath which in
turn heats the adjacent air. Hot air rises through the central chimney driving turbines which
generate electricity [Schlaich 1995].
An economy of scale applies to the SCPP. The energy generating performance of the
system greatly depends on the magnitude of the dimensions of the chimney because the
driving force that causes air to flow through the system is a function of the pressure
difference between a column of cold air outside and a column of hot air inside the chimney
[Pretorius et al. 2004]. The energy output of the power plant increases exponentially with
increase in chimney size – see Figure 5-4. A 1,500 meter tall chimney yields three times the
energy of a 750 meter tall chimney annually.
Over the history of the SCPP several proposals were made with regards to its optimal
dimension configuration, mainly based on estimations by Schlaich et al. [2004b]. More
recently Pretorius [2007] published design sheets that provide energy output for various
power plant dimensions.
Figure 5-3. Schematic representation of the SCPP [Schlaich 1995].

66
Figure 5-4. Annual energy production by the SCPP for various plant configurations
[Schlaich 1995].
A demand for an output of 200 MW peak generation capacity was proposed for the
design of a SCPP to be situated in the sun-rich Northern Cape, South Africa [Stinnes 1997].
The proposed geometry of this SCPP system comprises a 6,900 meter diameter collector with
a 1,500 meter tall chimney shell, 160 meters in diameterv [Van Dyk 2004]. These output
values and dimensions express semi-quantitative requirements governing early
conceptualisation.
5.2.2 Reference case set up
The reference case is chosen in the midst of R&D activity; hence it is difficult to
determine which R&D state is the best representation of a typical chimney structure. The
range of conceptual proposals for the solution of the chimney is summarised and background
v The dimensions provided here, and that was also used in the Van Dyk [2004] study, are based on unpublished correspondence with the University of Stellenbosch Solar Chimney research group during early stages of research on the SCPP performance. Recent research results show these dimensions to yield peak power of 275 MW [Pretorius 2007]. Schlaich [1995] predicts a much higher peak.

67
for the choice of reference case is provided. The reference case is subsequently chosen.
Geometry and actions for the reference case are specified based on knowledge available at
the time of reference case synthesis.
Conceptual proposals in realising the chimney
A chimney is defined as “a vertical flue that provides a path through which air or
smoke is carried away” [Webster 2008] implying the realisation of a sustained through-
flow channel. The SCPP requires a simple, large diameter hollow cylinder that is not
particularly slender and subject to very few user demands in comparison with inhabited
buildings [Schlaich et al. 2004b]. A few concepts are proposed for fulfilment of this
definition.
Schlaich et al. [2004b] proposes a freestanding reinforced concrete chimney as the
optimal solution and mentions guyed tubes with corrugated metal sheet walls and cable-
net designs with cladding or membranes as alternative concepts.
Another concept, the Floating Solar Chimney, comprises successive aluminium-
supported balloon rings, inflated with a lighter-than-air gas (NH3, He) making the
structure buoyant. It promises a chimney height increase by a factor of three, increasing
peak power output by 350%, and a significant decrease in cost [Papageorgiou 2004]. This
concept is not wind-resistant but deflects significantly under strong winds. Energy
generation capacity decrease temporarily, but as the wind subsides the structure and
energy yield return to its normal state.
The Atmospheric Vortex Engine concept [Michaud and Michaud 2006] replaces the
chimney functionality by the centrifugal force of a vortex of warm buoyant air
manufactured by ‘steam injectors’. The vortex height could extend into the lower
troposphere (10-15 kilometers) resulting in a high plant efficiency. The solar collector is
replaced by naturally heated surface air. Dismissal of both the chimney and collector
structures decreases costs substantially.
Note that no concepts of significant height have been realised; a 200 meter tall, cable
stayed, metal sheet chimney was constructed as a SCPP pilot plant in 1981/82 [Schlaich
et al. 2004a].
A choice must be made from the array of concepts as well as variations within the
concrete concept.

68
Background for the choice of reference case
The concept that is characterised the most thorough at the stage of determination of
reference case is chosen in order for the RIM to start with less uncertainty than other
concepts would contribute. The reference scientific context is preferred within roughly
familiar boundaries to allow useful, illustrative application of the RIM and less diversion
to acquisition of expert knowledge. (Technology experts instigate technology acquisition
but their expertise is gained through significant resource expenditure, something that this
study cannot hope to emulate. Only limited expert resources were available. These had to
be used sparingly and efficiently, in this case, on validating the RIM rather than solving
the SCPP problem. Note that this does not imply that acquisition of radical technologies
was not considered in this application.)
The reference case entering the loop of the RIM, being the subject of radical
innovation, may be a non-feasible system (section 4.1.1). Being a radical innovation it
still requires significant technological improvement to achieve a state of feasibility.
The choice of chimney reference case
The concept solution chosen in this dissertation is limited to that of the self-
supporting reinforced concrete structure, as is utilised by Schlaich [2004b]. The
reinforced concrete concept, as it is currently defined, is not a feasible solution by
conventional Structural Engineering standards [based on Van Dyk 2004]. The other
concepts are dismissed because of high uncertainties associated with their unfamiliar (to
the author, who partially fulfilled a role as an expert in this study) technological
environment in order to remain within more familiar technological boundaries. This
enables the current RIM application to draw off South African expertise and resources
(Note that although South Africa also has a well established steel industry, steel-based
SCPP chimney concept(s) was not investigated up to the commencement of this study;
hence it was decided to remain within the more familiar technological environment.).
South Africa has an established reinforced concrete industry and academic fraternity.
Numerous thin shell reinforced concrete chimneys have been constructed in the country.
South African industry is well connected to international expertise in this field.
Furthermore, the reinforced concrete concept would presumably be cheaper in South

69
Africa than the higher technology steel-net, cable, membrane and vortex concepts due to
higher acquisition and construction costs required by these higher tech concepts.
Thus the RIM application and validation – the priority subject of Part II of the
dissertation – need not be distracted by resources spent on familiarisation with
technology specific issues but can be enhanced by convenient access to technological
information and proximity to cutting edge technology.
Knowledge base during reference case set up
A knowledge basis based on interaction with Structural Engineering experts and
completed introductory research further support the reference case that is proposed in this
chapter.
Commercial secrecy forced the University of Stellenbosch Institute for Structural
Engineering (US-ISE) to engage independent research on the chimney with the only
guidance contained in publications by long-time developers of the concept, Schlaich
Bergermann und Partner [SBP 2004, Schlaich 1995, 1999 and Schlaich et al. 2004a,
2004b]. Publications state structural feasibility of the chimney based on the introduction
of circumferential cable stiffening, “bicycle wheel” systems at several levels inside the
chimney to stabilise the structure and reduce material volume. Schlaich concludes that
“perhaps the spoked wheels [the bicycle wheels]... are the only really new feature of solar
updraft towers [SCPP’s] compared to existing structures” [Schlaich et al. 2004b].
A scoping study on the chimney structure [Van Dyk and Van Zijl 2002] identified
key areas for further researchvi. Follow-up research addressed the chimney-foundation
interaction [Van Dyk 2004, Van Dyk and Van Zijl 2004], the study of dynamic effects of
the chimney [Rousseau 2005, Harte and Van Zijl 2007] and mitigation of resonance
inducing behaviour [Alberti 2006, Harte and Van Zijl 2007, Van Dyk et al. 2006].
Measures for the improvement of the structural performance [Schindelin 2002, Sawka
2004, Alberti 2006] and cost [Van Dyk 2004] were proposed, including circumferential
and longitudinal stabiliser configurations. Reinforcement placement, wall thickness re-
configuration [Lumby 2003], the circumferential stiffening structures [Lourens 2005],
vi Erratum: In Van Dyk, C. & Van Zijl, G.P.A.G. (2002) Solar chimney: improving the concept, Proceedings for International Association for Shell and Spatial Structures Conference in Warsaw, Poland, June 2002: the first global eigen-mode is reported to occur at 0.3133 Hz. This value is erroneous and should be 0.1 Hz.
70
thermal loading on the chimney shell [Nel 2005] and cable stayed chimney stiffening
[Fraser 2006] were also investigated in introductory R&D efforts.
Of this research some conclusive results contribute to the reference case. Inconclusive
research, having been identified and characterised (although only in part) by technology
experts, can be incorporated as technology alternatives in the RIM. The US-ISE research
adds much insight into the mechanisms surrounding the chimney but several major issues
remain to be addressed. The structural feasibility claim made by Schlaich et al. [2004b] is
yet to be confirmed being subject to the major uncertainties that constitute the radicality
of this concept.
Reference case geometry
The proposed chimney geometry is based on collaborations (of which some results
are unpublished) between the US-ISE and the Bergische Universität Wuppertal Statik
und Dynamik der Tragwerke (BUW-SDT) in Germany.
The chimney comprises a 1,500 meter tall, 160 meter diameter chimney tube
constructed from thin shell reinforced concrete. The reference case location, on which all
climate and action data is based, is chosen as Sishen, a mining town in the Northern
Cape, South Africa. A dimensioned illustration of the chimney reference case also
depicting the approximate geometry and location of the circumferential stiffening
systems (bicycle wheel ring stiffeners) is provided in Figure 5-5a together with the
chimney-to-foundation transfer system (Figure 5-5b) and a section through this transfer
system (Figure 5-5c). The cylindrical reinforced concrete shell starts from an elevation of
125 meter (as seen in Figure 5-5c) to allow for optimal air through-flow area below this.
It extends to the tip, elevated at 1,500 meter above ground level. The cylindrical shell
thickness decreases linearly from a thickness of 1.95 meters at 125 meter to 0.3 meters at
1,000 meter elevation from where it remains constant up to the tip. Axial and flexural
forces are transferred to soil level through 36 fin-like structures (Figure 5-5b) connected
to 36 columns directly below the shell. The solid cylindrical reinforced concrete columns
stand 350 meter tall and are 10.7 meter in diameter; the fin-stiffeners stand 350 meter tall
with a toe length of 160 meters at ground level and a width of 2 meters. Six
circumferential stiffening systems are placed at regular 220 meter intervals from the
71
chimney top, i.e. at 400, 620, 840, 1,060, 1,280 and 1,500 meter elevation (see Figure 5-
5a).
The proposed foundation structure consists of 18 rectangular reinforced concrete
beams, each 160 meters long, 0.5 meters broad and 2.5 meters deep, supporting each fin
and column.
The Finite Element Method (FEM) model based on this geometry and used for
numerical analyses in this study is presented in Appendix A.
Actions
The main actions working on the chimney are gravity and wind load. Operational and
maintenance load associated action is considered to be negligible. The proposed region
for the implementation of the SCPP shows negligible seismic action; hence no earthquake
effects are included in the reference case. Research on the effects of thermal action on the
1,500 meter tall chimney [Nel 2005] determined that the impact of the extreme thermal
load case is small relative to the gravity and wind action (a numerical analysis determined
it to contribute to approximately 0.04% of the overall buckling factor); damaging thermal
cracking in concrete is assumed to be resisted by detail reinforcement design.
The wind loading model used in the reference case is provided in detail in Appendix
B. A gravity acceleration of 9.81 meters per second squared is assumed. The change in
this value due to an elevation of 1,500 meter is negligible.
5.3 Definition the Solar Chimney Power Plant chimney development as radical
innovation
With the reference case defined, this section provides quantitative and qualitative
descriptions of its shortfall and uncertainties relative to an ideal (feasible) structure, thereby
providing a measure of its radicality. During the initial phases of the RIM, qualitative
performance measures are specified. In the SCPP chimney case these measures constitute the
need for clean, non-oil based, cost-effective energy generation for South Africa. Re-articulated in
terms of the SCPP concept quantitative performance measures are specified. A peak power
output of 200 MW requires a 6,900 meter diameter collector and a 1,500 meter tall, 160 meter
diameter chimney.

72
Figure 5-5. a) Dimensioned illustration of the chimney. b) transfer-to-foundation
system. c) chimney cylinder depicted in blue construction lines.
The currently proposed SCPP chimney, synthesised from standardised theory and practice,
presents significant shortfalls from entering the market for economically competitive energy
generation technologies. Current practice fails in delivering the sought levels of performance
improvement. The investigation beyond these standard technological levels – radical innovation
– must be engaged to break through to higher levels of user satisfaction. The current section
(section 5.3) investigates the radicality of the structural behaviour of the reference case proposed
in section 5.2.2, i.e. a description of the main uncertainties from a structural perspective. It is also

73
compared to trends of realised structures in industry. Its electricity costs are compared to those of
South African and international power utilities.
A perspective on what is required of the radical innovation provides rudimentary goals for
the first iteration RIM toward achieving feasibility. More detailed quantitative descriptions can
be defined in response to functional technological goals as they are identified during the
technology identification and evaluation phases of the RIM, and in further iterations. Detailed
shortcomings in the design and theoretical background must be identified at these further stages
and related to the ideal solution, hereby delimiting and quantifying uncertainty in the innovation
in increasing detail.
5.3.1 Structural challenges
SCPP chimney specific uncertainties and shortfall
The 1,500 meter tall SCPP chimney concept presents several major technical
uncertainties. Knowledge and insight into these form an important guide to structural
realisation. The main uncertainties in scientific theory are:
• The applicability of the current mathematical formulation of a wind extrapolation
model.
• The uncharacterised local wind direction variations over the height of the tall
structure [Rousseau 2005].
• Wind around the chimney almost always enters the trans-critical flow regime due
to its large diameter and the relatively high wind velocities. This flow regime is
under characterised due to physical limits in experimentation leading to
uncertainty in determination of the dynamic wind action on the chimney [Alberti
2006].
• The cross wind force spectrum is an integral parameter in the estimation of
structural response to the cross wind excitation. Its values vary greatly with the
building aspect ratio and the level of turbulence in the approach flow. It is
currently only characterised for square and rectangular cross sections but remains
to be characterised for circular cross sections.
• Buckling in column structures are prevented by design against a critical buckling
factor which is taken, in the case of conventional cooling tower design (a similar

74
cylindrical thin shell structure), to be equal to 5 [VGB 2005]. This factor is used
when simplified analysis is performed, as opposed to more realistic and accurate
nonlinear stability analysis, considering finite strains. It was calibrated to be safe
for cooling towers, while allowing use of a generally available analysis method.
Such calibration has not yet been done for the SCPP; hence the applicability of
the design guideline to the SCPP chimney is uncertain.
These fundamental, theoretical uncertainties are typical of radical innovations and
necessitate exhaustive familiarisation with the technological environment of the
innovation. Note that in radical innovation official references may not necessarily be
available because of the radical, often intuitive, “non-academic” postulations prevalent in
radical thinking.
Physical shortfalls in the structural performance are quantified by determination of
buckling and frequency response values (refer to Appendix A for more information on
the models used for these numerical FEM analyses and to Appendix C for the structural
evaluation model developed later in this RIM application). By performing a linear elastic
buckling analysis of the chimney under gravity, peak gust wind (a 1,000 year return
period wind applies – refer to Appendix B, section B1) and internal suction load
(comprehensively reported in Appendix G) the first critical buckling factor of 1.63 is
computed. This shows a significant shortfall from the stated critical buckling factor of 5.
Frequency response analysis describes how a structure, given its material and
geometrical characteristics – and, hence, its free vibration frequencies – transmits and
responds to dynamic excitation. Holmes [2001] describes the gust load factor analysis, a
method determining a quasi-static factor for application on the along wind overturning
moment [Australian Standards 1989] exerted on a structure (refer to Appendix C, section
C2 for the validation of the use of this method). Uncertainties in the applicability of this
method to the SCPP chimney warrant the use of a 2,000 year return periodvii in
calculating the reference wind for application in this method. The ideal result is assumed
as the result from application of a 500 year return period wind; a 1,000 year return period
wind is used in the buckling analyses (refer to Appendix B, section B1), but it is
estimated that with adequate experimental testing (characterising actual wind
vii A 2,000 year return period is associated with structures that are essential to post-disaster recovery or associated with hazardous facilities in [ISO DIS 2007].

75
phenomena) reliability of the chimney frequency response could be reached for a 500
year return period wind. Under these conditions an ideal result gust load factor of 1.50
applies. The analysis parameters and results are reported in Appendix C2. The reference
case gust load factor of 1.513 (Appendix G, section G2.1) does not far exceed the ideal
gust load factor. Although, for this criterion, the reference case performs close to the
ideal and can be designed according to standardised practice, it must remain represented
because it exemplifies the basic structural integrity of the system and may be adversely
affected by other technology introduction.
Constructability presents major uncertainties in realising a tall structure such as the
SCPP chimney. Only recently, with the construction of the 800 meter tall Burj Dubai was
concrete pumped above 600 meters [Putzmeister 2007]. Further, the chimney reference
case requires large volumes of building materials, for example, 25 times more concrete
than the Millau Viaduct which is the tallest bridge in the world and has a total length of
2.46 kilometers. Materials may not be readily available and its transport and handling
may be logistically challenging.
Further uncertainties include those contributed by modeling “new” technological
concepts and project management and financing. A RIM process-specific uncertainty
concerns the difficulty of setting up a model for chimney evaluation not knowing whether
acquired technologies may change behaviour completely and present new sets of failure
standards and functionality to subsequently be characterised and incorporated in the RIM.
Civil Engineering structures
Civil Engineering structure systems are inherently prone to uncertainty. Structural
projects are typically once off and have long time-frames and large budgets compared to
the repetitive nature in the manufacturing sector where optimisation and automation is
possible. One of the primary functionalities of civil engineering structures is the
resistance of long return-period extreme loads, requiring them to have very high levels of
structural reliability – there is no room for uncertainty, especially not for the significant
uncertainties (that cannot be mitigated by standardised design practice) prevalent in
radical innovation.
A brief look at current limits in ultra-highrise structures and cooling towers provide a
grasp into the magnitude of technological scaling required from “normal” Civil

76
Engineering structures toward the realisation of the SCPP chimney. The Petronas Towers
in Kuala Lumpur, at 452 meters, the 101 storey Taipei 101 in Taiwan, at 509.2 meters
and the Burj Dubai, at a height of approximately 800 meters (construction to be
completed in 2008/9) as well as several other ultra-highrise structures are pushing the
boundaries of conventional design and construction. High-tech technologies enable
dynamic stability control systems and breakthrough construction methods. Still, thin shell
reinforced concrete cooling tower stacks, portraying similar shape and basic structure as
the proposed reinforced concrete SCPP chimney, have only recently reached heights of
200 meters [Harte et al. 2007].
The 1,500 meter height of the SCPP chimney is far beyond the normative heights of
similar structures but rumoured future projects indicate a development drive toward taller
structures with plans for buildings of 1,852 meters (Al Jabar tower, Bahrain), 1,022
meters (Murjan Tower, Bahrain) and 1,001 meters (a tower in Madinat al-Hareer,
Kuwait) [Wikipedia 2 2008].
5.3.2 Cost requirements
Energy costs of the reference case, when related to average market costs, provide a
further indication of the measure of radical innovation required in the SCPP chimney to reach
a state of feasibility.
Current and realistic SA electricity cost
SA electricity costs are of the lowest in the world [Engineering News 2007a]. The
levelised electricity costviii (LEC) provided by the SA electricity utility range from
R0.18/kWh (reported for the year ending 31 March 2007 [ESKOM 2007]). The national
electricity utility stated that prices are “unsustainably low” due to its basis on historic
costs [Finance 24 2005]. Costs will be increased annually by more than 18%
[Engineering News 2007a] to accommodate for significant capacity expansions in the
next decades [Engineering News 2007b]. Early in 2008 ESKOM opted for a price hike of
53% [Mail and Guardian 2008c]. As an indicator of international electricity costs
comparison, the 2004 cost of electricity for industrial clients in Brazil (comparable to the
viii Levelised electricity cost indicates the averaged cost per kilowatt-hour of electricity over the life time of the project, i.e. including construction, fuel, operating and maintenance costs. Electricity costs are calculated as for February 2008.

77
developing SA economy) and Japan of R0.35/kWh and R0.92/kWh, respectively
[Australian government 2006], can be considered, showing the SA electricity cost to be
relatively low.
Note that cost models used by industry often do not include contemporary life cycle
costs like pollution tax, that are due to increase the LEC of fossil fuel power plants, or
additional revenue from “carbon credits” and government feed-in tariffs that could
greatly impact the financial feasibility of clean energy technologies in the future.
In the light of the above described fluctuation and modeling inaccuracies used for
determination of life cycle energy cost, a value of R1.00/kWh is considered as the base
reference cost (ideal result) in this dissertation.
SCPP electricity cost
The reference SCPP installation cost is an estimated R31.44Bn, resulting in a LEC of
R8.65/kWhix. Appendix D expands the cost model and associated assumptions.
Significant cost reductions are required to decrease the SCPP costs to the assumed state
of market competitiveness of a LEC of R1.00/kWh.
5.4 Conclusion on Solar Chimney Power Plant chimney background, concept and
shortcomings
This chapter commences the RIM application on the SCPP chimney by an introduction to
market requirements. Global and SA climate change and energy crises are presented as a context
urgently requiring radical innovations. Clean, non-oil fuel, cost efficient energy production could
provide solutions to the challenges stated. These qualitative demands are re-articulated as
quantitative requirements and, if met by a 200 MW SCPP concept, comprise a 1,500 meter tall,
160 meter diameter chimney with a 6,900 meter diameter solar collector.
A detailed reference case for this concept is provided as the coalescence of research
collaboration between the US-ISE and the BUW-SDT and conceptual background by Schlaich,
ix A publication by Fluri et al. [2006] in which the current author co-authored, reports a LEC of €0.316/kWh which equates to around R3.63/kWh (1€=R11.50 as on 28 February 2008). This significantly lower value occurs because the chimney used in that study had no stabiliser fin stiffener structures which contribute to 80% of the cost of the current chimney system. The current cost model without fin stiffeners yields a LEC of R2.82/kWh. The difference is due to discrepancies in the energy performance models and currency value. Further, a glass roof collector was used in the Fluri et al. study [2006] that accounted for significant costs. Also note that the LEC is very sensitive to fluctuations in interest and inflation rates.

78
Schlaich et al. and Schlaich Bergermann und Partner [Schlaich 1995, Schlaich et al 2004a and
2004b and Schlaich Bergermann und Partner 2004]. The reference case is related to
contemporary achievement and norms to understand the measure of radicality relative to the
sought performance. All subsequent (first iteration) RIM technology acquisitions are related to
this reference case.
Some uncertainties in the SCPP chimney where identified in this chapter. They could, of
course, be addressed individually, in an isolated manner. These uncertainties can, however, be
placed in a framework from which a functional focus could investigate their criticality for
subsequent more focussed and accurate mitigation. In the next chapter the reference case is
broken down into its essential technological elements to gain insight into the building blocks and
uncertainties of the SCPP chimney system.

79
CHAPTER 6
TECHNOLOGY IDENTIFICATION
IN THE SOLAR CHIMNEY POWER
PLANT CHIMNEY
The reference case SCPP chimney proposed in the previous chapter enters the next step in the
RIM, i.e. the system breakdown and technology identification phase. The chimney reference case,
synthesised through current incremental practice and associated theory, was proven to fall short of
sought performance levels. In the critical shift of focus presented by the technology identification
phase of the RIM, the constraints of conventional design practice are shaken off by engaging the
raison d’être – the functionality – of the system and its elements.
In the first step, the system is broken down to its essential functional elements through the
system functional breakdown. Failure mode identification identifies vulnerable and absent
functionalities of the system. Technology scan proposes mitigative and amending technological
functionalities from the technology landscape. In re-articulating functionality as technology, a
technology tree is presented. Finally, a list of technologies is set up, combining the technology tree
and previously identified theoretical uncertainties.
6.1 Functional breakdown of the Solar Chimney Power Plant chimney
The functional breakdown engages the system decomposition process by asking the
following: what functionalities are required of SCPP systems, and how do they achieve these
functionalities. The reference case is decomposed into its functional hierarchy as far down the
system levels as is deemed necessary to reveal its intrinsic functional components. Note that this
study concerns the expansion of the chimney system only as it exists during its fully operational
phase (assuming that construction is completed and decommissioning had not yet commenced –
study scope defined in section 1.6.1, under the first point).

80
The SCPP system consists of three main subsystems: the collector (denoted with “A” in
Figure 6-1), the turbine (“B”) and the chimney (“C”). The collector function ‘collects’ solar heat
energy and feeds it through the turbine where its kinetic energy is converted to electrical energy.
The pressure differential between the air inside the chimney and the air volume outside provides
the driving force causing air to flow through the system (see section 5.2.1).
Section 5.2.2 introduced the SCPP chimney function as a vertical channel for air flow,
requiring a simple, large diameter hollow cylinder that is subject to no habitation demands. Any
chimney consists of several sub-systems that contribute various functionalities to the system.
Figure 6-1 displays these subsystems of the SCPP chimney system: a foundation (denoted by a
“1” in Figure 6-1), chimney-to-foundation transfer (2) and chimney tube (3). Each of these is
investigated in this section to identify its functionality. Note that the SCPP chimney may also
accommodate a diffuser (depending on the choice of turbine configuration) to optimise air flow
but its functionality is not structurally interesting; hence it is not considered further. It is,
however, important to take notice of every subsystem and component of the system for a
comprehensive perspective on the whole.
Figure 6-1. Subsystems of the SCPP system (denoted by blocks) and of the chimney system
(denoted by circles).

81
6.1.1 Chimney foundation functionality
The chimney foundation system considers subterranean, geological and geotechnical
information to present a foundation structure supporting the super-terranean structures. It
must present sufficient load bearing capacity for transferral of static and dynamic loads, i.e.
compression, tension and shear, to the soil/rock substrates, as well as for fastening and
anchorage of super-terranean systems.
The fixity of the chimney, i.e. the degree to which its base support is constrained against
translation and rotation, depends on the soil characteristics. In the SCPP reference case the
Sishen soil characteristics show sufficient stiffness which, in combination with appropriate
foundation design, allow full constraint of the structure against practically all translation and
rotation degrees of freedom (refer to Appendix A, section A1.2) for the validation of this
assumption), i.e. to support the chimney. Previous research shows that the chimney base
could be in tension under extreme static and dynamic wind loading, hence anchorage
functionality is required [Van Dyk 2004].
6.1.2 Chimney-to-foundation transfer functionality
The chimney-to-foundation transfer structure transfers static and dynamic loads imposed
on the chimney tube, as well as its own loads, via the foundation into the soil/rock substrate.
The chimney is presented with a functional contradiction between load transferral and the
creation of space for air through-flow from the collector and turbines to the chimney. A
functional solution that transfers all loads to subterranean systems (through large fin shaped
columns) while creating a through-flow channel for the passing air is presented in Figure 5-
5b [Van Dyk 2004]. The transfer structure can also support the turbine and its airflow duct
configuration.
6.1.3 Chimney tube functionality
The chimney tube consists of a large diameter, hollow, vertical channel for air flow. It is
subject to gravity and exposed to extreme wind action and must be functional in resistingi
these loads throughout the life time of the structure. Any obstruction in the air flow channel
incur losses, decreasing the energy yielding capacity of the SCPP system. Such obstructions
[Van Backström et al. 2003] may include frictional shell surface properties or the i Actions can also be accommodated as with the Floating Solar Chimney concept (refer to section 5.2.2).
82
circumferential stiffening structures that are currently implemented in the reference case.
These stiffeners present another contradiction; creating an optimal through-flow channel
while using part of the cross sectional area for structural stiffening. Obstacles in the tube (e.g.
circumferential stiffener system) may be aerodynamically shaped to reduce losses [Von
Backström et al. 2003].
Apart from physical flow obstructions the air flow channel must be shaped for optimal
through-flow conditions, within limits of structural feasibility. A gradual flaring of the
chimney inner area with height increase keeps the flow rate optimal [Von Backstrom 2000].
Exit losses occur when the rapidly flowing air inside the chimney meets the relatively
stagnant body of air above the chimney [Fluri and Von Backström 2006]. These could be
mitigated by an aerodynamically more favourable chimney exit geometry.
Several structural stabilisation systems can be incorporated in the chimney tube system to
mitigate or circumvent adverse structural behaviour. Failure mode identification isolates the
functionalities required for mitigative measures. The functional–failure description aims to
identify failure modes for mitigating design and optimisation of structural performance
(remember that failure occurs not only when physical structural limit states are not reached
but also when a performance goal is not attained).
6.2 Failure mode identification
In Structural Engineering failure mode identification often suffices for the identification of
many of the functions necessary in the system; standardised design processes are set up to resist
all known failure modes in order to satisfy user requirements. The radical nature of the SCPP
chimney, however, warrants a deeper investigation aiming to cover all possible failure modes in
the system in a comprehensive, unassuming way thus identifying lacking functionality. All
potentially significant perspectives toward critical failure mode identification must be engaged.
Two perspectives are used to identify failure modes in the SCPP, i.e. material failure (apparent
failure cause) and action-based failure (root cause of failure).
6.2.1 Material failure modes
Ultimate limit state based technical failures in civil structures occur due to material
failures, although they are not necessarily the root cause of failure. Local material failure

83
may be the consequence of global effects, for example excessive deformation resulting in
local stress concentration causing concrete crushing.
The main materials present in the reference case chimney are concrete, reinforcement
steel and structural steel. Table 6-1 presents the prevalent failure modes of concrete, steel and
reinforced concrete at the material level.
Table 6-1. Material failure modes.
Material Failure mode
Compression (crushing)
Tension (cracking)
Shear
Fatigue due to repetitive load Concrete
Material deterioration
Carbonation Poor mix (e.g. water-cement ratio) Aggressive environment (chlorine, salt, ice) Alkali-Silica reaction
Plastic yield
Corrosion and other aggressive environment based effects
Fatigue
Steel
Brittle tensile failure (high carbon steel)
Bond slip Reinforced concrete Spalling (carbonation/corrosion)
6.2.2 Action-based failure cause
The root causes of failure are generally action based. Various actions on the structure,
together with their dynamic interaction, provide perspective on the causes of failure modes.
The actions on the chimney were stipulated in section 5.2.2 and Appendix B, section B1. The
action based failure modes are reported in Table 6-2. Note that the entries in Table 6-2 are
the result from specialist (expert) investigations into SCPP chimney behaviour.

84
Table 6-2. Failure modes from an action perspective.
Action Failure mode
Gravity
Axial load Axial failure due to gravity and wind load
Shearing load Shearing failure due to gravity and wind load at positions of shear transfer
Wind action
Along-wind cantilever pushover
Flexural or shear failure due to total wind induced moment on a section along the chimney height [Van Dyk et al. 2006]
Wind-induced circumferential ovalling
Flexural or shear failure due to total pressure distribution-induced moment on a section around chimney circumference [Van Dyk et al. 2006]
Dynamic along-wind resonance
Failure by resonance. Wind gust frequency spectral density indicates resonance potential due to low excitation frequency [Van Dyk et al. 2006]
Failure by resonance. Impulses in along-wind force brought about by periodic increase in Reynolds-numbers cause sudden, significant fluctuation in the drag coefficient resulting in resonance probability [Van Dyk et al. 2006]
Dynamic across-wind resonance
Failure by resonance. Periodic, alternate vortex shedding produces low frequency alternating transverse force resulting in resonance probability [Van Dyk et al. 2006]
Wind configurations Localised flexural or shear failure due to wind pressure combinations on a specific surface
Failure by resonance. Excitation of higher modes due to various wind configurations along height and circumference [Rousseau 2005]
Frictional wind forces Axial or shear failure. Any obstruction to air flow cause frictional forces, e.g. shell surface roughness or obstructions in the inner area
6.3 Technology scan for mitigative, amending and optimising measures
With the chimney failure modes identified, the technology manager and experts scan the
technology landscape for mitigative measures to minimise the impact of failure modes on system
performance. Improved structural performance is sought through implementation of novel,

85
intelligent manipulation and control of detrimental actions and response in the structure. Note
that mainly detrimental actions are considered here, but that material based failure modes could
also be addressed by scanning the technological landscape for relevant functionality, e.g. a
lighter, stiffer material could mitigate bending and structural response modes. The scanning
process aims to identify specific functionalities (responding to failure modes identified) for
incorporation in the system, thus moving outside standardised design practice by engaging the
functional/technological sphere. This is achieved through the utilisation of external devices or
adaptation of inherent characteristics like material properties. The detail integration of the
identified technologies with the current chimney system, like fastening and design against device
failure, are not considered during system synthesis (“black box” components are merely
integrated into the system and not developed themselves – refer to section 2.2).
Note that several of these mitigative technologies are already incorporated in the chimney
reference system, such as longitudinal stiffening fin stiffeners and circumferential stiffeners.
6.3.1 Longitudinal stiffening
In an attempt to decrease global chimney cantilever bending and increase global free
vibration frequencies and critical buckling resistance factors, longitudinal stiffening
resistance is sought. Trees and industrial towers provide direction to formulating a solution;
their lower regions taper to a broader base enlarging the moment of inertia and, hence, the
resistance against cantilever bending. The fin stiffeners already incorporated in the reference
case (refer to Figure 5-5b for visual representation) are examples of such longitudinal
stiffening. Cable stays could stiffen structures by providing additional support.
Longitudinal stiffening can further be achieved through alteration of the chimney
geometry, e.g. through the incorporation of parabolic hyperboloid cooling tower shapes
(Figure 6-2 – cooling tower geometry incorporated in the SCPP chimney), increase in
diameter or wall thickness re-configuration. Geometrical changes must be implemented in
close coordination with thermo-dynamical experts as alteration of the through-flow channel
geometry has significant influence on the energy production capacity of the system.
6.3.2 Circumferential stiffening
Circumferential bending due to the total wind pressure distribution moment around the
circumference can be mitigated by circumferential stiffening improving structural

86
performance under static, dynamic and buckling loading. The bicycle spoke wheel concept
incorporated for the reference case (refer to Figure 5-5a for visual representation) is an
example of a circumferential stiffening technology.
Figure 6-2. Parabolic hyperboloid geometry incorporated into the SCPP chimney [Sawka
2004].
6.3.3 External damping system
External damping measures have been in use for more than three decades [Datta 2003]. It
involves the addition of a device that reduces structural response to prevent discomfort,
material fatigue and subsequent structural failure due to vibration. It reacts to the resonant
frequency oscillations of the structure by means of active, passive or semi-active damping
systems, e.g. springs, dashpots or pendulums. Many damping devices exist; their impact
relies on a thorough understanding of the theory of dynamics and their behaviour in order to
efficiently utilise it in the global system.
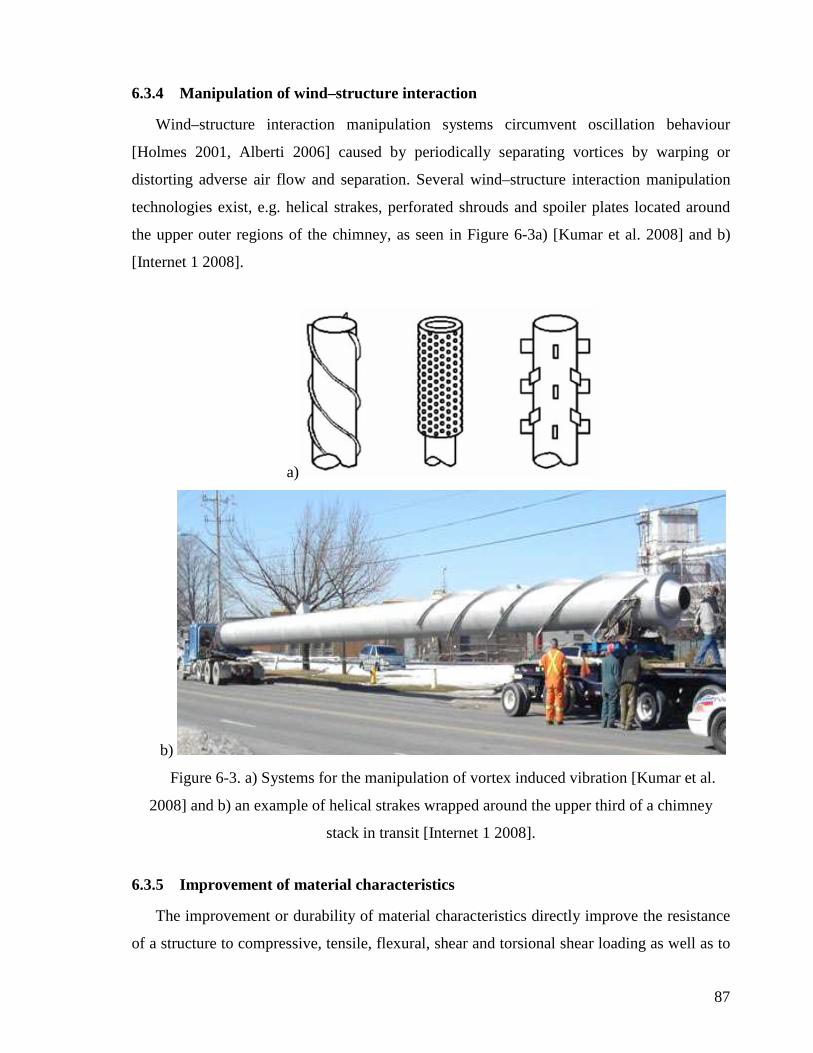
87
6.3.4 Manipulation of wind–structure interaction
Wind–structure interaction manipulation systems circumvent oscillation behaviour
[Holmes 2001, Alberti 2006] caused by periodically separating vortices by warping or
distorting adverse air flow and separation. Several wind–structure interaction manipulation
technologies exist, e.g. helical strakes, perforated shrouds and spoiler plates located around
the upper outer regions of the chimney, as seen in Figure 6-3a) [Kumar et al. 2008] and b)
[Internet 1 2008].
a)
b)
Figure 6-3. a) Systems for the manipulation of vortex induced vibration [Kumar et al.
2008] and b) an example of helical strakes wrapped around the upper third of a chimney
stack in transit [Internet 1 2008].
6.3.5 Improvement of material characteristics
The improvement or durability of material characteristics directly improve the resistance
of a structure to compressive, tensile, flexural, shear and torsional shear loading as well as to

88
material fatigue and deterioration. Furthermore, the inherent damping characteristics of a
structure which dictate how a structure responds to harmonic excitation are functions of its
geometry and material.
6.3.6 Directional design
The notion of designing a foundation only for directional dependent wind, as is found in
nature with the root systems of trees – only growing into the regions that are experiencing
more action – could decrease material volume required and, hence, lower capital costs. The
structure is appropriately strengthened only in the regions that resist statistically determined
wind-based actions as presented with the aid of a wind-rose (Figure 6-4 presents an example
of a wind rose with radial histograms depicting prevalence of wind direction and speed).
Figure 6-4. A wind rose displays statistical data of prevailing wind directions and speeds
[WeatherSA 2007].

89
6.4 Integration of functionalities into a technology tree
A functional technology tree combining all the insight from the previous sections follows in
Figure 6-5, providing a comprehensive functional breakdown of the SCPP chimney system.
Technologies active in the system can be placed in a comprehensive framework from which gaps
can be identified and substitute technologies proposed.
Figure 6-5. SCPP chimney system functional technology tree.
90
The functional flow from R&D theme through functionality to core technology as mentioned
in section 2.4.3 is evident. For example, the Level 2 chimney tube system (R&D theme) breaks
down into a Level 3 contradiction between the optimal air-flow channel and realisation of
structural integrity. Trade-off between contradictions can be visualised and understood from a
systems perspective.
The rest of this dissertation focuses on the innovation of the chimney tube – the technologies
depicted in orange in Figure 6-5. Several of these technologies may also have an impact on the
integration and configuration of foundation and chimney-to-foundation transfer subsystems (e.g.
geometrical stabilisation and longitudinal stiffening technologies).
Material level failure modes (summarised in Table 6-1) are combined under one technology
field, namely “improvement of material characteristics”. Materials science is a complex field
with many factors contributing to its characteristics. The in-depth investigation of each material
failure mode (stated in Table 6-1) is not performed here; rather, the “improvement of material
characteristics” is investigated from the perspective of three material attributes that are
representative of and readily used in structural design, namely the elastic modulus, weight and
damping ratio. The failure modes of Table 6-1 are all influenced to a greater or lesser degree by
these attributes.
In terms of the definition of radical innovation provided through Figure 2-2, the synthesis of
technologies in a feasible SCPP chimney system is at this stage subject to significant
uncertainties in its theoretical basis and failure mitigating technology subsystems or components.
They do not attain to the sought levels of performance – development up to these levels is
uncertain. Other technologies may prove to better address the functionality. These uncertainties
in lower system levels perpetuate to the higher levels and become unmanageable. For example,
uncertainty of realising sought material characteristics performance levels – a Level 4
functionality – perpetuates to higher system levels and becomes unmanageable in the synthesised
system.
6.5 List of identified technologies
Technologies and theoretical uncertainties identified from information gathered up till now
are listed for subsequent investigation and introduction in the RIM system evaluation phase.
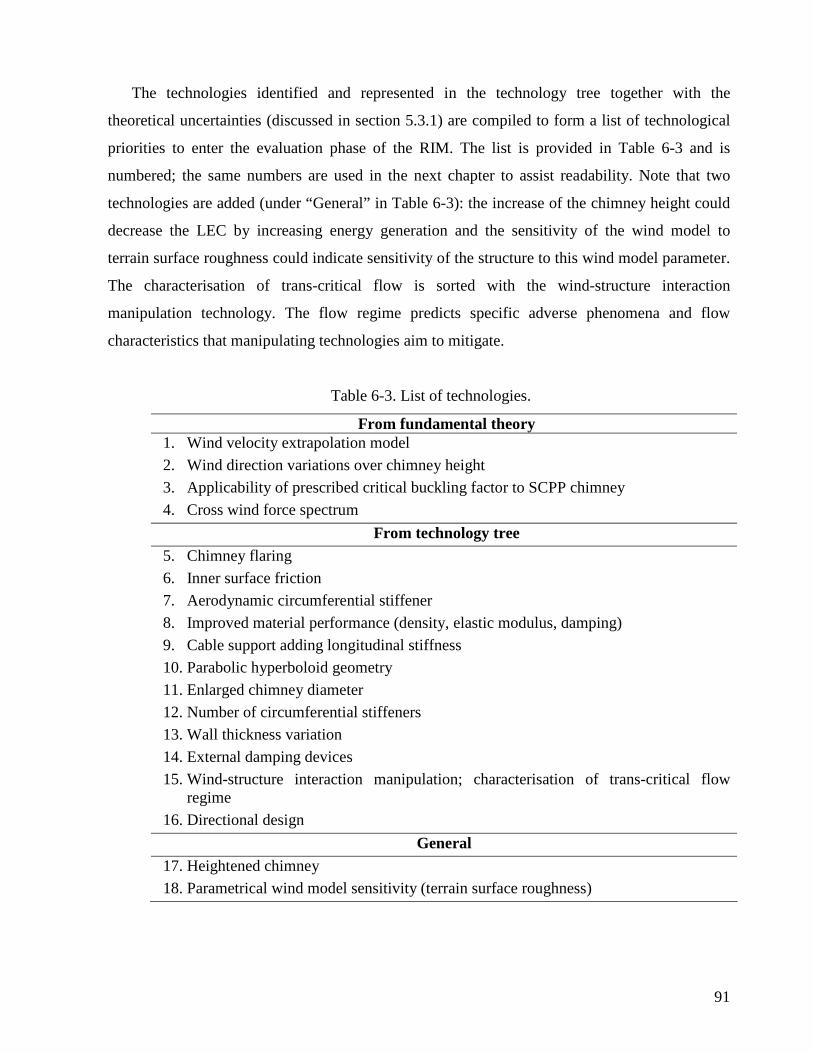
91
The technologies identified and represented in the technology tree together with the
theoretical uncertainties (discussed in section 5.3.1) are compiled to form a list of technological
priorities to enter the evaluation phase of the RIM. The list is provided in Table 6-3 and is
numbered; the same numbers are used in the next chapter to assist readability. Note that two
technologies are added (under “General” in Table 6-3): the increase of the chimney height could
decrease the LEC by increasing energy generation and the sensitivity of the wind model to
terrain surface roughness could indicate sensitivity of the structure to this wind model parameter.
The characterisation of trans-critical flow is sorted with the wind-structure interaction
manipulation technology. The flow regime predicts specific adverse phenomena and flow
characteristics that manipulating technologies aim to mitigate.
Table 6-3. List of technologies.
From fundamental theory 1. Wind velocity extrapolation model
2. Wind direction variations over chimney height
3. Applicability of prescribed critical buckling factor to SCPP chimney
4. Cross wind force spectrum
From technology tree 5. Chimney flaring
6. Inner surface friction
7. Aerodynamic circumferential stiffener
8. Improved material performance (density, elastic modulus, damping)
9. Cable support adding longitudinal stiffness
10. Parabolic hyperboloid geometry
11. Enlarged chimney diameter
12. Number of circumferential stiffeners
13. Wall thickness variation
14. External damping devices
15. Wind-structure interaction manipulation; characterisation of trans-critical flow regime
16. Directional design
General 17. Heightened chimney
18. Parametrical wind model sensitivity (terrain surface roughness)
92
The entries in Table 6-3 form the list for evaluation in the next RIM phase, whereby system
alternatives are formulated and evaluated. Note that, generally, during the next phases (data
gathering toward formulation of alternatives for evaluation as well as in the technology
assessment phase) deeper insight into the criticality of technologies is gained which may have
remained unknown up to this stage. If at any stage a technology is proven to be inadequate in
contributing significantly (to achieve radical innovation) to the improvement of system
functionality and performance it may be filtered out of the list to optimise R&D resources.
6.6 Conclusion on Solar Chimney Power Plant technology identification
During the technology identification phase of the RIM the SCPP chimney reference case is
broken down into its functional hierarchy to reveal intrinsic functional subsystems and
components. This functional perspective provides a view on the system that in not constrained by
standardised design practice and theory. Specific functionalities that are required in the chimney
are identified by failure mode identification. Technology scan proposes solutions for
functionality against failure. The chimney functional technology tree is formulated, portraying
core technology solutions as they respond to specific R&D themes. A list of technologies is
compiled from this tree and the theoretical uncertainties identified during the reference case set
up. This list is considered in the next phase of the RIM, where alternatives are formulated
through augmentation or of the identified technologies or introduction of required functionalities.
The technology identification phase of the RIM provides the radical innovator with a systems
perspective on the SCPP chimney and views the system in terms of the technological elements it
consists of. Subsequent technology acquisition and strategic technology decisions can be sorted
in terms of the technology tree set up in this chapter.

93
CHAPTER 7
EVALUATION OF
POTENTIAL IMPACT OF
TECHNOLOGIES ON THE
SOLAR CHIMNEY POWER
PLANT CHIMNEY SYSTEM
The RIM system evaluation phase determines the potential of technologies to impact SCPP
chimney system performance. Each entry on the list of chimney technologies identified in the
previous chapter is investigated for augmentation or introduction of a fitting technology solution.
The different SCPP configurations resulting from augmented or introduced technologies are
evaluated and compared in this RIM phase. (Note that the detailed results are not shown in this
chapter as it may distract from the main development of the RIM thesis. Appendix G, section G2
contains the calculations and the resulting impacts of each technology on the various identified
criteria.)
This phase of the RIM incorporates the system performance evaluation process of incremental
innovation, as set out in the systems analysis process (section 2.6.2). The radical innovation
perspective presented in the RIM, however, requires the augmenting of technology performance
variables up to preferred values or the introduction of new technological functionality, as opposed to
reverting to standard, realistic values as is typical during incremental innovation. An evaluation
model is set up in response to board specified evaluation criteria making sure that the performance
attributes that are significant during the current radical development phase of the chimney system are
accommodated. Reference is made to the Appendices containing more detailed information
concerning the evaluation model.
Alternatives are entered into the evaluation model to determine the response of each alternative
to the individual criteria specified in section 5.3. Alternatives that hold the most potential are
94
identified, distinguishing the chimney technology portfolio into a spectrum ranging between core
and less significant technologies.
7.1 Formulation of alternatives
This section reports on the research performed to formulate sufficient detail of each of the
SCPP technologies listed in Table 6-3 (in section 6.5) for engaging the augmentation or
introduction of the required functionalities. The sensitivity of the SCPP system to the
technologies can subsequently be investigated. The previous chapter identified the list of
technologies, some indicating specific devices or concepts, such as the parabolic hyperboloid
geometry, whilst others only specify general functionality with no specific solutions that satisfies
the functionality identified or proposed, e.g. the external damping devices.
Note that investigations on fundamental theory (uncertainties in scientific theory – section
5.3.1) aim to contribute more detailed information to the current reference and evaluation models
in order to diminish uncertainty, i.e. it aims to describe phenomena and design limits in more
detail where conservative assumptions were made previously.
Not all uncertainties or augmented or introduced technologies investigated in this study
gained significant progress toward identifying solutions within the resources allocated to their
R&D. These are pointed out where applicable.
7.1.1 Wind velocity extrapolation model
A wind extrapolation curve characteristic of frontal weather systems is currently used in
the chimney reference case. Three-second wind gusting data stated in a wind map in the
SABS 0160:1989 Loading Code [SABS 0160 1989] form the basis of the wind extrapolation
curve. The reference case wind model set up in Appendix B use a factorial adjustment of
1.53 [ISO DIS 2007] to adjust from a three-second gust velocity of 40 m/s [SABS
0160:1989] to an hourly mean wind velocity of 26.14 m/si. Investigation into more detailed
South African wind literature [Milford 1987] indicates an hourly mean wind velocity of 20
m/s for the Sishen region. Thus the factor adjustment translates the three-second gust velocity
to a 30% higher mean hourly velocity than is reported by Milford [1987].
i These values are given for a 50 year return period. The reference wind model uses a 1,000 year return period for buckling analyses and a 2,000 year return period for dynamic frequency response – refer to Appendix B for more detail.
95
This discrepancy/uncertainty is noted as potentially significant to the system performance
improvement. Allocation of more resources to this matter may reveal the reason for the
discrepancy in wind adjustment factor, making for reliable design.
The reference wind model is adjusted to implement the hourly mean wind of 20 m/s. The
peak wind data (40 m/s gust velocity) remains applicable to analyses incorporating extreme
winds as basis (buckling analysis – refer to Appendix C, section C1). The 20 m/s hourly
mean wind data is used to determine velocities relevant in structural response analysis (refer
to Appendix C, section C2). The turbulence intensity profile remains unchanged.
7.1.2 Wind direction variations over chimney height
Although the current mathematical formulation of a vertical wind profile shows extreme
and average wind speeds, it does not predict the directional variation. With tall structures this
phenomenon can cause multi-directional pressure loads which may excite resonant
oscillation of the structure in its higher natural frequencies. Rousseau [2005] showed the
excitation of higher vibration modes, assuming inverse loads of the fully developed wind
profile.
Wind loading or meteorological literature does not contain a formulation to describe the
stochastic properties of these inversions. In investigating this phenomenon, upper boundary
layer wind data was acquired from the South African Weather Bureau for the Upington (near
Sishen) and De Aar (south eastern tip of the Northern Cape) weather stations. Inconsistencies
in the data, however, jeopardised its credibility as a statistical source – Appendix F discusses
this discredit – hence this theoretical uncertainty could not be resolved within the allocated
resources and was set aside until a more credible substantiation of the directional variation
characteristics is found.
7.1.3 Applicability of prescribed critical buckling facto r to the Solar Chimney Power
Plant chimney
Buckling in cooling towers is prevented through design against a critical buckling factor
of 5 [VGB 2005]. The applicability of this design guideline on the SCPP chimney remains
uncertain. Note that although this theoretical uncertainty does not influence the structural
performance of the chimney, it provides a measure against which radicality and structural
performance improvements can be measured.

96
No progress to resolve this issue was made by way of resources allocated during this
study. Future R&D must perform geometrically and physically non-linear buckling analyses
incorporating initial displacements and imperfections to model actual conditions and translate
these to a critical factor applying to the simplified linear elastic buckling analysis.
7.1.4 Cross wind force spectrum
A formulation for vortex-separation-induced across-wind excitation is provided in
Appendix C. Across wind response is a function of the cross wind force spectrum (see Figure
C6 in Appendix C, section C2.2). This spectrum indicates the power density corresponding to
the typical velocity spectrum and is a function of the level of turbulence in the approach
flow. Further, the values vary significantly with the cross section and aspect ratio of the
structure. As a result, interpolation must be used if the desired aspect ratio does not
correspond to those provided, or the nearest shape must be selected to approximate the force
spectrum coefficient if the desired shape is not available [Kijewski and Kareem 2001]. A
cross wind force spectral distribution is not available for circular cross sections and the
aspect ratio encountered in the SCPP chimney – uncertainty exists about its assumed value.
A first consideration before performing in depth R&D on this subject is the sensitivity of
the response to the cross wind force spectrum values. If the wind velocities reach the critical
wind velocity with sufficiently low probability the cross wind force action (necessitating
consideration of the cross wind force spectrum) need not be considered. A theoretical
investigation into the sensitivity of the chimney performance to this parameter can determine
whether resource allocation to resolve this uncertainty could provide critical insight. A force
spectrum coefficient of 2×10⁻³, corresponding to a reduced velocity of 4.46 m/s, is applicable
to the SCPP chimney, but is based on values for structures of square cross section (refer to
Appendix C and the Australian Wind Code [Australian Standards Wind Loading Code
AS1170:2 1989]). This value is changed to 1×10⁻³ (half that of the reference case, resulting in
a factor of 0.707 on the across wind overturning moment) as an arbitrary smaller value to
determine the impact trend.
Note that the reference case does not activate resonance – for this evaluation the 1,720
meter chimney is considered because of its affinity to resonant behaviour.

97
A more comprehensive characterisation of the cross wind spectrum could provide a better
understanding toward theoretical characterisation for conceptualisation and design of a safe,
cost effective chimney.
7.1.5 Flaring of chimney exit geometry
Significant losses are incurred due to the kinetic energy lost as the moving air meets
stagnant air just outside the chimney exit. Exit losses contribute 14.9% to overall losses
[Fluri and Von Backström 2006]. Flaring the upper region of the chimney geometry
decreases the air through-flow rate so that less kinetic energy is lost due to air decelerating
against the more stagnant air outside the chimney.
Flaring exit geometry whereby the exit area is increased by 50% over the last 110 meters
is proposed (chosen to determine the impact trend), increasing the chimney diameter by 36
meters. Diameter increase is assumed to be linear with height increase.
7.1.6 Chimney inner surface friction
Friction losses contribute very little to overall losses. Von Backström et al. [2003]
determined friction losses to be only 1% of a total turbine loss of 8.9% [Fluri and Von
Backström 2006]. A numerical simulation confirmed this negligible impact of surface
friction on energy yield by calculating an increase of 0.007% in annual energy yield. This
potential improvement does not promise radical impact and is not considered further. It may,
however, be re-considered during optimising phases later in the system life cycle.
7.1.7 Circumferential stiffener concept
The relevance of investigating the impact of different circumferential stiffener concepts
on the system performance, through utilising the reference case simulation model
(formulated in Appendix A, section A1.2), is qualified.
Impact on energy yielding performance
The circumferential stiffeners in the reference case configuration are responsible for
an order of magnitude larger pressure drop than the pressure drop due to wall friction.
Research on the circumferential stiffener geometry determined that its cross sectional

98
shape and angle of attack have significant impact on energy yield losses. Von
Backström et al. [2003] determined that rounding the bicycle spoke wheel windward
sections reduces the drag coefficient by 38.5%; tapering the section tail reduces it by an
additional 48.2%.
A model for determining stiffener impact on structural performance
The placement of beams or cables at positions of circumferential bending in the
shell due to wind suction forces resists excessive ovalling. The impact of the number of
stiffening beams in the reference case circumferential stiffener concept is representative
of the efficiency of this concept in resisting ovalling. The number of circumferential
stiffener beams in the reference case is halved from 72 to only 36 beams (in the FEM
simulation this is achieved by releasing the appropriate vertical rotation constraint –
refer to Appendix A, section A1.2. Note that this approximation stiffens the flexural
resistance of the shell and does not simulate the axial cable restraint to ovalisation
directly.).
Note that although several conceptual solutions for the circumferential stiffener are
proposed in literature [Schlaich et al. 2004b, Lourens 2005, Glubrecht 1973] the
optimal concept remains to be confirmed. A starting point from which the impact of
these conceptual variations on the various criteria can be evaluated is proposed here.
Future R&D should model the stiffener concepts more accurately before technological
comparison and improvement of the concepts can be investigated accurately.
7.1.8 Improved material performance
Material characteristics have a significant impact on structural integrity. Elastic modulus,
density and material damping are to some extent representative of a material’s resistance to
static and dynamic instability.
Material elastic modulus
Literature states the existence of ultra-high strength reinforced concrete mixes
reaching elastic modulus of 60-100 GPa [Mehta and Monteiro 2006]. In the current

99
study an elastic modulus of 60 GPa is used to augment the reference case chimney shell
(the chimney only, not the fin stiffeners) material performance.
The reference concrete material cost is assumed to be increased by three times to a
value of R3,000/m3 (This cost increase is chosen arbitrarily in order to provide a data
point from which trends of impact on the system performance can be investigated.
More resource expenditure on this subject may yield a realistic cost.). Labour and plant
costs are increased by 50%.
Concrete density
Lightweight aggregate, high-strength concrete with compressive strengths of up to
60 MPa are commercially produced with high-quality lightweight aggregates [Mehta
and Monteiro 2006]. Weights of as low as 1,790 kg/m3 are reported. In the current
study the performance trend is studied through the implementation of a density of 2,000
kg/m3 on the chimney (including fin stiffeners) reference case, reducing it from
2,400kg/m3.
Note that the large scale use of lower density aggregate is strongly location
dependent subject to availability at specific sites.
Internal damping
The percentage critical material damping used in the reinforced concrete of the
reference case reinforced concrete is 1.43%. This value is postulated on a statistical
base based on the values of the logarithmic decrement of several (smaller) reinforced
concrete chimneys similar to the SCPP chimney [Rousseau 2005]. The upper trend line
of the statistical data corresponds to a critical damping ratio of 1.91%. The impact of
change in this coefficient on the system performance is investigated here using the
upper limit value. Conclusive characterisation of SCPP chimney damping could shed
more light on the applicable value for the damping parameter. Materials with higher
internal damping characteristics could alter the value as well.
Note that in further materials investigation in this study the material-based
parameter changes are decoupled in a parametrical study of performance results.
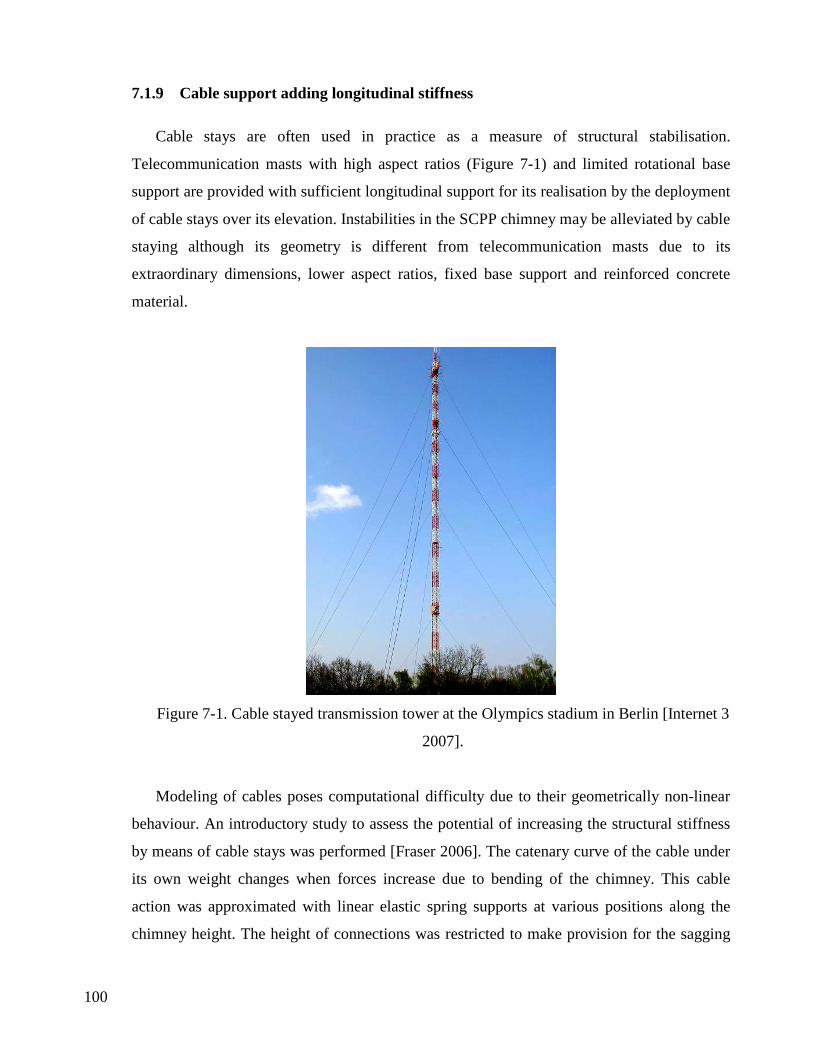
100
7.1.9 Cable support adding longitudinal stiffness
Cable stays are often used in practice as a measure of structural stabilisation.
Telecommunication masts with high aspect ratios (Figure 7-1) and limited rotational base
support are provided with sufficient longitudinal support for its realisation by the deployment
of cable stays over its elevation. Instabilities in the SCPP chimney may be alleviated by cable
staying although its geometry is different from telecommunication masts due to its
extraordinary dimensions, lower aspect ratios, fixed base support and reinforced concrete
material.
Figure 7-1. Cable stayed transmission tower at the Olympics stadium in Berlin [Internet 3
2007].
Modeling of cables poses computational difficulty due to their geometrically non-linear
behaviour. An introductory study to assess the potential of increasing the structural stiffness
by means of cable stays was performed [Fraser 2006]. The catenary curve of the cable under
its own weight changes when forces increase due to bending of the chimney. This cable
action was approximated with linear elastic spring supports at various positions along the
chimney height. The height of connections was restricted to make provision for the sagging

101
nature of catenary cables and to effectively utilise the horizontal resistance they offer.
Problems of cable own weight and large force transfer to chimney shell, requiring
strengthening to prevent punching shear pullout, served as practical constraints. In a system
with two springs at heights of 400 and 900 meters a first global vibration frequency of 0.255
Hz was calculated – a significant improvement from the 0.1 Hz of the particular reference
case used in that study. The realisation of such horizontal spring resistance by cable stays,
especially at these great heights, remains to be studied in detail.
Although the behaviour of cables is a highly non-linear process which needs specialised
simulation in FEM software, this first approximation of the impact of cable staying on the
chimney structural integrity indicates potential warranting further investigation. The accurate
characterisation of cable-stayed chimney behaviour remains to be completed; it was not
further investigated due to resource constraints.
7.1.10 Parabolic hyperboloid geometry
Parabolic hyperboloid geometry increases stability and reduces costs in structures by its
inherent geometrically based strength. The investigation into the marriage of hyperboloid
geometry with the ultra-high rise SCPP chimney could decrease the high material volume
needed to adequately stiffen the chimney against buckling and cantilever pushover, currently
brought about by way of the voluminous fin structures.
A hyperboloid concept (Figure 7-2) is set up for this study based on guidelines from the
VGB [2005] and incorporated in the lower region of the chimney while excluding the fin
structures. A base angle of 20.6o to the vertical is used diminishing to 0o at a height of 400
meters. The reference case wall thickness configuration is used in the hyperboloid concept,
decreasing linearly from 2.15 meter at 25 meter elevation to 0.3 meter at 1,000 meter
elevation, remaining constant up to the chimney tip. Although a benefit of parabolic
hyperboloid geometry is the reduction of wall thickness and material volume, enough can be
learnt from the initial implementation of this geometrical concept that a detailed wall
thickness optimisation carries subsequent priority (it was not further developed for this
study). Cylindrical columns of 8.87 meter diameter transfer forces in the shell structure to
foundational level, creating space for air through-flow. (The columns are modeled in FEM by
L12BE two node Bernoulli beam columns that are constrained against all translation and
rotation at the foundational level node.) Circumferential stiffener geometry and location

102
remain unchanged from that of the reference case. The foundational capacity is sufficient for
bearing of this geometrical change based on the calculations from Appendix A1.2.
Figure 7-2. The FEM mesh for analysis of the SCPP chimney incorporating parabolic
hyperboloid geometry.
7.1.11 Increased chimney diameter
The prospect of an increased chimney diameter promises a significant increase in energy
yield by containing a larger volume of heated air (refer to section 5.2.1); it should also
increase global cantilever bending resistance. In this conceptual change the chimney diameter
is increased to 200 meters while all other parameters remain unchanged.
7.1.12 Number of circumferential stiffeners
The influence of the number of circumferential stiffener systems on the mitigation of
local buckling modes and circumferential flexural stresses in the system is investigated in the
current study. One stiffener is added between each current pair in the reference case, i.e. five
additional stiffeners. The eleven circumferential stiffener wheels (six from the reference case
and five added here) are located at heights of 1,500 meters, 1,390 meters, 1,280 meters, 1,170

103
meters, 1,060 meters, 950 meters, 840 meters, 730 meters, 620 meters, 510 meters and 400
meters.
7.1.13 Wall thickness variation
Stiffening against local buckling modes and reduced flexural stresses can be achieved by
re-configuration of the wall thickness. The proposed wall thickness configuration is based on
contemporary cooling tower designs – see Figure 7-3a – where wall thickness rapidly
decreases from a relatively thick base to a thin shell and remains approximately constant to
the top [Harte et al. 2007]. The proposed configuration in Figure 7-3b is based on a pre-
feasibility project proposal by Harte and Krätzig [2007]. In this configuration the wall
thickness is generally thicker than the design in Figure 7-3a but tapers down to a value of
around 0.40 meters in the upper parts of the chimney. It is assumed that the inner diameter
remains constant over height.
a) b)
Figure 7-3. a) Dimensions and wall thickness of a 173.2 meter tall cooling tower [Harte et al.
2007]. b) The reference case (blue dashed line) and the investigated wall thickness (red solid
line) configurations.

104
7.1.14 External damping devices
Resonant structural response in structures due to dynamic effects can be damped utilising
external damping devices and vibration controls such as tuned mass dampers and sloshing
liquid dampers. Several of these control devices were implemented in practice successfully
reducing undesirable vibration levels [Datta 2003].
This performance evaluation does not further engage the complex technical field of
external damping due to resource constraints but qualitatively identifies it as a possible
measure in mitigating resonant response in the SCPP.
7.1.15 Wind-structure interaction manipulation
The surface roughness of a structure has a significant influence on the flow
characteristics around its cross section; the smoother the surface the higher suction (negative
pressure) [VGB 2005]. Wind tunnel experiments on the SCPP chimney confirmed this
coefficient to decrease to as low as -3.0 [Harte and Van Zijl 2007]. The manipulation or
mitigation of these high suction forces could have significant implications for realising SCPP
chimney structural integrity.
Saguaro cacti are natural, tall cylinders that generally have high slenderness ratios of up
to 18.75 (see Figure 7-4a); still, they endure wind flows with Reynolds numbers (Re) of up to
1.106 placing it in the trans-critical flow regime alongside the SCPP chimney. The root to soil
interface determines the load bearing capacity of a Saguaro because toppled Saguaros usually
are found uprooted rather than broken at the trunk; its ability to mitigate wind loading is
believed to lie in its ribbed surface geometry [Alberti 2006, Talley and Mungal 2002] – see
Figure 7-4b. Note that these ribs are not to be confused with cooling tower ribs.
The Saguaro geometry was simulated experimentally and numerically as a multiple rib
configuration to study its effect on wind-structure interaction [Alberti 2006]. The research
yielded important results for the SCPP chimney, as reported in Van Dyk et al. [2006]; note
that the Saguaro geometry has potential mitigative application on a range of failure modes:
The drag coefficientii (CD) of smooth surfaced cylindrical shapes is generally lower
(approximately 0.55) than those of the ribbed shapes (approximately 0.8) at the high Re
ii The drag coefficient is a dimensionless quantity that describes a characteristic amount of aerodynamic drag caused by fluid flow. Cross sectional shape has a significant effect on the drag coefficient.

105
present in SCPP chimneys. This observation is applied to determine the overturning moment
during dynamic response calculations (refer to Appendix C, equation C2).
Figure 7-4. a) A forest of Saguaro cacti [Internet 2 2008]. b) a cactus depicting cavities on
the circumference [Talley and Mungal 2002].
The smooth surfaces display a sudden decrease in CD from 0.85 to 0.40 at the “critical”
Re. The decrease in drag coefficient could augment along-wind velocity fluctuations causing
along-wind dynamic response. Recent experimental results show that ribbed surfaces portray
no decrease in CD over a wide Re range, including the critical range for smooth cylinders of
the same global geometry, showing that the Saguaro geometry circumvents this
augmentation.
The roughness of the surface area shifts the sudden decrease in CD toward the left, i.e. at
increased surface roughness the sudden decrease occurs at lower Re. This decreases the
critical Re, moving further away from the generally high SCPP chimney Re.
Slight imperfections along the surface area, as are always evident in actual constructions,
cause localised peaks in pressure coefficients from -2.0 to -2.5 on the outside wall of the
chimney as is portrayed in Figure 7-5a. These high coefficient peaks are almost completely
mitigated [Alberti 2006] by the introduction of ribbed surfaces with new coefficients of
larger than -0.8 (see Figure 7-5b).
Furthermore, it is postulated that the absence of uneven vortex shedding (refer to the third
point under section 5.3.1 and to section 7.1.4) in the trans-critical flow regime eliminates the

106
threat of cross-wind oscillation [Alberti 2006]. This is due to the presence of a turbulent
boundary layer around the circumference of the SCPP chimney at the encountered Re
numbers. The confirmation of this postulation would imply the non-occurrence of alternate
vortex shedding and, hence, no across wind resonant excitation.
Figure 7-5. External pressure coefficients at various wind velocities for a) smooth cylinders
and b) ribbed cylinders [Alberti 2006].
The circumferential pressure coefficient distribution used to investigate the impact of
Saguaro geometry, based on Figure 7-5b, is depicted in Figure 7-6 – the orange line. (Note
that the net pressure coefficients are portrayed – external pressure and internal suction
pressure; hence the orange line value of 1.8 (unity pressure plus internal suction) at zero
degrees.) The internal suction coefficient under no internal flow of -0.8 applies (refer to
Appendix B, Figure B-3). Note that the reference case used the load case where internal flow
occurs due to its large suction coefficients (Appendix B, Figure B-2). The “no internal flow”
data is the only Saguaro geometry measurements made. These are subsequently applied in
the Saguaro geometry alternative. Future research must determine the circumferential
pressure coefficients for the Saguaro geometry with internal flow.
The Saguaro based geometries investigated by Alberti [2006] consisted of 45 and 90
spikes each protruding radially up to a length of 14% of the cylinder radius. The simulation
of Saguaro geometry in this dissertation considers the lower limit case where the cactus
geometry plays no structural role. The non-structural Saguaro geometry serves as a lower
limit from a cost and structural integrity perspective. This is incorporated into the extreme

107
wind load applied during buckling analysis (refer to Appendix C, section C1) by means of a
multiplication factor of 1.14 based on the enlarged chimney frontal area (14% radius increase
= 14% area diameter increase). The width parameters in the dynamic response calculations
(refer to Appendix C, section C2) are set to 160 meters × 1.14 = 182.4 meters. Note: this area
factor is not applied to the fin stiffeners as they already present a type of wind manipulating
geometry.
Figure 7-6. Net circumferential pressure distribution without and with incorporation of
Saguaro geometry.
7.1.16 Directional design
Wind generally prevails in specific directions. Figure 6-4 in section 6.3.6 displays a
visualisation of wind prevalence, wind speed and wind calms (when no or nearly no wind
blows). Statistical processing of this data over several years provides an indication of the
long-term wind prevalence.
Design winds are typically based on the extreme wind condition over all directions and
structures are accordingly designed rotationally symmetric [Niemann 2007]. In nature,
however, trees react only to extreme wind in specific directions: trees tilted by the wind, even
if only slightly moved from a vertical orientation, produce modified cells along the bole
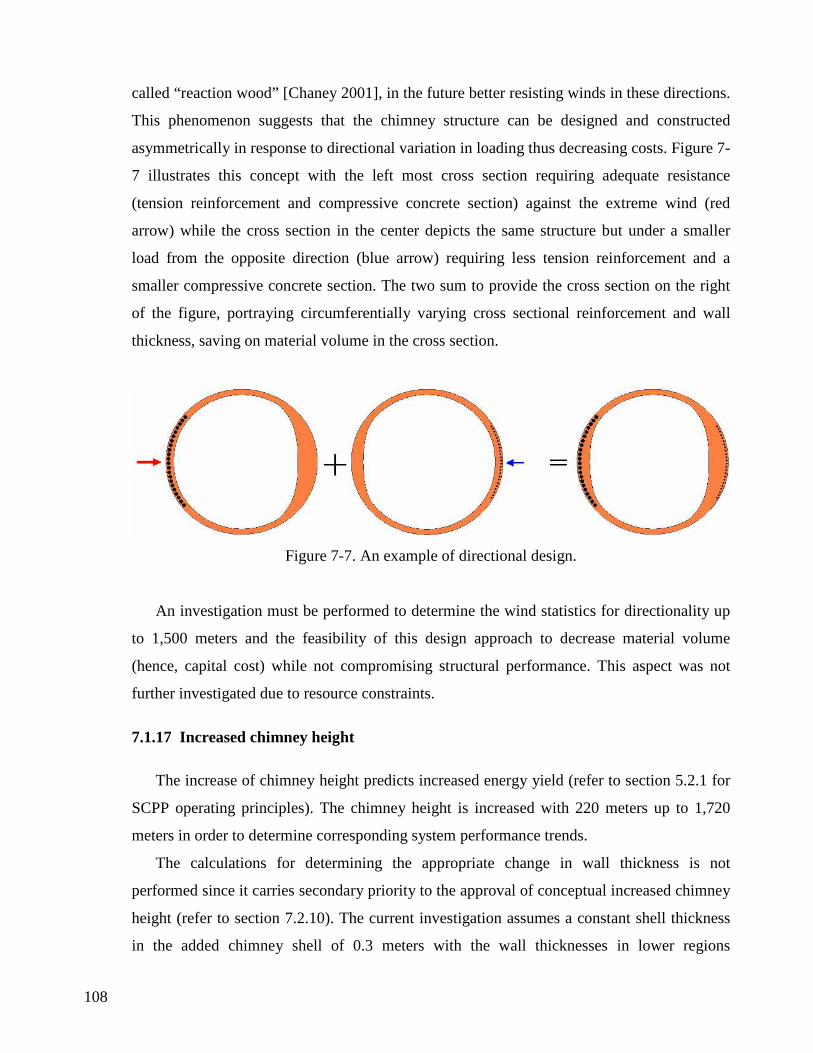
108
called “reaction wood” [Chaney 2001], in the future better resisting winds in these directions.
This phenomenon suggests that the chimney structure can be designed and constructed
asymmetrically in response to directional variation in loading thus decreasing costs. Figure 7-
7 illustrates this concept with the left most cross section requiring adequate resistance
(tension reinforcement and compressive concrete section) against the extreme wind (red
arrow) while the cross section in the center depicts the same structure but under a smaller
load from the opposite direction (blue arrow) requiring less tension reinforcement and a
smaller compressive concrete section. The two sum to provide the cross section on the right
of the figure, portraying circumferentially varying cross sectional reinforcement and wall
thickness, saving on material volume in the cross section.
Figure 7-7. An example of directional design.
An investigation must be performed to determine the wind statistics for directionality up
to 1,500 meters and the feasibility of this design approach to decrease material volume
(hence, capital cost) while not compromising structural performance. This aspect was not
further investigated due to resource constraints.
7.1.17 Increased chimney height
The increase of chimney height predicts increased energy yield (refer to section 5.2.1 for
SCPP operating principles). The chimney height is increased with 220 meters up to 1,720
meters in order to determine corresponding system performance trends.
The calculations for determining the appropriate change in wall thickness is not
performed since it carries secondary priority to the approval of conceptual increased chimney
height (refer to section 7.2.10). The current investigation assumes a constant shell thickness
in the added chimney shell of 0.3 meters with the wall thicknesses in lower regions
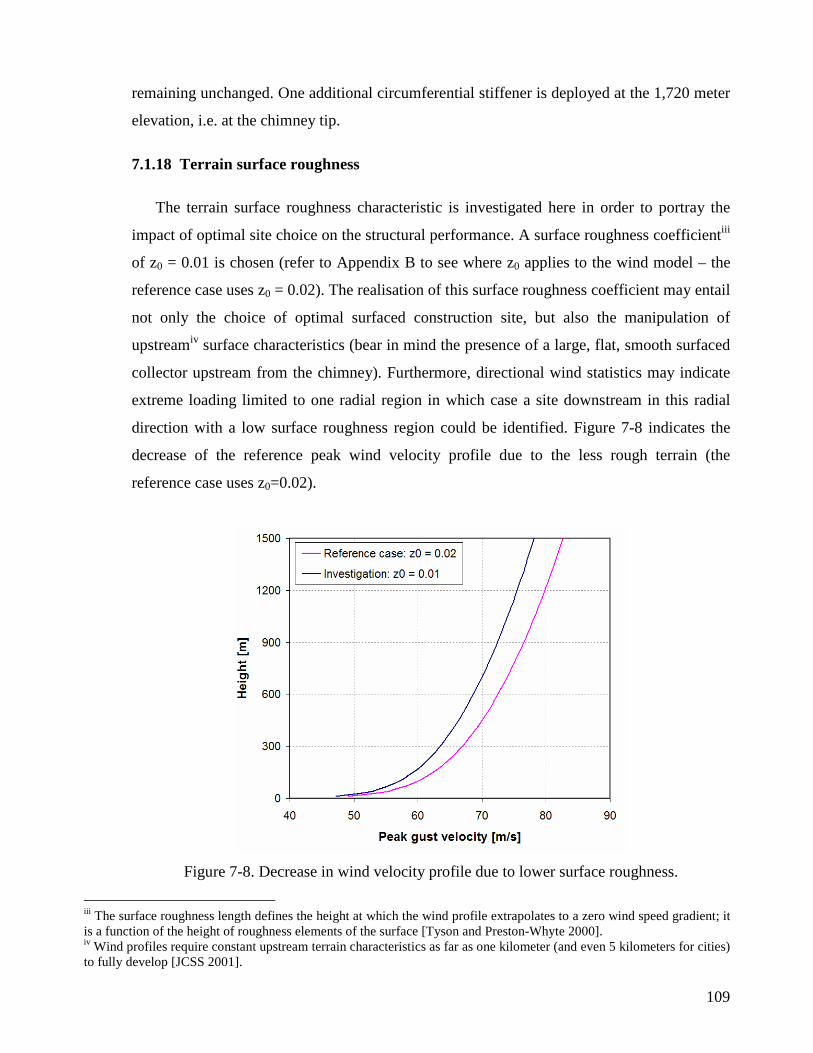
109
remaining unchanged. One additional circumferential stiffener is deployed at the 1,720 meter
elevation, i.e. at the chimney tip.
7.1.18 Terrain surface roughness
The terrain surface roughness characteristic is investigated here in order to portray the
impact of optimal site choice on the structural performance. A surface roughness coefficientiii
of z0 = 0.01 is chosen (refer to Appendix B to see where z0 applies to the wind model – the
reference case uses z0 = 0.02). The realisation of this surface roughness coefficient may entail
not only the choice of optimal surfaced construction site, but also the manipulation of
upstreamiv surface characteristics (bear in mind the presence of a large, flat, smooth surfaced
collector upstream from the chimney). Furthermore, directional wind statistics may indicate
extreme loading limited to one radial region in which case a site downstream in this radial
direction with a low surface roughness region could be identified. Figure 7-8 indicates the
decrease of the reference peak wind velocity profile due to the less rough terrain (the
reference case uses z0=0.02).
Figure 7-8. Decrease in wind velocity profile due to lower surface roughness.
iii The surface roughness length defines the height at which the wind profile extrapolates to a zero wind speed gradient; it is a function of the height of roughness elements of the surface [Tyson and Preston-Whyte 2000]. iv Wind profiles require constant upstream terrain characteristics as far as one kilometer (and even 5 kilometers for cities) to fully develop [JCSS 2001].

110
The alternatives are now (semi-) quantified and ready for the next RIM step, i.e. evaluation.
Evaluation criteria are stipulated in the next section in accordance with requirements set forward
by the board.
7.2 Evaluation model and choice of criteria
The appropriate choice of criteria as evaluation metric in the RIM is critical to set up an
evaluation model that is representative of the critical, governing elements of the (first iteration
reference case) concept. Radical innovation is often measured with the same criteria and
expectations used to assess incremental innovation, leading to a warped basis for decision-
making (refer to section 2.5.2). Where the evaluation model of incremental innovation evaluates
performance in terms of standard limit state equations, radical innovation requires a more
accommodating model in case technologies from differing fields, with differing governing
parameters and equations, are presented. Decisions during radical innovation should be based on
the envisaged benefits of the preferred state of performance of the technology and the potential
resulting market size.
This section provides background on the choice of criteria. It subsequently re-articulates user
requirements and interprets them in terms of criteria applicable to the SCPP chimney.
7.2.1 Background on choice of criteria
RIM principles could apply to all levels of the system development phase, taking into
account that with each lower level, more detail and more certainty is required (section 1.6.1).
Similarly the set of criteria on which a system is evaluated incorporate more detail with
increasing system depth. In the case of the SCPP chimney radical innovation the
conceptualisation phase demands insight into the surroundings of the concept in order to
understand and improve it. This may entail comprehensive investigation into technology
development but only in terms of satisfying the criteria as defined in the radical innovation
life cycle phase (Table 2-1 in section 2.5.2), i.e. in terms of benefits of the technology to a
potential market.
Table 2-1 in section 2.5.2 is reinterpreted for the SCPP chimney. The impact of life cycle
phase on the evaluation model follows in Table 7-1, distinguishing between conceptual, pre-

111
feasibility and feasibility considerations. Note that the evaluation model and criteria must
remain flexible to accommodate changes in the conceptual formulation with potentially
different behavioural phenomena and failure modes.
For computational simplicity the evaluation model should only involve significant and
discriminating criteria.
Table 7-1. Change of evaluation model with life cycle phase.
Life cycle phase Variability in chimney formulation – presented by adequate
criteria choice
Radical, conceptual
Significant changes in chimney concept, geometry, or configuration could lead to significant changes in evaluation model and relevant criteria.
Pre-feasibility Changes in chimney concept are minimised but may occur in concurrence with a specific site in mind. Optimisation is parametrical rather than conceptual.
Feasibility
Change occurs only in the detail; in project specific interaction with local environment (economical, political, ecological, social and technological) and in detail design specifications (reinforcement, fastenings, surveying, etc.).
7.2.2 Re-articulation of user requirements in the choice of evaluation criteria for Solar
Chimney Power Plant chimney
The reference case was set up in response to the requirements of a clean, non oil-using,
cost-effective energy generation solution, as stated in section 5.1.3. These requirements also
govern the evaluation criteria at the radical innovation phase. Relevant, representative criteria
are identified and expounded below:
Electricity cost
The SCPP chimney must be evaluated in terms of cost to fulfill its primary criteria –
the generation of clean, non-oil-using, cost-effective electricity (section 5.1.3). This is
done through the levelised electricity cost metric as was introduced in section 5.3.2.

112
Annual energy yield and system costs are hereby combined for each alternative and can
readily be compared to conventional electricity costs.
Structural integrity
The secondary SCPP chimney evaluation criteria – that of containment of the
primary cost-effective electricity generating functionality, in accordance with the
criteria breakdown in section 2.5.2 – is represented by the structural integrity required
to uphold the air through-flow channel.
Unlike the mature level of theoretical characterisation of the SCPP energy
generating performance, the insight into the SCPP chimney structural integrity is not
yet as mature. Radical innovation is still necessary and the chimney is evaluated in a
broadly conceptual sense where structural integrity and cost reduction require major
conceptual and configurational changes or realisation of technology.
Codified limit state design in Structural Engineering requires quantification of
structural resistance to design actions. Resistance and loading factors are deployed to
accommodate reliable design. Compliance to limits is sought in all – and often very
localised – parts of the system. These localised stresses could be resisted through
adequate geometrical design (in the case of thin shell reinforced concrete, added wall
thickness and reinforcement detailing) and are not necessarily indicative of the source
of failure of the innovation concept which must be addressed through technology
acquisition. Governing structural behaviour is sought and must be indicative of the
response to root-cause of failure modes.
In the SCPP chimney global buckling and dynamic wind excitation sufficiently
circumscribe these modes (these structural integrity criteria were already hinted in the
reference case set up in section 5.2 and in the estimation of radicality in section 5.3).
Global buckling represents global instability under compressive loading conditions.
Dynamic wind excitation presents structural response that is typically larger than the
static case; a quasi-static factor combined with simple static analysis provides for
dynamic structural response, in this case when the SCPP is subjected to dynamic
extreme along and across wind loading. The theoretical formulation of these criteria is
presented in Appendix C.

113
Note that although codified reliability based parameters are included in the
reference case design (e.g. the 1,000 and 2,000 year wind return period factor – refer to
Appendix B), reliability based design methods, that incorporate the material stress and
load statistics mentioned earlier in this section, are at this stage not implemented as
structural performance measures. Reliability based design methods entail the set up of
limit state equations for each failure mode for each conceptual variation, as well as the
gathering of statistical information of limit state variables. This procedure is resource
intensive and is, hence, not considered at this stage of SCPP chimney innovation where
the investigation of several concepts is commonplace. Theoretical uncertainty (section
5.3.1) can also be described through reliability measures (reliability increases with an
increase in theoretical insight). As soon as a chimney concept is fixed reliability
methods should be applied to gain insight on further technological acquisition required
to realise a reliable chimney design.
Constructability
At this radical innovation stage of the chimney development its constructability –
whether it is possible to realise the structure in terms of construction capability and
logistical feasibility – could be the factor governing project success. Examples of
constructability challenges concern the elevation at which upper elevation phases of the
construction takes place, e.g. a construction capability to pump concrete to 1,000+
meter heights is required while the climate at 1,500 meter elevation may have adverse
implications on concrete strength performance and logistical support of construction.
Due to constraints in resources this presumably critical criterion is not further
investigated in this study. Further reference to this aspect can be found in a study by
Lorek [2007]; the feasibility of constructing the SCPP from the perspectives of
construction techniques and availability of building materials was looked into. Future
research on the SCPP must further consider this critical aspect.
Multi-criteria approach
Multi-criteria decision-making (MCDM) methods where briefly mentioned in
Section 2.5.3 as a way of gaining critical overall perspective on complex system

114
performance in terms of various criteria. Its application on the current radical
innovation of the SCPP chimney is, however, complex due to correlations between
criteria – orthogonality between criteria is required. As an example, consider standard
design circumstances where a structural improvement is represented by associated cost
decrease. With the current stage of SCPP chimney development significant
uncertainties over its structural integrity govern decision-making and a mere
representation in cost criterion is not conclusive for focused decision-making. The
allocation of MCDM weighting factors to each criterion as a measure of its criticality to
overall system performance would at this stage be arbitrary; hence, criteria are (treated
as being) decoupled in this dissertation.
7.3 System performance evaluation
With the required analyses performed and data gathered for all alternatives, their impacts on
the system performance are now determined, relative to the specified criteria. The structural
evaluation model is presented in Appendix C. The cost model is presented in Appendix D.
Information on the SCPP energy yield model is presented in Appendix E. Technological
augmenting and introduction are incorporated in the reference case models to investigate
technological performance, thus forming the various alternatives. Some alternatives could not be
incorporated in the simulations. These cases are stated explicitly.
Individual results of the impact of the alternatives on the evaluation models are presented in
Appendix G, section G2. Aggregated results are reported in Appendix G, section G3, in Tables
G-25 and G-26. The impacts are related to their positioning between the reference case and the
ideal result values stated in section 5.3.1. A zero value represents 0% improvement and a 1.00
value represents the realisation of the ideal result (100% improvement), with linear variation in
between. Values are normalised and presented in order for a positive outcome to imply a positive
implication for system performance. Visual representation charts, facilitating discussion of the
LEC, buckling and dynamic response criteria, follow in this section. A comparative perspective
between criteria provides perspective on their criticality to the SCPP technology endeavour. This
in turn is followed by a vector based visualisation approach providing insight into technological
performance growth.
This discussion of the technology performance results is an integral stage during any
innovation for identifying developmental potential, gaps and shortcomings. Some technologies

115
excel and should receive more resources for potential development up to the augmented or
introduced performance. Other technological functionalities are not fully developed; resources
could be allocated to develop these functionalities up to maturity before more conclusive
judgement of its contribution to system performance can be made. Other technologies fall short
of sufficient performance levels and acquisition of functionality must focus on its resolution.
Each chart is now discussed.
Note that the lower and upper limits and quantitative estimations are not represented in the
graphs in this section. Thus, some technologies appear not to impact performance at all. The
graph must therefore be judged in consultation with Table G-25.
7.3.1 Levelised Electricity Cost performance chart
The LEC performance chart (Figure 7-9, based on data from Table G-26 in Appendix G,
section G3) reveals the parabolic hyperboloid geometry to significantly reduce costs from
R8.648/kWh to R3.756/kWh; this covers 64% of the needed improvement to reach LEC
idealityv. The increase in chimney height provides significant increased energy yield at
relatively low cost increase to cover 15% of the ideal decrease in LEC. Other notable cost
reductions are the wall thickness re-configuration (5%) and the flaring chimney exit (3%).
High material costs cause development on material elastic modulus to score poorly,
implying an adverse impact on the chimney cost. Material density reduction and inherent
damping (currently at 0% representing lower limit costs) could further increase costs.
Note that some theoretical uncertainties (wind velocity extrapolation model and terrain
surface roughness) do not perform on this chart at all and was consequently not represented;
although they may indirectly reduce structural costs, for example by improved
characterisation of conservative loading assumptions, their LEC performance is not
measurable at this early stage of the radical innovation.
v One would think that such a large cost reduction should have been incorporated in the reference case. Note, however, that the reference case was set up with the best knowledge available; by implication this cost reducing technology was not yet enjoying sufficient priority to justify its incorporation in the reference case. This illustrates how the systems approach facilitates the comprehensive identification of opportunities for development during the radical innovation.

116
Figure 7-9. Normalised LEC performance for various alternatives.
7.3.2 Buckling performance chart
The buckling performance chart (Figure 7-10, based on data from Table G-26 in
Appendix G, section G3) reveals several technologies that score well in this metric. Wall
thickness re-configuration performs the best at 63% of the ideal improvement, the material
elastic modulus increase doubles the reference case critical buckling factor to 48% of the
required improvement, the added circumferential stiffeners contribute 32% improvement and
the wind velocity extrapolation model 31%. Terrain surface roughness and the Saguaro
geometry contributes a potential 12% and 9% (lower limit), respectively. Note: these
technologies in combination could mitigate buckling completely.
The flaring chimney geometry, increased chimney diameter and different circumferential
stiffener concept have adverse impact on performance by -28%, -15% and -13%,
respectively. Note that the material density, internal damping and parabolic hyperboloid
geometry do not contribute to the buckling performance.

117
Figure 7-10. Normalised buckling performance for various alternatives.
7.3.3 Dynamic response performance chart
The dynamic response performance chart (Figure 7-11, based on data from Table G-26 in
Appendix G, section G3) reveals several technologies that improve the dynamic response far
exceeding the ideal requirement. Material elastic modulus contributes more than four and a
half times the required 100% for ideality, terrain surface roughness contributes more than
three times, increased chimney diameter and wind velocity extrapolation contributes just
below four times, internal damping contributes more than double and material density one
and a half times.
This criterion is also functional in portraying adverse impact on dynamic structural
response. Two technologies would, if they are implemented in their current formulation,
expose the system to critical adverse dynamic response, i.e. wall thickness configuration and
increase in chimney height. These both score poorly due to their proximity to critical wind
velocities with consequent lock-in behaviour. Note that the implementation of the cross wind
force spectrum mitigates the adverse dynamic response in the increased chimney height
alternative by almost three times. The parabolic hyperboloid technology also portrays
adverse impact.

118
Figure 7-11. Normalised dynamic response performance for various alternatives.
7.3.4 Relative performance and contradictions
A systems perspective on technological impact – its performance in several governing
criteria – provides a framework from which technological trade-off can be managed toward
realising an optimal SCPP chimney system. With the specific gaps and contradictions
identified, technologies can be acquired to fulfill the required functionalities. For example,
external damping or cable staying mechanisms can be implemented against adverse dynamic
response in wall thickness configuration (negative impact of this technology) in order to
utilise the positive elements in the impact of this technology. Note that a thoroughly
implemented MCDM approach would compact the charts (in sections 7.3.1-3) that is set up
for the decoupled criteria into one comprehensive chart which may serve communicating
RIM findings better.
The criteria are compared by visual means in Figure 7-12. Note that dynamic response is
not included for better visualisation of the other two criteria, because its impacts are
significantly larger (in terms of percentage) than the other two criteria. From the figure it is
clear that LEC contribute less improvement (in terms of the respective technologies) than
buckling – four technologies score well in the buckling criterion while only one scores well

119
in the LEC criterion. R&D allocation toward mitigating buckling may contribute more
successful technologies than to further LEC reduction. Note, however, that the significant
LEC reduction of parabolic hyperboloid contributes significantly to the SCPP system
feasibility as a cost-effective energy generation technology.
Figure 7-12. Combination of the LEC and buckling charts to provide a perspective on overall
performance.
Another aspect deduced from Figure 7-12 is the contradictions (or correlations) in the
impact of individual technologies on the various criteria, e.g. the wind velocity extrapolation
decreases the wind action resulting in positive impact on both buckling and response criteria
(refer to Figure 7-11 for response results). The adverse response to the buckling criterion of
the flaring geometry could be off-set by a slight LEC increase. The circumferential stiffener
concept has little impact on cost but significant impact on buckling behaviour. Material
elastic modulus scores well in the buckling and dynamic response criterion, but results in an
increase in LEC. Material density and internal damping mitigates adverse dynamic response,
but does not score in the other criteria. The parabolic hyperboloid scores well in LEC
reduction with (relative) adverse response to the dynamic response criterion. The increased
chimney diameter mitigates dynamic response, but with adverse impact on buckling. The

120
number of circumferential stiffeners increases buckling mitigation with little effect on other
criteria. The wall thickness re-configuration scores well in buckling mitigation but fails in
dynamic response. The Saguaro geometry has positive (lower limit) impact on buckling and
response, with small (lower limit) impact on LEC. The increased chimney height scores well
in LEC reduction but fails in dynamic response. Terrain surface roughness decreases the
wind load with consequent positive impact on buckling and dynamic response.
7.3.5 Technology growth
Technology performance trends are not evident in the previous charts. Representation in
Figures 7-13, 7-14 and 7-15 provides a vector approach (developed in this study) where the
measure of improvement on performance as well as the rate of improvement relative to other
improvements – and ideal improvement – are portrayed, thus providing more information on
technological potential. These graphs portray linear technology performance change, based
on the position of one performance data point relative to the reference data point (0;0).
Further data points could provide important information about the linearity/non-linearity of
technological performance trends. Note that the upper right quadrant represents the
“favourable” region for technological performance.
Buckling portrayed against LEC performance in Figure 7-13 yields the following
interesting insights. Parabolic hyperboloid geometry and chimney height increase, as well as
wall thickness re-configuration and material elastic modulus, yield growth toward the
favourable quadrant. No technologies do, however, contribute diagonally in the direction of
the ideal result. They contribute either in the one or in the other criteria and therefore remain
on the periphery of the favourable quadrant.
Dynamic response portrayed against LEC performance in Figure 7-14 also yields a few
technologies on the perimeter of the favourable quadrant (material elastic modulus, terrain
surface roughness, increased chimney diameter and wind velocity extrapolation), but with no
impact on LEC performance. Material elastic modulus and the parabolic hyperboloid
geometry diverge from the favourable quadrant. The wall thickness re-configuration and
increased chimney height, drive technology performance in the opposite direction of positive
impact (in terms of response), with the implementation of the smaller cross wind force
spectral value decreasing the adverse dynamic response in the increased chimney height
alternative by almost three times.

121
Figure 7-13. Vector approach portraying technology growth: buckling against LEC.
Figure 7-14. Vector approach portraying technology growth: dynamic response against LEC.
Buckling portrayed against dynamic response performance in Figure 7-15 yields a few
technologies in the favourable quadrant due to the correlation between their structural

122
functions. Material elastic modulus, wind velocity extrapolation and terrain surface
roughness score well in the response criterion and moderate in the buckling criterion thereby
moving toward the ideal result. The number of circumferential stiffeners and Saguaro
geometry portray moderate growth toward the ideal result. The wall thickness re-
configuration and increased chimney height again portray adverse growth (in terms of the
currently discussed criteria). The implementation of the smaller cross wind force spectral
value could decrease the adverse dynamic response in the increased chimney height
alternative by almost three times.
Figure 7-15. Vector approach portraying technology growth: buckling against dynamic
response.
The vector visualisation approach could provide better visualisation (for this case, where
there are only three performance measurement criteria) if all dimensions could be represented
simultaneously in a three dimensional representation. The more dimensions presented
(efficiently), the more information can be conveyed in a single glance.

123
7.4 Identification of critical technologies
Core technologies are distinguished from those that have less potential impact on system
performance; non-contributing technologies are filtered out. Several conclusions can be made
from the results, pointing toward specific technologies of potential critical influence. There are
several technologies that do not yield satisfactory improvement to justify resource expenditure to
develop and implement them. Others show significant to extremely significant improvement.
The next paragraphs identify these technologies.
The most significant technology improvement in terms of cost reduction is the incorporation
of parabolic hyperboloid geometry in the system. The large cost reduction lower limit and
relatively small impact on structural performance (moderate adverse dynamic response) weighs
heavy in favour of this technology incorporation.
Four technologies are distinguishable on the grounds of their contribution to mitigating low
buckling modes. The wall thickness re-configuration may prove critical if adverse dynamic
response can be mitigated. Material elastic modulus improvement has significant impact on
structural integrity with moderate adverse cost impact. The better characterisation of wind
turbulence model displays positive structural impact with no implications for the LEC. Finally,
the implementation of more circumferential stiffeners, coupled with the realisation of its concept
may improve buckling performance.
There are several technological alternatives meeting the ideal requirements when concerning
the dynamic response. This criterion proves to be fairly straight-forward to accommodate in
design and it does not require critical R&D toward chimney realisation. Still, it is noteworthy to
identify the wind extrapolation and material elastic modulus as portraying significant impact,
with the chimney diameter and the terrain surface roughness also showing favourable results.
Wall thickness re-configuration and increased chimney height yield adverse dynamic response.
Several technologies remain insufficiently characterised. Cable stiffening and external
damping devices promise potential alleviation of dynamic resonant modes at a relatively small
cost increase and no impact on the energy yield. A directionally designed structure that promises
a structure intelligently designed to circumferentially adapt to local weather prevalence could
further decrease costs.

124
7.5 Concluding discussion
This chapter formulated conceptual technological alternatives and stipulated the criteria on
which their impact on system performance was assessed. Performance results were calculated for
comparison and identification of critical technologies. The core technology priorities, based on
their impact on system performance, are summarised in this section. The chapter concludes with
a brief summary of the results and a discussion of the models used in RIM applications, based on
experience gained from its application on the SCPP chimney.
7.5.1 Technologies for consideration during further Radical Innovation Methodology
phases
Without having yet performed the phase of the RIM where technology maturity and
growth potential is determined, the following points can be made from the system
performance evaluation results.
Five technologies are distinguished on the grounds of their impact on system
performance. These are:
• the parabolic hyperboloid geometry,
• wall thickness re-configuration,
• material elastic modulus,
• the more accurate characterisation of the wind extrapolation model and
• the number of circumferential stiffeners.
The under characterised technologies (cable stiffening, external damping and the notion
of directional wind based detail design) could significantly impact the chimney performance.
The results of the vector based visualisation prove that the technologies are seldom
successful in satisfying all criteria or to engage the most favourable criteria quadrants.
Further conceptualisation must aim to solve the contradictions identified in the vector based
representation in order to move technological achievement into the favourable sectors.
7.5.2 Discussion of model, data quality and visualisation
The representation of reality through a model contains inherent loss of information
through simplification, shortcomings, uncertainties and assumptions. The model must be
representative within reasonable resource deployment. Critical failure modes must be
125
represented. The more resources that are deployed the more insight and characterisation of
the radical problem is gained; with possible consequential improvement in results.
Although a model must represent and accommodate as many as possible of the failure
modes, the most important aspect of systems based conceptualisation/design – and model set
up – is the comprehensive approach toward improving the awareness and understanding by
the decision maker of all aspects of the system, and their impacts on various
criteria/perspectives. This is not always quantify-able but may remain qualitative.
Comprehensive data quantifying all aspects of the system behaviour will seldom be
acquired. This can be subdivided in two areas.
Firstly, the data itself may be unavailable or inadequate and only additional, focussed
resource allocation may generate the necessary data to yield significant, quantitative answers
in the evaluation process. As data is acquired or generated it can simply be imported in the
current evaluation model; the model can be revised as needed in order to form a better
representation of actual impact of technologies on the system.
Secondly, simplifying assumptions in modeling capabilities carry an inherent loss of data
– complex theory cannot be readily incorporated in robust models. It is of critical importance
that the user of the model is aware of the shortcomings of the model and interprets results
accordingly.
Further, note that technologies that are not quantified (external damping, cable staying
and directional design) are excluded from this representation.
Efficient visualisation methods
Numerous alternate visualisation methods exist to convey information. The ones
considered most appropriate for the SCPP specifically were used here. Others may be
more appropriate for other RIM applications, and should be sought out and tailored.
The next chapter reports the technology assessment process of the technologies determined as
critical in this chapter. This entails the characterisation, classification, trend identification and
determination of R&D risk of the technologies identified according to the guidelines specified in
section 4.1.4.

126

127
CHAPTER 8
TECHNOLOGY ASSESSMENT,
TREND IDENTIFICATION
AND RESEARCH AND
DEVELOPMENT RISK OF
CRITICAL SCPP CHIMNEY
TECHNOLOGIES
In the previous RIM phases the SCPP chimney reference case was broken down to its essential
technologies through functional allocation, failure mode identification and technology scan. These
technologies were explored in sufficient detail and subsequently evaluated to determine their
potential impact on SCPP chimney system performance. A few technologies emerged as critical
toward achieving radical improvement of chimney system performance.
This phase of the RIM provides approaches and tools for handling the functional uncertainties
identified in the technology identification phase. In incremental innovation codified procedure and
field theory provide sufficient insight for the development process; radical innovation does not have
this luxury – the uncertainties are functional in nature and not parametrical. The current chapter
furthers the RIM with the assessment of technologies – in characterisation, classification and trend
identification steps – to better grasp the characteristics and maturity (i.e. growth potential) of
technologies in the system. This leads to knowledge of the potential benefit of technology
improvement to the system performance. Expert input provides the technology manager with cutting
edge technology trend information. R&D risk is determined for each technology alternative.
8.1 Characterisation of technologies
The technology characteristics frameworks describe the inherent characteristics of
technologies (section 3.3). The previous chapter provides an evaluation of the technologies from
a physical performance perspective; and the vector based visualisation aids the technology
manager to determine what performance is required from a technology to satisfy the user defined

128
criteria. The current section describes the technologies in terms of their inherent characteristics in
order for the technology manager to know which progressions and acquisitions in technology
would aid the system.
Table 8-1 displays the information of the characteristics for all identified system
technologies in terms of the basic feature characteristics stipulated by the STA (section 3.3). The
table deals first with the identified core technologies, then with the under-characterised
technologies and concludes with the technologies that were determined to perform poorly during
system performance evaluation in Chapter 7.
Table 8-1. Framework of Basic Features for the SCPP chimney.
Characteris-tic
Function Principle of operation
Performance Structure Fit in
system hierarchy
Material Size
Five top technologies Parabolic hyperboloid geometry
Inherent geometrical stabilisation; transfer of forces to foundation
Doubly curved shape displays inherent stabilisation properties; economically efficient use of material
Refer to section 7.1.10. Large success through this concept. Note: no specific concept optimisation was done
Positioned in region requiring stability; cooling tower shape of sufficient thickness to resist buckling, quasi static loads and contain reinforcement
Chimney tube structural integrity longitudinal stiffening
Reinforced concrete, i.e. compression and tension resistant composite; buckling resistant
Order of 100 m (diameter)
Wall thickness re-configura-tion
Stabilisation of geometry while adhering to all limit state criteria; containment of reinforcement
Design against geometry related localised and global buckling modes; leaving enough space for reinforcement containment
Refer to section 7.1.13. Note: No specific concept optimisation was done
Chimney shell thickness configuration
Chimney tube structural integrity circumferential stiffening
Reinforced concrete; i.e. compression and tension resistant composite; buckling resistant
Wall thickness of between 0.18 and 1.95 m
Material elastic modulus
Governs structural stiffness
Improvement of tendency of concrete to deform elastically under loading.
Refer to section 7.1.8. Note: No specific concept optimisation done; the maximum as found in literature chosen
Material characteristic determining stress-strain behaviour
Chimney tube structural integrity improved material characteristic
Reinforced concrete; could be another (higher elasticity) material
Micro material structure
Wind velocity extrapola-tion model
Describes gusting in the thunderstorm related wind
Mathematical formulation based on statistical data
Lack of sufficient measurement methods/resource hinders accurate quantification of thunderstorm gusts
Wind based action determining design loads and structural response
Fundamental theory
N/a; air-based turbulence, fluid dynamics in meteorology
Macro-scale turbulence model in adiabatic boundary layer
Number of circumferen-tial stiffeners
Added stabilisation against buckling and ovalling, circumferential stiffening
Cables in tension when shell experience external suction; more stiffeners = more stability
Typically diminishes deformation by one order.
Schlaich/Kratzig cable-stiffening concept
Chimney tube structural integrity circumferential stiffening
Presumably structural steel or carbon fibre
Cross sect’l area depends on forces; spans chim inner area, max length of 160 / 200 m
Insufficiently investigated technologies Cable support
Stabilisation against
Tensile resistant material connected
Great success in telecom towers
Set of cables designed to
Chimney tube
Mild or high strength steel,
Cables spanning

129
adding lateral stiffness
buckling and resonant response
to shell upper regions, fastened at zero level, providing additional support
and other slender structures; investigation to SCPP chimney indicates potential
provide necessary lateral stiffening
structural integrity lateral stiffening
polyester or synthetic fibres
between 680 and 1273 m; significant thickness
External damping devices
Mitigation of resonant vibrations
Inertia of great mass is balanced by comparatively lightweight structural component
Although increasing use in high-rise buildings, applicability to SCPP chimney remains uncertain
Several concepts exist: Tuned Mass Dampers consists of counterweight mass mounted using massive spring coils or hydraulic dampers
Chimney tube structural integrity external damping
Many concepts exist utilising fluids and solids
Percentage of vibrating mass; 2-4% in wind turbines [Faber]
Directional design
Optimise design to reduce costs
Use statistical wind directional data for radial state limit design
N/a Optimisation of shell, transfer section and foundational geometry
Chimney tube structural integrity directional design
N/a Design approach applies over full scale of chimney, also foundation
Low scoring technologies
Characteris-tic Function
Principle of operation
Performance Structure Fit in system hierarchy
Material Size
Wind direction variations over chimney height
Investigate load cases due to directional variation in wind profile over height
Use statistical wind directional data to set up load cases
Robust investigation by Rousseau [2005] indicates excitation of higher SCPP global vibration modes.
Definition of load cases
Fundamental theory
N/a Design approach applies over full scale of chimney
Applicabil-ity of prescribed critical buckling factor
Investigate applicability of critical buckling factor on SCPP chimney
Perform non-linear buckling analyses incorporating initial displacement and imperfections to translate to linear elastic condition
N/a Definition of critical buckling load factor
Fundamental theory
N/a Design approach applies over full scale of chimney
Cross wind force spectrum
Characterisa-tion of cross wind spectral values corresponding to natural frequency
Characterisation of cross wind force spectral values exerted on structures due to lateral air movement
Refer to section 7.1.4.
Wind based action determining quasi static design loads
Fundamental theory
N/a Size of structure
Flaring of chimney exit geometry
Decrease exit pressure losses
Flaring enlarges inner area close to chimney exit and reduces kinetic energy loss
Energy yield increases slightly but semi-localised buckling lowers significantly
Quadratic enlargement of area chosen with wall thickness as for reference case
Chimney tube optimal airflow channel flaring
Reference case materials
Doubling of exit area
Chimney inner surface treatment
Reduction of inner surface friction losses
Smoothening of inner surface to reduce friction losses by surface treatment
Change in energy yield is negligible
Surface friction is decreased by some surface treatment
Chimney tube optimal airflow channel surface friction
Specified friction surface treatment
Chimney surface
Circumfe-rential stiffener concept
Decrease in circumferential stiffener pressure loss coefficient through alternative concept
Decreasing concept solidity decreases aerodynamic drag losses
Exact values n/a. Typically yields higher energy but lower buckling values/natural frequencies. Kratzig concept proves to work best
Assumed concept: half the number of braces of that of the reference case implemented
Chimney tube structural integrity circumferential stiffening
Presumably structural steel or carbon fibre
Cross sectional area depends on forces; spans chimney diameter

130
Material density
Decrease mass in upper region of chimney toward lower natural frequencies
The mass contribution by the upper region decreases less activation of these parts to vibration; lower density through air entrainment/ low density aggregate
Decrease in global natural frequency with adverse impact on buckling resistance
Lower density aggregate with more air entrained in concrete
Chimney tube structural integrity improved material characteristic
Presumably reinforced concrete; additives or other material may prove useful
Material level, with macro impact
Material internal damping
Decrease in dynamic structural response
Change in material matrix/substance to achieve higher damping ratio
Refer to section 7.1.8.
Fibres or other additives to increase damping ratio
Chimney tube structural integrity improved material characteristic
Concrete variant e.g. fibre-reinforced concrete
Material level, with macro impact
Increased chimney diameter
Increase energy output and 1st global natural frequency
Larger enclosed volume form larger pressure differential; Larger diameter = increased cross sectional resistance to bending;
1st global natural frequency higher; semi-localised buckling persists, along wind response slightly lower
Increase of diameter; wall thickness change over height assumed to remain as for reference case
Chimney tube structural integrity longitudinal stiffening
Reference case materials
Order: 100 – 250 m diameter
Wind-structure interaction manipula-tion: Saguaro geometry
Saguaro geometry significantly decreases circumferential pressure distribution peaks; potential structural resistance
Manipulates turbulence and vortex separation; geometry realised from non-structural or structural
Reduces suction peak from Cpe ≈ 2.5 to Cpe ≈ 1.0
Saguaro geometry ribs constructed from non-structural material, e.g. membrane or reinforced concrete
Chimney tube structural integrity manipulation of wind-structure interaction
Membrane or structural material e.g. reinforced concrete
Situated from mid to upper regions of chimney; Rib radius = 1.14 × Dchimney
Increased chimney height
Increase energy output
Larger enclosed air volume and lower pressure at tower tip form larger pressure differential between inside and outside
Increases in energy weighed with significant decrease in global free vibration frequency
Elongation of current chimney geometry; assume wall thickness to remain constant
Energy yield increase
Reference case materials
220 m added in height
Terrain surface roughness
Choice of optimal site from terrain roughness perspective
Surface roughness coefficient significant in wind extrapolation model. Optimal terrain impacts wind load and turbulence
Refer to section 7.1.18.
Wind based action determining quasi static design and buckling loads
Chimney tube structural integrity
Earth surface manipulation / Fluid
Micro into macro level
The investigation of the technological characteristics observes aspects serving as a basis for
subsequent technology acquisition, for example, the fact that not many technologies are
primarily directed to mitigate SCPP chimney costs (conceptual thinking along this impetus may
yield cost mitigating technologies). Problem solving specifically aimed at solving contradictions
can be combined with other technological insight to approach challenges in a fresh, lateral
manner.
The Framework of Basic Features characterises the type of system and possible solutions
(similar technologies identified through a taxonomical perspective). Development for setting up

131
such a taxonomical structure – reported in the next section – could aid radical innovations such
as the SCPP chimney toward pro-actively searching for solutions rather than having to wait for
chance and semi-structured problem solving methods to direct R&D strategy.
8.2 Technology taxonomy
The SCPP chimney and its systems are classified by way of the Nine Cell Technology
Functional Classification Matrix (section 3.3.2) on the hierarchy levels identified in section 6.4
(Figure 6-5) in order to sort it relative to other technologies for discovery or identification of
similar potentiall influential technologies.
The chimney is, at the highest level, a functional entity responsible for conveying
(transporting), air (matter) from the collector centre to the lower pressure mid tropospheric
layers.
8.2.1 Level 2 – foundation and chimney-to-foundation transfer systems
The foundation system and its Level 3 functionalities store, transport and process
transferred loads (energy) to the substrate. The chimney-to-foundation transfer system and its
Level 3 and 4 functionalities facilitate initial transport of air (matter) moving from the
collector to the chimney base. Further, it transfers loads to the foundation. As stated in
section 6.4, this dissertation focuses on the innovation of the chimney tube.
8.2.2 Level 2 – chimney tube system
The tube system is responsible for upholding the through-flow channel, i.e. keeping the
basic tube shape without significant internal obstructions. It transports air (matter) through
the tube and stores, transports and processes incoming kinetic wind energy into mechanical
and potential energy which is dissipated through damping or transferred to the foundation of
the chimney and away from the system.
The tube system consists of two Level 3 subsystems that can be classified individually:
optimal airflow channel and structural integrity.
Level 3 – optimal airflow channel
The airflow system transports air (matter) from lower parts of the tube to upper parts
with the proposed diffuser, tube and flaring geometry processing the kinetic energy to be

132
high at the turbine position for optimal force on the turbine blades. Deceleration of air
before the exit minimises exit losses. The Level 4 systems – flaring, surface friction,
aerodynamic shaping of flow obstructions and chimney height increase – advance those
functionalities.
Level 3 – structural integrity
The main function of the chimney – being a cost efficient, structurally sound
prismatic shape for channelling movement of air – is supported by structural technologies
and enhanced through stabilisation systems increasing its structural integrity. The Level 4
systems classifications are as follows:
Improved material characteristics, higher longitudinal and circumferential structural
stiffness, geometrical stabilisation and the wind-structure interaction manipulation cause
the system to absorb and process less of the kinetic wind energy into deformation and
high vibration frequencies with coinciding modes. When functioning properly these
technologies could assist avoidance of global structural deformation both under quasi-
static and dynamic wind loading. This could mitigate or circumvent high localised
internal energy caused by strong localised deformation, and transfer internal energy into
the global structure leading to favourable global deformation in resistance to loading
action.
The potential damping contribution of an external damping device is a temporal,
delayed reaction energy storage mechanism which releases the energy at the tuned
instant.
The Saguaro geometry manipulates the wind–structure interaction to absorb and
process less of the kinetic wind energy.
Directional design optimises the structure to perform at limit state criteria processing
the kinetic wind energy optimally toward achieving cost reduction.
Table 8-2 displays the Nine Cell Technology Functional Classification Matrix containing the
SCPP chimney systems up to the fourth level. The SCPP chimney and its subsystems fulfil the
functions of processing and transferring load-based energy while transporting air-matter arriving
from the chimney-to-foundation transfer system into upper air regions. Damping systems
temporarily store energy. Chimney subsystem technology functionalities operate in four cells of

133
the matrix: transporting matter and processing, transporting and storing energy. Systems
fulfilling similar functions can be compared to SCPP chimney technologies for their potential
acquisition in the chimney system with aid from this technology classification framework.
Table 8-2. Nine Cell Technology Functional Classification Matrix classifying the SCPP
chimney systems to the fourth level. The systems level is indicated in brackets.
Ways of handling
Process Transport Store
Matter
Chimney system (1) Tube system (2) Chimney-to-foundation transfer (2) Optimal airflow channel (3)
Energy
Foundation system (2) Tube system (2) Chimney-to-foundation transfer (2) Structural integrity (3) Material improvements (4) Lateral stiffening (4) Circumferential stiffening (4) Manipulation of wind-structure interaction (4) Geometrical stability (4) Wind-structure interaction manipulation (4) Directional design (4)
Foundation system (2) Tube system (2) Chimney-to-foundation transfer (2) Structural integrity (3) Circumferential stiffening (4)
Foundation system (2) Chimney-to-foundation transfer (2) Structural integrity (3) External damping (4)
Asp
ects
han
dled
Information
8.3 Identification of trends
Trend identification is performed to determine the maturity of the SCPP chimney system and
subsystem technologies and award a rank to each investigated technology.
Figure 8-1 displays the life cycle stages along a technology S-curve (as example of a typical
technology trend curve). A key for the ranks and a description thereof is provided in Table 8-3.
Each technology for which trend identification was performed is briefly discussed; all
technologies are subsequently awarded ranks. Although in this study this procedure is performed

134
by the author alone due to resource constraints – further research must perform more thorough
investigation of technology rankings – it suffices in illustrating the application of the RIM.
Figure 8-1. Technology S-curve displaying rankings.
Table 8-3. Key for technology trend status ranks.
Rank Description 1 Research initiates technology development; minimal supportive/parallel research
efforts.
2– Increasing R&D activity; significant strides in performance improvement
2 Increasing amount of R&D; constant performance improvement
2+ Saturation of R&D effort; declining performance improvement
3 Additional research has little improvement on performance
4 Technology becomes obsolete
The investigation is performed for the highest level SCPP and similar chimney structures,
and on the five top technologies that emerged from the success evaluation procedure.
Technologies that are under-characterised, but promise significant impact on the system (cable
staying, external damping and directional design) also undergo trend identification in order to
gain insight into their growth potential.
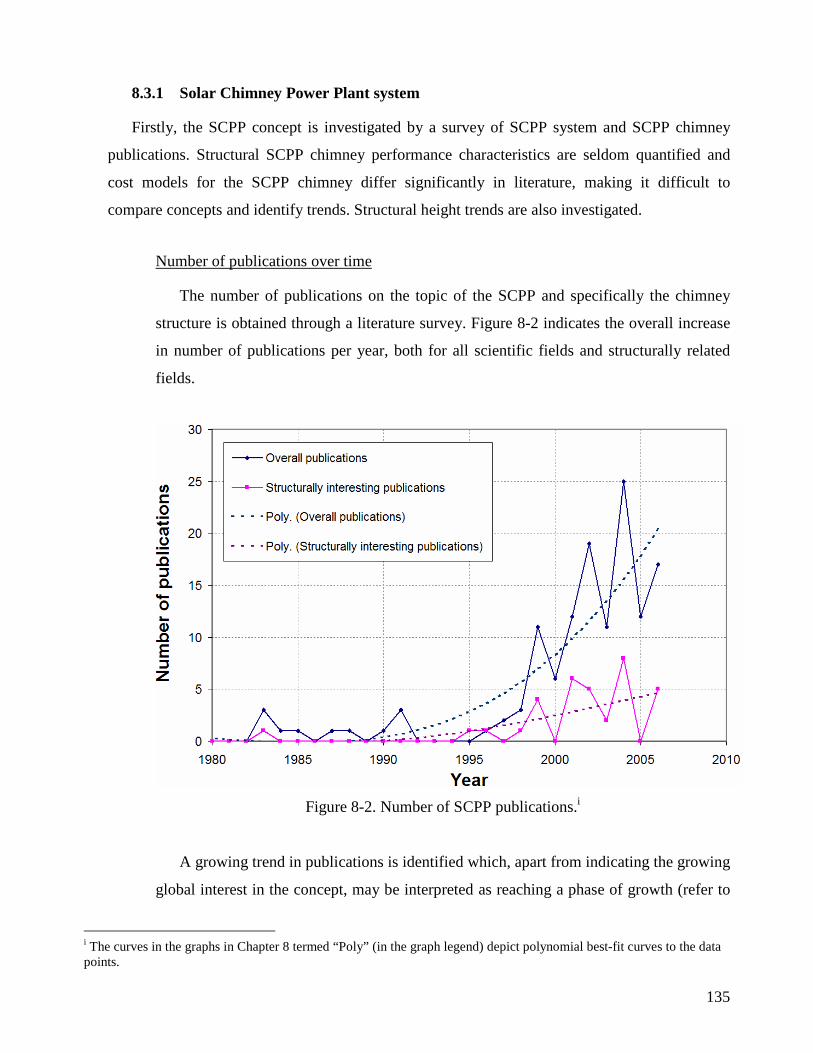
135
8.3.1 Solar Chimney Power Plant system
Firstly, the SCPP concept is investigated by a survey of SCPP system and SCPP chimney
publications. Structural SCPP chimney performance characteristics are seldom quantified and
cost models for the SCPP chimney differ significantly in literature, making it difficult to
compare concepts and identify trends. Structural height trends are also investigated.
Number of publications over time
The number of publications on the topic of the SCPP and specifically the chimney
structure is obtained through a literature survey. Figure 8-2 indicates the overall increase
in number of publications per year, both for all scientific fields and structurally related
fields.
Figure 8-2. Number of SCPP publications.i
A growing trend in publications is identified which, apart from indicating the growing
global interest in the concept, may be interpreted as reaching a phase of growth (refer to
i The curves in the graphs in Chapter 8 termed “Poly” (in the graph legend) depict polynomial best-fit curves to the data points.

136
Figure 8-1 for the life cycle phases in the technology S-curve). The number of
structurally inclined publications is also increasing, indicating growth in this area.
Trend in height of structures
Height, being the most representative parameter concerning structural challenges in
the SCPP chimney concept, is investigated here in terms of its evolution. The history of
height records of free-standing and cable-stayed chimneys, towers, masts and buildings
[Wikipedia 2 2007] are depicted in Figure 8-3. A trend emerges predicting a gradual
second-order increase in the height-to-year gradient; note that a height of approximately
800 meters is assumed for the Burj Dubai which is to be completed in 2008/9. Several
proposed structures indicate a further increase in this gradient with proposed heights of
1,852 meters for the Al Jabar tower, Bahrain, 1,050 meters for a tower in Dubai, UAE,
1,022 meters for the Murjan Tower, Bahrain and 1,001 meters for a tower in Madinat al-
Hareer, Kuwait [Wikipedia 2 2007].
Figure 8-3. Extrapolation trend based on the tallest man-made structures over the past
150 years.

137
Extrapolation of the current trend as produced in Figure 8-3 predicts that by 2050
technology could enable structures to scale heights exceeding 1,100 meters and 1,500
meters around 2100. Note that these predictions are strongly susceptible to political and
economical endeavour, for instance, the current rivalry in the Middle East for the prestige
of show-casing the tallest structure in the world. Sustained urbanization of the world
population with consequent space shortages could also provide powerful impetus toward
building taller structures.
The chimney concept, in terms of its structural height, shows an overall upwards
trend over time and is awarded a growing rank of 2– (positive curvature on Figure 8-1).
8.3.2 Parabolic hyperboloid geometry
Although the structural behaviour of doubly curved shells is well understood, mature and
widely publicized, the mergence of parabolic hyperboloid geometry with general height
requirements of chimneys, such as those needed in natural draught cooling towers, depicts a
linear growing trend over the past decades. Figure 8-4 shows this trend on an extrapolation of
cooling tower height chronology [Harte 2007]. The data points indicate how cooling tower
design heights, optimised in terms of structural reliability and economic criteria, increased
over the past century. On the basis of this trend it is envisaged that cooling towers will be
constructed up to heights of almost 300 meters by 2050.
The structural and practical applicability of this technology to SCPP chimney geometry is
currently under intense investigation by experts in cooling tower structures and reinforced
concrete shells. If realised, this radical increase in height may represent a significant
deviation from the linear trend – a radical leap in the capability of this technology from its
projected growth.
Structural height of cooling towers, as a representative of the performance of parabolic
hyperboloid shaped reinforced concrete structures, shows a growing, linear trend over time
and is awarded a growing rank of 2 (linear on Figure 8-1).
8.3.3 Wall thickness re-configuration
The wall thickness configuration merely requires specific design and optimisation – no
technological performance breakthroughs are expected. It is awarded the mature rank of 3.

138
Figure 8-4. A linear trend fit to cooling tower (parabolic hyperboloid shaped) height
increase over time.
8.3.4 Elastic modulus
Factors affecting concrete elastic modulus
In concrete – a heterogeneous material – the volume fraction, density and modulus of
elasticity of the principal constituents, as well as the characteristics of their interfacial
transition zone, determine the elastic behaviour of the composite [Mehta and Monteiro
2006].
The impact of constituents and their transition zones on the elastic modulus are
briefly introduced. Aggregate with higher elastic modulus increases the concrete modulus
of elasticity. Aggregate size, shape, surface texture, grading and mineralogical
composition influences the micro-cracking in the interface transition zone and thus affect
the shape of the stress-strain curve. The elastic modulus of the cement paste matrix is
determined by its porosity, which is in turn controlled by the water-cement ratio, air
content, mineral admixtures and degree of cement hydration. Capillary voids and micro-
cracks are more common in the interfacial transition zone than in the paste matrix and
play an important part in determining the stress-strain relations in concrete. Several

139
factors control its quality of binding with the paste, i.e. water-cement ratios, mineral
admixtures, aggregate size and shape, degree of consolidation, degree of hydration and
the chemical interaction between aggregate and cement paste.
It is concluded that concrete elastic modulus is susceptible to a range of factors, each
of which, in the light of the determined structural gain (section 7.4), could be optimised
to achieve a higher elastic modulus. Consideration of an optimal choice of construction
site, with favourable materials available on-site, is advisable to reduce costs.
Concrete strength and elastic modulus trends
Conventional concrete is characterised as low, moderate and high-strength exhibiting
strengths of less than 20, 20 to 60 and more than 60 MPa, respectively [Van Zijl 2008].
Figure 8-5 presents the view of a German cooling tower expert on growing trends in
concrete strength [Harte 2007], predicting strengths ranging from 200 to 500 MPa.
Developments in ultra-high strength concretes produced composites that confirm his
view, with compressive strengths of between 200 MPa and 800 MPa, depending on the
curing conditions (reactive powder concrete (RPC) contains a high fiber volume and is
pressure and heat treated) [Mehta and Monteiro 2006].
Figure 8-5. A view on developments in concrete strength [Harte 2007].

140
Normal weight and strength concretes exhibit a modulus of elasticity ranging between
21 and 34 GPa while high strength concrete has reached values of 47 GPa [Mehta and
Monteiro 2006]. Literature reports elastic modulus values of 60 GPa for RPC (200 MPa
strength) and values up to 70 GPa for slurry-infiltrated-fibered concrete (SIFCON –
concrete containing 4–20% steel fiber content). No mathematical formulation for
strength–elastic modulus curves exist for ultra-high performance concretes but
Suksawang et al. [2006] determines the “Gardner”-formulation to be the best fit to high
performance concrete experimental data. Figure 8-6 extrapolates the Gardner data with a
power curve and compares it with data points for RPC and SIFCON. This investigation,
however not directly applicable to ultra-high strength concretes, indicates a positive
growth trend in elastic moduli toward values exceeding the augmented elastic modulus of
60 GPa (section 7.2.8).
Figure 8-6. An extrapolation of the Gardner-formulation indicates a potential trend in
future elastic moduli growth.
Current level of maturity
The physical limit of the elastic modulus of concrete is difficult to determine due to
its composite nature. The current level of maturity of concrete elastic modulus is a
function of development of its constituents and their interrelation; there is no easy way to

141
measure something that has such aggregate, universal applications [Wunderlich and
Khalil 2004]. Figure 8-6 suggests a period of growth lying ahead for concrete technology.
Furthermore, technology replacement theory (refer to Section 3.6.1) suggests that sub-
curves (the ellipsoids in Figure 8-5) underlie the overall concrete strength growth curve,
indicating that the generation of normal concretes was replaced by a generation of high-
strength and high performance concretes which is currently being replaced by a
generation of ultra-high strength concretes.
A final note concerns the cost of these ultra-high performance concretes. The
structural gain of these composites currently comes at significant financial costs (due to
cost of high cement content, heat treatment, high fiber cost, construction related costs or
combinations thereof) compared to traditional concrete structures. Therefore its
implementation is generally restricted to specialised applications [Li 2000]. Still it is
decidedly interesting to take note of such developments in material science with the aim
of future incorporation. Cost trends may reveal further insight on the potential for large
scale application of higher elastic modulus concrete in the SCPP chimney.
Concrete stiffness properties show immense potential for improvement. Although
concrete material technology has been the subject of a large amount of research and
performance improvement, the rise of ultra-high strength concretes introduces a new
technology growth era; this technology is awarded a growing rank of 2– (positive
curvature on Figure 8-1).
8.3.5 Wind velocity extrapolation profile
Turbulence models currently implemented in wind loading standards are based on frontal
weather systems. Section 7.1.1 introduced a discrepancy between international codes [ISO
DIS 2008] and meteorological conditions [Milford 1987] at Sishen. Further investigation into
wind velocity profiles reveals that an altogether different weather system may provide a
governing load case for the SCPP chimney, i.e. thunderstorms.
Increasing focus on the characterisation and physical simulations of thunderstorms and
their downbursts is evident from literature over the past decades, presumably due to reports
of the importance of thunderstorm generated winds as design wind events. Re-analysis of
extreme gust wind speeds in Australia indicates half of their occurrence due to thunderstorm
events, while gust wind speeds in the United States indicate as many as one third of extreme

142
winds occurring through thunderstorms [Letchford et al. 2002]. Subsequent discussions led
to the recommendation that Wind Engineering must focus more resources on the fundamental
issue of the flow structure of extreme winds.
Wind generated by thunderstorms is characterised by a lower mean with higher deviation
(gust) at higher frequencies [Holmes 2001] than winds from frontal weather systems. This
characterisation of thunderstorms resembles the wind data from Sishen – low mean wind
velocity with high three second gust velocities. Downbursts generate strong horizontal gust
winds with turbulence upon hitting the Earth surface. Figure 8-7 depicts a typical
thunderstorm velocity profile [Kim and Hangan 2007] and a frontal velocity profile –
thunderstorm profiles differ significantly from that of frontal systems with lower velocities in
the upper regions; the main region of SCPP susceptibility to wind excitation.
Figure 8-7. Schematic view of a downburst depicts the thunderstorm profile in comparison to
a frontal profile [based on Kim and Hangan 2007].
Number of publications over time
The trend toward complete characterisation of thunder storm turbulence and its
incorporation in design codes is investigated here, without going into too much field
specific detail. The publications-over-time metric is investigated to determine trends in
the development in characterisation of thunderstorm behaviour. A brief familiarising
investigation reveals keywords for a literature survey: “thunderstorm”, “downburst”,
“downdraft”, “micro-burst”, “macro-burst” and relevant instances of “extreme wind”.
Most of the publications concern the characterisation of thunderstorm phenomena with
several addressing the modeling of these phenomena. Publications were scanned for

143
relevance and the number of “hits” plotted in Figure 8-8. A significant increase in
publications is noted, especially in the last two decades. A second order polynomial curve
is fit to the data points to estimate the maturity of the knowledge basis, assuming it to be
a function of the number of publications [Savransky 2000].
Figure 8-8. Thunderstorm related publications over time.
Incorporation in design standards
The incorporation of thunderstorm based extreme wind characteristics in design
standards depicts an important trend, i.e. the standardisation of knowledge. Literature
agrees that thunderstorm activity contributes significantly to extreme wind data, therefore
the understanding of the physical phenomena, modeling, characterisation and subsequent
incorporation in design standards should logically follow. The Joint Committee on
Structural Safety was the first design code to mention thunderstorms as a specific design
case (dated 2001) [JCSS 2001] and, more recently, the updated ISO code actually
provides terrain roughness and height exposure factors for peak wind speeds for

144
thunderstorms [ISO DIN 2008]. These developments indicate the increasing certainty and
maturity with which scientists relate to thunderstorm based wind action.
Design for dynamic action that is based on mean wind velocity profiles and
subsequent gust velocity description, e.g. the gust factor (the ratio of peak gust velocity to
mean wind velocity – Appendix B equation B3), have to be re-interpreted for a
thunderstorm load case. The significantly differing turbulence structures for frontal and
thunderstorm weather systems require adaptive design methods.
The number of publications shows an emerging trend implying the increasingly sound
understanding and characterisation of thunderstorm turbulence with a significant
indicator of conclusiveness in the acceptance of turbulence data in the most recent ISO
code. The basic characteristics of thunderstorms are understood and only region specific
implementation of this knowledge is required; this technology development is awarded a
growing rank of 2+ (negative curvature on Figure 8-1).
8.3.6 Circumferential stiffener concept
The number of circumferential stiffeners proves to have a significant impact on structural
behaviour; its obstruction of through-flow area and additional cost, however, has an adverse
impact. The trend toward efficient circumferential stiffening, i.e. maximum circumferential
and radial (to prevent ovalisation) stiffness with low through-flow obstruction and cost is
investigated here. It is arduous to describe the technological maturity of circumferential
stiffeners in terms of performance due to its limited and simplistic use in reinforced concrete
shells; consequently the technology landscape is scanned to search for similar technological
concepts in order to grasp its maturity and learn of similar solutions. Some clues are
discovered in nature and from industry.
The concept of low solidity circumferential stiffeners has limited descriptions and
application in literature and industry; the concept of bracing a chimney structure by a flow-
obstructing measure, as proposed by Schlaich [2004b] is unknown (chimneys typically
necessitate optimal through-flow).
Complete through-flow stiffening ring: cooling towers
Cooling towers could deploy one or several external stiffening rings [Bosman et al.
1998] along the height of the structure to strengthen it along the circumference – see

145
Figure 8-9 [Internet 4 2008]. Although this cross sectional enlargement of the shell is
relatively inexpensive and does not pose a large obstacle to through-flow it was found to
be insufficient for the scale of SCPP chimney application [Lourens 2005].
Figure 8-9. Circumferential stiffening rings in cooling towers [Internet 4 2008].
High solidity stiffening ring: bamboo stiffening
The bamboo plant, a self supporting, high aspect ratio natural structure, exhibits
regular solid sectional stiffening discs (Figures 8-10) playing a significant role in its
structural integrity. The nature of the SCPP chimney circumferential stiffener technology
poses a unique challenge of creating a high stiffening-to-solidity ratio, i.e. providing
significant rigidity to the structural cross-section with only slight cross-sectional
obstruction. Bicycle wheels propose such a solution.
Low solidity stiffening: bicycle wheel
A modern bicycle wheel (Figure 8-11) consists of a metal hub, wire tension spokes
and a metal rim which accommodates a pneumatic tire. A load applied at the hub causes
the wheel to flatten slightly near the ground contact area. The rest of the wheel remains
approximately circular by tension increase in all of the spokes except for the few in the
flattened region.

146
Figure 8-10. Bamboo revealing internal stiffening structures.
Figure 8-11. Typical bicycle wheels.
SCPP bicycle wheel stiffening concept
Structural research shows that it is efficient to stiffen the SCPP chimney shell at
several levels with cables arranged like bicycle wheel spokes within the chimney
[Schlaich Bergermann und Partner 2004] as depicted in Figure 8-12. This concept could
reduce meridional stresses in the SCPP chimney to an extent that tension disappears
completely making high chimneys feasible. Schlaich proposes these structures as the

147
“only really new feature of [SCPP chimney] compared to existing structures” [Schlaich et
al. 2004a].
The spoked wheel allows relatively unhindered air flow (refer to section 7.1.7).
Ovalling is counteracted and local stability maintained creating the potential for decrease
in chimney shell construction material volume.
Figure 8-12. Spoked wheel concept visible at chimney tip [Schlaich Bergermann und
Partner 2004].
Spanning cables concept
The circumference of a concrete shell may be stiffened by several cables spanning
diagonally across the through-flow section of the chimney in a repetitive pattern
[Glubrecht 1973], see figure 8-13. The concept mitigates circumferential shell buckling
with consequent cost reduction due to decreased wall thickness. Research on this concept
using 36 steel cables placed in triangular fashion proved to be the most efficient in
increasing buckling stability [Lourens 2005].
Research at the US-ISE aimed to compare various circumferential stiffening concepts
to identify the most optimal. The spanning cables concept proved to be the most stable
when subjected to linear elastic buckling analyses.

148
Figure 8-13. Spanning cables concept [Glubrecht 1973].
Concluding on circumferential stiffener trend
The requirement of low solidity contradicts the requirement of stiffness. In its history
the circumferential stiffener concept only achieved low solidity with low stiffness (e.g.
cooling tower ring) or high solidity with high stiffness (e.g. bamboo), except for bicycle
wheels, which are not a large scale reinforced concrete application. The only judgement
that can be made about the performance of this stiffening concept in structures is based
on numerical research. The investigation performed on circumferential stiffening rings
indicates that the high stiffening–low solidity concepts are at the forefront of
circumferential concrete shell stiffening technology. The requirement of low solidity
contradicts the requirement of stiffness, a combination that has not yet been achieved in
practice. This technology, classified as a new and emerging concept in circumferential
stiffening, is awarded the emerging rank of 1.
8.3.7 Cable staying
Cable stays are difficult to isolate as a technological entity since it always serves as an
element in a larger system; the interaction between the cables and other structural systems is
pronounced [Walther et al. 2003]. The main parameters/features making these elements
successful as structural members are therefore studied and their history and furtherance
discussed in the context of their implementation in cable-stayed structures, for example long-
span bridges and guyed masts.
149
Stay cables of as long as 500 meters in span displaying low natural frequencies, such as
0.2 or 0.3 Hz in the lowest mode [Fujino 2002], have been used. Furthermore, because of
their low inherent damping (as low as 0.1% critical damping ratio), they often respond
adversely (resonance) due to rain- and wind-induced action. Cable vibration controls include
connecting wires and passive dampers (installed near the cable anchorage), roughness
increase and deployment of controlled dampers [Fujino 2002].
High tensile strength steel wire ropes and strands, typically with tensile strength of 1,500
MPa, density of 7,850 kg/m3 and modulus of elasticity of around 200 GPa, are commonly
used in cable stays. Increase in the material strength–weight ratio over the past decades
enabled a substantial increase in the capacity of cable elements to resist loads, for example by
utilising light weight carbon reinforced plastic fibers [Krishna 2001] and other composites.
The density of carbon fiber-epoxy is typically 1,600 kg/m3 (significantly less than that of
steel) with modulus of elasticity of 145 GPa and a tensile strength ranging from 234 MPa to
3,300 MPa [Callister 1997].
Cable stays are often very exposed structural elements and must be protected against
aggressive corrosive environments [Walther et al. 2003]. Enhanced corrosion resistance of
metals, as well as development of high strength non-metallic materials which are inert to the
effect of corrosion, efficiently mitigate corrosion based failure [Krishna 2001]. The high
costs of non-metallic materials presumably limit their incorporation in standard cable
designs.
Most of the challenges experienced with cables and cable systems seem to be understood
and largely mitigated. Expected improvements are in material performance (weight, strength
and durability) by incorporation of other advanced performance materials, the controlling of
vibrations and in the innovative layout toward an efficient structure, remembering that the
layout of cable stays is one of the fundamental items in the realisation of economically
feasible structures influencing not only the structural performance, but also the method of
erection [Walther et al. 2003].
Although adequate damping can reportedly not be provided for extremely long stay
cables, the emergence of semi-active dampers combined with material improvements may
provide feasible solutions.
Cable stay technology is well established and implemented in a wide range of structures.
Expected improvements lie with the vibration mitigation and the introduction of lighter,

150
stronger materials combined with innovative layout solutions. Some challenges before its
implementation on the SCPP chimney remains to be addressed, for example the extreme
lengths of cable required to reach the preferred heights. Cable stay technology is awarded a
growing rank of 2+ (negative curvature on Figure 8-1).
8.3.8 External damping
The damping in a system indicates its ability to dissipate vibration energy. Over the past
three decades the reduction of structural response caused by dynamic effects has become a
subject of intensive research [Datta 2003]. Structural designers increasingly make use of
auxiliary damping devices. Figure 8-14a displays an example of a tuned mass damper as
implemented in the upper region of the super tall Taipei 101 structure (Figure 8-14b). The
662 ton pendulum damper, situated at the 87th floor is suspended from the 91st floor and
utilises active hydraulic cylinders to control the motion of a massive weight.
External dampers are classified as passive, active and semi-active control systems. In this
section a qualitative investigation into the emergence and current status of these systems is
performed.
a) b)
Figure 8-14. a) An example of a tuned mass damper [Internet 5 2008] as implemented in
the b) super tall Taipei 101 building [Internet 6 2008].

151
Definition of external damping systems
Passive control systems do not require an external power source for operation and
utilise the motion of the structure to develop the control forces. Control forces are
developed as a function of the response of the structure. Examples of passive dampers are
base isolation devices, visco-elastic dampers, tuned mass dampers, liquid column
dampers, orificing of fluid and friction dampers [Symans and Constantinou 1999].
Active control systems typically require a large power source for operation of electro-
hydraulic or electro-mechanical actuators which supply control forces to the structure.
These forces are developed based on feedback from sensors that measure the excitation
and/or the response of the structure. Examples of active dampers are active tuned mass
dampers, active tendon systems and actuators/controllers.
Semi-active control systems do not introduce mechanical energy into the structural
system but rather manipulate system properties in an optimal manner to reduce the
structural response [Yalla et al. 2001]. They typically require a small external power
source for operation and utilise the motion of the structure to develop the control forces,
the magnitude of which can be adjusted by the external power source. Control forces are
also dependent on excitation and/or response feedback. Examples of semi-active dampers
are electro-rheological, magneto-rheological and fluid-viscous and tuned mass dampers.
Technology performance, emergence and maturity
A significant number of tall structures were realised with a variety of passive and
active vibration control devices. Although it is not yet routine design practice to design
external damping capacity into a structural system, it is becoming prevalent with the
emergence of tall and super tall buildings. Mass dampers, in either passive, active or
hybrid form, are the most frequently used devices with over 20 major installations in
buildings and observation towers worldwide [Kwok and Samali 1995].
The major benefits brought about by the introduction of active control systems are the
smaller damper mass and higher efficiency. While conventional mass dampers may
provide an additional damping of 3% to 4% of critical damping, resulting in a 40% to
50% reduction in the wind-induced response, active systems can add an additional
damping of 10% of critical damping with reduction in wind-induced response of up to
65% [Kwok 1995]. However, the control equipment required for an active system could

152
increase its capital cost – a conventional tuned mass damper system could cost 1% and an
active system 2% of the building cost. Active control systems are scrutinised due to the
problems encountered in their practical implementation such as modeling errors and
response delay [Datta 2003], paving the way for a new generation of damping systems:
semi-active control.
Semi-active control systems have only recently emerged in structural control
applications [Symans and Constantinou 1999]. The development and experimental testing
of semi-active control systems for applications in structural response control has only
been pursued approximately ten years ago. Therefore, many of these systems are
immature and a comparison among various systems may not be as appropriate as it would
be in a subject which had reached a more mature performance level.
Literature confirms performance increase with semi-active controls where, in general,
the performance of the structure with the semi-active control system was superior to that
of the structure with a passive control system, while simultaneously requiring smaller
control forces. Furthermore, the development of control algorithms which explicitly
incorporate the control system dynamics and control-structure interaction may produce
further improvements in the control performance [Symans and Constantinou 1999].
Concluding on external damping technology trends
It is concluded that external damping systems are, with the emergence of semi-active
control, evolving into more efficient, less expensive means of structural control. Semi-
active controls – the new generation of structural response controls – may replace the
bulky or expensive passive and active control systems. An in-depth investigation could
provide more quantitative insight into the measure of performance increase and its
applicability to the SCPP chimney. For the current decision-making process it is
appropriate to consider this technology as growing, with much potential toward
mitigating adverse action on the SCPP chimney; hence it is classified as early growth
period and awarded a growing rank of 2– (positive curvature on Figure 8-1).
8.3.9 Directional wind design
Directional wind loads are caused by varying surface roughness of the surrounding
terrain within a radius of 5 to 10 km and regional wind climatic effects representing the

153
typical prevailing winds and paths of storms at the site. In directional design the orientation
of a building is optimised to have the strong axis in the extreme wind direction and to have
the weak axis in the direction of the weaker storms [Kasperski 2007]. Niemann et al. [2007]
investigated the implications of directional wind on cooling tower design and noted that the
directionality of wind loading on structures implies directionality of wind induced stresses.
The complete spectrum of directional factors must be considered to avoid an over-
conservative design, relinquishing the concept of rotational symmetry, taking advantage of
load reduction and designing a reliable structure according to the directional variation of the
wind loading.
For tall structures, such as the proposed SCPP chimney, the conditions in the upper air
layers may further impact the directional design on the chimney. The “Ekman Spiral”
describes the phenomenon where the wind direction and the impact of the Coriolis force on it
decrease with increased surface frictional effect on the high-to-low pressure gradient vector.
The Ekman Spiral effect causes the wind vector to turn gradually towards the low pressure
centre as the ground surface is approached and can amount to a total angular change between
gradient height and surface of about 30 degrees [Holmes 2001]. This phenomenon has to be
characterised for the Sishen SCPP chimney.
Directional wind design technology application is relatively mature since it merely
requires detail design applying the resulting directional response. In history this approach
was used for structural optimisation, but not for detailed radial directional cost reduction in
cylindrical structures. The aspects surrounding the occurrence of the Ekman Spiral effect and
its influence on the directionality of the wind remain less characterised. This technology is
awarded a growing rank of 2 (linear on Figure 8-1).
It is concluded from the trend investigation exercise that several technologies are emerging
and growing:
• parabolic hyperboloid geometry,
• material elastic modulus,
• wind extrapolation,
• external damping and
• directional wind design
154
Others are mature and merely require standard implementation (wall thickness re-
configuration).
8.3.10 Solar Chimney Power Plant chimney research at the University of Stellenbosch -
ISE: Cascade of Technological Trends
The Cascade of Technological Trends presented in section 3.6.2 indicates a normative
pattern for technological development. The US-ISE/BUW-SDT research efforts are measured
against this norm. Their efforts covered the following:
• material characteristics, i.e. Cascade Level 1ii
• the structural operating principle and system size, i.e. Cascade Level 2
• structural performance, i.e. Cascade Level 3
• cost decrease and reliability, i.e. Cascade Level 4
• market (cost) dictated technology conceptualisation, i.e. Cascade Level 5
The chronology of these R&D events is displayed in Figure 8-15 (Appendix H, section
H1, summarises the broader US SCPP research program over the past decade). The R&D
was spread out over several cascade levels, mostly Levels 2 to 4. This may indicate the
inability to decouple cascade levels in structural research or the definition of research topics
without a governing, directing system and technology perspective, covering as wide a scope
of subject matter as is tempting during radical innovation (in order to address all potential
broad-based uncertainty). A RIM approach, with its systems and technology based
perspective, could guide resource allocation for such radical innovations, moving from the
lower, physical science cascade levels through to the higher, user satisfying levels. Figure 8-
15 portrays a general chronological trend from Level 1 to Level 5 suggesting that R&D at the
US-ISE is reaching a more mature phase when considering the current research priorities.
This indicates a normal development toward technology maturity – with its market ready
status (Level 5).
Further, investigation of the R&D topics treated at the US-ISE shows that cost aspects (a
Level 4 cascade) were seldom considered.
ii These “levels” are different from systems hierarchy levels treated in section 8.2.
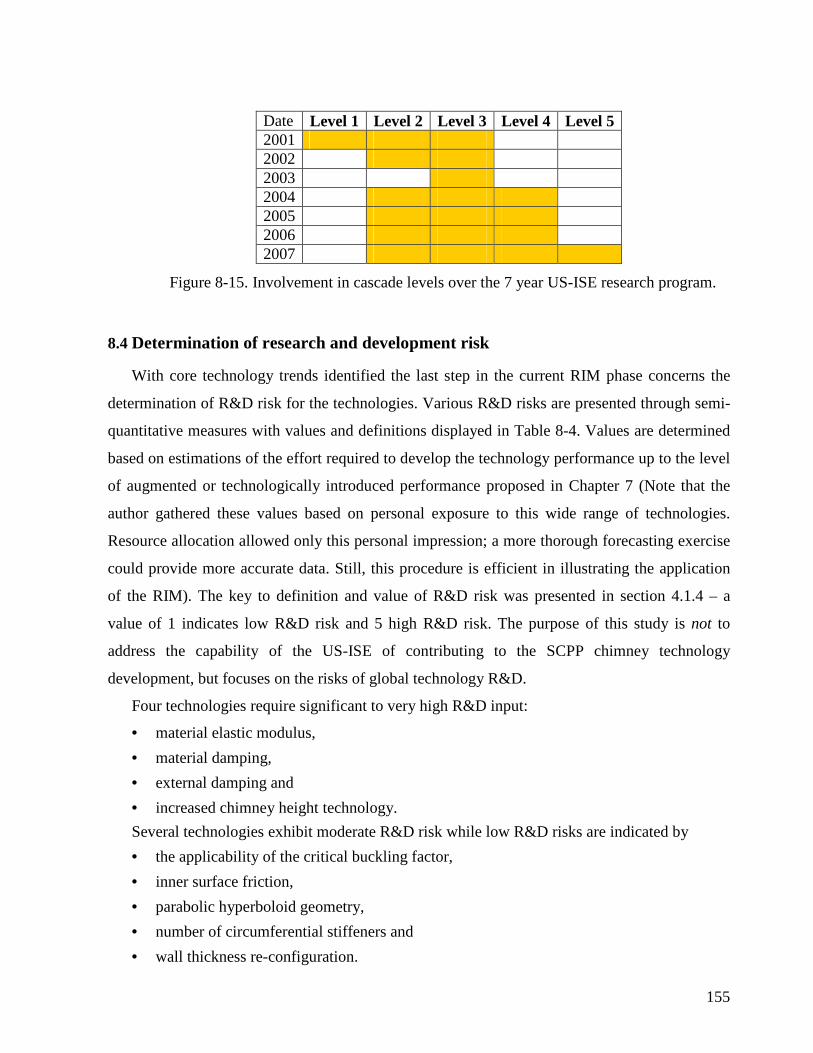
155
Date Level 1 Level 2 Level 3 Level 4 Level 5 2001 2002 2003 2004 2005 2006 2007
Figure 8-15. Involvement in cascade levels over the 7 year US-ISE research program.
8.4 Determination of research and development risk
With core technology trends identified the last step in the current RIM phase concerns the
determination of R&D risk for the technologies. Various R&D risks are presented through semi-
quantitative measures with values and definitions displayed in Table 8-4. Values are determined
based on estimations of the effort required to develop the technology performance up to the level
of augmented or technologically introduced performance proposed in Chapter 7 (Note that the
author gathered these values based on personal exposure to this wide range of technologies.
Resource allocation allowed only this personal impression; a more thorough forecasting exercise
could provide more accurate data. Still, this procedure is efficient in illustrating the application
of the RIM). The key to definition and value of R&D risk was presented in section 4.1.4 – a
value of 1 indicates low R&D risk and 5 high R&D risk. The purpose of this study is not to
address the capability of the US-ISE of contributing to the SCPP chimney technology
development, but focuses on the risks of global technology R&D.
Four technologies require significant to very high R&D input:
• material elastic modulus,
• material damping,
• external damping and
• increased chimney height technology.
Several technologies exhibit moderate R&D risk while low R&D risks are indicated by
• the applicability of the critical buckling factor,
• inner surface friction,
• parabolic hyperboloid geometry,
• number of circumferential stiffeners and
• wall thickness re-configuration.
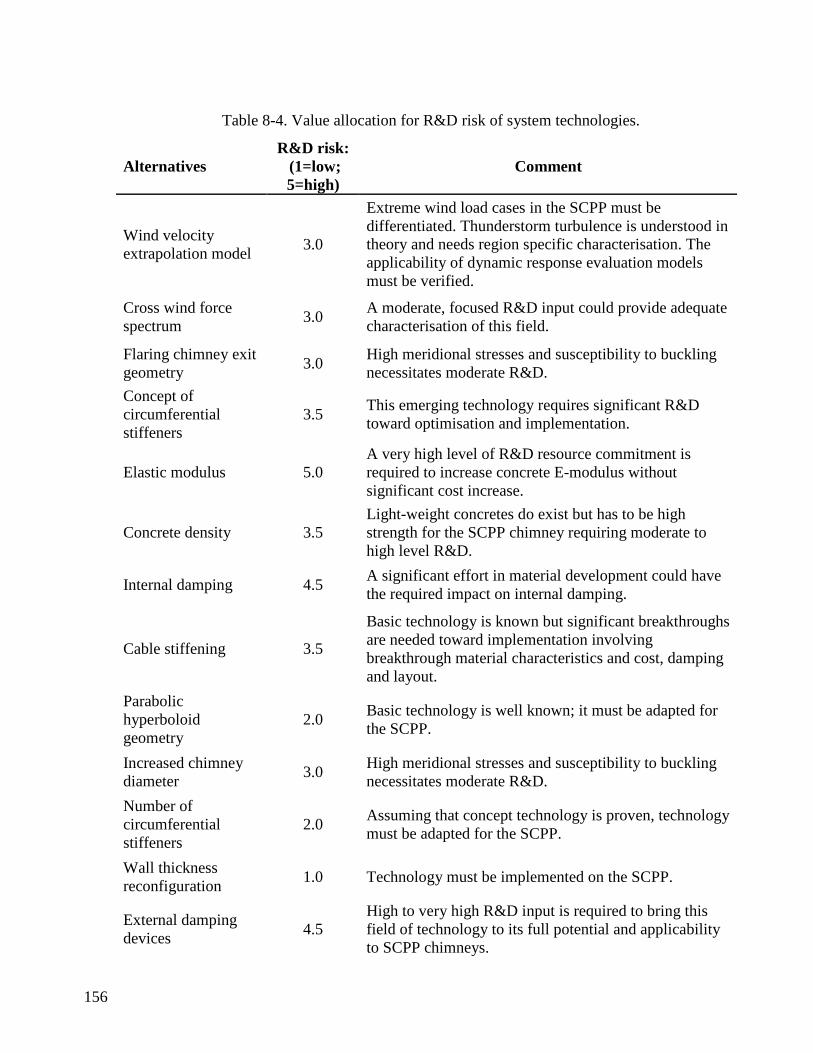
156
Table 8-4. Value allocation for R&D risk of system technologies.
Alternatives R&D risk: (1=low; 5=high)
Comment
Wind velocity extrapolation model
3.0
Extreme wind load cases in the SCPP must be differentiated. Thunderstorm turbulence is understood in theory and needs region specific characterisation. The applicability of dynamic response evaluation models must be verified.
Cross wind force spectrum
3.0 A moderate, focused R&D input could provide adequate characterisation of this field.
Flaring chimney exit geometry
3.0 High meridional stresses and susceptibility to buckling necessitates moderate R&D.
Concept of circumferential stiffeners
3.5 This emerging technology requires significant R&D toward optimisation and implementation.
Elastic modulus 5.0 A very high level of R&D resource commitment is required to increase concrete E-modulus without significant cost increase.
Concrete density 3.5 Light-weight concretes do exist but has to be high strength for the SCPP chimney requiring moderate to high level R&D.
Internal damping 4.5 A significant effort in material development could have the required impact on internal damping.
Cable stiffening 3.5
Basic technology is known but significant breakthroughs are needed toward implementation involving breakthrough material characteristics and cost, damping and layout.
Parabolic hyperboloid geometry
2.0 Basic technology is well known; it must be adapted for the SCPP.
Increased chimney diameter
3.0 High meridional stresses and susceptibility to buckling necessitates moderate R&D.
Number of circumferential stiffeners
2.0 Assuming that concept technology is proven, technology must be adapted for the SCPP.
Wall thickness reconfiguration
1.0 Technology must be implemented on the SCPP.
External damping devices
4.5 High to very high R&D input is required to bring this field of technology to its full potential and applicability to SCPP chimneys.

157
Saguaro geometry with lower limit structural function
3.5 The concept is understood to a large degree. It has to be optimally adapted and implemented to the SCPP.
Directional design 3.0 After the characterisation of the Ekman Spiral for the relevant region, it requires only design application.
Increased chimney height
4.0 Dynamic susceptibility to buckling and dynamic excitation necessitates R&D breakthrough.
Terrain surface roughness
3.0 Obtainment of the required site could be a high risk endeavour.
8.5 Conclusion
This chapter applies the tools proposed for technology characterisation, classification and
trend identification phases of the RIM on the technologies that performed well or remains under
characterised in the system performance evaluation. Uncertainties related to technologies that
provide functionality at several levels of the system are characterised. The characterisation and
classification present a framework from which technology acquisition may be managed by
identifying technologies with similar characteristics from the technology landscape. The trend
investigation disclosed several emerging and growing technologies (parabolic hyperboloid
geometry, material elastic modulus, wind extrapolation, external damping and directional wind
design) while others are mature and merely require standard implementation (wall thickness re-
configuration). R&D risk was identified for each system technology yielding a perspective on the
R&D input required to realise the augmented or introduced technologies.
This technology-based insight enables strategic decision-making – performed in the next
chapter – not only on the basis of technology performance, but also with its maturity and
consequent potential for improvement in mind.

158

159
CHAPTER 9
TECHNOLOGY STRATEGY
During incremental innovation strategic decisions are made with business sense based on insight
into financial models, R&D risk models and short to medium terms time frames. Radical innovation
decision-making utilises insight gained during the previous chapters, providing knowledge and
insight into potential performance improvement of the system as well as into the potential of
realising required technological performance levels.
The technology tree (Chapter 6, Section 6.4) provides a systems perspective on the technological
function of the SCPP chimney system by breaking it down from chimney system level through
foundation, chimney-to-foundation and chimney, with their respective sublevels, to the fourth level
where the technological components are located. Opportunities and gaps in the system can readily be
identified and placed in this comprehensive framework.
The system performance evaluation phase evaluated technologies in terms of criteria for the
radical innovation, specified at strategic level. Five technologies emerged as superior on the grounds
on their potential impact on system performance (Chapter 7, Section 7.4). These are:
• the parabolic hyperboloid geometry,
• wall thickness re-configuration,
• material elasticity modulus,
• the more accurate characterisation of the wind extrapolation model and
• the number of circumferential stiffeners.
The following technologies were identified for further investigation:
• cable stiffening,
• external damping and
• the directional wind based design.
Technology assessment (Chapter 8) provides a descriptive framework and classification of each
identified technology in the SCPP chimney system, from which specific technology development or

160
acquisition can be managed. Technology growth trends indicate the maturity and potential for
improvement of individual technologies. The growth status of each technology was awarded a rank
in Section 8.3. The determination of R&D risk and technology maturity for each technology
(awarded in Section 8.4) provides information on risks of achieving augmented or introduced
technological performance goals through R&D.
This chapter concludes the RIM proposed in this thesis by the formulation of a strategy roadmap
for the SCPP chimney radical innovation using the systems and technology insight gained during
preceding phases of the RIM application. Frameworks for understanding the radicality and
uncertainty of the radical innovation and technological impact on these uncertainties combine with
knowledge of the potential for, and probability of, technological improvement and integrate into a
knowledge basis for strategising a radical innovation roadmap. The R&D facilities of the company
are consequently tasked with technology development, stating priorities and re-allocating resources,
directing in-house development of system technological capabilities and potential while, externally,
driving interaction or acquisition in response to technological opportunities or threats.
Strategy is formulated with aid from the Technology Position Analysis. The consummation of
the RIM takes place with the Technology Position Analysis. The set up of system hierarchy and
technology identification, the tedious process of model choice and set up, implementation of
technology contribution for evaluation, the technology assessment and trend identification all
contribute information to the Technology Position Analysis. A rightfully comprehensive judgement
can be performed, incorporating not only the system performance evaluation and technology trend
projections, but also the risk of the technology of reaching the sought performance level. The
Technology Position Analysis further provides efficient communication of technological information
and strategy through its active visualisation of results.
9.1 Visualisation of results
With all the information gained from previous RIM phases, R&D strategy can now be set up.
A Technology Position Analysis (refer to section 3.7) places all chimney system technologies in
perspective – one sheet presenting technological information to aid strategic decision-making.
9.1.1 Information fields
Several information fields can be efficiently portrayed in a Technology Position Analysis.
In the current analysis the potential performance gain (from Chapter 7), R&D risk (from

161
section 8.4) and technological maturity (from section 8.3) fields are depicted. These
measures adhere to the criteria deemed important for radical innovation as stated in Table 2-1
– determining technological benefits in terms of market requirements – by incorporating
SCPP chimney technology performance potential, while R&D risk indicates the level of
input and effort required to achieve the stated performance level. Technology maturity
indicates on the same sheet the maturity of the chimney technologies.
The criteria of performance improvement must depict the performance measure that is
most representative of the technology (for example, in the SCPP chimney, the structural
performance metrics would be LEC, buckling or dynamic response).
The maturity of the technology provides a quantitative/qualitative impression of the
amount of improvement expected from the technology in future. An emerging technology,
for example, holds much potential for impacting the system (although uncertain to what
extent) as it is developed into a mature, relevant technology. Only SCPP chimney
technologies that display positive impact on system performance were assessed in terms of
maturity; the others are lower priority and are not considered. Technological maturity
rankings were determined in section 8.4.
9.1.2 Results from Technological Position Analysis
The current application of the Technological Position Analysis is briefly discussed; data
is placed on the position map with the system performance metric on the Y-axis and R&D
risk on the X-axis. A high-performance, low risk technology is the most favourable with
technologies becoming less favourable moving to the low performance, high risk region –
Figure 9-1 illustrates. The technologies that participated in trend assessment are depicted in
the figures further in this section, by circle-markers with their size indicating the maturity of
the technology. Technologies that did not undergo trend assessment are represented by
triangular markers. Some technology values were offset slightly in order to facilitate
visualisation. Note that although R&D risk of the technological improvements may differ for
different criteria, this study assumes the values from Table 8-4 to be applicable to all criteria.
Upper and lower limits, as well as uncertainty, although not quantified, are depicted by error
bars. The under-characterised technologies are also portrayed here.

162
Figure 9-1. Qualitative portrayal of quadrants in the Technological Position Map.
Results: LEC metric
The technologies responding most favourably in the LEC Technological Position
Analysis are the following – refer to Figure 9-2:
• Parabolic hyperboloid geometry is the most favourable displaying high
performance at relatively low R&D risk. Its growing technology trend indicates
potential for improving its performance.
• Wall thickness re-configuration technology performs moderately, but at low R&D
risk.
• The number of circumferential stiffeners performs below par on this metric (bear
in mind its major impact on the buckling metric), but is relatively low R&D risk.
• The increased chimney height (and its coupled technology – the cross wind force
spectrum) performs well in terms of LEC, but at moderate to significant R&D risk
levels.
Flaring chimney geometry yields moderate performance at moderate R&D risk. Most
other technologies do not perform significantly in this metric (or is currently only
described in terms of upper or lower limit and uncertainty), with moderate to high
associated R&D risk. An exception is the high risk, poorly performing material elasticity
modulus technology.

163
Figure 9-2. Technological Position Map for displaying LEC performance against R&D
risk.
Results: buckling metric
The technologies responding most favourably in the buckling Technological Position
Analysis are the following – refer to Figure 9-3:
• The wall thickness re-configuration performs very well at very low R&D risk; it
is mature and does not promise much technological breakthrough – its
implementation as is yields significant results.
• The number of circumferential stiffeners performs well at low R&D risk.
• Wind velocity extrapolation is a growing technology that performs well and at
moderate R&D risk.
• Terrain surface roughness performs moderately at moderate risk.
• The Saguaro geometry performs moderately at moderate to significant R&D risk.
• Material elasticity is a growing, high R&D risk technology that promises high
performance impact.
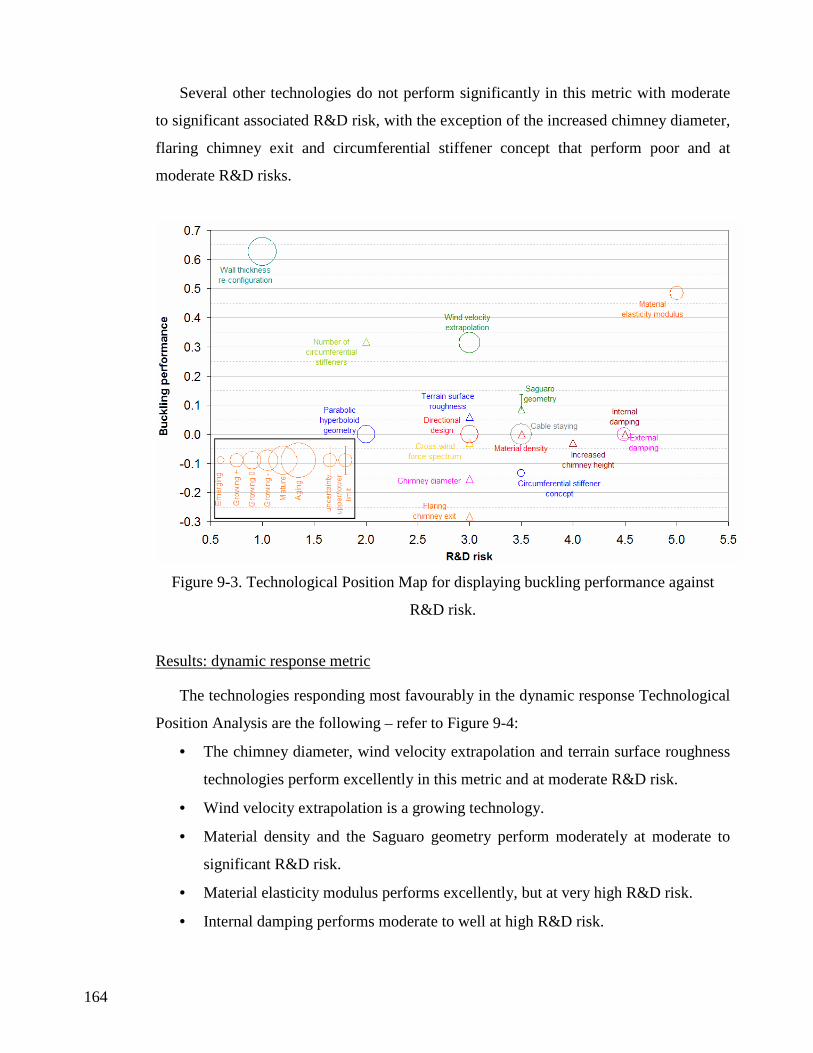
164
Several other technologies do not perform significantly in this metric with moderate
to significant associated R&D risk, with the exception of the increased chimney diameter,
flaring chimney exit and circumferential stiffener concept that perform poor and at
moderate R&D risks.
Figure 9-3. Technological Position Map for displaying buckling performance against
R&D risk.
Results: dynamic response metric
The technologies responding most favourably in the dynamic response Technological
Position Analysis are the following – refer to Figure 9-4:
• The chimney diameter, wind velocity extrapolation and terrain surface roughness
technologies perform excellently in this metric and at moderate R&D risk.
• Wind velocity extrapolation is a growing technology.
• Material density and the Saguaro geometry perform moderately at moderate to
significant R&D risk.
• Material elasticity modulus performs excellently, but at very high R&D risk.
• Internal damping performs moderate to well at high R&D risk.

165
Several technologies perform very poorly due to lock-in behaviour. These are wall
thickness configuration, increased chimney heights and its coupled cross-wind force
spectrum and also the parabolic hyperboloid geometry.
Figure 9-4. Technological Position Map for displaying dynamic response performance
against R&D risk.
9.1.3 Discussion on Technology Position Analysis
The system performance evaluation pointed out the system performance gain potentially
brought about by each technology implementation or addition. It did not incorporate the
R&D risks associated with realising the augmented or technologically introduced
performance levels – a metric that is crucial toward efficient strategising. The Technology
Position Analysis provides all the SCPP chimney technologies with performance gain,
technology risk and maturity in one comprehensive view. The maps must be updated
iteratively as information following R&D effort is gained and incorporated in the system.
Currently the technologies are spread over a wide range of performance and R&D risk
values, because the SCPP chimney radical innovation requires broad scoped conceptual
investigation. The map space is also filled with technologies with negligible contribution;
subsequent iterations must clear out the space with only the contributing technologies
remaining, bearing in mind which technologies were left out to retain a systems perspective

166
on the chimney. The higher risk SCPP chimney technologies may not be feasible even with
sufficiently allocated resources, but the decision-maker now knows the impact and risks of
technologies in the system. R&D can be re-directed to more promising (lower R&D risk)
technology developments and breakthroughs (probable high R&D risk with potentially high
performance returns) for efficient acquisition and incorporation into the user system – a
higher risk technology must promise significant performance potential before it becomes
feasible to pursue it as R&D priority.
Note that a thoroughly implemented MCDM approach would compact the maps that were
set up for the decoupled criteria into one comprehensive map. This coupling of results to give
a comprehensive view on favourability, may simplify the strategy formulation.
The next section presents the SCPP chimney R&D roadmap by stating development
priorities that are apparent with all the system and technological insight gained through the
RIM.
9.2 Technological development priorities
This section summarises the R&D priorities as they became evident through technology
assessment, Technology Position Analysis based priorities (technology performance gain, R&D
risk and maturity) and other insight.
9.2.1 Technology assessment based priorities
Characterisation observations
The technology Framework of Basic Features and Nine Cell Technology Functional
Classification Matrix provide definition to each technology from which improvements
may be identified and other similar technologies identified for acquisition. The
technology management academic fraternity is working toward comprehensive
technology taxonomy to facilitate identification of similar technologies [Van Wyk 2004].
Hopefully this will soon become a reality.
Some general observations can be made concerning the characteristics of the
technologies in the SCPP chimney:
• Several technologies concern the characterisation of action effects. These are
thunderstorm turbulence characterisation, directional design, cross wind force
167
spectrum (directly) and terrain surface roughness and temperature characterisation
(indirectly).
• Several technologies concern the stabilisation of the chimney under buckling.
These are parabolic hyperboloid geometry, wall thickness re-configuration,
circumferential stiffeners, cable staying, external damping devices, internal
damping, Saguaro geometry and circumferential stiffener concept and number.
• Several technologies focus on increasing the energy yield. These are diameter
increase, flaring exit geometry and increasing height.
• Several technologies concern the improvisation or alteration of the reference case
material, i.e. reinforced concrete. These are material density, elasticity modulus
and internal damping.
• Only the directional design approaches specifically addresses cost issues. This
may be due to the stage of development of the SCPP chimney where structural
realisation is the main concern toward system realisation. As the concept
converges to structural feasibility, the focus must be redirected toward LEC
optimisation. Structural criteria will then not be specifically quantified, but only
represented in the cost criterion, as is typical in standardised design practice.
Technology classification observations
The Nine Cell Technology Functional Classification Matrix provides a
comprehensive (although robust, at this stage in its development) definition to each
technology from which improvements and other similar technologies may be identified. It
was determined that the SCPP chimney fulfils the function of processing and
transporting load-based energy, while transporting air-matter from the collector centre to
the mid tropospheric regions. Damping systems temporarily store energy.
TRIZ problem solutions
Although the TRIZ methodology was not distinctly implemented in this investigation,
literature promises it to be a powerful identifier of solutions to contradictions. These
solutions could direct the radical innovation process toward typical solutions.

168
Tendency of priority technologies
In terms of the above sets of characteristics observed in the chimney technologies, the
technologies identified to hold priority portray the following:
• The three top rated priority technologies are primarily concerned with
stabilisation of the structure.
• Two high performance but low R&D risk technologies – the parabolic
hyperboloid geometry and wall thickness re-configuration – were only
implemented in the SCPP chimney model at a late stage during its development.
This shows that high potential technologies can be overlooked and provides merit
for the application of a systems approach to conceptual and radical innovation.
Cascade of Technological Trends
The technology trend cascade observations (section 8.3.10) identify that few
technologies aim at decreasing cost directly. Only one technology specifically addresses
cost, while the top three priority technologies mainly concern structural stabilisation, a
Level 2/3 cascade.
9.2.2 Technology Position Analysis based priorities
The technologies are ranked to provide an order of importance for a R&D program. Table
9-1 provides the ranked R&D topics and motivates their rank.
9.2.3 Other insights and priorities
Stay in touch with other concepts and potential solutions
As stated in section 5.2.2, several varying concepts are proposed as a solution to the
highest level SCPP chimney function, i.e. sustaining a through-flow channel. Even when
research avenues are already decided and committed to, alternatives need to be kept in
mind as to whether they provide more optimal solutions to the problem than the currently
investigated one, i.e. keep the feelers “out there”, continuously on the lookout for
promising solutions. Research managers must stay open-minded, following the TRIZ
approach of lateral problem solving with performance as close to the IFR as possible,
even if this entails a complete change in research direction and thinking.

169
Table 9-1. Research priorities based on Technology Position Analysis.
Rank R&D topic Motivation
1 Incorporation of wall thickness re-configuration and investigation for mitigating adverse dynamic response.
Very significant mitigation of buckling with moderate reduction of LEC at very low R&D risk.
2 Incorporation of parabolic hyperboloid geometry and investigation for mitigating adverse dynamic response.
Very significant LEC reduction at low R&D risk.
3 Incorporation of more circumferential stiffeners, given the concept is proven.
Moderate mitigation of buckling at low R&D risk.
4 Wind velocity extrapolation profile characterisation, decreasing uncertainty in wind action model.
Moderate impact on buckling mitigation at moderate R&D risk.
5 Investigation to region’s surface roughness characteristics in the area of the proposed site of construction.
Low to moderate impact on buckling mitigation at moderate R&D risk.
6 Investigation of mitigating adverse structural behaviour in increased chimney height.
Significant impact on LEC reduction at high R&D risk.
7 Investigation of mitigating adverse structural behaviour in flaring chimney.
Low to moderate impact on LEC reduction at moderate R&D risk.
8
Remain in touch with developments/breakthroughs in cable staying, external damping and directional design technology.
Further introductory/ familiarising investigations may prove productive toward identifying this field as a potential priority area.
9 Remain in touch with developments/breakthroughs in concrete material characteristics.
Although very high risk R&D, significant breakthroughs may impact significantly on structural integrity.
10 Further investigation to realise Saguaro geometry in order to mitigate adverse dynamic response.
Low to moderate impact on buckling (lower limit) at moderate to high R&D risk.

170
The fact that solutions and improvements may come from unforeseen directions
(brought about by the multi-disciplinary and broad-based technology scan and foresight
exercises) should be acknowledged, necessitating caution to not, on the basis of previous
experience or conventional methods, write off an idea.
Look to nature for solutions
In spite of the “incredible” scientific ability of humans, nature often still provides the
most simple and efficient solutions. Krishna states that “nature often indicates new
solutions – the falling of a tree across a rivulet may have triggered the field of bridge
engineering … and the spider’s web may have spurred on the ideas of tension nets or
membranes” [Krishna 2001]. The comprehensive perspective on the SCPP chimney set
up in this research reveals that several reference and proposed solutions are nature based
solutions:
• Parabolic hyperboloid base geometry copies the typical base geometry of trees
with a gradual broader tapering at the lower levels.
• Circumferential stiffeners are found in bamboo trees that portray exceptional
slenderness ratios.
• Saguaro cacti ribs mitigate detrimental wind pressure fluctuation and suction
peaks.
• Directional design had always been applied in plants with their root growth
stimulated in areas of greatest stress occurrence. Trees, however, all start with one
seed, without statistical insight into the extreme actions it will experience in its
lifetime – it has measures to adapt intelligently.
On the grounds of these potentially successful technologies the study of nature for
similar structures must form a part of the future strategy for SCPP chimney R&D.
The first iteration of the RIM on the SCPP chimney is thus concluded with the successful
formulation of the SCPP chimney R&D strategy. As more information and insight is acquired
and knowledge is gained, the models and first iteration reference RIM framework can be
updated, refining the decision-making. The validation of the RIM is, however, completed in a
single iteration having performed all the distinct RIM phases up to a point of efficiently
formulating R&D strategy.

171
9.3 Concluding the Radical Innovation Methodology application
The RIM was applied on the case of the radical innovation of the SCPP chimney concept to
systematise radical innovation for well founded R&D strategy formulation, thereby supporting
the thesis of this dissertation. The chapters of Part II yield significant insight through a systems
and technological approach on the problem of feasibility of the SCPP chimney. The systematic
RIM approach yields frameworks for the efficient identification and management of
uncertainties in the SCPP chimney system, and of R&D priorities for development to a state
closer to chimney feasibility. Where previous R&D management was based on intuitive and
specialist identification of R&D priorities, the systems approach followed in the RIM provides a
comprehensive, non-intuitive view of the chimney system – all current and subsequent R&D can
be sorted in the drawn up systems hierarchy and technological frameworks. Specific and general
priorities are identified in a clear SCPP chimney R&D strategy. Note: this dissertation concludes
with an epiloguei that reports results of the synthesis of four of the technologies identified to be
top priority for incorporation into a second iteration reference case. The re-evaluation of this
improved chimney concept yields results that are significantly closer to sought performance
levels.
9.3.1 Specific priorities
Results from the system performance evaluation combine with technology trend
identification and R&D risk values to provide Technological Position Maps for comparing
technologies. These maps and previous findings from the RIM application provide insight to
a comprehensive understanding of technological capability and potential. Priority
technologies were identified: wall thickness re-configuration, parabolic hyperboloid
geometry and increased number of circumferential stiffeners (given the concept is proven)
must be incorporated in the system with the necessary R&D allocation to bring these
technologies to their augmented or technologically introduced states. More investigation
must focus on the characterisation of the wind velocity extrapolation profile and
manipulation of the region’s surface roughness. Mitigation of adverse dynamic response on
the wall thickness re-configuration, parabolic hyperboloid geometry, increased chimney
height and flaring chimney geometry must be sought. Technology managers must remain in i The results reported in the epilogue, although very significant for SCPP chimney R&D, are not directly applicable to the development of the subject thesis; hence it is not reported in the main text. The reader is invited to view these interesting results.
172
touch with developments and breakthroughs in cable staying technology, external damping
and material elasticity modulus; their high R&D risks imply a (presumably) greater effort
than what in-house commitment could deliver. The structural impact of the Saguaro cactus
geometry must be investigated more thoroughly.
9.3.2 General priorities
Several tendencies in the SCPP technological portfolio are identified that indicate
previously successful R&D: research managers should remain open-minded and on the look
out for similar and interesting technologies/concepts for further investigation, introduction
and augmentation; problem solving ideas must not be written off without proper
consideration; nature must be engaged in search of technological solutions; and the structural
R&D must soon engage the technology differentiating research as specified in the Cascade of
Technological Trends.
This concludes the first iteration of the RIM with the formulation of research strategy. The
uncertain, fuzzy nature of radical innovation was systematised through the RIM, delivering a
methodology for formulating R&D strategy through systems and technological perspectives on the
radical problem.

173
CHAPTER 10
CONCLUSION
This chapter concludes the dissertation with a summary of the thesis argument and its resolution.
Recommendations for further research on the thesis topic are made.
10.1 Summary of background and motivation and the thesis statement
The incremental innovation process can dramatically improve the performance of a system
by novel implementation of codified design practice through interpretation and manipulation
from scientific first principles. Radical innovation is required, however, in the absence of
codified practice at one or more lower levels in the system. It requires innovation outside the
familiar realms of standardised, formalised theory and practice by identifying, re-interpreting and
addressing the basic system functionality that requires solution.
Radical innovation is characterised by high degrees of multi-disciplinary technical, market,
resource and organisational uncertainty and unpredictability. Its time frames are long with
sporadic project terminations and revivals, nonlinear recycling of the response to previous
setbacks and stochastic change of priorities and champions. Radical innovation aims to
progressively reduce uncertainties in radical concepts through their sufficient characterisation to
attract further investment. This cannot be provided by mere parameterised design or relevant
organisational support as is sufficient for incremental research; the lack of understanding of the
radical innovation process causes executives to make normative strategy decisions based on
mainstream business. A more comprehensive approach is required to understand the
complexities and uncertainties of the radical innovation. The need for a systematic,
methodological approach to managing – delimiting and characterising – uncertainties in radical
innovation is evident. The thesis statement was formulated: radical innovation can be
systematised through the synthesis of existing theory to form a basis for strategic decision-
making.

174
A major motivation for this study arises from the demand for sustainable solutions,
cultivating a long-term perspective in an attitude of custodianship after the many negative
impacts that the rise of technological enterprise in the 20th century had on the social, economical
and ecological environment. Engineering perspective must broaden to view technologies as
socio-technical systems that are responsive to the broader environment. This process may require
radical technological intervention demanding the fast-tracking of radical technological solutions
for solving of some critical global crises.
The 1,500 meter tall chimney structure of the SCPP fits as a case study for implementation of
the RIM. Radical challenges and uncertainties must be resolved toward its structural and
economic realisation and its positive impact on the global climate change crisis. The
methodology developed for this thesis responds to the specific demand for the set up of an
innovation strategy for development of the SCPP chimney structure up to feasibility.
10.2 Resolution of the thesis
10.2.1 Part I: synthesis of the Radical Innovation Methodology
The first part of the thesis synthesised the RIM. The fragmented, indeterminate (with
regard to radical innovation) tools of incremental innovation management currently used for
managing the erratic, uncertain characteristics of radical innovation were systematised and
extended through MOT theory. Part I investigated two scientific fields, SE and MOT, for
their potential contribution to the synthesis of a systematic approach aiding a RIM. SE, by its
comprehensive nature, provides valuable insight into the system functionalities and a
systematic, non-intuitive framework within which uncertainties and deficiencies can be
identified, characterised and delimited. The technology perspective brought about by MOT
unlocks insight into the building blocks of the radical innovation by the characterisation and
delimiting of technological status, potential and uncertainty.
SE and MOT theories were synthesised into a generic systematic radical innovation
methodology, the RIM. The RIM furthers SE, managing high uncertainty in user systems due
to perpetuated lower level uncertainty found in radical innovation. This is achieved through
extending high level system performance measurement and strategy formulation to
incorporate quantitative low level technological R&D and evaluation through the technology
assessing and evaluating approach of MOT methods. The systems approach provides a
framework for characterisation of the radical innovation, while MOT characterises and

175
determines maturity and growth trends of the technological sub-systems that form user
systems, enabling reasoned decision-making at an executive level.
The RIM is formulated in five distinct phases. A reference case is set up in response to
board specified requirements and broken down to its functional, technological elements
moving outside the constraints of standardised design practice and its limit state equations;
this is achieved through engaging the functional realm of technology. Each technology is
augmented or newly introduced in the system context and evaluated to determine its potential
for furthering system performance. Its technological characteristics and maturity as well as
the R&D risk of realising the sought technological performance are determined. During the
last phase strategy is formulated based on the systems and technological insight gained.
The integrated roles of a technology manager, technological expert and board were
identified for the RIM: the technology manager facilitates and compiles the RIM process
with supportive roles from the experts (technology specific insight) and the board (strategy
specific insight).
10.2.2 Part II: validation of the Radical Innovation Methodology
The proposed RIM was applied to the SCPP chimney structure radical innovation in the
second part of the document. It illustrated the value of the RIM through providing a
systematised approach toward SCPP chimney R&D strategy formulation. A reference case
was set up in response to a demand for a 1,500 meter tall chimney. The radicality of the
reference case was determined to provide an understanding of the measure of functional
performance improvement needed. The chimney was broken down into its technological
elements. Each technology was augmented or introduced to determine its potential impact on
system performance in terms of board and expert specified criteria – several technologies
emerged as critical for significant improvement in system performance. These technologies
were assessed and their maturity and R&D risk determined to contribute to a comprehensive,
pro-active perspective on the SCPP chimney technologies status and potential for impact.
Critical technologies identified
Technologies that emerged as critical are:
• the wall thickness re-configuration,
• the incorporation of parabolic hyperboloid geometry and

176
• the incorporation of more circumferential stiffeners.
These technologies promise very high to moderate impact on system performance at
very low to low R&D risk.
Three technologies promise to mitigate adverse dynamic response at moderate impact
on other criteria, and at moderate R&D risk. These are:
• the more thorough characterisation of the wind extrapolation profile,
• the potential manipulation of the region’s surface roughness character and
• the incorporation of the Saguaro cactus geometry.
The mitigation of adverse dynamic response could open up possibilities for increasing
the chimney height, while buckling mitigation could open possibilities for the flaring of
the chimney exit geometry. The cable staying, external damping and directional design as
well as developments and breakthroughs in concrete material technology, especially its
elasticity modulus, must be monitored or further investigated because their improvement
holds promise for SCPP chimney system performance improvement.
Technology characterisation and further observations pointed out that significant
further characterisation of action effects on the chimney needs to be performed and that
only one technology focuses on the reduction of SCPP system LEC. Technologies were
classified in the Nine Cell Technology Functional Classification Matrix for future
reference. Overall future R&D on the SCPP chimney should stay in touch with other
concepts and similar technologies as well as focus on solutions presented by nature.
The application of a systematic approach to SCPP chimney radical innovation
revealed two low R&D risk technologies (wall thickness re-configuration and parabolic
hyperboloid geometry) that promise significant impact on the system performance. These
critical developments were only considered at a late stage of the chimney innovation due
to the non-structured approach to radical innovation.
General R&D considerations proposed
The following general R&D considerations are identified or proposed:
• Research managers should remain open-minded and on the look out for similar
and interesting technologies/concepts for acquisition,
• Problem solving ideas must not be written off without proper consideration,
• Nature must be engaged in search of technological solutions and

177
• The structural R&D must soon engage the technology differentiating research as
specified in the Cascade of Technological Trends
10.2.3 The value of a Radical Innovation Methodology
The thesis presents a systematic approach streamlining and fast-tracking the non-
empirical, non-intuitive process of radical innovation, thus saving and optimising time and
other R&D resources. Opportunities that could have previously been overlooked are now
systematically identified. Uncertainties are distinguished and delimited in a comprehensive
framework from where they are characterised for focused functional mitigation.
A radical innovation methodology is presented where previously only incremental
innovation management procedures were available. The fields of SE and MOT are extended
by exploiting their contribution to the RIM synthesis. The successful first iteration
application of the RIM on the SCPP chimney supports the significant contribution of this
systematic approach to engage the uncertainties and unknowns characteristic of radical
innovation.
The RIM presents a generic approach to the solution of radical innovations; the systems
approach and characterisation of functional elements of the system are generic to any
problem. A sought-after solution is broken down from its main R&D theme to its essential
functionalities from where uncertainties and gaps can be characterised and delimited for
efficient R&D management. For example, the alleviation of the global HIV/AIDS endemic
(radical action and breakthrough is required) may be broken down to the awareness toward
abstinence from HIV/AIDS transmission, physical HIV/AIDS extermination through
breakthrough medical technology, temporary health care, etc. The impact of each element
may be determined by virtually augmenting its ‘performance’ and its priority for achieving
sought system performance evaluated. In the case of the absence of required functionalities
new technologies may be introduced. Thus, comprehensive perspective of the system and its
critical facets is available before prioritising resources for further investment.

178
10.3 Recommendations and suggestions
10.3.1 General Radical Innovation Methodology recommendations
The RIM presented in this dissertation mainly concerned radical technological innovation
for a system with functionalities as required during the operational phase in its life cycle.
Further research on the RIM may expand and customise it to be applicable to every phase of
the system life cycle, with incorporation of the various criteria that are important at various
life cycle phases. Also, specific implications of the progression from radical to incremental
innovation on the formulation of the RIM should be investigated and described.
The RIM focused mainly on the technological uncertainties of radical innovation. Further
investigations could provide organisational, logistical and resource support for this
methodology. The systematic procedure could enable a more logical derivation of
organisational and logistical support. Also, their (and the market’s) uncertainties could be
managed through the principles presented by the RIM.
SE and MOT are fields covering wide scopes from overall systems perspectives to
detailed methodologies and tools with steps for exact application. Broader and more detailed
investigation of their premises and specifics may add to the RIM synthesised in this
dissertation. Furthermore, the SE and MOT fields are relatively young scientific fields in
which theoretical and practical developments are still expected; the expansion and extension
of its theory, for example the detailed classification of technology in a taxonomical
framework, may enable the more thorough classification of system technologies and increase
the insight gained into their character and dynamics for more focused R&D strategy.
The RIM, being defined as a generic methodology, could be customised for numerous
other radical innovations. The functional, problem-solving perspective on innovations takes a
step back to identify the system of which the problem forms a part. Gaps and uncertainties
are delimited and functions required for addressing these gaps are qualified. The impact of
ideal or perfect performance improvement of the uncertainty is evaluated to identify critical
elements in the system. These can be characterised, classified and assessed in terms of the
potential for realising the sought improvement. Consequently, strategy is formulated to
address the re-allocation of resources to address the critical functionalities.

179
10.3.2 Solar Chimney Power Plant recommendations
Only the first iteration of the application of the RIM on the SCPP chimney was
performed. Subsequent iterations must narrow down and characterise the concept and its
uncertainties. Accompanying R&D may identify other or further R&D focus areas. The
radical innovation should eventually become sufficiently characterised to be further
manageable by standardised design procedures.
Several issues were not addressed due to resource constraints, amongst others the
constructability of the SCPP. Future research should focus on investigating these issues to fill
in the missing pieces in the comprehensive framework of the SCPP chimney system.
Investigation into accurate, representative MCDM methods could better inform the SCPP
chimney decision-making process.
The emergence of the other SCPP chimney concepts may prove to be more feasible than
the reinforced concrete chimney chosen in this dissertation as reference case for the RIM
application.
The systematic approach presented by the synthesis of SE and MOT approaches in the Radical
Innovation Methodology streamlines radical innovation and formulation of its R&D strategy. It
presents a systems based framework from which critical technological elements and uncertainties are
identified and characterised and growth trends and R&D risks are identified, thus enabling reasoned
decision-making. The Radical Innovation Methodology holds a key to the resolution of radical,
critical challenges mankind is faced with in the 21st century.

180

181
EPILOGUE
In a step that is preparatory to a second iteration reference case formulation, four of
the top technologies (section 9.2.2) are incorporated into the first iteration reference case:
• The wall thickness re-configuration, as formulated in section 7.1.13, is included in
combination with
• the parabolic hyperboloid geometry (section 7.1.10),
• the addition of the five additional circumferential stiffeners (section 7.1.12) and
• the ultra-high strength performance concrete (section 7.1.8) (a modulus of
elasticity at 60 GPa was chosen in the latter case).
Note that the other technological subjects are not incorporated into the system yet due
to resource constraints. Further, note that not all these synthesised technologies are
developed up to the value that they are introduced or augmented at in this synthesis.
The synthesised system yields excellent results (summarised in Appendix I). The
energy yield has a slightly lower limit than that of the parabolic hyperboloid system of
section 7.1.10 due to the presence of the additional circumferential stiffeners, at 304.13
GWh/y, which is approximately 0.3% lower than that of the reference case. The capital
costs are reduced from R27.70Bn to R8.55Bn resulting in a LEC of R3.63/kWh (This
significant decrease in capital cost is mainly due to the exclusion of the fins stiffening
structures. The fin-stiffened chimney system contained almost three and a half times the
concrete required by the parabolic hyperboloid geometry chimney system.). The critical
buckling factor surpassed the ‘ideal’ 5.0 mark with a first global buckling mode value of
λ1 = 5.75. The first global free vibration frequency is at 0.113 Hz resulting in a gust load
factor, which is almost 4% above that of the reference case, but safely outside any critical
wind velocities.
The new, synthesised LEC value is lower than with any individual technology
augmentation. The structural performance against buckling is significantly better, having
surpassed the barrier stated as the ideal result, while the gust load factor does not pose

182
any significant threat. It is concluded that the implemented systematic RIM approach
proposed by this thesis, resulted in significant cost and structural benefits, thus leading
the SCPP chimney development several steps closer to structural and economical
realisation.

183
REFERENCES
Abernathy, W. J., and Utterback, J. M. (1978). Patterns of Industrial Innovation. Technology Review. June-July, pp. 40-47.
Alberti, L. (2006), Flow around cylindrical towers: the stabilising role of vertical ribs, Master’s Thesis, University of Stellenbosch.
Altshuller, G., Shulyak, L., Rodman, S. (2001), 40 Principles: TRIZ keys to technical innovation, Technical Innovation Centre.
An Inconvenient Truth – a global warning (2006), Academy-award winning documentary film relating to global warming.
Australian government (2006), International Data Comparisons, Document off Invest Australia website (2006), http://www.investaustralia.gov.au/media/IA_IDC_APR06.pdf.
Australian standards (1989), SAA Loading Code, Part 2: Wind Loads AS1170:2 1989, Standards Australia.
Banks, D. and Schäffler, J. (2006), The potential contribution of renewable energy in South Africa: draft update, prepared for Sustainable energy & climate change project (SECCP).
Blanchard, B.S. and Fabrycky, W.J. (2006), Systems Engineering and Analysis 4th edition, Prentice Hall.
Bosman, P.B., Strickland, I.G. and Prukl, R.P. (1998), Strengthening of natural draught cooling tower shells with stiffening rings, Engineering Structures, Volume 20, Number 10, October 1998, pp. 909-916.
Bowden, M.J. (2004), Moore’s Law and the technology S-curve, Current issues in technology management, Stevens Alliance for Technology Management, Issue 1, Volume 8, Winter 2004.
Callister, W.D. Jr. (1997), Materials science and engineering: an introduction, 4th edition, John Wiley & Sons, Inc.
Chaney, W.R. (2001), How wind affects trees, Purdue University Publication, Spring 2001, Volume 10, Number 1.
Cheong, S.H. (2006), MOT by using scientific methodology in Samsung R&D, Keynote lecture at Portland International Conference for Management and Engineering Technology, Istanbul, Turkey, July 2006.
Christensen, C.M. (1992), Exploring the limits of the technology S-curve. Part I: competent technologies, Production and management 1, no.4.

184
Christensen, C.M. and Bower, J.L. (1996), Customer power, strategic investment and the failure of leading firms, Strategic Management Journal 17 p.197-218, John Wiley & Sons.
Clausing, D.P. (2001), The role of TRIZ in technology development, Keynote talk at TRIZCON 2001, The Altshuller Institute Conference.
Comstock, D.A. and Lockney, D. (2007), NASA’s Legacy of Technology Transfer and Prospects for Future Benefits, AIAA SPACE 2007 Conference & Exposition, 18-20 September 2007, Long Beach, California.
Datta, T.K. (2003), A state-of-the-art review on active control of structures, ISET Journal of Earthquake Technology, Paper No. 430, Vol. 40, No. 1, March 2003, pp. 1-17.
Deffeyes, K.S. (2005), Beyond oil: a view from Hubbert’s peak. Hill & Wang, New York.
DME (Department of Minerals and Energy) 2003. White paper on renewable energy, DME. www.dme.gov.za.
Electricity Supply Commission (ESKOM) (2006), Annual Report, South Africa.
Electricity Supply Commission (ESKOM) (2007), Annual Report, South Africa.
Engineering News (2007a), Regulator to hear submissions on Eskom's price-hike request, Article on 20 August 2007.
Engineering News (2007b), Eskom likely to spend some R800-billion over next two decades, Article on 13 July 2007.
Evans, J.T. (2005), Developing a decision model in the context of medical technology, Technology Education, Ohio State University.
Finance 24 (2007), Media release: Electricity prices too low, Article on 19 July 2005.
Floyd, C.M. (1997), Managing technology for corporate success, Gower Publishing Limited.
Fluri, T. P. and Von Backström, T. W. (2006) Performance of the power conversion unit of a solar chimney power plant, World Renewable Energy Congress IX 2006, Florence, Italy.
Ford, D. and Saren, M. (1996), Technology strategy for business, International Thomson Business Press.
Fraser, E. (2006), Stabilization of the Solar Chimney, under-graduate research paper, University of Stellenbosch, South Africa.
Fujino, Y. (2002), Vibration, control and monitoring of long-span bridges – recent research, developments and practice in Japan, Journal of Constructional Steel Research 58 (2002) 71-97.
Fusfeld, A. (1978), How to put technology into corporate planning, Technology Review, MIT, Alumni Association.
Gerdsri, N. and D. F. Kocaoglu (2003), An Analytical Approach to building a Technology Development Envelope (TDE) for Roadmapping of Emerging Technologies: A Case Study of

185
emerging Electronic Cooling Technologies for Computer Servers, Technology Management for Reshaping the World, IEEE catalog number 03CH37455, pp. 380-389.
Glubrecht, H. (1973), Kraftwerksbau als interdisziplinäre Aufgabe, Technische Univresität Hannover.
Goforth, R.R. (1999), Independent Technology Assessments Facilitate Sound Investments, Beta-Rubicon, Inc.
Grove, N. (1974), Oil, the dwindling treasure, National Geographic, June 1974.
Grulke, W. (2001), Lessons in radical innovation: South African leading the world, Thorod’s African Books.
Hardin, G. (1968), Tragedy of the commons, Science, 162.
Harrison, N and Samson, D. (2002), Technology management: text and international cases, McGraw-Hill/Irwin.
Harte, R. (2007), Presentation for the conference publication State of the art of cooling tower design in Germany, 3rd Conference on Structural Engineering, Mechanics and Computation, 10-12 September 2007, Cape Town, South Africa.
Harte, R. and Krätzig, W.B. (2007), Greentower: design and construction, Greentower presentation Windhoek.
Harte, R., Lenz, J., Meiswinkel, R. (2007), State of the art of cooling tower design in Germany, Structural Engineering, Mechanics and Computation 3, A. Zingoni (editor), Millpress Science Publishers, Rotterdam, The Netherlands.
Harte, R. and Van Zijl, G.P.A.G. (2007), Structural stability of concrete wind turbines and solar chimney towers exposed to dynamic wind action, Journal of Wind engineering and industrial aerodynamics, Vol. 95.
Harvey, B. (2007), SEI discussion: Mechanism based Assessment of Masonry Arch Bridges, Structural Engineering International 1/2007.
Holmes, J.D. (2001), Wind loading on structures, SponPress.
ICHNET (2007), Interoperability Clearinghouse, www.ichnet.org.
IEA (International Energy Association) (2003), Energy technology: facing the climate challenge, Meeting of the Governing board at ministerial level, 28-29 April 2003.
IMTI (Integrated Manufacturing Technology Initiative) (2003), 21st Century Manufacturing Taxonomy: a framework for manufacturing technology knowledge management, IMTI, Inc.
INCOSE (1998), Systems Engineering Terms Glossary, International Council on Systems Engineering.
Internet 1 (2008), Helical strakes wrapped around the upper third of a chimney stack in transit, www.ellesmerefabricators.com/images.
Internet 2 (2008), Saguaro cactus field, http://www.azwild.org/resources/PlacesatRisk.php.

186
Internet 3 (2007), Cable stayed transmission tower at the Olympics stadium in Berlin, www.structurae.de.
Internet 4 (2008), Athlone power station cooling tower. http://www.flickr.com/photos/flxy/206760-4099.
Internet 5 (2008), Taipei 101 tuned mass damper, www.commons.wikimeida.org.
Internet 6 (2008), Taipei 101 at twilight, www.sogonow.com.
ISO DIS (2007), Wind actions on structures, International Organisation for Standardization, Draft International Standard.
JCSS (2001), Probabilistic model code Part 2: Load models, Joint Committee on Structural Safety
Johnston, R. (2003), Presentation of Introduction to technology foresight and scan: principles and practices, Design and methodology workshop, The ASEAN technology foresight and scan project, 4-5 August 2003, Hanoi.
Kasperski, M. (2007), Design wind loads for a low-rise building taking into account directional effects, Journal of Wind Engineering and Industrial Aerodynamics 95, p. 1125–1144.
Kijewski, T. and Kareem, A. (2001), Dynamic wind effects: a comparative study of provisions in codes and standards with wind tunnel data, Work performed under NSF Grant No. CMS-9503779.
Kim, J. and Hangan, H. (2007), Numerical simulation of impinging jets with application to downbursts, Journal of Wind Engineering and Industrial Aerodynamics 95, 279-298.
Kostoff, R.N., Boylan, R. and G.R. Simons (2004), Disruptive technology roadmaps, Technology Forecasting and Social Change, Volume 71, pp. 141-159.
Krishna, P. (2001), Review article, Tension roofs and bridges, Journal of Constructional Steel Research 57 (2001) 1123–1140.
Kumar, R.A., Sohn, C.-H., Gowda, H.L. (2008), Passive control of vortex-induced vibrations: an overview, Recent patents on Mechanical Engineering 2008, 1, 1-11.
Kwok, K.C.S. and Samali, B. (1995), Performance of tuned mass dampers under wind loads, Engineering Structures Vol. 17, No. 9.
Leiffer, R., McDermott, C.M., O’Connor, G.C., Peters, L.S., Rice, M.P. and Veryzer, R.W. (2000), Radical innovation – how mature companies can outsmart upstarts, Harvard Business School Press, Boston, Massachusetts.
Letchford, C.W., Mans, C. and Chay, M.T. (2002), Thunderstorms – their importance in wind engineering (a case for the next generation wind tunnel), Journal of Wind Engineering and Industrial Aerodynamics 90 (2002) 1415-1433.
Li, V. C. (2000), Large volume, high-performance applications of fibers in Civil Engineering, John Wiley & Sons, Inc. J Applied Polymer Science 83: 660–686, 2002.
Lomborg, B. (2005), Global Crises, Global Solution, Ed. Cambridge University Press, Cambridge.

187
Lorek, M. (2007), Green Tower im südlichen Afrika – Baustoffe und Bauverfahren (Green Tower in southern Africa – materials and production methods), Dissertation for fulfillment of undergraduate studies at the Bergische Universität Wuppertal.
Lourens, E.-M. (2005), The development of a ring stiffener concept for the Solar Chimney, under-graduate research paper, University of Stellenbosch, South Africa.
Lumby, M. (2003), Optimizing wall thickness and reinforcement for the Solar Chimney, under-graduate research paper, University of Stellenbosch, South Africa.
Mail and Guardian (2008a), ESKOM looks to the sun, Article in the Mail and Guardian, 28 February 2008.
Mail and Guardian (2008b), Energy crisis? What energy crisis?, Article in the Mail and Guardian, 25 January 2008.
Mail and Guardian (2008c), ESKOM wants 53% tariff hike, Article in the Mail and Guardian, 18 March 2008.
Mehta, K.P. and Monteiro P.J.M. (2006), Concrete: Microstructure, Properties and Materials, 3rd edition, McGraw-Hill.
Meredith, J.R. and Mantel, S.J. Jr. (1995), Technological Forecasting: Appendix B, University of Cincinnati.
Michaud, E. and Michaud, L. (2006), The atmospheric vortex engine, Windtech International, January/February 2006.
Milford, R.V. (1987), Annual maximum wind speeds from parent distribution functions. Journal of Wind Engineering and Industrial Aerodynamics, Volume 25.
Moore, G.A. (1991), Crossing the chasm, Harper Business Essentials.
Murray, C. and Bly Cox, C. (1989), Apollo: the race to the moon, Secker & Warburg, London.
Nel, G.S. (2004), Thermal effects on the Solar Chimney Power Plant chimney structure, under-graduate research paper, University of Stellenbosch, South Africa.
Niemann, H.-J., Hoelscher, N., Hoeffer, R. (2007), Consideration of directional effects in the design of cooling towers, Structural Engineering, Mechanics and Computation 3, A. Zingoni (ed.), Millpress, Netherlands.
Papageorgiou, C.D. (2004), External wind effects on floating solar chimney, School of electrical and computer engineering, Athens.
Parker, L. and Blodgett, J. (2007), CRS report for congress: Greenhouse gas emissions: Perspectives on the top 20 emitters and developed versus developing nations, prepared for members and committees of congress.
Phaal, R. and G. Muller (2008), An architectural framework for Roadmapping: towards visual strategy, Technology Forecasting and Social Change, Article in press.
188
Phaal, R., Farrukh, C.J.P. and D.R. Probert (2004), Roadmapping a disruptive technology: A case study – the emerging Microsystems and top-down nanosystems industry, Technology Forecasting and Social Change, Volume 71, pp. 5-26.
Phaal, R., Farrukh, C.J.P. and D.R. Probert (2006), Technology management tools: concept, development and application, Technovation, Volume 26(3), pp. 336-344.
Pitz-Paal, R., Dersch, J., Milow, B. (2003), European concentrated solar thermal road-mapping (ECOSTAR), report commissioned by the Deutches Zentrum für Luft- und Raumfahrt e.V.
Pretorius, J.P. (2007), Optimization and control of a large-scale Solar Chimney Power Plant, PhD Dissertation, University of Stellenbosch, South Africa.
Pretorius, J.P., Kröger, D.G., Buys, J.D., Von Backström, T.W. (2004), Solar Tower Power Plant performance characteristics, proceeding from EUROSUN 2004.
Putzmeister (2007), Press Release No 1514A.
Renewable Energy World (2007), Review issue 2006-2007, Pennwell.
Renewables 2007 (2007), Global status report. A Pre-Publication Summary for the UNFCCC COP13 REN21 Renewable Energy Policy Network for the 21st Century, Bali, Indonesia.
Rogers, E.M. (2003), Diffusion of innovations, 5th edition. New York Free Press.
Rousseau, J-P. (2005), Dynamic evaluation of the solar chimney, Master’s thesis, University of Stellenbosch.
Roussel, P.A., Saad, K.N. and Erickson, T.J. (1991), Third generation R&D: managing the link to corporate strategy, McGraw-Hill.
SABS 0160:1989, Code of practice for the general procedures and loadings to be adopted in the design of buildings, South African Bureau of Standards.
Savransky, S.D. (2000), Engineering of creativity: introduction to TRIZ methodology of inventive problem solving, CRC Press LLC.
Sawka, M. (2004), Solar Chimney – untersuchungen zur Strukturintegrität des Stahlbetonturms, Diplomarbeit, Bergische Univesität Wuppertal.
Schindelin, H.W. (2002), Entwurf eines 1500 m hohen Turms eines Solar-Aufwindkraftwerkes – Parameteruntersuchung zur Geometrieoptimierung, Diplomarbeit, Bergische Univesität Wuppertal.
Schlaich, J. (1995), The solar chimney – electricity from the sun, Edition Axel Menges.
Schlaich, J. (1999), Tension structures for solar electricity generation, Journal of Engineering Structures, Issue 21 p658-668, Elsevier.
Schlaich Bergermann und Partner (2004), Interactive CD-ROM, The Solar Chimney, October 2004.
Schlaich, J., Bergermann, R., Schiel, W., Weinrebe, G. (2004a), Design of Commercial Solar Updraft Tower Systems – Utilization of Solar Induced Convective Flows for Power Generation, available on the Schlaich Bergermann und Partner website, www.sbp.de.

189
Schlaich, J., Bergermann, R., Schiel, W., Weinrebe, G. (2004b), Sustainable electricity generation with solar updraft towers, Structural Engineering International 3/2004.
Sherwin, C.W. and Isenson, R.S. (1966), First interim report on Project Hindsight, Office of the Director of Defense Research and Engineering, Washington DC, Accession number: AD0642400.
Shirwaiker, R.A. and Okudan, G.E. (2006), TRIZ and Axiomatic design: a review of manufacturing case-studies & their compatibility, Proceedings from Portland International Conference for Management and Engineering Technology, Istanbul, Turkey, July 2006.
Solar Millenium AG (2004), Solar thermal power plants: clean energy for the future, presentation for PowerGen Middle East 2004, Manama, Bahrain
Steele, L.W. (1989), Managing technology – the strategic view, McGraw-Hill
Stefik, M. and Stefik, B. (2004), Breakthrough: the stories and strategies of radical innovation, Massachusetts Institute for Technology
Stegall, N. (2006), Designing for sustainability: a philosophy for ecologically intentional design, Design Issues, Volume 22-2
Stern, Sir N. (2006), Stern review on the economics of climate change. Compiled for the government of the United Kingdom.
Stinnes, W-W. (1997), On a 200 MW solar power station in the Northern Cape Province, Republic of South Africa, Consultancy for the Northern Cape Province.
Stinnes, W-W. (2004), Greentower stops climate change by CO2 sequestration, Industrial and commercial use of energy conference 2004, Cape Town, South Africa
Suksawang, N., Nassif, H.N., Tanchan, P. (2006), Comparison of elastic modulus equations for high-performance concrete (HPC) with pozzolanic materials, International Conference on Pozzolan, Concrete and Geopolymer, Khon Kaen, Thailand, May 24-25, 2006
Symans, M.D. and Constantinou, M.C. (1999), Semi-active control systems for seismic protection of structures: a state-of-the-art review, Engineering Structures Volume 21, 469–487.
Talley, S. and Mungal, G. (2002), Flow around cactus-shaped cylinders, Center for turbulence research, Annual Research Briefs.
Triantaphyllou, E., Shu, B., Nieto Sanchez, T.R. (1998), Multi-criteria decision making: an operations research approach, Encyclopedia of Electrical and Electronics Engineering, Vol.15, p175-186, John Wiley & Sons., New York.
Tumer, I.Y. and Stone R.B. (2001), Mapping function to failure during high-risk component development, Research in engineering design, ASME/DTC 2001.
Twiss, B. (1992), Managing technological innovation, 4th edition, Pitman.
UNFCCC (2003), Caring for climate: a guide to the climate change convention and the Kyoto Protocol, Issued by the Climate Change Secretariat (UNFCCC) Bonn, Germany

190
United Nations (2005), Beijing declaration on renewable energy for sustainable development, Beijing International Renewable Energy Conference.
US State of the Nation address (2006), Address by President George W. Bush, http://www.whitehouse.gov/stateoftheunion/2006/
Van Dyk, C. (2004), Realisation of the Solar Chimney inlet guide vanes, Master’s thesis, University Of Stellenbosch.
Van Dyk, C. (2006), A technology development methodology for application on the solar chimney structure, Proceedings from Portland International Conference for Management and Engineering Technology, Istanbul, Turkey, July 2006.
Van Dyk, C., Alberti, L., Van Zijl, G.P.A.G. (2006), Technology Development Methodology and Solar Chimney Power Plant wind-structure interaction: ongoing research, 4th Construction Industry Development Board Conference, Stellenbosch, South Africa, October 2006.
Van Dyk, C. and Van Zijl, G.P.A.G. (2002), The solar chimney – improving the concept, Proceedings from International Association for Shell and Spatial structures conference: lightweight structures for Civil Engineering, Warsaw, Poland, June 2002.
Van Dyk, C. and Van Zijl, G.P.A.G. (2004), Realization of the inlet guide vanes – an integral part of the solar chimney, Progress in Structural Engineering, Mechanics and Computation, Taylor & Francis Group, London.
Van Wyk, R.J. (2000), A macro-map of medical technologies: introductory thoughts, International Journal on Healthcare Technology and Management, Volume 2, No.1/2/3/4
Van Wyk, R.J. (2004a), Technology: a unifying code – a simple and coherent view of technology, Transaction Publishers.
Van Wyk, R.J. (2004b), Theory of Technology, edited by David Clarke, Transaction Publishers.
Van Zijl, G.P.A.G. (2008), Personal correspondence concerning the classification of concrete strength.
VGB (2005), Structural design of cooling towers: technical guideline for the structural design, computation and execution for cooling towers, VGB-R 610Ue, completely revised edition, Technical Association of Large Power Plant Operators e.V.
Vojak, B.A. and F.A. Chambers (2004), Roadmapping disruptive technical threats and opportunities in complex, technology-based subsystems: the SAILS methodology, Technology Forecasting and Social Change, Volume 71, pp. 121-139.
Von Backström, T.W. (2000), Compressible flow through solar power plant chimneys, Journal of Solar Engineering, ASME, Vol.122, August 2000.
Von Backström, T.W., Kirstein, C.F., Pillay, L.A. (2003), The influence of some secondary effects on solar chimney power plant performance, 2003 ISES Solar World Congress, Göteborg, Sweden.
Walsh, S.T. (2004), Roadmapping a disruptive technology: A case study – the emerging Microsystems and top-down nanosystems industry, Technology Forecasting and Social Change, Volume 71, pp. 161-185.

191
Walther, R., Houriet, B., Isler, W., Moïa, P., Klein, J.F. (2003), Cable stayed bridges, 2nd edition, Thomas Telford.
WeatherSA (2007), Personal correspondence with Charlotte McBride, Assistant Manager: Publications, South African Weather Service.
Webster (2008), http://www.websters-online-dictionary.org/definition/radical, Copyright © 2008 Philip M. Parker, INSEAD.
Wikipedia 1 (2008), http://en.wikipedia.org/wiki/Delphi_method.
Wikipedia 2 (2008), http://en.wikipedia.org/wiki/Worlds_tallest_structures.
World Bank (2006), Total GDP 2006, World Development Indicators database, World Bank, 1 July 2007.
Wunderlich, S. and Khalil, T. (2004), Introducing technology timeline interpretation to technology diffusion and maturity analysis as applied to different industrial sectors, IAMOT 2004 - Washington, D.C. Technology Foresight and Forecasting.
Yalla, S.K., Kareem, A. and Kantor, J.C. (2001), Semi-active tuned liquid dampers for vibration control of structures, Engineering Structures, Volume 23, p.1469-1479.
Yu, O. (2005), Introduction to technology planning & management, coursework notes, San José State University.

192

A1
APPENDIX A
FINITE ELEMENT ANALYSES
The Finite Element Method model and analyses procedures for the Chimney are presented here.
DIANA Finite Element Analysis version 9.2 FE software [DIANA 2007] is used throughout.
A1 FEM model
A1.1 Mesh
A finite element (FE) model generated and calibrated in previous research [Rousseau
2005] forms the basis for the model used in this investigation (see Figure A1 – left and
middle). Eight node quadrilateral iso-parametric curved shell elements, CQ40S, are used to
model all structural shell elements (chimney and longitudinal fin stiffening structures); three
translational and two in-plane rotational degrees of freedom are available per node. Two
node Bernoulli beam elements, L12BE, are used to portray the columns supporting the
chimney; three translational and three rotational degrees of freedom are available per node.
Additional lateral stiffening beams are deployed between adjacent fins to model the
constraint effect that the collector roof has on the fins to prevent buckling. The model is
simplified by modeling only half the chimney. This assumption is made due to geometrical
and loading symmetry about the axis of wind direction. Note that this approach assumes
loading and response symmetry, for instance not capturing torsional action and response.
A1.2 Constraints
Due to the symmetry simplification of the model the nodes on the symmetry axis are
constrained appropriately. The stiffeners are not modeled directly, but their effect is included
by the constriction of rotation around the vertical axes at the proposed locations of stiffening
(Figure A1 – right). Note that the circumferential stiffener “spokes” are displayed only and
did play an active structural role.

A2
Figure A-1. The FE model (left and middle). The rotational constraint about the global z-
axis (right).
The impact of the Sishen soil/rock characteristics on structural performance is evaluated
in the FEM model. Soil/rock characteristics are introduced to the model with a spring model
prescribed by Gazetas [1983]. The soil/rock characteristics are subdivided in the following
horizontal layers in Table A-1:
Table A-1. Soil/rock characteristics for the Sishen region.
Soil/rock characteristics
Layer Depth [m] Elasticity modulus [average GPa]
Poisson ratio [average]
Top layer: Kalahari sand
Between 0 and 0.8 n/a; excavated
Limestone Between 0 and 50 10.9 0.26 [Hart and Wang 1995]
Weathered lava rock
Between 20 and below 66.9 0.26

A3
Soil deformation assumes linear isotropic visco-elastic behaviour [Gazetas 1983]. Soil
stiffness characteristics of the actual soil system can be replaced by a bed of independent
elastic springs resting on a rigid base. On the basis of field measurements, tables and
empirical formulae were presented from which one can readily estimate design values of the
coefficient for several types of soil for all possible modes of vibration. The following
frequency-independent coefficients apply to response in the low frequency range:
υ−=
1
4GRK v (A1)
where Kv = spring constant (stiffness) [N.m]
R = radius of the circular rigid loading area [m]
G = shear modulus [Pa]
= ( )υ+12
E
E = elasticity modulus of soil [Pa]
υ = Poisson’s ratio of soil
The expressions for the four degrees of freedom and the corresponding values for
limestone and weathered lava rock assuming a foundation size of 240 meter radius (160
meter chimney diameter plus two 160 meter fin stiffener structures) follow in Table A-2. The
foundation is assumed to be a circular disk below the chimney and fin stiffeners.
Table A-2. Equivalent spring stiffness values for rock substrate.
Mode Vertical Horizontal Rocking Torsion
Stiffness formulation υ−1
4GR
υ−2
8GR
)1(3
8 3
υ−GR
3
16 3GR
Limestone 5.61e+12 4.77e+12 2.15e+17 3.19e+17 Weathered lava rock 3.44e+13 2.93e+13 1.32e+18 1.96e+18
Each node on the base level of the FE model is awarded these translational and rotational
stiffnesses. Subjected to the reference case wind loads the soil/rock show negligible change
in the first global natural vibration frequency with it decreasing from 0.1943 Hz to 0.1942
Hz.
A4
In conclusion (of the base fixity investigation) the SCPP reference case FEM model is
constrained against all translation and rotation after determining that change in first global
natural vibration mode, with base spring stiffnesses based on data from soil properties at
Sishen being negligible.
A1.3 Material and physical properties
The shell is made up of high performance reinforced concrete with an elasticity modulus
of 30 GPa and Poisson ratio of 0.2. The elasticity modulus remains 30 GPa as only uncracked
linear elastic buckling analyses are performed. The tube shell is partitioned in 51 horizontal
sections to accommodate for the variation in wall thickness in a step-wise manner, assigning
to each section the relevant thickness. The column beams are assigned a circular geometry of
a constant 10.7 meter diameter.
A2 Analyses
Linear elastic buckling analyses, free vibration analyses and frequency response analyses are
introduced here – refer to section 5.3.1. The applicability of the frequency response analysis to
the SCPP chimney response is discussed.
A2.1 Linear elastic buckling
The linear elastic buckling analysis solves the following eigen-problem [for more
detailed on buckling analyses refer to Bathe 1995]
( ) 00 =⋅+ UKK GcritL δλ (A2)
where KL0 = linear stiffness matrix
λcrit = critical buckling factor, i.e. factor on load in order to satisfy
Equation A2
KG = geometrical stress stiffness matrix
δU = displacement matrix
A2.2 Free vibration
The free vibration analysis solves the eigen-problem
A5
( ) 020 =⋅+ φω MK L (A3)
where ω = eigen-frequency, or free vibration frequency, in radians per second
M = mass matrix
φ = eigen-vector, depicting the mode shape of the vibration mode
The free vibration analysis yields mode shapes that are excited at the corresponding
frequency. The free vibration result in itself is not conclusive to determine structural
integrity. The structural response to dynamic excitation determines its structural integrity. If
its free vibration frequencies are excited during periodic loading conditions, it could lead to
excitation of resonant oscillation, which could have detrimental effects on the structure.
A2.3 Frequency response
The frequencies of typical wind load excitation spectra are concentrated in the lower
frequencies and normally only endanger slender structures with global free vibration
frequencies around the same spectrum. The structural response to the second global free
vibration mode is generally considered negligible relative to the significant response of the
first mode; this is confirmed in a frequency response analysis in DIANA FE software where
a Davenport frequency spectrum [Rousseau 2005] is deployed to vary the maximum load on
the SCPP chimney (Figure A-2). The figure displays peaks due to resonance at the first
(0.135 Hz), second (0.225 Hz) and third (0.28 Hz) global free vibration frequencies but the
latter two are significantly less than the peak at the first free vibration frequency, and than the
static deformation (at 0 Hz). Note that the applicability of this analysis is limited because the
frequency spectrum is a function of height, which DIANA cannot incorporate, and because
the maximum peak wind load was varied while in reality it is only the gust that fluctuates
around the mean wind load. It does illustrate a conservative case – the second free vibration
mode will not be excited if larger than 0.2 Hz.
The conclusion is reached that only the first free vibration frequency and associated
mode-shape need to be considered during dynamic analysis provided the second global free
vibration frequency is larger than 0.2 Hz – this qualification must be verified for each
technology alternative.

A6
The simplified dynamic response calculation depicted from the Australian Wind Loading
Code [AS1170-2:1989] is used in order to determine the quasi-static loading factor that is
evaluated henceforth.
Figure A-2. SCPP chimney typical frequency response: amplified deformation of a
windward node at the chimney tip.
References
DIANA finite element analysis, Release 9.2 (2007), TNO DIANA.
Gazetas, G. (1983), Analysis of machine foundation vibrations: state of the art, Soil dynamics and earthquake engineering, Vol.2, No.1, CML Publications.
Hart, D.J. and Wang, H.F. (1995), Laboratory measurements of a complete set of poroelastic moduli for Berea sandstone and Indiana limestone, Journal of Geophysical Research, Volume 100, Issue B9, 17741-1752.
Bathe, K.-J. (1995), Finite element procedures, Prentice-Hall.
B1
APPENDIX B
WIND MODEL USED ON
SCPP CHIMNEY
B1 Reference wind load on SCPP chimney
Wind pressure loads on a structure surface are formulated as follows:
Fz,θ = [Cpe,θ – Cpi] · qmax,z · A (B1)
where qmax,z = maximum expected gust velocity pressure [Pa]
= ½ρz2zU
) (B2)
ρz = air density at relevant height [kg/m3]
zU)
= Expected peak gust velocity at height z [m/s]
= zuz gU ,σ+ [Holmes 2001] (B3)
zU = mean design wind velocity at height z [m/s], as described by the corrected
logarithmic profile [Harris and Deaves 1978]
=
+
−
−+432
0
*
4
1
3
4875.175.5ln
δδδδzzzz
z
z
k
u (B4)
10U = Udesign hourly mean, 10 meter height
= 1/1.53 · U design max 3 second gust, 10meter height [ISO DIS 2008]
= 1/1.53 · kr · Umax 3 second gust, 10meter height, 50yr
kr = factor for adjusting for wind return period
= 1.17 for adjusting from 50 to 1,000 year return period; 1,000 years is chosen
from the ISO code [ISO DIS 2008]. Note that a 2,000 year return period is
used for reference case frequency response calculations.

B2
z0 = roughness length [m]
z = height above ground level [m]
δ = height at which surface frictional effects are negligible, also known as the
gradient height [m]
= cf
u
6* (B5)
*u = frictional velocity [m/s]
= κ⋅2
10U (B6)
κ = surface drag coefficient
=
2
0
10ln
z
k (B7)
k = Von Karman constant
≈ 0.4
fc = Coriolis parameter
= λsin2Ω
Ω = earth rotational velocity [rad/s]
= 7.27*10-5
λ = latitude
g = statistical peak value
zu ,σ = standard deviation of wind velocity zU on height z
= uz IU (B8)
Iu = turbulence intensity
=
0
ln
1
z
z (B9)
Cpe,θ = external pressure coefficient, experimental results from SCPP research are
used in this evaluation

B3
Cpi = internal pressure coefficient, experimental results from SCPP research are
used in this evaluation
A = surface area on which pressure is exerted [m2]
With the formulation explained, the values can be calculated to determine the forces acting
on the chimney. Table B-1 provides a logical layout of these calculations:
Table B-1. Calculations for wind forces on SCPP chimney.
Attribute Value Reference
Umax 3 second gust, 10meter height, 50yr 40 m/s SABS 0160:1989
Return period used to factor load on SCPP
chimney
1,000
years ISO DIS 2007
Factor to correct 50 year to 1000 year wind
velocity 1.17 SABS 0160:1989
U design max 3 second gust, 10meter height 46.8 m/s
Factor to change from 3 second gust to hourly
mean 1.53 ISO DIS 2007
Udesign hourly mean, 10 meter height 30.59 m/s
Roughness length, z0 0.02 m Holmes 2001, Niemann
2007
Von Karman constant, k 0.4 Dyrbye and Hansen 1997
Surface drag coefficient, κ
2
0
10ln
=
z
kκ (B10) 0.00414 Holmes 2001
Frictional velocity, u* 1.969 m/s Holmes 2001

B4
210
2*
U
u=κ (B11)
Sishen latitude, λ ≈ 28o
South
Coriolis parameter, fc
λsin2Ω=cf with Ω = earth rotational
velocity = 7.27*10-5 rad/s
6.826e-05 Dyrbye and Hansen 1997
Gradient height, zg
cg f
uz
6*= (B12)
4,807 m Dyrbye and Hansen 1997
Air density: RL
gM
T
hLpp
−
⋅+=0
0 1 ;
where h = height above sea level; for Sishen: h = z + 1200
p0 = sea level standard atmospheric pressure = 101325 Pa
T0 = sea level standard temperature = 288.15 K
L = temperature lapse rate = −0.0065 K/m
R = universal gas constant = 8.31447 J/(mol·K)
M = molecular weight of dry air = 0.0289644 kg/mol
g = gravitational acceleration
RT
pM=ρ with T=T0+L.h ; for Sishen h = z + 1200
Free stream velocity pressure
qmax,z=½ρz2zU
) (B13)
The loads over chimney height are shown in
Figure B-1.

B5
0
300
600
900
1200
1500
0 500 1000 1500 2000 2500 3000 3500 4000
Free stream velocity pressure [Pa]
Hei
gh
t [m
]
Figure B-1. Free stream velocity pressure increase with height.
Circumferential pressure coefficient
Cp = Cp,external – Cp, internal (B14)
Two cases are investigated, one with
maximum internal vertical flow, the
other with no internal flow [Harte and
Van Zijl 2007]. In both cases the 1.2D
curve (see Figure B-2) is used due to its
lower suction forces. The case with
vertical flow (Cp, internal = -0.1 – see
Figure B-3) is used further in this study
on the grounds of its extreme peak at
almost Cp = -3, large negative wake
pressures and larger pressure gradient.
The resultant pressure coefficient
distribution is shown by the blue curve
in Figure B-4 (Note that the net pressure
coefficients are portrayed – external
pressure and internal suction pressure;
hence the pink line value of 1.8 (unity
pressure plus 0.8 internal suction) at
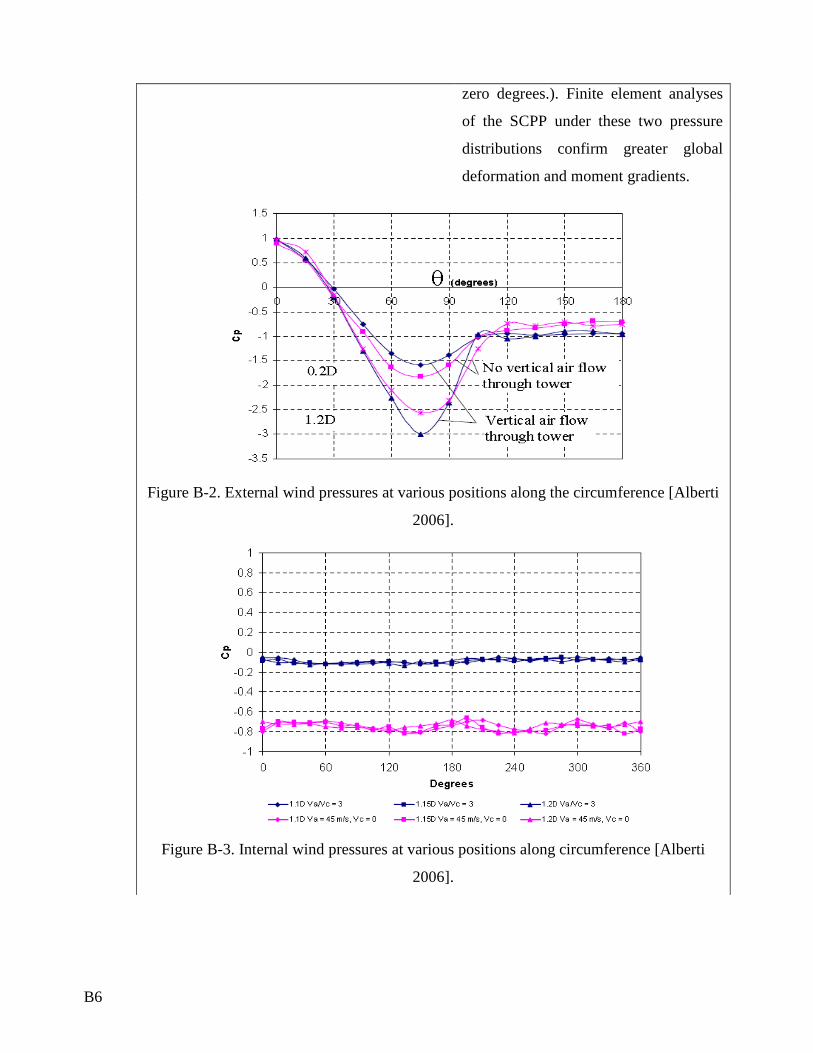
B6
zero degrees.). Finite element analyses
of the SCPP under these two pressure
distributions confirm greater global
deformation and moment gradients.
Figure B-2. External wind pressures at various positions along the circumference [Alberti
2006].
Figure B-3. Internal wind pressures at various positions along circumference [Alberti
2006].

B7
-3
-2.5
-2
-1.5
-1
-0.5
0
0.5
1
1.5
2
0 30 60 90 120 150 180
Position on circumference [degrees]
Net
pre
ssu
re c
oef
fici
ent,
Cp
vertical flow of 3m/s
no vertical flow
fit
Figure B-4. Net wind pressures at various positions along the circumference
References
Dyrbye, C. and Hansen, S.O. (1997), Wind loads on structures, John Wiley & Sons. Harris, R.I. and Deaves, D.M. (1978), The structure of strong winds, Wind engineering in the eighties:
proceedings of the CIRIA Conference on 12-13 November 1980.

B8

C1
APPENDIX C
STRUCTURAL PERFORMANCE
EVALUATION MODEL
Structural performance evaluation in this dissertation, being a radical innovation that only aims
to describe governing phenomena in order to formulate conceptual designs for means of evaluation,
is measured by buckling and quasi-static dynamic amplification factors. These factors are compared
to determine the impact of technological alternatives on the system performance.
C1 Buckling
C1.1 Analysis
Resistance of the SCPP chimney to global buckling serves as an indication of the impact
on structural performance. The German cooling tower design guide [VGB 2005] prescribes
the evaluation of buckling behaviour through a linear elastic buckling analysis under dead
load and peak external and internal wind load (G + We,max + Wi). Appendix A describes the
mathematical formulation of this analysis for the numerical, FEM procedure.
C1.2 Design limits and applicability thereof on the SCPP chimney
The German design guide prescribes the resulting first mode buckling factor to be larger
than 5 to allow for stress stiffnesses due to initial displacement. It accounts for nonlinear
geometrical and material effects, determined empirically for cooling tower structures. The
applicability of this factor to the SCPP chimney needs to be investigated in future.
Note that although resolution of this theoretical uncertainty does not improve the actual
structural performance of the chimney, it provides a structural performance requirement
metric against which structural performance of alternatives can be measured.
The wind load associated with the buckling analysis is formulated in Appendix B.

C2
C2 Quasi-static dynamic amplification factor
Appendix A reports the investigation into SCPP chimney frequency response. Only the first
global free vibration frequency and associated mode-shape need consideration during dynamic
analysis provided the second global natural vibration frequency is larger than 0.2 Hz. An
analytical dynamic response calculation that is applicable to structures where only the first global
vibration frequency is relevant, depicted from the Australian Wind Loading Code [AS1170-
2:1989], is used in order to determine a quasi-static loading factor, based on along and across
wind load factors.
C2.1 Excitation due to along wind frequency spectrum
The along wind load factor, known as the gust factor, is a simplified parameter
incorporating background and resonant response including simple structural geometry and
dynamic behaviour, dynamic wind characteristics and the aerodynamic admittance and
mechanical transmittance of wind to the structure. The background response is the slowly
varying component of the fluctuating response caused by lower frequency wind speed
variations while the resonant response accounts for the excitation of the natural frequency of
the structure. This load factor (Equation C2) is applied on the mean base overturning moment
caused by the quasi static mean wind action to determine the design peak base overturning
moment
aa MGM =ˆ (C1)
where aM = design peak base overturning moment
aM = mean base overturning moment resulting from the mean wind
condition
= dzAqC zzD∫ ; with (C2)
CD = drag coefficient for cross section, chosen in accordance with Figure
C-1
Az = area of a structure at height z
zq = defined in Appendix B, equation B13, based on a 2,000 year wind
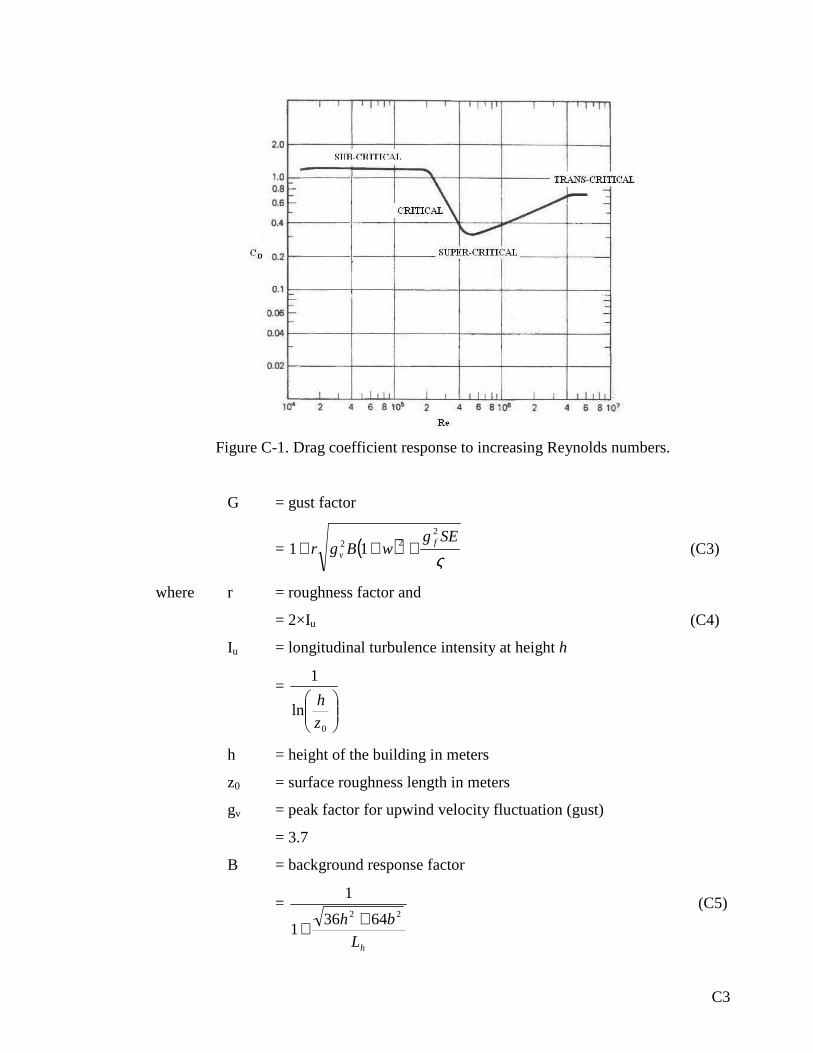
C3
Figure C-1. Drag coefficient response to increasing Reynolds numbers.
G = gust factor
= ( )ςSEg
wBgr fv
222 11 +++ (C3)
where r = roughness factor and
= 2×Iu (C4)
Iu = longitudinal turbulence intensity at height h
=
0
ln
1
z
h
h = height of the building in meters
z0 = surface roughness length in meters
gv = peak factor for upwind velocity fluctuation (gust)
= 3.7
B = background response factor
=
hL
bh 22 64361
1
++
(C5)
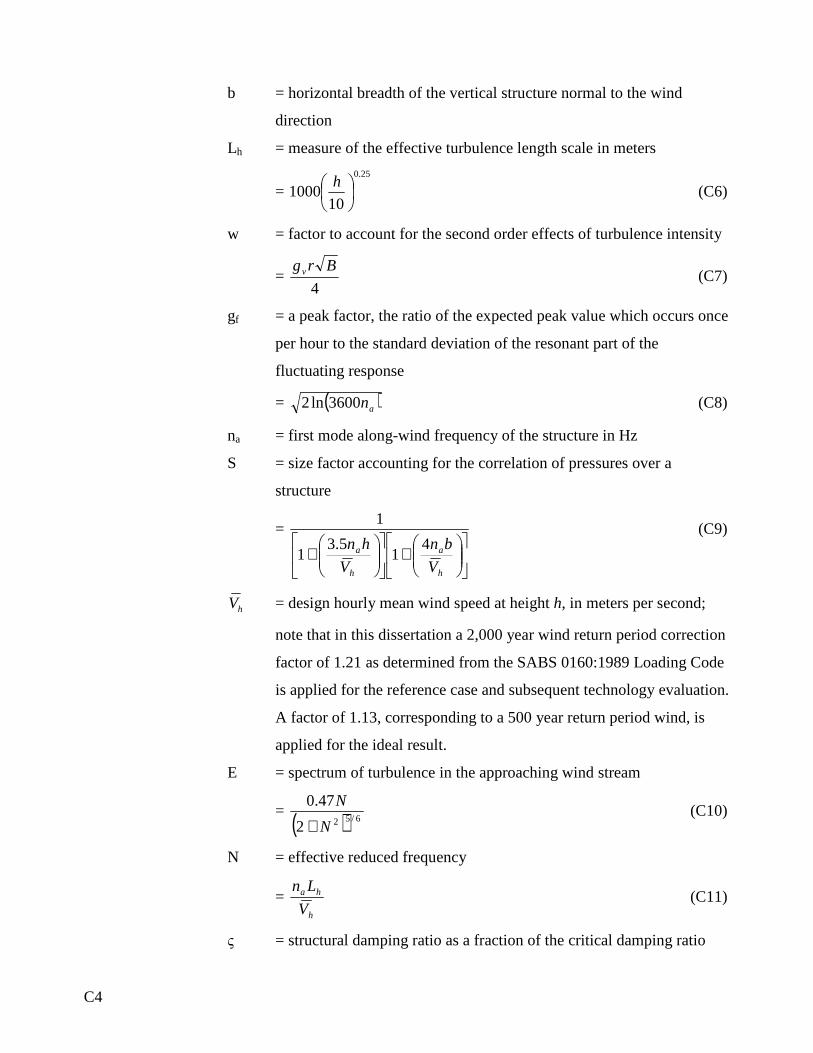
C4
b = horizontal breadth of the vertical structure normal to the wind
direction
Lh = measure of the effective turbulence length scale in meters
= 25.0
101000
h (C6)
w = factor to account for the second order effects of turbulence intensity
= 4
Brgv (C7)
gf = a peak factor, the ratio of the expected peak value which occurs once
per hour to the standard deviation of the resonant part of the
fluctuating response
= ( )an3600ln2 (C8)
na = first mode along-wind frequency of the structure in Hz
S = size factor accounting for the correlation of pressures over a
structure
=
+
+
h
a
h
a
V
bn
V
hn 41
5.31
1 (C9)
hV = design hourly mean wind speed at height h, in meters per second;
note that in this dissertation a 2,000 year wind return period correction
factor of 1.21 as determined from the SABS 0160:1989 Loading Code
is applied for the reference case and subsequent technology evaluation.
A factor of 1.13, corresponding to a 500 year return period wind, is
applied for the ideal result.
E = spectrum of turbulence in the approaching wind stream
= ( ) 6/522
47.0
N
N
+ (C10)
N = effective reduced frequency
= h
ha
V
Ln (C11)
ς = structural damping ratio as a fraction of the critical damping ratio
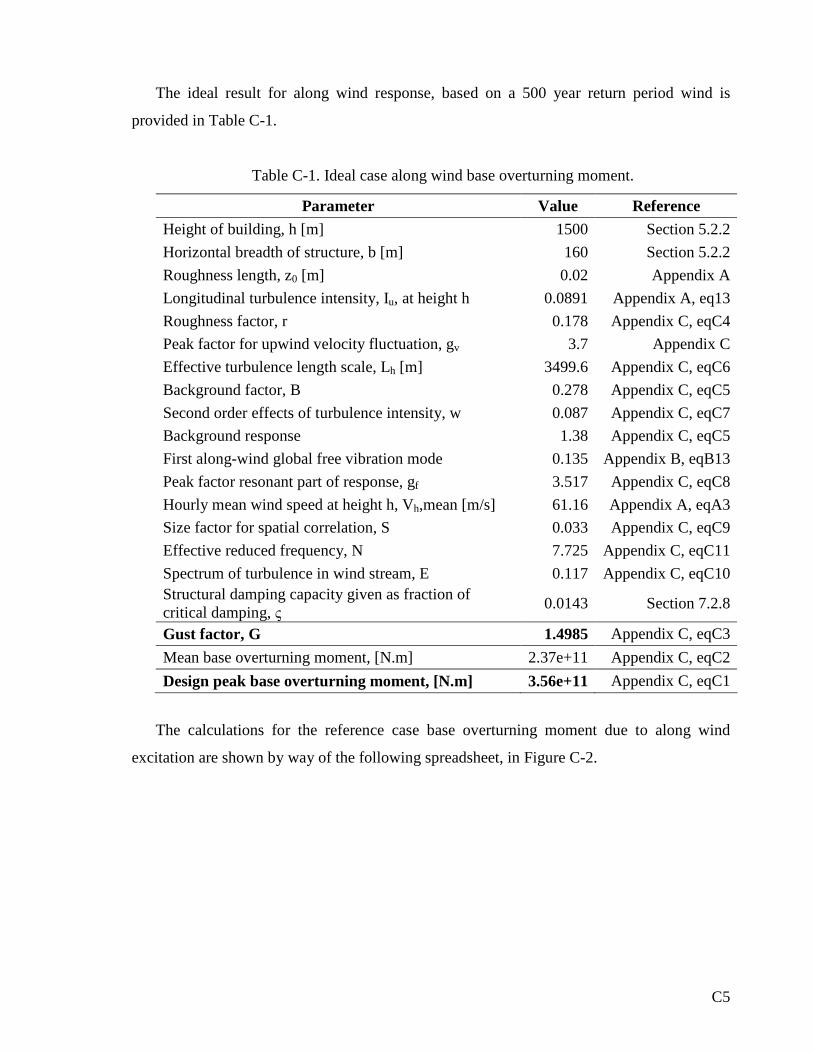
C5
The ideal result for along wind response, based on a 500 year return period wind is
provided in Table C-1.
Table C-1. Ideal case along wind base overturning moment.
Parameter Value Reference
Height of building, h [m] 1500 Section 5.2.2
Horizontal breadth of structure, b [m] 160 Section 5.2.2
Roughness length, z0 [m] 0.02 Appendix A
Longitudinal turbulence intensity, Iu, at height h 0.0891 Appendix A, eq13
Roughness factor, r 0.178 Appendix C, eqC4
Peak factor for upwind velocity fluctuation, gv 3.7 Appendix C
Effective turbulence length scale, Lh [m] 3499.6 Appendix C, eqC6
Background factor, B 0.278 Appendix C, eqC5
Second order effects of turbulence intensity, w 0.087 Appendix C, eqC7
Background response 1.38 Appendix C, eqC5
First along-wind global free vibration mode 0.135 Appendix B, eqB13
Peak factor resonant part of response, gf 3.517 Appendix C, eqC8
Hourly mean wind speed at height h, Vh,mean [m/s] 61.16 Appendix A, eqA3
Size factor for spatial correlation, S 0.033 Appendix C, eqC9
Effective reduced frequency, N 7.725 Appendix C, eqC11
Spectrum of turbulence in wind stream, E 0.117 Appendix C, eqC10 Structural damping capacity given as fraction of critical damping, ς
0.0143 Section 7.2.8
Gust factor, G 1.4985 Appendix C, eqC3
Mean base overturning moment, [N.m] 2.37e+11 Appendix C, eqC2
Design peak base overturning moment, [N.m] 3.56e+11 Appendix C, eqC1
The calculations for the reference case base overturning moment due to along wind
excitation are shown by way of the following spreadsheet, in Figure C-2.
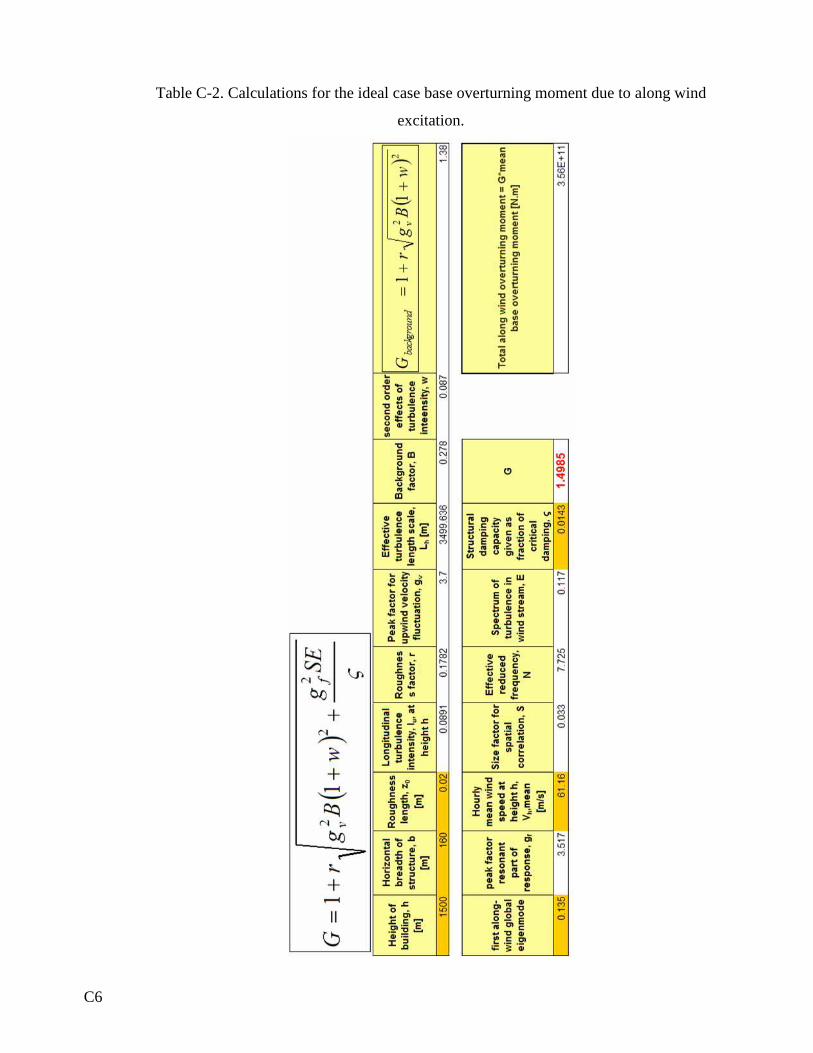
C6
Table C-2. Calculations for the ideal case base overturning moment due to along wind
excitation.
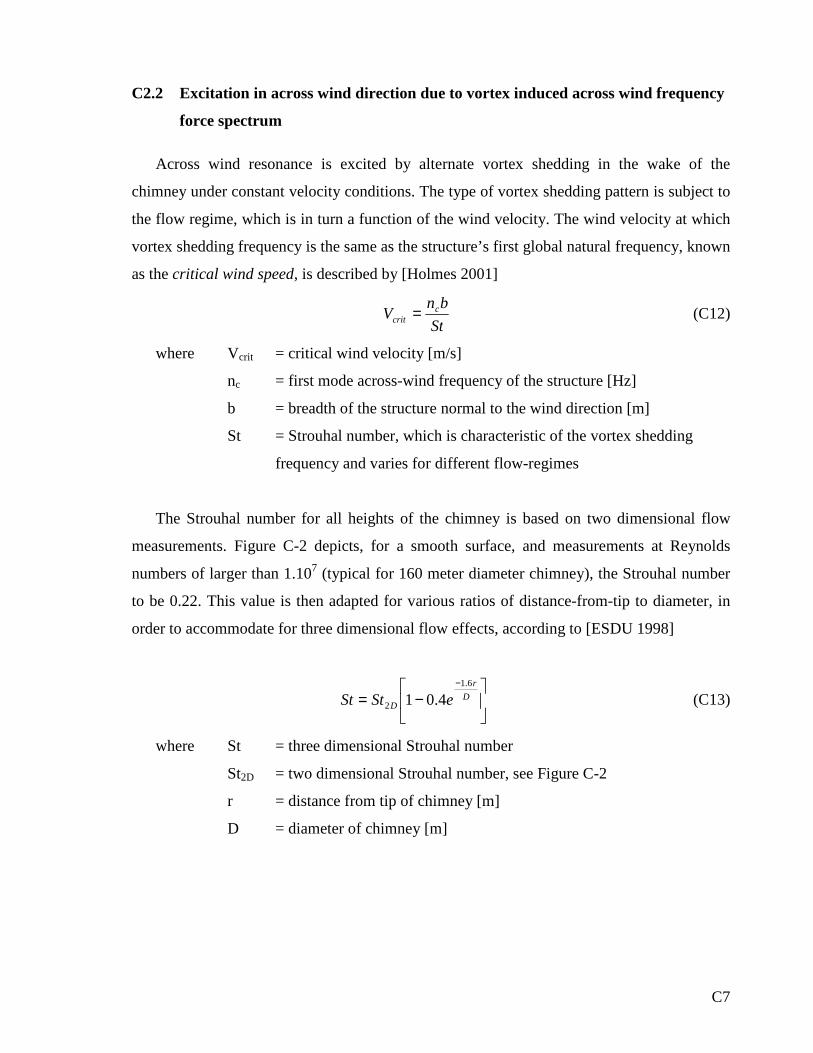
C7
C2.2 Excitation in across wind direction due to vortex induced across wind frequency
force spectrum
Across wind resonance is excited by alternate vortex shedding in the wake of the
chimney under constant velocity conditions. The type of vortex shedding pattern is subject to
the flow regime, which is in turn a function of the wind velocity. The wind velocity at which
vortex shedding frequency is the same as the structure’s first global natural frequency, known
as the critical wind speed, is described by [Holmes 2001]
St
bnV c
crit = (C12)
where Vcrit = critical wind velocity [m/s]
nc = first mode across-wind frequency of the structure [Hz]
b = breadth of the structure normal to the wind direction [m]
St = Strouhal number, which is characteristic of the vortex shedding
frequency and varies for different flow-regimes
The Strouhal number for all heights of the chimney is based on two dimensional flow
measurements. Figure C-2 depicts, for a smooth surface, and measurements at Reynolds
numbers of larger than 1.107 (typical for 160 meter diameter chimney), the Strouhal number
to be 0.22. This value is then adapted for various ratios of distance-from-tip to diameter, in
order to accommodate for three dimensional flow effects, according to [ESDU 1998]
−=
−D
r
D eStSt6.1
2 4.01 (C13)
where St = three dimensional Strouhal number
St2D = two dimensional Strouhal number, see Figure C-2
r = distance from tip of chimney [m]
D = diameter of chimney [m]

C8
Figure C-2. Strouhal number change with Reynolds number (two dimensional flow)
[ESDU 1998].
Results for a chimney diameter of 160 meter with the 2D Strouhal number equal to 0.22
are displayed in Figure C-3.
Lock-in behaviour occurs when the vortex shedding frequency is influenced by the
natural frequency free vibration of the structure. It is prevalent in structures of ‘relatively low
stiffness’ that has low damping ratios and operate ‘near’ the critical wind velocity [AS1170:2
1989]. The occurrence of lock-in is indicated with every technology alternative by a graph as
in Figure C-4 – the crossing of the two lines would indicate potential lock-in behaviour,
requiring further investigation.
0
0.2
0.4
0.6
0.8
1
1.2
0 1 2 3 4 5 6
r/D
St/S
2d
Figure C-3. Three dimensional Strouhal number changes with distance from chimney tip.

C9
0
200
400
600
800
1000
1200
1400
50 60 70 80 90 100 110 120Wind velocity [m/s]
Hei
gh
t [m
]
Wind velocity profile
Critical wind velocity with height
Figure C-4. Typical graph indicating proximity of actual wind velocities (blue line) to the
critical wind velocities (pink line). Note that the 2,000 year return period wind is used in
determining the actual velocity profile.
The design peak base overturning moment in the cross-wind direction generated by this
type of dynamic excitation is formulated by the AS1170-2:1989 as follows:
( )
−=
ςπ fs
hfc
CkbhqgM 06.006.15.0ˆ 2 (C14)
where cM = design peak base overturning moment in the cross-wind direction
gf = a peak factor
= ( )cn3600ln2 (C15)
hq = hourly mean dynamic wind pressure at height h [Pa]
= ½ρz2zU (C16)
ρz = air density at relevant height [kg/m3]

C10
zU = mean design wind velocity at height z [m/s] (described by equation
B3)
h = height of the structure [m]
k = a mode shape power exponent from representation of the
fundamental mode shape by khzz )/()( =ψ ; with k ≈ 2.3 for a tower
decreasing in stiffness with height [AS1170:2 1989]. A verifying
investigation finds this value to be closer to 2.4 – Figure C-5 presents
an exponential curve fit on the first global free vibration mode shape
(reference case). The eigen vector values along the height were chosen
on the zero degree position, i.e. the position facing the wind direction;
these are plotted against the height. The fitted exponential curve
reveals an exponent of 2.4 to fit the curve the best.
Cfs = cross-wind force spectrum coefficient due to vortex shedding,
generalised for a linear mode, as from Figure C-6, read off at reduced
velocity = Udesign hourly mean, h /(nc·b) (C17)
nc = fundamental mode frequency in cross wind direction [Hz]
b = width of structure [m]
ς = structural damping ratio as a fraction of the critical damping ratio
The ratio of cM : cM provides an quasi-static design factor on base overturning moment
providing for across wind resonance. (C15)

C11
0
200
400
600
800
1000
1200
1400
1600
0.0 0.2 0.4 0.6 0.8 1.0
Eigen value on height
Hei
gh
t [m
]
FEM results: normalised displacement Fit with exponent = 2.4
Figure C-5. Curve fit to SCPP chimney first global free vibration mode.
Currently, as Kijewski and Kareem [2001] points out the force spectrum (Figure C-6) is
determined from provided spectra for only a limited number of shapes and aspect ratios. As a
result, interpolation is used if the desired aspect ratio does not correspond to those provided;
the nearest shape must be selected to approximate the force spectrum coefficient if the
desired shape is not available. As wind tunnel tests on several buildings of varying dimension
have shown, the spectra can vary greatly, so the interpolation of a given spectrum adds some
uncertainty to the across wind estimate. The across wind force spectral amplitude is sensitive
to the level of turbulence in the approach flow and the building aspect ratio.

C12
Figure C-6. Cross wind force spectrum for square cross-section buildings [AS1170:2
1989].
An example of the calculations for the base overturning moment due to across wind
excitation is shown in Table C-3 and C-4.

C13
Table C-3. Calculated values for the across wind base overturning moment for cross
wind force investigation.
Parameter Value Reference Fundamental mode frequency in cross wind direction, nc [Hz]
0.094 Appendix B, eqB13
Peak factor, gf 3.411 Appendix C, eqC12
Width of structure, b [m] 160 Section 5.2.2
Height of structure, h [m] 1,720 Section 5.2.2
Hourly mean dynamic wind pressure [Pa] 2,033.66 Appendix C, eqC13
Mode shape power exponent, k 2.4 Appendix C2
Hourly mean wind speed, Udesign hourly mean, h [m/s] 66.65 Appendix A, eqA3
Ratio Udesign hourly mean, h /(nc·b) 4.46 Appendix C, eqC14
Cross wind force spectrum coefficient, Cfs 0.001 Appendix C2 Structural damping capacity given as fraction of critical damping, ς
0.0143 Appendix C2
Design across peak base overturning moment [N.m]
7.05e+11 Appendix C, eqC11
Across resonance peak factor on base overturning moment
1.9483 Appendix C, eqC15

C14
Table C-4. Calculations for the across wind base overturning moment for cross wind
force spectrum model.
References
ESDU (Engineering Science Data Unit) (1998), Response of structures to vortex shedding – structures of circular or polygonal cross section, HIS Standards Store.

D1
APPENDIX D
SCPP CHIMNEY COST MODEL
D1 Chimney costs
D1.1 Unit costs
The cost of the chimney is a function of the volume of material used, the specific material
cost, the construction cost and transport cost. The chimney is constructed of thin shell
reinforced high performance concrete.
For the purpose of the reference evaluation the cost structures in Tables D1 are used –
these are based on construction costs of tall reinforced concrete chimneys, obtained from a
well-known South African civil contractor [Grinaker-LTA 2005]. A volume based approach
is used, i.e. materials are assigned physical, labour, plant and logistical cost per volume. For
the chimney shell and fin stiffeners (referred to as “high level construction”), a high
performance concrete cost of R1,000/m3 is used. Low elevation construction (foundations)
uses normal performance concrete at R800/m3 and shows a decrease in labour and logistical
cost. Structural steel construction at high elevation, for example the circumferential stiffener
placement, is also portrayed in Table D-1. Labour and logistical costs associated with high
elevation construction are significantly higher than for low elevation construction.
The detailed nature of this model lends itself to easy navigation into and investigation of
how conceptual or parametrical (technology) changes in the system influences overall
chimney system cost.
D1.2 Reference case chimney cost
A chimney of 1,500 meter height and 160 meter diameter is investigated with geometry
as specified in the Chapter 5 reference case (section 5.2.2). Each circumferential stiffener
consists of 72 flat structural steel beams, each of 0.63 × 0.06 meter cross-section, spanning
the radius from a stiff outer ring of the same cross section at the chimney perimeter to a
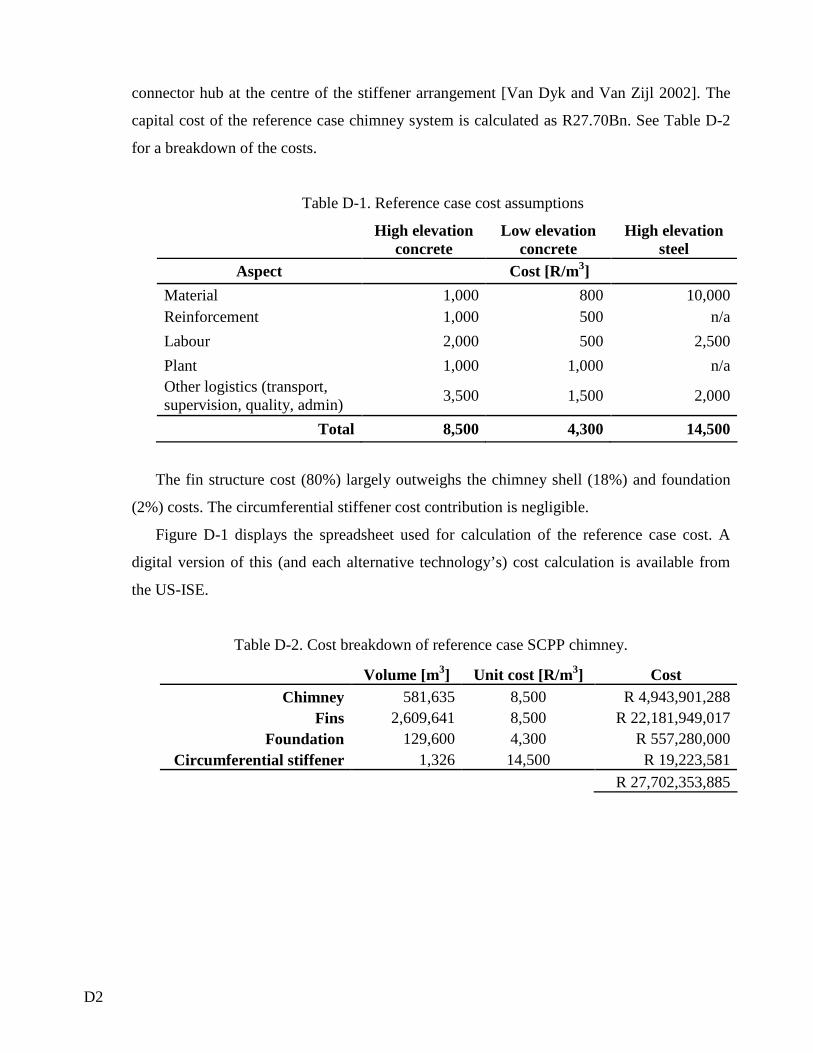
D2
connector hub at the centre of the stiffener arrangement [Van Dyk and Van Zijl 2002]. The
capital cost of the reference case chimney system is calculated as R27.70Bn. See Table D-2
for a breakdown of the costs.
Table D-1. Reference case cost assumptions
High elevation concrete
Low elevation concrete
High elevation steel
Aspect Cost [R/m3]
Material 1,000 800 10,000 Reinforcement 1,000 500 n/a
Labour 2,000 500 2,500
Plant 1,000 1,000 n/a Other logistics (transport, supervision, quality, admin)
3,500 1,500 2,000
Total 8,500 4,300 14,500
The fin structure cost (80%) largely outweighs the chimney shell (18%) and foundation
(2%) costs. The circumferential stiffener cost contribution is negligible.
Figure D-1 displays the spreadsheet used for calculation of the reference case cost. A
digital version of this (and each alternative technology’s) cost calculation is available from
the US-ISE.
Table D-2. Cost breakdown of reference case SCPP chimney.
Volume [m3] Unit cost [R/m3] Cost Chimney 581,635 8,500 R 4,943,901,288
Fins 2,609,641 8,500 R 22,181,949,017 Foundation 129,600 4,300 R 557,280,000
Circumferential stiffener 1,326 14,500 R 19,223,581
R 27,702,353,885

D3
Figure D-1. Sheet used to calculate the chimney costs.
D4
D2 Collector costs
A plastic-based collector is chosen on the basis of lower construction costs. Note that the
thermal properties of plastic are presumably less favourable for heat loss and storage than glass
with a negative impact on the plant energy generation capacity. These losses are, for the purpose
of this thesis, assumed to be negligible, i.e. it is assumed that the plastic thermal and durability
performance is on par with that of glass.
The main assumptions for the collector cost model presented in this paper are:
• The transparent material comprises a durable plastic membrane, priced at R10/m2
• The roof supporting truss system costs R20/m2.
• The roof supporting truss system contains load absorption measures sufficient to
circumvent all wind and temperature related action.
• The airflow drag due to column cross-section is negligible, therefore the cheapest column
cross-section is chosen, not concerning aerodynamic shape. The sections are
approximated as IPE120AA sections, used throughout the collector. It is assumed that
these sections can be sufficiently braced against buckling. Their cost is assumed at
R100/m.
• The cost of the column foundations is assumed to be the same as for the chimney “low
elevation concrete” in Table D-1.
• The transport cost is assumed to be 5% of the material cost.
• The labour and plant costs are estimated to be 100% of the collector material cost.
The collector consists of a transparent roof elevated by a support structure. The roof extends
from the outer perimeter of the collector to a radius of 200 meter from the centre of the chimney.
It has an outer diameter of 6,900 meter. The support structure consists of steel columns
supporting a truss-work system from which the plastic is suspended. The collector has an inlet
height of 3 meters and rises exponentially (exponent = 0.827) to a height of 32 meters at 200
meter radius. A volume of 0.192 m3 concrete is required per column foundation.
Table D-3 reports the cost breakdown of the SCPP collector. A total cost of R2.53Bn is
calculated.

D5
Table D-3. Cost breakdown of the SCPP collector.
Part Cost
Column cost R 84,798,377
Truss cost R 767,176,926
Glass cost R 383,588,463
Column foundation R 151,255,673
Circumferential stiffener cost negl.
Collector material cost R 1,235,563,766
Transport R 61 778 188
Labour R 1 235 563 766
Total collector cost R 2 532 905 720
D3 System cost summary and electricity cost
The cost of the power conversion unit (turbines, generators, flow ducts, structure, etc.) is
estimated at R1.20Bn. The total cost of the system is R31.44Bn of which the chimney system
contributes 88%. Radical reduction in chimney cost can therefore greatly improve the financial
feasibility of the SCPP. The total costs are summarised in Table D-4.
Table D-4. Summary of costs of the SCPP reference case.
Part Cost [RBn]
Chimney system 27.70
Collector cost 2.53
Power conversion unit cost
1.20
Total investment cost 31.44
The LEC (levelised electricity cost) is calculated using the cost model presented in a paper
by Fluri et al. [2006]. The operating and maintenance cost is assumed at R38Mn annually. This
operating and maintenance cost is double the (equivalent) R19Mn annually reported by Schlaich,
which is based on a 100 MW SCPP plant (half the reference case output) [Schlaich et al. 2004b].

D6
The present equivalent value of these costs over the lifetime of the plant is found with Equation
D1.
350,938,469,1108.01
06.01
08.006.0
000,000,381
1
180
1 Ri
f
if
AP
N
=
−
++
−=
−
++
−= (D1)
where A1 is the cash flow at the end of the first year, f is the inflation rate, i is the interest rate
and N is the lifetime in years. This equivalent annual cost is calculated using a depreciation
period of 80 years, an interest rate of 8.0% and an inflation ratei of 6.0%. The lifetime operating
and maintenance cost is added to the capital cost to determine the total present value over the
lifetime of the project. An equivalent annual cost over the project lifetime can be calculated
according to Equation D2.
( )( )
( ) ( )( )
366,005,638,2108.01
08.0108.0350,938,469,1605,259,435,31
11
180
80
Ri
iiPA
N
N
=
−+++=
−++= (D2)
The levelised electricity cost (LEC) is ascertained by dividing the equivalent annual cost by
the annual power output (305.04 GWh, generated by the 200 MW SCPP plant [Bernardes 2008 –
refer to Appendix E for more detail]) as shown in Equation D3.
kWhRLEC /65.8000,040,305
366,005,638,2 == (D3)
Note that the LEC is very sensitive to economic variables like interest and inflation. An
interest rate decreased to 6.0% yields an LEC of R6.81/kWh. The cost model is summarised in
Table D-5.
i The inflation rate chosen is used in the publication by Fluri et al. [2006].
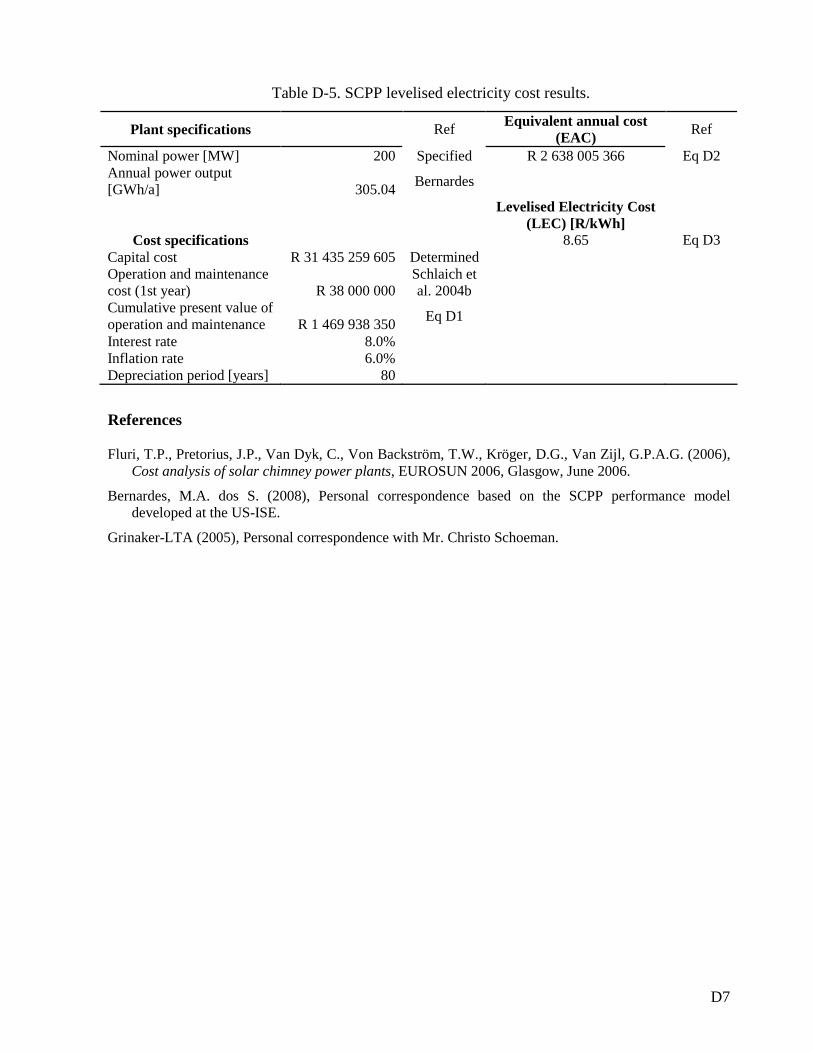
D7
Table D-5. SCPP levelised electricity cost results.
Plant specifications Ref Equivalent annual cost (EAC)
Ref
Nominal power [MW] 200 Specified R 2 638 005 366 Eq D2 Annual power output [GWh/a] 305.04
Bernardes
Levelised Electricity Cost
(LEC) [R/kWh]
Cost specifications 8.65 Eq D3 Capital cost R 31 435 259 605 Determined Operation and maintenance cost (1st year) R 38 000 000
Schlaich et al. 2004b
Cumulative present value of operation and maintenance R 1 469 938 350
Eq D1
Interest rate 8.0% Inflation rate 6.0% Depreciation period [years] 80
References
Fluri, T.P., Pretorius, J.P., Van Dyk, C., Von Backström, T.W., Kröger, D.G., Van Zijl, G.P.A.G. (2006), Cost analysis of solar chimney power plants, EUROSUN 2006, Glasgow, June 2006.
Bernardes, M.A. dos S. (2008), Personal correspondence based on the SCPP performance model developed at the US-ISE.
Grinaker-LTA (2005), Personal correspondence with Mr. Christo Schoeman.

D8

E1
APPENDIX E
SCPP SYSTEM ENERGY YIELD
E1 Introduction on energy yield simulation model
A simulation program [Bernardes 2008] is used to solve the thermo-flow field in the collector
and chimney of the SCPP. The relevant equations for conservation of mass, momentum and
energy are solved simultaneously using finite difference methods. Meteorological data (ambient
air temperature, humidity, solar irradiation and wind speed) from Sishen, South Africa, is used as
input to the simulation. Factors such as the position of the sun throughout the year at the
particular global location, shadow cast by the chimney and all frictional, inlet, outlet, support and
heat losses are also taken into account. At the time of writing this dissertation, the Bernardes
simulation model [2008] was unpublished. However, it is based on the simulation model by
Pretorius and Kröger [2006]. The detail of the Bernardes model falls outside the scope of this
dissertation. The thermo-flow and geometrical parameters used in the SCPP reference case
energy yield simulation in this study are summarised in Table E-1.
Table E-1. Thermo-flow and geometrical parameters for SCPP reference case simulation.
Parameters Value Unit
Computational parameters
Volumes 30 [ - ] Time interval 3600 [s]
Collector
Roof shape exponent 1.0 [ - ] Perimeter (inlet) height 5.0 [m] Emissivity of roof 0.87 [ - ] Emissivity of absorber 0.90 [ - ] Extinction coefficient of roof 4 [1/m] Refractive index of roof 1.526 [ - ] Thickness of roof 0.004 [ - ]
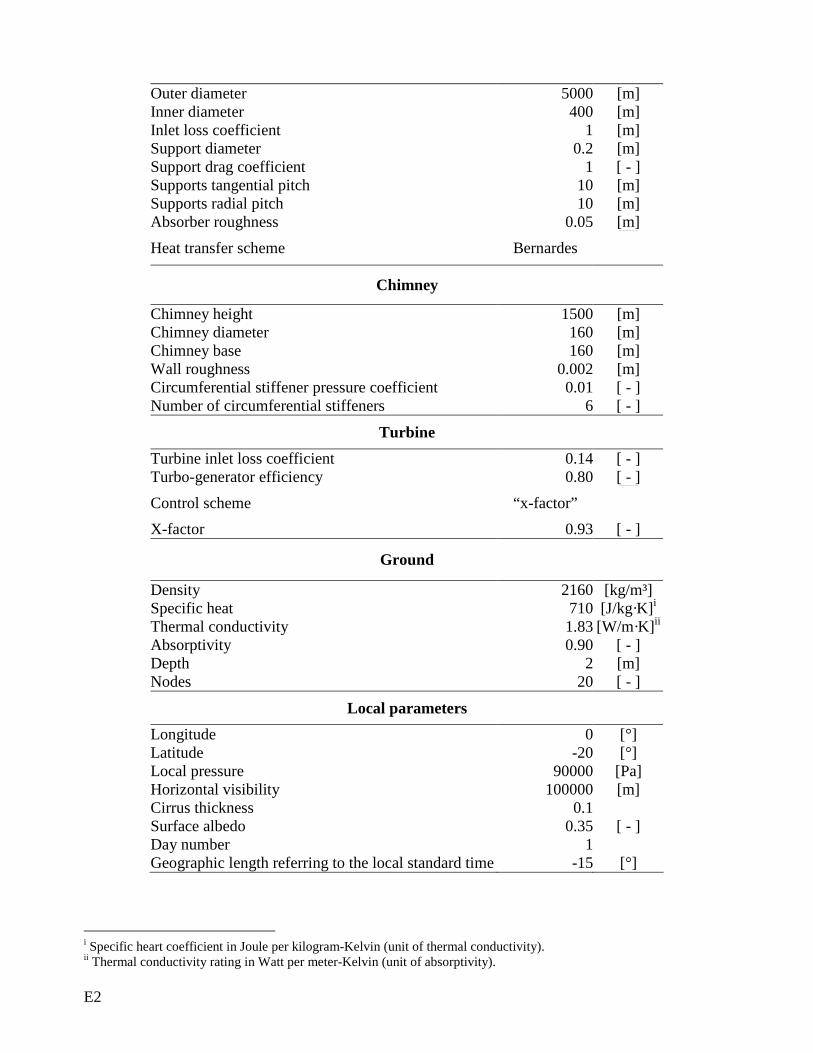
E2
Outer diameter 5000 [m] Inner diameter 400 [m] Inlet loss coefficient 1 [m] Support diameter 0.2 [m] Support drag coefficient 1 [ - ] Supports tangential pitch 10 [m] Supports radial pitch 10 [m] Absorber roughness 0.05 [m]
Heat transfer scheme Bernardes
Chimney
Chimney height 1500 [m] Chimney diameter 160 [m] Chimney base 160 [m] Wall roughness 0.002 [m] Circumferential stiffener pressure coefficient 0.01[ - ] Number of circumferential stiffeners 6 [ - ]
Turbine
Turbine inlet loss coefficient 0.14 [ - ] Turbo-generator efficiency 0.80 [ - ]
Control scheme “x-factor”
X-factor 0.93 [ - ]
Ground
Density 2160 [kg/m³] Specific heat 710 [J/kg·K]i Thermal conductivity 1.83 [W/m·K]ii Absorptivity 0.90 [ - ] Depth 2 [m] Nodes 20 [ - ]
Local parameters
Longitude 0 [°] Latitude -20 [°] Local pressure 90000 [Pa] Horizontal visibility 100000 [m] Cirrus thickness 0.1 Surface albedo 0.35 [ - ] Day number 1 Geographic length referring to the local standard time -15 [°]
i Specific heart coefficient in Joule per kilogram-Kelvin (unit of thermal conductivity). ii Thermal conductivity rating in Watt per meter-Kelvin (unit of absorptivity).

E3
For the SCPP reference case geometry the annual yield is simulated and calculated at 305.04
GWh/y. Subsequent energy yield simulations determined the impact of most of the
technologically augmented alternatives; some of which could not be incorporated due to resource
constraints.
References
Pretorius, J.P. and Kröger (2006), Solar chimney power plant performance, ASME, Vol. 128, August 2006
Bernardes, M.A. dos S. (2008), Personal correspondence based on the SCPP performance model developed at the US-ISE.

E4
F1
APPENDIX F
UPPER BOUNDARY LAYER WIND
DATA FROM THE SOUTH AFRICAN
WEATHER BUREAU
Upper boundary layer wind data was acquired from the South African Weather Bureau for the
Upington (near Sishen) and De Aar (south eastern tip of the Northern Cape) weather stations
[WeatherSA 2007]. Weather balloons are released and wind velocity measured and sent back to the
ground station every ten seconds. This data is recorded in digital format. The data was plotted –
geopotential metersi against velocity, as is displayed in Figure F-1 – and revealed velocity
fluctuation “spikes” indicating linear increase and decrease of velocities instead of an anticipated
non-linear fluctuation. This fact was pointed out to the Weather Bureau which they referred to their
technical staff. The data discredit issue could not be resolved within the allocated resources and was
set aside until more credible substantiation of the directional variation is found.
References
WeatherSA (2007), Personal correspondence with Mrs. Tracey Gill.
i Geopotential height is an adjustment to geometric height (elevation above mean sea level) using the variation of gravity with latitude and elevation.

F2
Figure F-1. Graph depicting wind velocity measurements over various heights at Upington for 2004
and after.

G1
APPENDIX G
CALCULATIONS FOR
EVALUATION OF SCPP CHIMNEY
SYSTEM PERFORMANCE
G1 Introduction
In the evaluation phase of the RIM, the reference case and, subsequently, all identified
alternatives are evaluated in terms of specified criteria. Each technology augmentation of the SCPP
chimney on the system, as identified in section 7.2, is evaluated here. This Appendix provides the
results of the various improvements on the system performance. For each alternative the energy
yield, capital cost, their incorporation into a levelised electricity cost and the structural performance
(critical buckling factor and quasi-static structural response factor) is reported. The calculations for
the reference case results are shown in the following sections:
• The capital cost calculations for the reference case SCPP are reported in Appendix D1
(chimney) and D2 (collector and power conversion unit).
• Levelised electricity cost calculations for the reference case are calculated and reported in
Appendix D3.
• Buckling analysis procedures are reported in Appendix A and are calculated for each
alternative using FEM.
• Base overturning moment due to along and across wind excitation is calculated for the ideal
case and the increased chimney height model, and reported in Appendix C.
G2 Calculations and results for alternatives
G2.1 Reference model

G2
Energy yield
The simulation program reported in Appendix F calculates an annual energy yield of
305.04 GWh/y. Note that this program is used for all the energy yield calculations.
Capital cost
A detailed cost model with all its assumptions was set up and reported in Appendix
D. The capital cost of the reference case chimney system is calculated as R27.70Bn. See
Table D-2 for a breakdown of the costs.
A levelised electricity cost (LEC) of R8.648/kWh is calculated for the SCPP system.
Structural performance
The load case incorporating gravity load, peak gust wind load and internal pressure
load is applied in a linear elastic buckling analysis yielding a first global buckling value
of λ1 = 1.63. Figure G-1 depicts the nature of this buckling mode: global shell buckling.
Figure G-1. SCPP chimney reference case first buckling mode.

G3
A free vibration analysis is performed. The first global free vibration frequency
calculated is f1,global = 0.135 Hz (Appendix A, equation A3). No second global free
vibration modes are present in the spectrum below 0.2 Hz. Some more localised
ovallising modes are present at f1,local = 0.129 and f2,local = 0.224 Hz and are depicted in
Figure G-2. There is therefore no danger of a second resonant response peak – the
simplified dynamic gust peak method may be used.
a) b) c)
Figure G-2. Free vibration modes of the SCPP chimney: a) first global mode; b) first and
c) second local modes.
The calculations for the along wind gust factor, G, follow. Relevant values for the
reference case are presented in Table G-1. All the parameter and equation references are
provided in the column on the right.
The across wind moment calculation is not necessary because the critical wind
velocities are far outside any point on the wind velocities profile – see Figure G-3 – and,
hence, are not a threat to structural integrity (refer to Appendix C, equation C12). This
appendix further only provides the figure depicting the proximity of the wind velocity
profile to the critical wind velocity profile when it is of interest.

G4
Table G-1. Reference case along wind base overturning moment.
Parameter Value Reference
Height of building, h [m] 1,500 Section 5.2.2
Horizontal width of structure, b [m] 160 Section 5.2.2
Roughness length, z0 [m] 0.02 Appendix A
Longitudinal turbulence intensity, Iu, at height h 0.0891 Appendix A, eq13
Roughness factor, r 0.178 Appendix C, eqC4
Peak factor for upwind velocity fluctuation, gv 3.7 Appendix C
Effective turbulence length scale, Lh [m] 3,499.6 Appendix C, eqC6
Background factor, B 0.278 Appendix C, eqC5
Second order effects of turbulence intensity, w 0.087 Appendix C, eqC7
Background response 1.38 Appendix C, eqC5
First along-wind global free vibration mode 0.135 Appendix B, eqB13
Peak factor resonant part of response, gf 3.517 Appendix C, eqC8
Hourly mean wind speed at height h, Vh,mean [m/s] 65.03 Appendix A, eqA3
Size factor for spatial correlation, S 0.036 Appendix C, eqC9
Effective reduced frequency, N 7.265 Appendix C, eqC11
Spectrum of turbulence in wind stream, E 0.121 Appendix C, eqC10 Structural damping capacity given as fraction of critical damping, ς
0.0143 Section 7.2.8
Gust factor, G 1.5129 Appendix C, eqC3
Mean base overturning moment [N.m] 2.69e+11 Appendix C, eqC2
Design peak base overturning moment [N.m] 4.07e+11 Appendix C, eqC1
0
200
400
600
800
1000
1200
1400
50 60 70 80 90 100 110 120
Wind velocity [m/s]
Hei
gh
t [m
]
Wind velocity profile
Critical wind velocity with height
Figure G-3. Proximity of wind velocity profile to critical velocities – reference case.

G5
G2.2 Wind velocity extrapolation model
The energy yield and capital cost remain unchanged by this theoretical investigation.
Structural performance
The buckling analysis yields a first global buckling value of λ1 = 2.69. The decrease
in buckling factor is due to the decrease in wind load. Buckling remains localised to the
upper regions of the shell. The free vibrations are the same as for the reference case.
Lock-in behaviour is not a threat to structural integrity. The calculated values for the
along wind gust factor, G, follows in Table G-2:
Table G-2. Calculated values for the along wind base overturning moment of the wind
velocity extrapolation model.
Parameter Value
Height of building, h [m] 1,500
Horizontal width of structure, b [m] 160
Roughness length, z0 [m] 0.02
Longitudinal turbulence intensity, Iu, at height h 0.0891
Roughness factor, r 0.1782
Peak factor for upwind velocity fluctuation, gv 3.7
Effective turbulence length scale, Lh [m] 3,499.6
Background factor, B 0.278
Second order effects of turbulence intensity, w 0.087
Background response 1.38
First along-wind global free vibration mode 0.135
Peak factor resonant part of response, gf 3.517
Hourly mean wind speed at height h, Vh,mean [m/s] 51.20
Size factor for spatial correlation, S 0.025
Effective reduced frequency, N 9.228
Spectrum of turbulence in wind stream, E 0.105
Structural damping capacity given as fraction of critical damping, ς 0.0143
Gust factor, G 1.4635
Mean base overturning moment [N.m] 1.65e+11
Design peak base overturning moment [N.m] 2.42e+11

G6
G2.3 Wind direction variations over chimney height
Not investigated further due to resource constraints and inadequate data (see Appendix F)
for wind velocity and directional change with height increase.
G2.4 Applicability of prescribed critical buckling factor to the SCPP chimney
Not investigated further due to resource constraints.
G2.5 Cross wind force spectrum
The energy yield and capital cost remain unchanged.
Structural performance
The across wind moment is only applicable to across wind excitation. Assuming that
the across wind response is significant, a decrease in the cross wind force spectral value
has positive implications on the structural response. Table G-3 depicts the potential
impact on the previous case where the chimney height was increased to 1,720 meter (note
that adverse across wind frequency response is not excited in the reference case; hence
the focus here on the 1,720 meter tall chimney). The spectral value corresponding to the
normalised velocity of 4.32 is assumed to be half (this is an arbitrary choice merely to
determine system sensitivity to this parameter) (refer to section G1.20 – it was 0.002 and
is reduced to 0.001) of what it is for the 1,720 meter chimney:
A decrease of 50% from a cross wind base overturning moment of 9.96e+11 N.m to
6.64e+11 N.m is brought about.
G2.6 Flaring chimney exit geometry
Energy yield
The increased chimney height concept yields 313.881 GWh/y, an increase of 2.90%
on the reference system.

G7
Table G-3. Calculated values for the across wind base overturning moment for cross wind
force investigation.
Parameter Value Fundamental mode frequency in cross wind direction, nc [Hz]
0.094
Peak factor, gf 3.411
Width of structure, b [m] 160
Height of structure, h [m] 1,720
Hourly mean dynamic wind pressure [Pa] 2,033.66
Mode shape power exponent, k 2.4
Hourly mean wind speed, Udesign hourly mean, h [m/s] 66.65
Ratio Udesign hourly mean, h /(nc·b) 4.46
Cross wind force spectrum coefficient, Cfs 0.001 Structural damping capacity given as fraction of critical damping, ς
0.0143
Design across peak base overturning moment [N.m]
7.05e+11
Across resonance peak factor on base overturning moment
1.9483
Capital cost
The cost model configuration is intuitively adapted only for the flaring volume:
R250/m3 is added to the reinforcement quantity in order to resist tensile stresses caused
by the flaring geometry. Labour costs are increased by R1,000/m3 and supervision cost
by R1,500/m3. The cost of the flaring chimney increases with 0.25% from the reference
case value, from R 27.70Bn to R27.77Bn. Costs are reported in Table G-4.
A LEC of R8.422/kWh is calculated.
Table G-4. Cost breakdown of flaring SCPP chimney.
Volume [m3] Unit cost [R/m3] Cost
Chimney 615,661 8,500 (11,250 for
flaring) R 5,012,117,183 Fins 2 609,641 8,500 R 22,181,949,017
Foundation 162,000 4,600 R 557,280,000 Circumferential
stiffeners 1,657 14,500 R 20,229,420
R 27,771,575,619

G8
Structural performance
The buckling modes are significantly lower than for the reference case. The first
global buckling value is λ1 = 0.68. The first modes portray more localised shell buckling
in the flaring part of the shell showing that the flaring geometry is vulnerable to buckling
behaviour.
The free vibration analysis yields the first global free vibration frequency of f1,global =
0.132 Hz. No second global free vibration modes are present in the smaller than 0.2 Hz
spectrum. Some more localised ovallising modes are present at f1,local = 0.124, f2,local =
0.191 and f3,local = 0.228 Hz. The slenderness resulted in a lower global free vibration
frequency.
The flaring geometrical change is located in the chimney base. For this study it is
assumed that the dynamic gust peak method may be used but future investigations should
adapt the method for this geometry.
The calculations for the along wind gust factor, G, follows in Table G-5.
G2.7 Chimney inner surface friction
Not investigated further due to insignificant contribution of smoother surface (less
friction) on the energy yield (refer to section 7.1.6).
G2.8 Circumferential stiffener concept
Energy yield
The various concepts have varying impact on the energy yield. An indication is
provided in section 7.2.7 with a description of the impact of circumferential stiffener
shape on the energy losses. The influence of varying concepts on the energy yield can be
described on demand to determine its deviation from the reference circumferential
stiffener pressure loss coefficient of 0.01 (see Appendix E).
In the case where the 36 beam circumferential stiffeners are deployed, the
circumferential stiffener pressure coefficient is assumed (arbitrary choice in order to
determine the sensitivity of the system to less stiffeners) to be half of that of the reference
case, at 0.005. The subsequent energy yield increases the reference value by 0.16% to
305.54 GWh/y. The across wind excitation does not pose a threat to structural integrity –
Figure G-4.

G9
Table G-5. Calculated values for the along wind base overturning moment of the
flaring geometry model.
Parameter Value
Height of building, h [m] 1,500
Horizontal width of structure, b [m] 160
Roughness length, z0 [m] 0.02
Longitudinal turbulence intensity, Iu, at height h 0.0891
Roughness factor, r 0.1782
Peak factor for upwind velocity fluctuation, gv 3.7
Effective turbulence length scale, Lh [m] 3,499.64
Background factor, B 0.278
Second order effects of turbulence intensity, w 0.087
Background response 1.38
First along-wind global free vibration mode 0.132
Peak factor resonant part of response, gf 3.511
Hourly mean wind speed at height h, Vh,mean [m/s] 65.03
Size factor for spatial correlation, S 0.037
Effective reduced frequency, N 7.104
Spectrum of turbulence in wind stream, E 0.123
Structural damping capacity given as fraction of critical damping, ς 0.0143
Gust factor, G 1.5181
Mean base overturning moment [N.m] 2.63e+11
Design peak base overturning moment [N.m] 4.00e+11
Capital cost
The cost component of the reference case circumferential stiffeners is small, at
0.069% (circumferential stiffener cost divided by total chimney system cost – refer to
Table G-1). From a cost perspective the prospect of implementing circumferential
stiffeners is attractive. An optimisation between cost and concept and number of
circumferential stiffeners, and its impact on energy yield and structural performance
should be performed at a pre-feasibility phase.
For the geometry approximation the cost model follows in Table G-6. A LEC of
R8.631/kWh is calculated.

G10
0
200
400
600
800
1000
1200
1400
1600
50 60 70 80 90 100 110 120 130 140
Wind velocity [m/s]
Hei
gh
t [m
]
wind velocity profile
critical wind velocity profile
Figure G-4. Proximity of wind velocity profile to critical velocities – flaring chimney.
Table G-6. Cost breakdown of circumferential stiffener concept model.
Volume [m3] Unit cost [R/m3] Cost Chimney 581,635 8,500 R 4,943,901,288 Fins 2,609,641 8,500 R 22,181,949,017 Foundation 129,600 4,600 R 557,280,000 Circumferential stiffeners 1,326 14,500 R 9,752,413
R 27,692,882,717
Structural performance
Buckling factors are lower than for the reference case, with the first global buckling
value of λ1 = 1.18 emphasising the great impact the circumferential stiffeners have to
mitigate buckling modes.
The first global free vibration frequency remains at f1,global = 0.135 Hz. No second
global free vibration modes are present in the smaller than 0.2 Hz spectrum. The localised
ovallising modes, however, are present at much lower frequencies: f1,local = 0.075, f2,local =
0.116, f3,local = 0.175 and f4,local = 0.2 Hz.
The dynamic response is the same as for the reference case.

G11
G2.9 Material elasticity modulus
The impact of higher concrete elasticity modulus (60 GPa) on the chimney performance
is investigated.
The energy yield remains unchanged.
Capital cost
Quantitative data on the increase in costs due to an increase in concrete elasticity
modulus was not available. A value is estimated in order to direct the attention of the
decision maker to the presumably high costs incurred with this technology. The reference
concrete material cost is increased by four times to a value of R4,000/m3. The basis of
these estimations is unpublished values for increased costs of higher strength concretes
(as used in the structural laboratories of the US-ISE); costs of these high-strength
concretes typically increase by four times). Labour and plant costs are increased by 50%.
The consequential cost model is presented below. The cost results are portrayed in Table
G-7. A LEC of R9.183/kWh is calculated.
Table G-7. Material elasticity modulus model cost breakdown.
Volume [m3] Unit cost [R/m3] Cost Chimney 581,635 12,000 R 6,979,625,348
Fins 2,609,641 8,500 R 22,181,949,017 Foundation 129,600 4,600 R 596,160,000
Circumferential stiffeners 1,326 14,500 R 19,223,581
R 29,738,077,945
Structural performance
The buckling analysis yields a first global buckling value of λ1 = 3.26 that is
significantly closer to that of the reference case. It remains localised to the upper regions
of the shell.
The free vibration analysis yields the first global free vibration frequency of f1,global =
0.187 Hz. No second global free vibration modes are present in the smaller than 0.2 Hz
spectrum. Some more localised ovallising modes are present at f1,local = 0.183 and f2,local =
0.317 Hz.
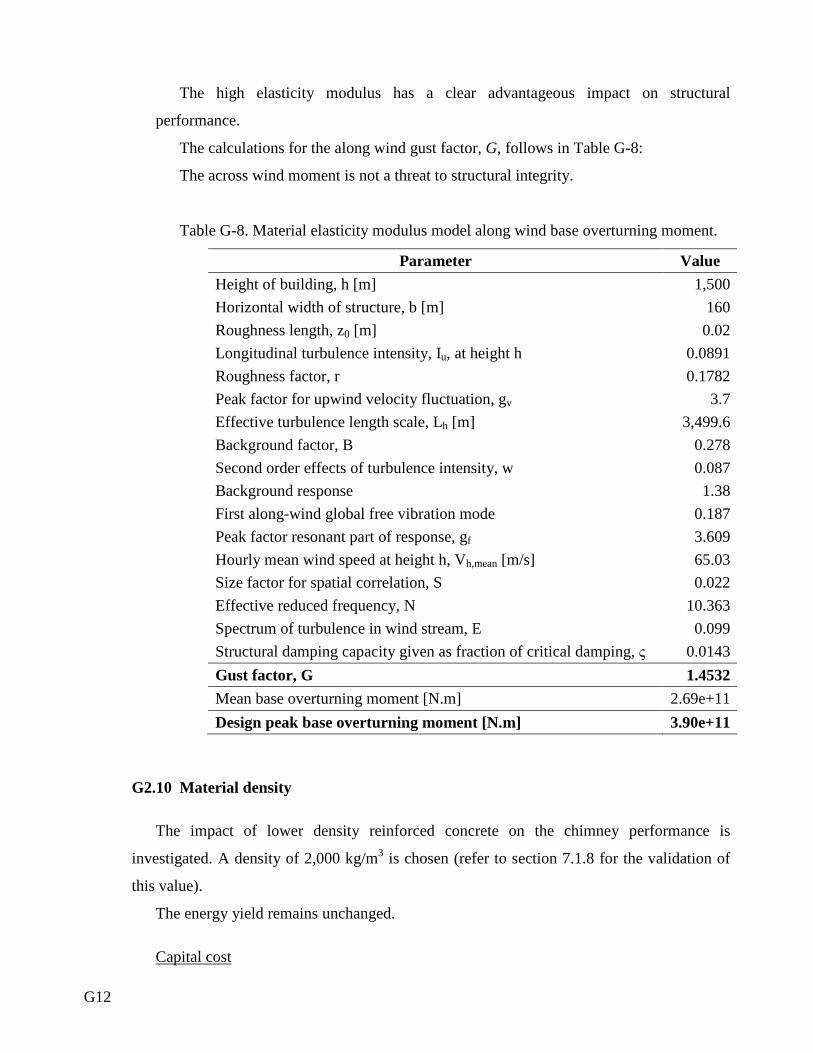
G12
The high elasticity modulus has a clear advantageous impact on structural
performance.
The calculations for the along wind gust factor, G, follows in Table G-8:
The across wind moment is not a threat to structural integrity.
Table G-8. Material elasticity modulus model along wind base overturning moment.
Parameter Value
Height of building, h [m] 1,500
Horizontal width of structure, b [m] 160
Roughness length, z0 [m] 0.02
Longitudinal turbulence intensity, Iu, at height h 0.0891
Roughness factor, r 0.1782
Peak factor for upwind velocity fluctuation, gv 3.7
Effective turbulence length scale, Lh [m] 3,499.6
Background factor, B 0.278
Second order effects of turbulence intensity, w 0.087
Background response 1.38
First along-wind global free vibration mode 0.187
Peak factor resonant part of response, gf 3.609
Hourly mean wind speed at height h, Vh,mean [m/s] 65.03
Size factor for spatial correlation, S 0.022
Effective reduced frequency, N 10.363
Spectrum of turbulence in wind stream, E 0.099
Structural damping capacity given as fraction of critical damping, ς 0.0143
Gust factor, G 1.4532
Mean base overturning moment [N.m] 2.69e+11
Design peak base overturning moment [N.m] 3.90e+11
G2.10 Material density
The impact of lower density reinforced concrete on the chimney performance is
investigated. A density of 2,000 kg/m3 is chosen (refer to section 7.1.8 for the validation of
this value).
The energy yield remains unchanged.
Capital cost

G13
Data was not available within resources allocated to quantify the changes in costs due
to an increase or decrease in concrete density. The cost is therefore assumed to stay
constant at R27.70Bn bearing in mind that lower density material available on site may
decrease costs. A lower limit LEC of R8.648/kWh is assumed.
Structural performance
The buckling analysis yields a first global buckling value of λ1 = 1.62 that is close to
that of the reference case. It remains localised to the upper regions of the shell.
The free vibration analysis yields the first global free vibration frequency of f1,global =
0.148 Hz. No second global free vibration modes are present in the smaller than 0.2 Hz
spectrum. Some more localised ovallising modes are present at f1,local = 0.142 and f2,local =
0.246 Hz. The higher first global free vibration frequency is due to lower mass
concentration in the upper parts of the chimney.
The calculations for the along wind gust factor, G, follows in Table G-9.
The across wind moment is not a threat to structural integrity.
Table G-9. Calculated values for the along wind base overturning moment of the
material density model.
Parameter Value
Height of building, h [m] 1,500
Horizontal width of structure, b [m] 160
Roughness length, z0 [m] 0.02
Longitudinal turbulence intensity, Iu, at height h 0.0891
Roughness factor, r 0.1782
Peak factor for upwind velocity fluctuation, gv 3.7
Effective turbulence length scale, Lh [m] 3,499.6
Background factor, B 0.278
Second order effects of turbulence intensity, w 0.087
Background response 1.38
First along-wind global free vibration mode 0.148
Peak factor resonant part of response, gf 3.543
Hourly mean wind speed at height h, Vh,mean [m/s] 65.03
Size factor for spatial correlation, S 0.031
Effective reduced frequency, N 7.965
Spectrum of turbulence in wind stream, E 0.115

G14
Structural damping capacity given as fraction of critical damping, ς 0.0143
Gust factor, G 1.4933
Mean base overturning moment [N.m] 2.69e+11
Design peak base overturning moment [N.m] 4.02e+11
G2.11 Internal damping
The reference damping coefficient of the reinforced concrete is 0.0143. The impact of
change in this coefficient on the system is investigated; a critical damping factor of 0.091 is
assumed (refer to section 7.1.8 for the validation of this choice).
The energy yield remains unchanged.
Capital cost
Data was not available within resources allocated to quantify the changes in costs due
to an increase or decrease in concrete internal damping. However, higher damping
presumably will incur higher costs. The reference cost is therefore assumed to be a lower
limit at R27.70Bn. A lower limit LEC of R8.648/kWh is assumed.
Structural performance
The buckling and free vibration behaviour is identical to that of the reference case.
The calculations for the along wind gust factor, G, follows in Table G-10.
The across wind moment is not a threat to structural integrity.
Table G-10. Calculated values for the along wind base overturning moment of the
material internal damping model.
Parameter Value
Height of building, h [m] 1,500
Horizontal width of structure, b [m] 160
Roughness length, z0 [m] 0.02
Longitudinal turbulence intensity, Iu, at height h 0.0891
Roughness factor, r 0.1782
Peak factor for upwind velocity fluctuation, gv 3.7
Effective turbulence length scale, Lh [m] 3,499.6
Background factor, B 0.278

G15
Second order effects of turbulence intensity, w 0.087
Background response 1.38
First along-wind global free vibration mode 0.135
Peak factor resonant part of response, gf 3.517
Hourly mean wind speed at height h, Vh,mean [m/s] 65.03
Size factor for spatial correlation, S 0.036
Effective reduced frequency, N 7.265
Spectrum of turbulence in wind stream, E 0.121
Structural damping capacity given as fraction of critical damping, ς 0.0191
Gust factor, G 1.4826
Mean base overturning moment [N.m] 2.69e+11
Design peak base overturning moment [N.m] 3.99e+11
G2.12 Cable based stabilisation
The accurate modeling of cable-stayed chimney behaviour remains to be investigated.
The robust model produced a first global frequency of 0.2547 Hz. The applicability of
analytical frequency response methods needs to be determined.
G2.13 Parabolic hyperboloid geometry
Energy yield
The complexity of the geometry can not readily be incorporated in the thermo-flow
simulation model. The reference case energy yield is considered to be a lower limit based
on the following:
• The more gradual gradient from horisontal to vertical flow of the hyperboloid
shape could constitute a decrease in associated losses;
• The larger base diameter increases the perimeter for utilisation as support; and
• Through-flow area could also constitute smaller losses due to changes in through-
flow and flow direction area.
Capital cost
An increase in reinforcement amount is incorporated in the cost model by changing
the reinforcement cost from R1,000 to R1,200 per cubic meter. The labour cost absorbs
all increases in construction cost due to the more complex geometry by increasing from

G16
R2,000 to R2,500 per cubic meter. The cost of the hyperboloid geometry chimney is
significantly less than that of the fin-stiffened structure, with a decrease of more than
three times from R 27.70Bn to R9.10Bn. The cost breakdown follows in Table G-11. An
upper limit LEC of R3.756/kWh is calculated.
Table G-11. Parabolic hyperboloid geometry model cost breakdown.
Volume [m3] Unit cost [R/m3] Cost Chimney 865,750 9,200 R 7,964,900,000 Columns 59,417 9,200 R 546,639,911
Foundation 129,600 4,300 R 557,280,000 Circumferential
stiffeners 1,326 14,500 R 19,223,581
R 9,088,043,492
Structural performance
The buckling analysis yields a first global buckling value of λ1 = 1.63. This value is
the same as for the reference case because the buckling is not of the cantilever type, but is
localised to the upper regions of the shell, presumably due to the relatively thin wall
thickness.
The free vibration analysis yields the first global free vibration frequency for f1,global =
0.115 Hz. No second global free vibration modes are present in the smaller than 0.2 Hz
spectrum. Some more localised ovallising modes are present at f1,local = 0.128 and f2,local =
0.224 Hz. The hyperboloid shape weakened the chimney against global vibration.
The geometrical change is located in the chimney base. For this study it is assumed
that the frequency response method may be used but in future more detailed
investigations should adapt the method for this geometry.
The calculations for the along wind gust factor, G, follows in Table G-12.
Note that although the base of the chimney is 480 meter wide and not only 160 meter,
the 160 meter value is used as a width parameter. The yielded gust factor must, from this
perspective, be considered as an upper limit.
The across wind moment is not a threat to structural integrity, although close to the
critical velocity – Figure G-5.

G17
Table G-12. Calculated values for the along wind base overturning moment of the
parabolic hyperboloid geometry model.
Parameter Value
Height of building, h [m] 1,500
Horizontal width of structure, b [m] 160+
Roughness length, z0 [m] 0.02
Longitudinal turbulence intensity, Iu, at height h 0.0891
Roughness factor, r 0.1782
Peak factor for upwind velocity fluctuation, gv 3.7
Effective turbulence length scale, Lh [m] 3,499.6
Background factor, B 0.278
Second order effects of turbulence intensity, w 0.087
Background response 1.38
First along-wind global free vibration mode 0.115
Peak factor resonant part of response, gf 3.472
Hourly mean wind speed at height h, Vh,mean [m/s] 65.03
Size factor for spatial correlation, S 0.046
Effective reduced frequency, N 6.189
Spectrum of turbulence in wind stream, E 0.134
Structural damping capacity given as fraction of critical damping, ς 0.0143
Gust factor, G 1.553
Mean base overturning moment [N.m] 2.69e+11
Design peak base overturning moment [N.m] 4.17e+11
G2.14 Chimney diameter
Energy yield
The concept with increased diameter yields 317.75 GWh/y. This is an increase of
4.10%.
Capital cost
An increase in reinforcement amount for the chimney shell is incorporated in the cost
model to accommodate for higher circumferential moments by changing the
reinforcement cost from R1,000 to R1,200 per cubic meter. Foundation volume is
expanded by 5% in accordance with the chimney and fin weight increase. The cost of the

G18
200 meter diameter chimney increases with 2.3% from R 27.70Bn to R28.96Bn. The cost
breakdown follows in Table G-13. A LEC of R8.619/kWh is calculated.
0
200
400
600
800
1000
1200
1400
1600
50 60 70 80 90 100 110 120
Wind velocity [m/s]
Hei
gh
t [m
]
wind velocity profile
critical wind velocity profile
Figure G-5. Proximity of wind velocity profile to critical velocities – parabolic
hyperboloid geometry model.
Table G-13. Increased chimney diameter model cost breakdown.
Volume [m3] Unit cost [R/m3] Cost Chimney 700,117 8,700 R 6,163,991,220
Fins 2,609,641 8,500 R 22,181,949,017 Foundation 162,000 4,600 R 588,240,000
Circumferential stiffeners 1,657 14,500 R 24,028,041
R 28,958,208,278
Structural performance
The buckling analysis yields a first global buckling value of λ1 = 1.11. The decrease
in buckling factor is due to the decrease in circumferential stiffness. It remains localised
to the upper regions of the shell.
The free vibration analysis yields the first global free vibration frequency for f1,global =
0.163 Hz. No second global free vibration modes are present in the smaller than 0.2 Hz

G19
spectrum. Some more localised ovallising modes are present at f1,local = 0.112, f2,local =
0.181 and f3,local = 0.252 Hz. The larger diameter and, hence, cross sectional resistance
against global bending, stiffened the chimney against global vibration.
The calculations for the along wind gust factor, G, follows in Table G-14:
Table G-14. Calculated values for the along wind base overturning moment of the
increased chimney diameter model.
Parameter Value
Height of building, h [m] 1,500
Horizontal width of structure, b [m] 200
Roughness length, z0 [m] 0.02
Longitudinal turbulence intensity, Iu, at height h 0.0891
Roughness factor, r 0.1782
Peak factor for upwind velocity fluctuation, gv 3.7
Effective turbulence length scale, Lh [m] 3,499.6
Background factor, B 0.277
Second order effects of turbulence intensity, w 0.087
Background response 1.38
First along-wind global free vibration mode 0.163
Peak factor resonant part of response, gf 3.571
Hourly mean wind speed at height h, Vh,mean [m/s] 65.03
Size factor for spatial correlation, S 0.024
Effective reduced frequency, N 8.772
Spectrum of turbulence in wind stream, E 0.108
Structural damping capacity given as fraction of critical damping, ς 0.0143
Gust factor, G 1.4626
Mean base overturning moment [N.m] 3.38e+11
Design peak base overturning moment [N.m] 4.94e+11
The across wind moment is not a threat to structural integrity.
G2.15 Number of circumferential stiffeners
Energy yield
The added flow resistance brought about by the five additional braces has a slight impact on the energy yield: the energy yield decreases by 0.3% to approximately 304.12 GWh/y.

G20
Capital cost
The cost model configuration remains the same as for the reference case. The cost of
the chimney increases by approximately 0.05% from R 27.70Bn to R27.72Bn. Table G-
15 reports the cost breakdown. A LEC of R8.678/kWh is calculated.
Table G-15. Number of circumferential stiffeners model cost breakdown.
Volume [m3] Unit cost [R/m3] Cost Chimney 581,635 8,500 R 4,943,901,288
Fins 2,609,641 8,500 R 22,181,949,017 Foundation 129,600 4,300 R 557,280,000
Circumferential stiffeners 1,326 14,500 R 35,008,861
R 27,718,139,165
Structural performance
Buckling factors are higher than for the reference case, the first global buckling value
of λ1 = 2.70, displaying semi-localised buckling in the upper region of the chimney. This
indicates the influence of circumferential stiffeners to mitigate buckling modes.
The first global free vibration frequency for f1,global = 0.135 Hz. No second global free
vibration modes are present in the smaller than 0.2 Hz spectrum. Some more localised
ovallising modes are present at f1,local = 0.131 and f2,local = 0.231 Hz.
The along wind gust factor, G, is the same as for the reference case. Across wind
resonance does not pose a threat to structural integrity.
G2.16 Wall thickness re-configuration
It is assumed that the wall thickness changes do not impact energy yield with the inner
diameter remaining constant over height.
Capital cost
The cost model configuration remains the same as for the reference case. The
foundation costs are decreased in accordance with chimney volume decrease. The cost of
the chimney decreases by approximately 5.6% from R 27.70Bn to R26.21Bn. Table G-16
reports the cost breakdown. A LEC of R8.284/kWh is calculated.

G21
Table G-16. Re-configured wall thickness model cost breakdown.
Volume [m3] Unit cost [R/m3] Cost Chimney 410,901 8,500 R 3,492,658,667
Fins 2,609,641 8,500 R 22,181,949,017 Foundation 162,000 4,300 R 527,465,241
Circumferential stiffeners 1,657 14,500 R 19,223,581
R 26,221,296,505
Structural performance
The increased wall thickness in the upper regions of the chimney has a significant
effect on the buckling behaviour. Buckling factors are significantly higher than for the
reference case, the first global buckling value being λ1 = 3.74. The location of the
buckling is in the lower regions of the chimney shell, see Figure G-6. It is concluded that
the increased wall thickness has a significant effect in mitigating the semi-localised
buckling modes in the upper parts of the shell.
Figure G-6. Shell buckling in the lower regions of the chimney with re-configured wall
thickness.

G22
The increased wall thickness in the upper regions concentrates more mass in these
parts of the structure which predicts lower global natural frequencies: the first global free
vibration frequency of f1,global = 0.097 Hz. No second global free vibration modes are
present in the smaller than 0.2 Hz spectrum. Some more localised ovallising modes are
present at f1,local = 0.129 and f2,local = 0.237 Hz.
The calculations for the along wind gust factor, G, follows in Table G-17:
Table G-17. Calculated values for the along wind base overturning moment of the re-
configured wall thickness model.
Parameter Value
Height of building, h [m] 1,500
Horizontal width of structure, b [m] 160
Roughness length, z0 [m] 0.02
Longitudinal turbulence intensity, Iu, at height h 0.0891
Roughness factor, r 0.1782
Peak factor for upwind velocity fluctuation, gv 3.7
Effective turbulence length scale, Lh [m] 3,499.64
Background factor, B 0.278
Second order effects of turbulence intensity, w 0.087
Background response 1.38
First along-wind global free vibration mode 0.097
Peak factor resonant part of response, gf 3.422
Hourly mean wind speed at height h, Vh,mean [m/s] 65.03
Size factor for spatial correlation, S 0.058
Effective reduced frequency, N 5.225
Spectrum of turbulence in wind stream, E 0.147
Structural damping capacity given as fraction of critical damping, ς 0.0143
Gust factor, G 1.6034
Mean base overturning moment [N.m] 2.69e+11
Design peak base overturning moment [N.m] 4.31e+11
Figure G-6 depicts the critical wind velocities (lock-in) as well inside the peak
velocity profile over most of the structural height. The across wind resonance could pose
a threat to structural integrity. The across wind overturning moment is calculated in Table
G-18.

G23
0
200
400
600
800
1000
1200
1400
1600
50 60 70 80 90 100 110 120
Wind velocity [m/s]
Hei
gh
t [m
]
wind velocity profile
critical wind velocity profile
Figure G-6. Proximity of wind velocity profile to critical velocities – model with re-
configured wall thickness.
Table G-18. Calculated values for the across wind base overturning moment of the re-
configured wall thickness model.
Parameter Value
Fundamental mode frequency in cross wind direction, nc [Hz] 0.097
Peak factor, gf 3.422
Width of structure, b [m] 160
Height of structure, h [m] 1,500
Hourly mean dynamic wind pressure 1,980.06
Mode shape power exponent, k 2.4
Hourly mean wind speed, Udesign hourly mean, h [m/s] 65.03
Ratio Udesign hourly mean, h /(nc·b) 4.19
Cross wind force spectrum coefficient, Cfs 0.00175
Structural damping capacity given as fraction of critical damping, ς 0.0143
Design across peak base overturning moment [N.m] 7.03e+11
Across resonance peak factor on base overturning moment 2.611

G24
G2.17 External damping devices
This study does not engage the complex field of external damping due to resource
constraints, but notes it as a possibly critical measure in mitigating resonant response in the
SCPP chimney at little or no additional energy loss and small capital expenditure.
G2.18 Manipulation of wind-structure interaction: circumferential pressure
distribution
Energy yield
The inner volume of the chimney remains the same as for the reference case; hence
the energy yield remains unchanged.
Capital cost
A lower limit cost is calculated for an inflated membrane concept generating the
Saguaro geometry. This comprises the appropriate area of membrane assumed to cost
approximately R100/m2 including material, construction, fastening and inflation. This is
based on 45 membrane spikes along the chimney circumference protruding 11.2 meters.
Thus, the lower limit cost is estimated at R27.83Bn which represents a 0.47% increase.
Table G-19 breaks down the costs. A lower limit LEC of R8.682/kWh is calculated.
Table G-19. Saguaro geometry model modulus model cost breakdown.
Volume [m3] Unit cost [R/m3] Cost Chimney 581,635 8,500 R 4,943,901,288
Fins 2,609,641 8,500 R 22,181,949,017 Foundation 129,600 4,600 R 557,280,000
Circumferential stiffeners 1,326 14,500 R 19,223,581
Inflated membrane 1,295,334 m2 R100/m2 R 129,553,392 R 27,831,887,277
Structural performance
Buckling factors are higher than for the reference case, the first global buckling value
of λ1 = 1.92, a net improvement with the favourable circumferential pressure distribution,
but higher overall load area. Note again that this serves as the lower limit because the

G25
Saguaro geometry does not have any structural capacity in the model analysed. The free
vibration frequencies are also assumed to be the same as for the reference case without
the structural stiffening.
The calculations for the along wind gust factor, G, follows in Table G-20. Although
the gust factor is of similar order to that of the reference case, the overturning moment is
significantly higher due to the effective increase of the chimney width.
Table G-20. Calculated values for the along wind base overturning moment of the
Saguaro geometry model.
Parameter Value
Height of building, h [m] 1,500
Horizontal width of structure, b [m] 182.4
Roughness length, z0 [m] 0.02
Longitudinal turbulence intensity, Iu, at height h 0.0891
Roughness factor, r 0.1782
Peak factor for upwind velocity fluctuation, gv 3.7
Effective turbulence length scale, Lh [m] 3,499.64
Background factor, B 0.277
Second order effects of turbulence intensity, w 0.087
Background response 1.38
First along-wind global free vibration mode 0.135
Peak factor resonant part of response, gf 3.517
Hourly mean wind speed at height h, Vh,mean [m/s] 65.03
Size factor for spatial correlation, S 0.033
Effective reduced frequency, N 7.265
Spectrum of turbulence in wind stream, E 0.121
Structural damping capacity given as fraction of critical damping, ς 0.0143
Gust factor, G 1.504
Mean base overturning moment [N.m] 3.08e+11
Design peak base overturning moment [N.m] 4.64e+11
The lock-in range is well outside the peak velocity profile over all of the structural height.
Across wind resonance does not pose a threat to structural integrity.

G26
G2.19 Directional design
An investigation must be performed to determine the feasibility of this design approach
with regards to decreasing material volumes (hence, capital cost) while not compromising
structural integrity. This prospect is not investigated further due to resource constraints.
G2.20 Heightened chimney
Energy yield
The increased chimney height concept yields 355.93 GWh/y; an increase of 16.7%.
Capital cost
The cost model configuration remains similar to the reference case model. The cost of
the 1,720 meter height chimney increases 1% from R 27.70Bn to R28.07Bn. Table G-21
reports the cost breakdown. A LEC of R7.485/kWh is calculated.
Table G-21. Increase chimney height model cost breakdown.
Volume [m3] Unit cost [R/m3] Cost Chimney 615,661 8,500 R 5,233,116,622
Fins 2,609,641 8,500 R 22,181,949,017 Foundation 162,000 4,600 R 589,602,240
Circumferential stiffeners 1,657 14,500 R 22,380,637
R 28,027,048,515
Structural performance
The buckling analysis yields a first global buckling value of λ1 = 1.53, slightly lower
than the value of 1.63 calculated for the reference case. It remains localised to the upper
regions of the shell.
The free vibration analysis yields the first global free vibration frequencies for f1,global
= 0.094 Hz – the additional slenderness resulting in a lower global free vibration
frequency. No second global free vibration modes are present in the smaller than 0.2 Hz
spectrum. Some more localised ovallising modes are present at f1,local = 0.108, f2,local =
0.193 and f3,local = 0.241 Hz.
The calculations for the along wind gust factor, G, follows in Table G-22.

G27
Table G-22. Calculated values for the along wind base overturning moment of the
increased chimney height model.
Parameter Value
Height of building, h [m] 1,720
Horizontal width of structure, b [m] 160
Roughness length, z0 [m] 0.02
Longitudinal turbulence intensity, Iu, at height h 0.0880
Roughness factor, r 0.1760
Peak factor for upwind velocity fluctuation, gv 3.7
Effective turbulence length scale, Lh [m] 3,621.45
Background factor, B 0.258
Second order effects of turbulence intensity, w 0.083
Background response 1.36
First along-wind global free vibration mode 0.094
Peak factor resonant part of response, gf 3.411
Hourly mean wind speed at height h, Vh,mean [m/s] 66.65
Size factor for spatial correlation, S 0.056
Effective reduced frequency, N 5.080
Spectrum of turbulence in wind stream, E 0.149
Structural damping capacity given as fraction of critical damping, ς 0.0143
Gust factor, G 1.582
Mean base overturning moment [N.m] 3.62e+11
Design peak base overturning moment [N.m] 5.72e+11
The across wind moment is a threat to structural integrity. Figure G-7 depicts the lock-in
range well inside the peak velocity profile over most of the structural height.
The across wind moment calculation is determined as formulated earlier and tabulated in
Table G-23:

G28
0
200
400
600
800
1000
1200
1400
1600
50 60 70 80 90 100 110
Wind velocity [m/s]
Hei
gh
t [m
]
wind velocity profile
critical wind velocity profile
Figure G-7. Proximity of wind velocity profile to critical velocities – increased chimney
height.
Table G-23. Calculated values for the across wind base overturning moment of the
increased chimney height model.
Parameter Value
Fundamental mode frequency in cross wind direction, nc [Hz] 0.094
Peak factor, gf 3.411
Width of structure, b [m] 160
Height of structure, h [m] 1,720
Hourly mean dynamic wind pressure 2,033.66
Mode shape power exponent, k 2.4
Hourly mean wind speed, Udesign hourly mean, h [m/s] 66.65
Ratio Udesign hourly mean, h /(nc·b) 4.46
Cross wind force spectrum coefficient, Cfs 0.002
Structural damping capacity given as fraction of critical damping, ς 0.0143
Design across peak base overturning moment [N.m] 9.97e+11
Across resonance peak factor on base overturning moment 2.755

G29
G2.21 Terrain surface roughness
The energy yield and capital cost remain unchanged.
Structural performance
The buckling analysis yields a higher first global buckling value of λ1 = 1.832 due to
the lower peak wind velocities.
The free vibration remains the same. The along wind gust factor, G, is calculated in
Table G-24.
Table G-24. Calculated values for the along wind base overturning moment of the
terrain surface roughness model.
Parameter Value
Height of building, h [m] 1,500
Horizontal width of structure, b [m] 160
Roughness length, z0 [m] 0.01
Longitudinal turbulence intensity, Iu, at height h 0.0839
Roughness factor, r 0.1678
Peak factor for upwind velocity fluctuation, gv 3.7
Effective turbulence length scale, Lh [m] 3,499.6
Background factor, B 0.278
Second order effects of turbulence intensity, w 0.082
Background response 1.35
First along-wind global free vibration mode 0.135
Peak factor resonant part of response, gf 3.517
Hourly mean wind speed at height h, Vh,mean [m/s] 62.33
Size factor for spatial correlation, S 0.034
Effective reduced frequency, N 7.580
Spectrum of turbulence in wind stream, E 0.118
Structural damping capacity given as fraction of critical damping, ς 0.0143
Gust factor, G 1.472
Mean base overturning moment [N.m] 2.22e+11
Design peak base overturning moment [N.m] 3.26e+11
The across wind moment is not a threat to structural integrity.

G30
G3 Aggregated data
The system performance data is aggregated into Table G-25. Clear blocks indicate when,
within the assumptions made and degree of augmentation chosen, the evaluation model delivered
a conclusive result. A yellow block indicates lower limit values, a turquoise block indicates an
upper limit value and a grey block indicates rough estimation of quantitative data.
The normalised values are reported in Table G-26. Note that the reciprocal values of LEC
and dynamic response criteria are presented in order for a “positive” score to imply positive
implication for system performance.
Note that the frequency response factors often exceed the ideally required value and in cases
has a very adverse impact on the system.
Table G-25. Summary of performance data for all alternatives.
Alternative Levelised Electricity
Cost
Buckling factor
Dynamic response
factor Reference R 8.65 1.63 1.513 Wind velocity extrapolation R 8.65 2.69 1.464 Flaring chimney exit R 8.42 0.68 1.518 Circumferential stiffener concept R 8.63 1.18 1.513 Material elasticity modulus R 9.18 3.26 1.453 Material density R 8.65 1.62 1.493 Internal damping R 8.65 1.63 1.483 Parabolic hyperboloid geometry R 3.76 1.63 1.553 Chimney diameter R 8.62 1.11 1.463 Number of circumferential stiffeners R 8.68 2.70 1.513 Wall thickness re-configuration R 8.28 3.74 2.611 Saguaro geometry R 8.68 1.92 1.504 Heightened chimney R 7.49 1.53 2.755 Terrain surface roughness R 8.65 1.83 1.472
Radical goal R 1.00 5.00 1.500
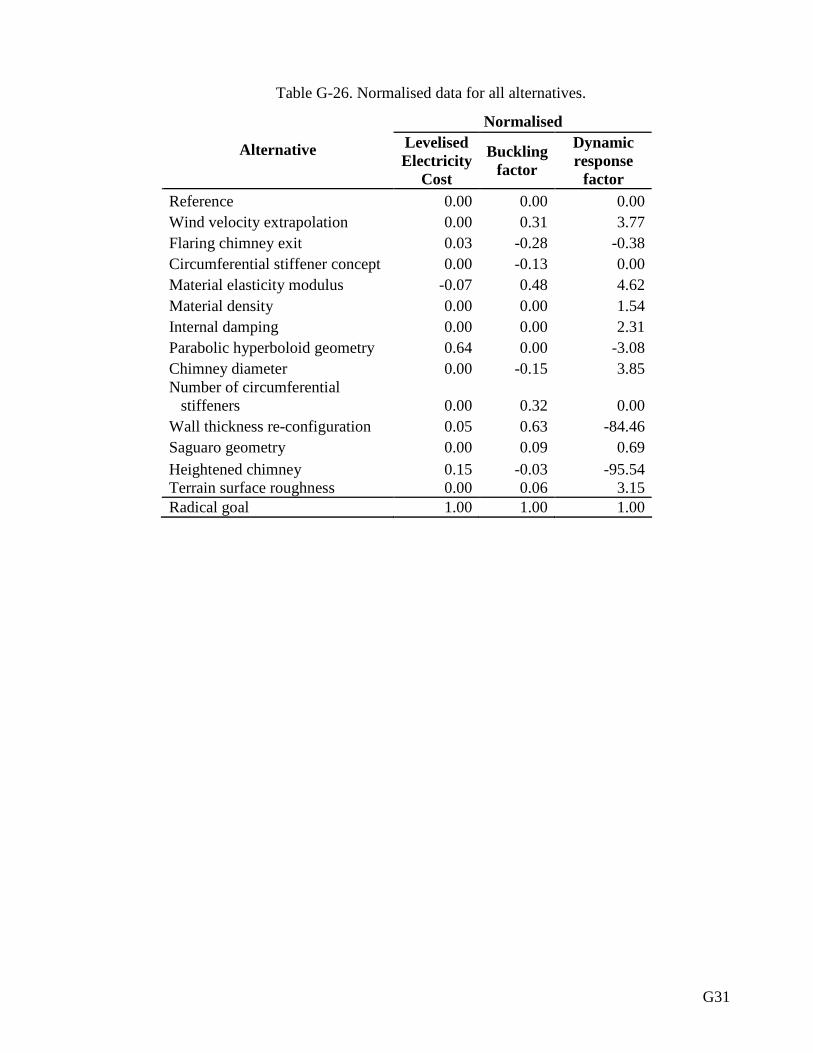
G31
Table G-26. Normalised data for all alternatives.
Normalised
Alternative Levelised Electricity
Cost
Buckling factor
Dynamic response
factor Reference 0.00 0.00 0.00 Wind velocity extrapolation 0.00 0.31 3.77 Flaring chimney exit 0.03 -0.28 -0.38 Circumferential stiffener concept 0.00 -0.13 0.00 Material elasticity modulus -0.07 0.48 4.62 Material density 0.00 0.00 1.54 Internal damping 0.00 0.00 2.31 Parabolic hyperboloid geometry 0.64 0.00 -3.08 Chimney diameter 0.00 -0.15 3.85 Number of circumferential
stiffeners 0.00 0.32 0.00 Wall thickness re-configuration 0.05 0.63 -84.46 Saguaro geometry 0.00 0.09 0.69 Heightened chimney 0.15 -0.03 -95.54 Terrain surface roughness 0.00 0.06 3.15 Radical goal 1.00 1.00 1.00

G32

H1
APPENDIX H
CRITICAL EVALUATION OF US
SCPP R&D
H1 Cascade of technological trends
H1.1 Recap of the cascade of technological trends
The cascade of technological trends presented in section 3.6.2 presents a normative
pattern for technological development. To recap briefly, technological change occurs through
consecutive levels from;
• Level 1: material characteristics (function and structure),
• Level 2: system size, structure and operating principle,
• Level 3: performance
• Level 4: cost decrease and improvement in safety, health and environmental (SHE)
impact, and, finally,
• Level 5: the diffusion of technology into the landscape.
H1.2 US SCPP research cascade levels
The research performed on the SCPP over ten years at the US covered several levels
predicted by the cascade as follows, in order of occurrence:
• Thermo dynamics covered
o the mathematical description of the thermo dynamic performance, i.e. Level 3
o innovative solutions to improve the operating principle, i.e. Level 2
o cost decrease, i.e. Level 4
o market dictated system re-configuration/conceptualisation, i.e. Level 5
• Flow dynamics covered
o the mathematical description of the flow performance, i.e. Level 3

H2
o innovative solutions to improve the operating principle, i.e. Level 2
o cost decrease, i.e. Level 4
• Structural engineering covered
o material characteristics, i.e. Level 1
o the structural operating principle and system size, i.e. Level 2
o structural performance, i.e. Level 3
o cost decrease and reliability, i.e. Level 4
o market (cost) dictated technology conceptualisation, i.e. Level 5
• Environmental investigation covered
o Environmental Impact Assessment, i.e. Level 4
• Economic investigation covered
o cost model describing all cost inputs on conceptual level, i.e. Level 3
The process of technological development perceived in the SCPP project at the US
comprised of the cascade levels in Table H-1. Table H-2 portrays the flow of technology
development at the US over the period of its R&D.
Table H-1. US research in terms of technology development cascade levels.
Field
Date Thermo- dynamics
Flow- dynamics
Structural Environment Economic
1997 2 2 1998 2 2 1999 2 2 2000 2 2/3 2001 2/3 2/3 1/2/3 2002 2/3 2/3 2/3 2003 2/4 2/3 3 2004 3 2/3 2/3/4 4 2005 2/3 2/3 2/3/4 2006 2/3 2/3/4 4 2007 3/4/5 2/3/4/5

H3
Table H-2. Involvement in cascade levels over the 10 year US research program.
Date Level 1 Level 2 Level 3 Level 4 Level 5 1997 1998 1999 2000 2001 2002 2003 2004 2005 2006 2007
Table H-3. Involvement in cascade levels over the 7 year US-ISE research program.
Date Level 1 Level 2 Level 3 Level 4 Level 5 2001 2002 2003 2004 2005 2006 2007
H1.3 Discussion
The research methodology followed at the US first aimed to describe the operating
principles of the SCPP thermo- and flow-dynamical cycles in order to understand the
capabilities and limitations of the system before venturing into material, system size,
structure, performance and the cost, SHE and diffusion developments.
The stepwise venturing into higher cascade level research as the project progresses is
noteworthy from Figure H-2. Future research must be directed to focus on the higher cascade
levels, thus cost decrease, improvement of safety and environmental impact and market
diffusion. This confirms the fact that the thermo- and flow-dynamical fields are at this stage
already well described, with the structural field progressively growing toward the same status
(Figure H3). Subsequent technological development must focus on the optimisation
(performance and cost) and SHE aspects and eventually diffuse the product into the market
through developing business plans and addressing specific local and global market needs to
draw investors.

H4
Further, the structural R&D was spread out over several cascade levels, mostly Levels 2
to 4. This may indicate the inability to decouple cascade levels in structural research or the
definition of research topics without a governing, directing system and technology
perspective, covering too wide a scope of subject matter.
H2 Efficiency of structural SCPP chimney research
Table H-4 portrays the historic progress of R&D on the SCPP chimney at the US-ISE. Table
H-5 depicts how this could be optimised while utilising the same resources, thereby performing
early systems based research to identify critical issues in the radical innovation. Resources are
allocated to first complete critical issues – the red dashed line indicates the stage when the most
critical research topics (as identified without the comprehensive perspective of a systems based
investigation) could have been completed (with the exception of the foundation structure).
Table H-4. Historic breakdown of R&D allocation.

H5
Table H-5. Optimised breakdown of R&D allocation.

H6

I1
APPENDIX I
MODEL OF SYNTHESISED TOP
TECHNOLOGIES
I1 Results of the model of synthesised top technologies
Four of the top technologies (section 9.2.2) are incorporated into the first iteration reference
case. The results are reported here. The wall thickness re-configuration, as formulated in section
7.1.13, is included in combination with the parabolic hyperboloid geometry (section 7.1.10), the
addition of the five additional circumferential stiffeners (section 7.1.12) and the ultra-high
strength performance concrete (section 7.1.8) (a modulus of elasticity at 60 GPa was chosen in
the latter case).
Energy yield
The only geometrical changes in the synthesised model are the parabolic hyperboloid
geometry, the re-configuration of the wall thickness and the addition of circumferential
stiffeners. Of these, the parabolic hyperboloid geometry and the stiffeners have an impact
on energy yield. The energy yield has a slightly decreased lower limit than that of the
parabolic hyperboloid system of section 7.1.10 due to the presence of the additional
circumferential stiffeners, at 304.13 GWh/y which is approximately 0.3% lower than that
of the reference case.
Capital cost
The concrete material cost is increased by four times to a value of R4,000/m3
(validation of this value was stated in Appendix G2.9). Labour and plant costs are
increased by 50%. The capital costs are reduced from R27.70Bn to R8.55Bn resulting in
a LEC of R3.627/kWh.
The cost breakdown follows in Table I-1.

I2
Table I-1. Epilogue model cost breakdown.
Volume [m3] Unit cost [R/m3] Cost Chimney 604,144 12,000 R 7,249,733,155 Columns 2,609,641 12,000 R 713,008,580
Foundation 129,600 4,300 R 557,280,000 Circumferential
stiffeners 1,326 14,500 R 35,008,861
R 8,555,030,595
Structural performance
The critical buckling factor surpassed the ‘ideal’ 5.0 mark with a first global buckling
mode value of λ1 = 5.75, as is portrayed in Figure I-1. The buckling occurs in the lower
regions of the chimney shell (The upper regions are now more stable due to application
of the mitigating technologies.).
Figure I-1. SCPP chimney updated model first buckling mode.

I3
The free vibration analysis yields the first global free vibration frequencies f1,global =
0.113 Hz. No second global free vibration modes are present in the smaller than 0.2 Hz
spectrum. Some more localised ovallising modes are present at f1,local = 0.128 and f2,local =
0.224 Hz. The free vibration frequency is at 0.113 Hz resulting in a gust load factor
which is almost 4% above that of the reference case but safely outside any critical wind
velocities (The global eigen mode shape portrays typical cantilever bending shape and is
not depicted here.). The calculations for the along wind gust factor, G, follows in Table I-
2:
The parabolic hyperboloid geometrical change is located in the chimney base; for this
study it is assumed that the frequency response method may be used but in future more
detailed investigations should adapt the method for this geometry.
Table I-2. Calculated values for the along wind base overturning moment of the
model of synthesised top technologies.
Parameter Value
Height of building, h [m] 1,500
Horizontal width of structure, b [m] 160+
Roughness length, z0 [m] 0.02
Longitudinal turbulence intensity, Iu, at height h 0.0891
Roughness factor, r 0.1782
Peak factor for upwind velocity fluctuation, gv 3.7
Effective turbulence length scale, Lh [m] 3,499.6
Background factor, B 0.278
Second order effects of turbulence intensity, w 0.087
Background response 1.38
First along-wind global free vibration frequency [Hz] 0.113
Peak factor resonant part of response, gf 3.467
Hourly mean wind speed at height h, Vh,mean [m/s] 65.03
Size factor for spatial correlation, S 0.047
Effective reduced frequency, N 6.081
Spectrum of turbulence in wind stream, E 0.135
Structural damping capacity given as fraction of critical damping, ς 0.0143
Gust factor, G 1.558
Mean base overturning moment [N.m] 2.69e+11
Design peak base overturning moment [N.m] 4.19e+11

I4
Note that although the base of the chimney is 480 meter wide and not only 160 meter,
the 160 meter value is used as a width parameter. The yielded gust factor must, from this
perspective, be considered upper limit.
The across wind moment is not a threat to structural integrity, although close to the
critical velocity – Figure I-2.
0
200
400
600
800
1000
1200
1400
1600
50 60 70 80 90 100 110 120
Wind velocity [m/s]
Hei
gh
t [m
]
wind velocity profile
critical wind velocity profile
Figure I-2. Proximity of wind velocity profile to critical velocities – synthesised
(epilogue) model.

A methodology for radical innovation – illustrated by application to a radical Civil
Engineering structure
THESIS STATEMENT
Radical innovation can be systematised through the synthesis of existing
theory to form a basis for strategic decision making.
DISSERTATION FLOW

GRAPHICAL REPRESENTATION OF THE RADICAL INNOVATION METHODLOGY
RADICAL PERFORMANCE REQUIREMENTS FOR THE CHIMNEY
GENERAL:
Clean, non oil-using, cost-effective solutions are sought
CHIMNEY SPECIFIC:
Levelised electricity cost = R1.00/kWh Critical buckling factor = 5.0
Frequency response load factor = 1.50